Patrick Breheny September 6 - University of...
16
The Lasso Fitting lasso models in R/SAS Prostate data The Lasso Patrick Breheny September 6 Patrick Breheny BST 764: Applied Statistical Modeling 1/16
Transcript of Patrick Breheny September 6 - University of...

The LassoFitting lasso models in R/SAS
Prostate data
The Lasso
Patrick Breheny
September 6
Patrick Breheny BST 764: Applied Statistical Modeling 1/16
The LassoFitting lasso models in R/SAS
Prostate data
DefinitionComparison with subset selection and ridge regressionModel fitting and selection of λ
Introduction
As we have seen, ridge regression is capable of reducing thevariability and improving the accuracy of linear regressionmodels, and that these gains are largest in the presence ofmulticollinearity
What ridge regression doesn’t do is variable selection, and itfails to provide a parsimonious model with few parameters
Patrick Breheny BST 764: Applied Statistical Modeling 2/16
The LassoFitting lasso models in R/SAS
Prostate data
DefinitionComparison with subset selection and ridge regressionModel fitting and selection of λ
The lasso
Consider instead a different estimator, which minimizes
1
2
∑i
(yi − xTi β)
2 + λ
p∑j=1
|βj | ,
the only difference from ridge regression being that absolutevalues, instead of squares, are used in the penalty function
The change to the penalty function is subtle, but has adramatic impact on the resulting estimator
Patrick Breheny BST 764: Applied Statistical Modeling 3/16
The LassoFitting lasso models in R/SAS
Prostate data
DefinitionComparison with subset selection and ridge regressionModel fitting and selection of λ
The lasso (cont’d)
Like ridge regression, penalizing the absolute values of thecoefficients introduces shrinkage towards zero
However, unlike ridge regression, some of the coefficients areshrunken all the way to zero; such solutions, with multiplevalues that are identically zero, are said to be sparse
The penalty thereby performs a sort of continuous variableselection
The resulting estimator was thus named the lasso, for “LeastAbsolute Shrinkage and Selection Operator”
Patrick Breheny BST 764: Applied Statistical Modeling 4/16
The LassoFitting lasso models in R/SAS
Prostate data
DefinitionComparison with subset selection and ridge regressionModel fitting and selection of λ
Geometry of ridge vs. lasso
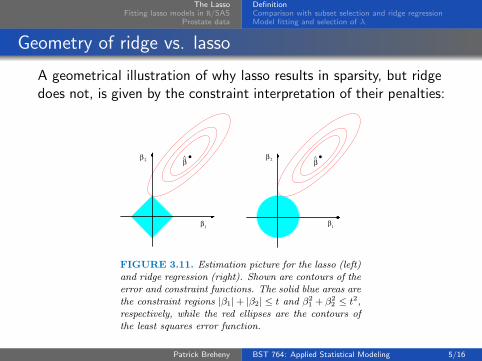
A geometrical illustration of why lasso results in sparsity, but ridgedoes not, is given by the constraint interpretation of their penalties:
Elements of Statistical Learning (2nd Ed.) c©Hastie, Tibshirani & Friedman 2009 Chap 3
β^ β^2. .β
1
β 2
β1β
FIGURE 3.11. Estimation picture for the lasso (left)and ridge regression (right). Shown are contours of theerror and constraint functions. The solid blue areas arethe constraint regions |β1|+ |β2| ≤ t and β2
1 + β22 ≤ t2,
respectively, while the red ellipses are the contours ofthe least squares error function.
Patrick Breheny BST 764: Applied Statistical Modeling 5/16
The LassoFitting lasso models in R/SAS
Prostate data
DefinitionComparison with subset selection and ridge regressionModel fitting and selection of λ
Bayesian perspective
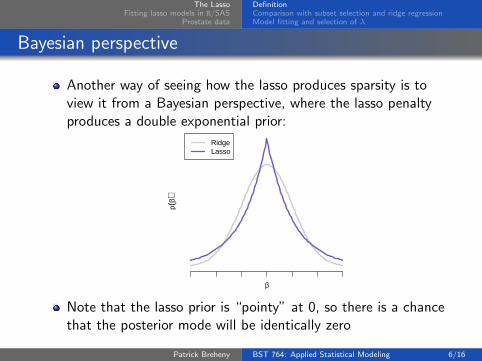
Another way of seeing how the lasso produces sparsity is toview it from a Bayesian perspective, where the lasso penaltyproduces a double exponential prior:
β
p(β)
RidgeLasso
Note that the lasso prior is “pointy” at 0, so there is a chancethat the posterior mode will be identically zero
Patrick Breheny BST 764: Applied Statistical Modeling 6/16

The LassoFitting lasso models in R/SAS
Prostate data
DefinitionComparison with subset selection and ridge regressionModel fitting and selection of λ
Orthonormal Solutions
Because the lasso penalty has the absolute value operation init, the objective function is not differentiable and as a result,lacks a closed form in general
However, in the special case of an orthonormal design matrix,it is possible to obtain closed form solutions for the lasso:βlassoJ = S(βOLS
J , λ), where S, the soft-thresholding operator,is defined as
S(z, λ) =
z − λ if z > λ
0 if |z| ≤ λz + λ if z < −λ
Patrick Breheny BST 764: Applied Statistical Modeling 7/16
The LassoFitting lasso models in R/SAS
Prostate data
DefinitionComparison with subset selection and ridge regressionModel fitting and selection of λ
Hard vs. soft thresholding
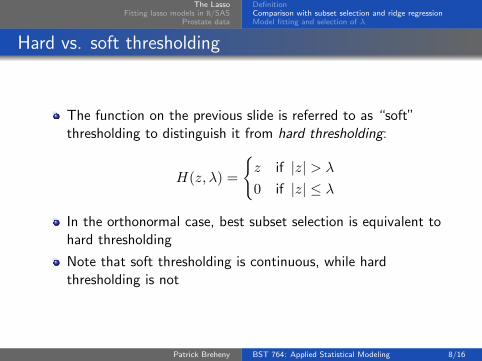
The function on the previous slide is referred to as “soft”thresholding to distinguish it from hard thresholding:
H(z, λ) =
{z if |z| > λ
0 if |z| ≤ λ
In the orthonormal case, best subset selection is equivalent tohard thresholding
Note that soft thresholding is continuous, while hardthresholding is not
Patrick Breheny BST 764: Applied Statistical Modeling 8/16
The LassoFitting lasso models in R/SAS
Prostate data
DefinitionComparison with subset selection and ridge regressionModel fitting and selection of λ
Ridge, lasso, and subset selection in the orthonormal case
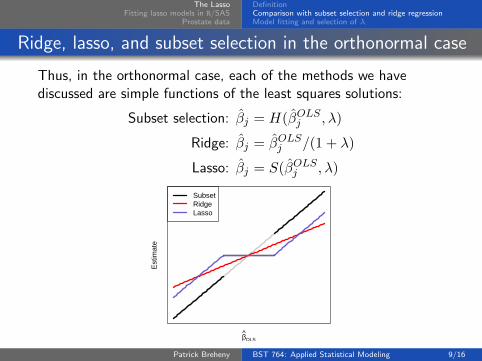
Thus, in the orthonormal case, each of the methods we havediscussed are simple functions of the least squares solutions:
Subset selection: βj = H(βOLSj , λ)
Ridge: βj = βOLSj /(1 + λ)
Lasso: βj = S(βOLSj , λ)
βOLS
Est
imat
e
SubsetRidgeLasso
Patrick Breheny BST 764: Applied Statistical Modeling 9/16
The LassoFitting lasso models in R/SAS
Prostate data
DefinitionComparison with subset selection and ridge regressionModel fitting and selection of λ
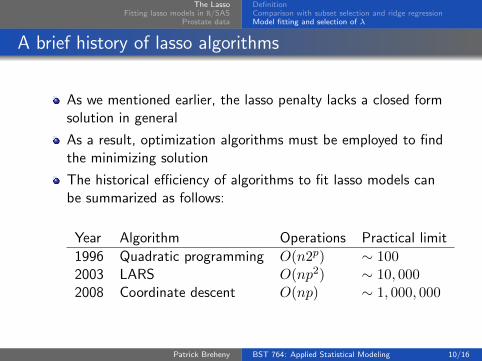
A brief history of lasso algorithms
As we mentioned earlier, the lasso penalty lacks a closed formsolution in general
As a result, optimization algorithms must be employed to findthe minimizing solution
The historical efficiency of algorithms to fit lasso models canbe summarized as follows:
Year Algorithm Operations Practical limit
1996 Quadratic programming O(n2p) ∼ 1002003 LARS O(np2) ∼ 10, 0002008 Coordinate descent O(np) ∼ 1, 000, 000
Patrick Breheny BST 764: Applied Statistical Modeling 10/16
The LassoFitting lasso models in R/SAS
Prostate data
DefinitionComparison with subset selection and ridge regressionModel fitting and selection of λ
Selection of λ
Unlike ridge regression, the lasso is not a linear estimator –there is no matrix H such that y = Hy
Defining the degrees of freedom of the lasso is thereforesomewhat messy
However, a number of arguments can be made that thenumber of nonzero coefficients in the model is a reasonablequantification of the model’s degrees of freedom, and thisquantity can be used in AIC/BIC/GCV to select λ
Other statisticians, however, feel these approximations to beuntrustworthy, and prefer to select λ via cross-validationinstead
Patrick Breheny BST 764: Applied Statistical Modeling 11/16
The LassoFitting lasso models in R/SAS
Prostate data
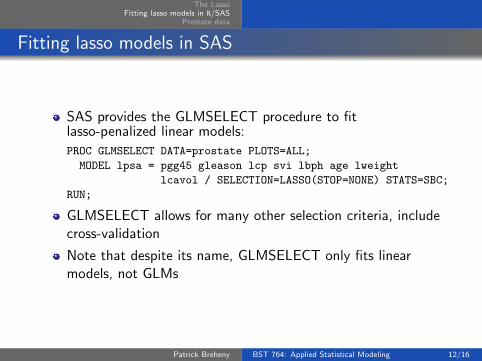
Fitting lasso models in SAS
SAS provides the GLMSELECT procedure to fitlasso-penalized linear models:
PROC GLMSELECT DATA=prostate PLOTS=ALL;
MODEL lpsa = pgg45 gleason lcp svi lbph age lweight
lcavol / SELECTION=LASSO(STOP=NONE) STATS=SBC;
RUN;
GLMSELECT allows for many other selection criteria, includecross-validation
Note that despite its name, GLMSELECT only fits linearmodels, not GLMs
Patrick Breheny BST 764: Applied Statistical Modeling 12/16
The LassoFitting lasso models in R/SAS
Prostate data
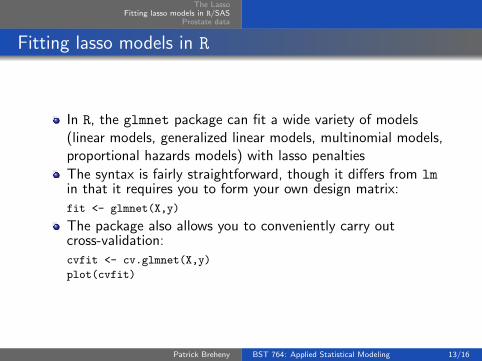
Fitting lasso models in R
In R, the glmnet package can fit a wide variety of models(linear models, generalized linear models, multinomial models,proportional hazards models) with lasso penalties
The syntax is fairly straightforward, though it differs from lmin that it requires you to form your own design matrix:
fit <- glmnet(X,y)
The package also allows you to conveniently carry outcross-validation:
cvfit <- cv.glmnet(X,y)
plot(cvfit)
Patrick Breheny BST 764: Applied Statistical Modeling 13/16
The LassoFitting lasso models in R/SAS
Prostate data
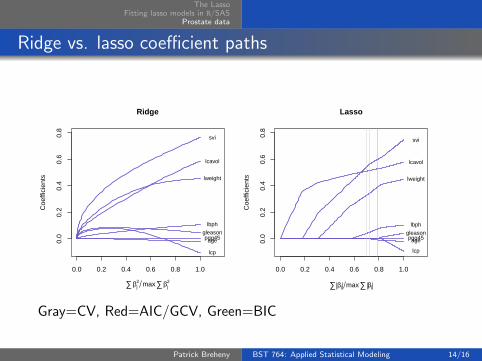
Ridge vs. lasso coefficient paths
0.0 0.2 0.4 0.6 0.8 1.0
0.0
0.2
0.4
0.6
0.8
Ridge
Coe
ffici
ents
lcavol
lweight
age
lbph
svi
lcp
gleasonpgg45
∑βj2 max∑βj
2
0.0 0.2 0.4 0.6 0.8 1.00.
00.
20.
40.
60.
8
Lasso
Coe
ffici
ents
lcavol
lweight
age
lbph
svi
lcp
gleasonpgg45
∑ βj max∑ βj
Gray=CV, Red=AIC/GCV, Green=BIC
Patrick Breheny BST 764: Applied Statistical Modeling 14/16
The LassoFitting lasso models in R/SAS
Prostate data
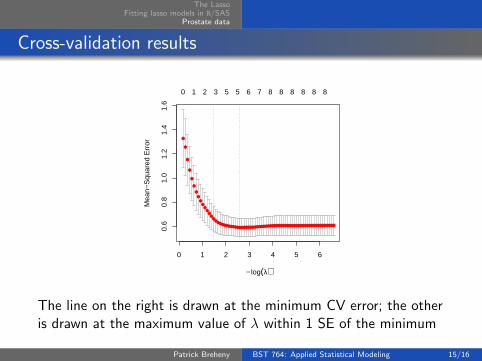
Cross-validation results
0 1 2 3 4 5 6
0.6
0.8
1.0
1.2
1.4
1.6
− log(λ)
Mea
n−S
quar
ed E
rror
●
●
●
●
●
●
●
●
●●
●●
●●
●●
●●●●●●●●●●●●●●●●●●●●●●●●●●●●●●●●●●●●●●●●●●●●●●●●●●●●●●
0 1 2 3 5 5 6 7 8 8 8 8 8 8
The line on the right is drawn at the minimum CV error; the otheris drawn at the maximum value of λ within 1 SE of the minimum
Patrick Breheny BST 764: Applied Statistical Modeling 15/16
The LassoFitting lasso models in R/SAS
Prostate data
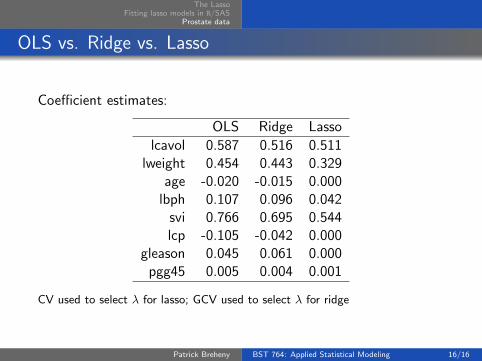
OLS vs. Ridge vs. Lasso
Coefficient estimates:
OLS Ridge Lasso
lcavol 0.587 0.516 0.511lweight 0.454 0.443 0.329
age -0.020 -0.015 0.000lbph 0.107 0.096 0.042
svi 0.766 0.695 0.544lcp -0.105 -0.042 0.000
gleason 0.045 0.061 0.000pgg45 0.005 0.004 0.001
CV used to select λ for lasso; GCV used to select λ for ridge
Patrick Breheny BST 764: Applied Statistical Modeling 16/16