Part II-1 - MIT OpenCourseWare · PDF file50 40 30 20 10 0 0 20 40 60 80 100 200 400 600 1000...
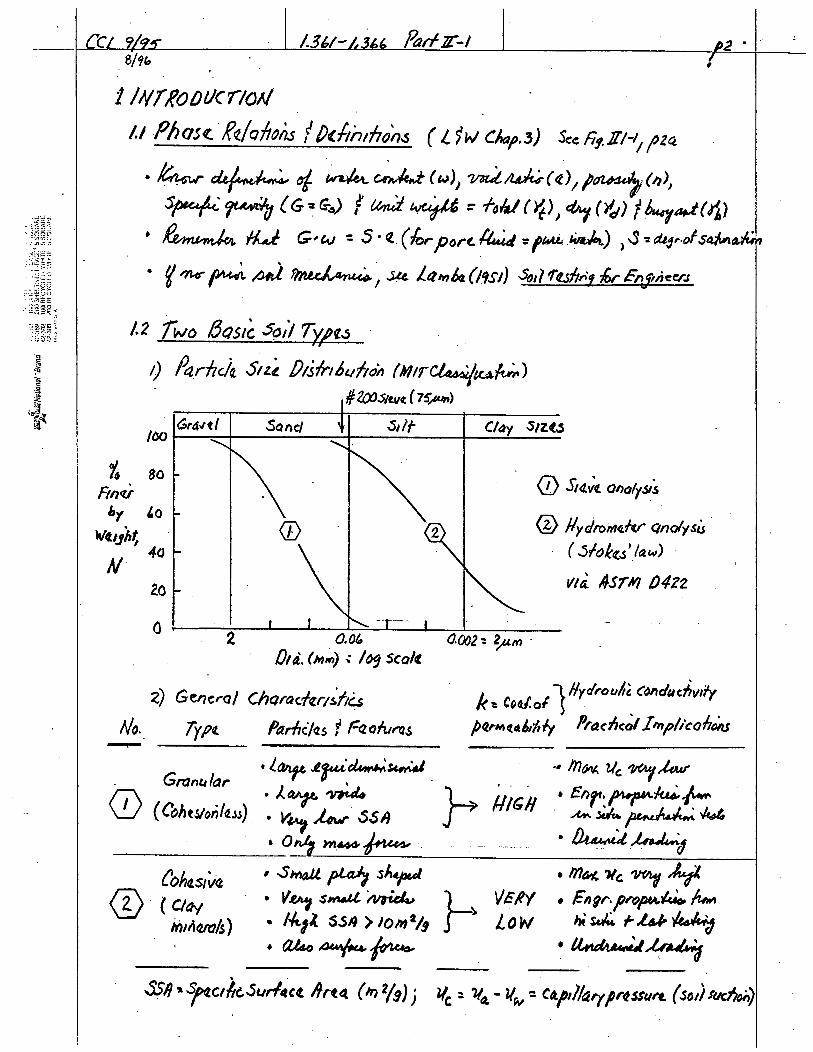
20
Transcript of Part II-1 - MIT OpenCourseWare · PDF file50 40 30 20 10 0 0 20 40 60 80 100 200 400 600 1000...

45
40
35
30
25
2075
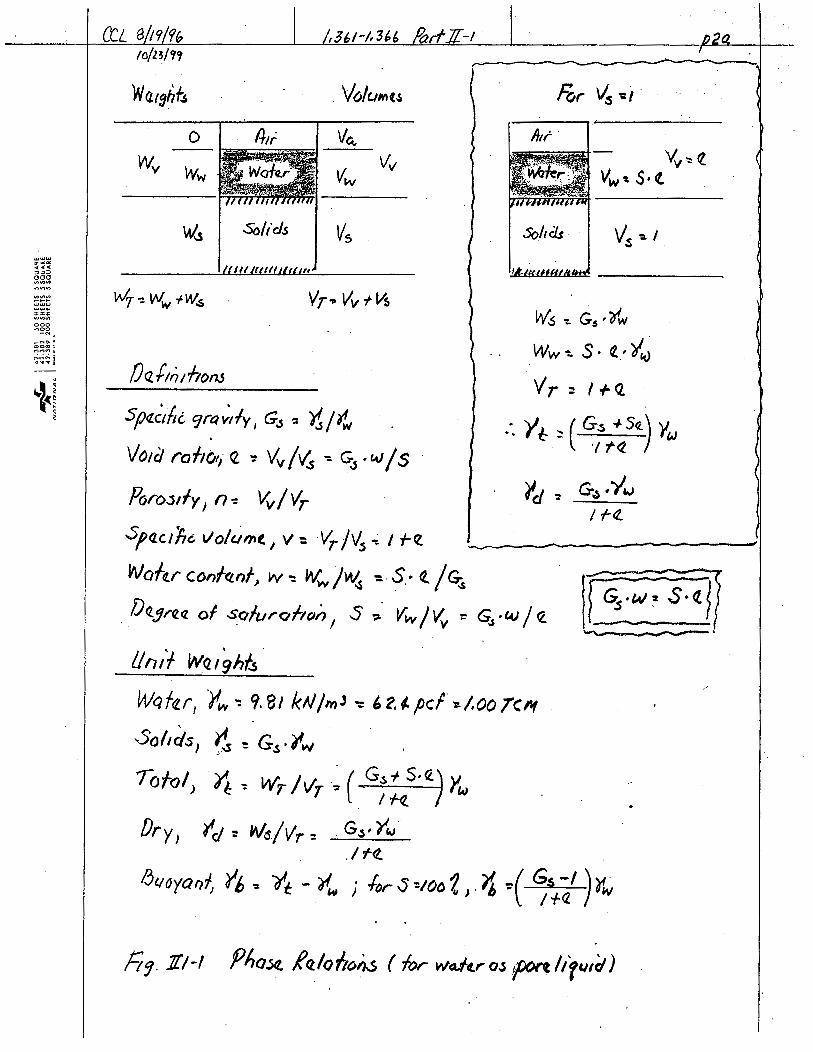
1.2 1.1 1.0 0.9 0.8 0.75 0.7 0.65 0.6 0.55
0.55 0.5 0.45 0.4 0.35 0.3 0.25 0.2 0.15
(G = 2.68)
0.5 0.45 0.4 0.35 0.3 0.25 0.2 0.15
80 90 100 110 120 130 140 150
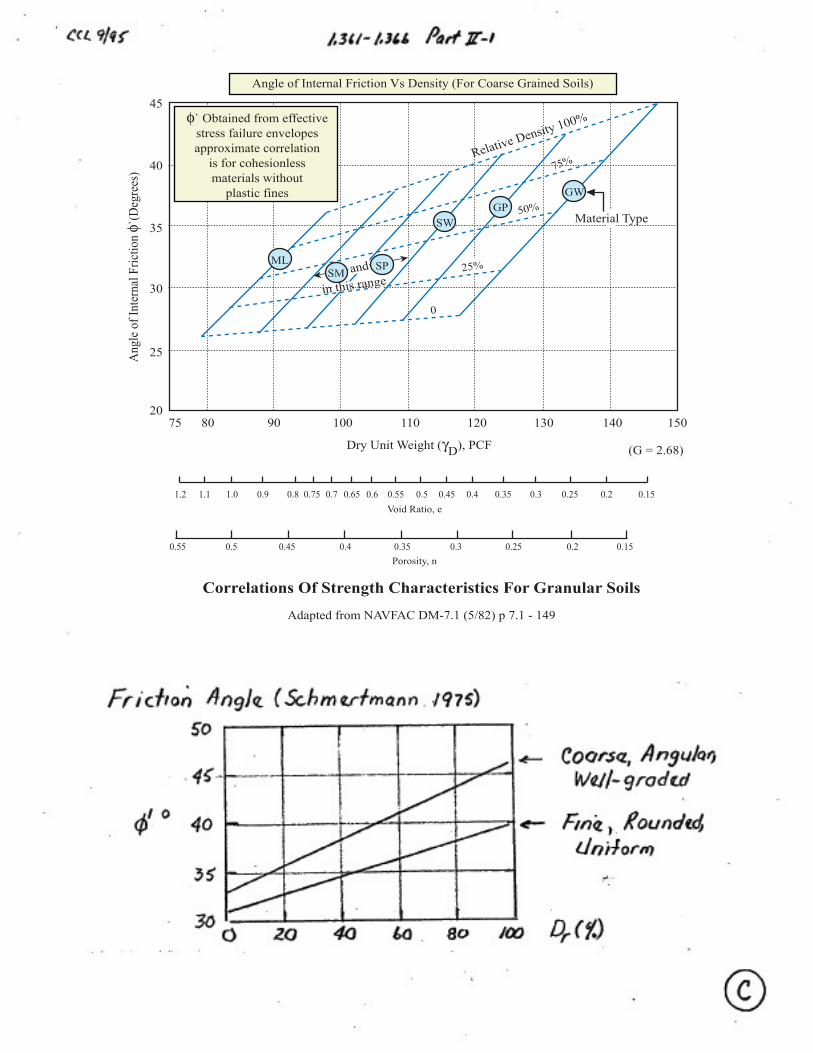
φ` Obtained from effectivestress failure envelopesapproximate correlation
is for cohesionlessmaterials without
plastic fines
MLSM
SP
SWGP
GW
Relative Density 100%
in this rangeand
0
25%
50%
75%
Angle of Internal Friction Vs Density (For Coarse Grained Soils)
Adapted from NAVFAC DM-7.1 (5/82) p 7.1 - 149
Correlations Of Strength Characteristics For Granular Soils
Material Type
Ang
le o
f Int
erna
l Fric
tion
φ`(D
egre
es)
Dry Unit Weight (γD), PCF
Void Ratio, e
Porosity, n
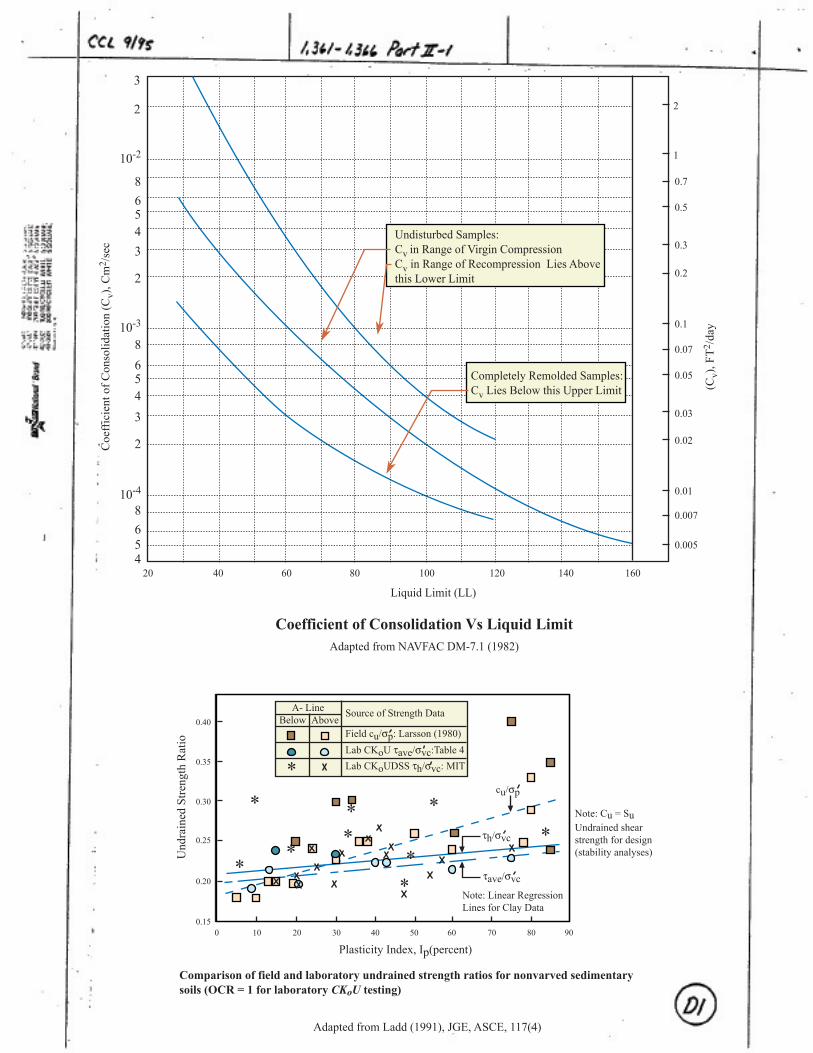
Coefficient of Consolidation Vs Liquid LimitAdapted from NAVFAC DM-7.1 (1982)
3
2
10-2
10-3
10-4
Liquid Limit (LL)
(Cv)
, FT2
/day
Coe
ffic
ient
of C
onso
lidat
ion
(Cv)
, Cm
2 /se
c
8
8
6543
2
654
8654
3
2
2
1
0.7
0.5
0.3
0.2
0.1
0.07
0.05
0.03
0.02
0.01
0.007
0.005
20 40 60 80 100 120 140 160
Undisturbed Samples:Cv in Range of Virgin CompressionCv in Range of Recompression Lies Above this Lower Limit
Completely Remolded Samples:Cv Lies Below this Upper Limit
0.40
0.35
0.30
0.25
0.20
0.150 10 20 30 40 50 60 70 80 90
Und
rain
ed S
treng
th R
atio
Plasticity Index, Ip(percent)
Adapted from Ladd (1991), JGE, ASCE, 117(4)
Comparison of field and laboratory undrained strength ratios for nonvarved sedimentary soils (OCR = 1 for laboratory CKoU testing)
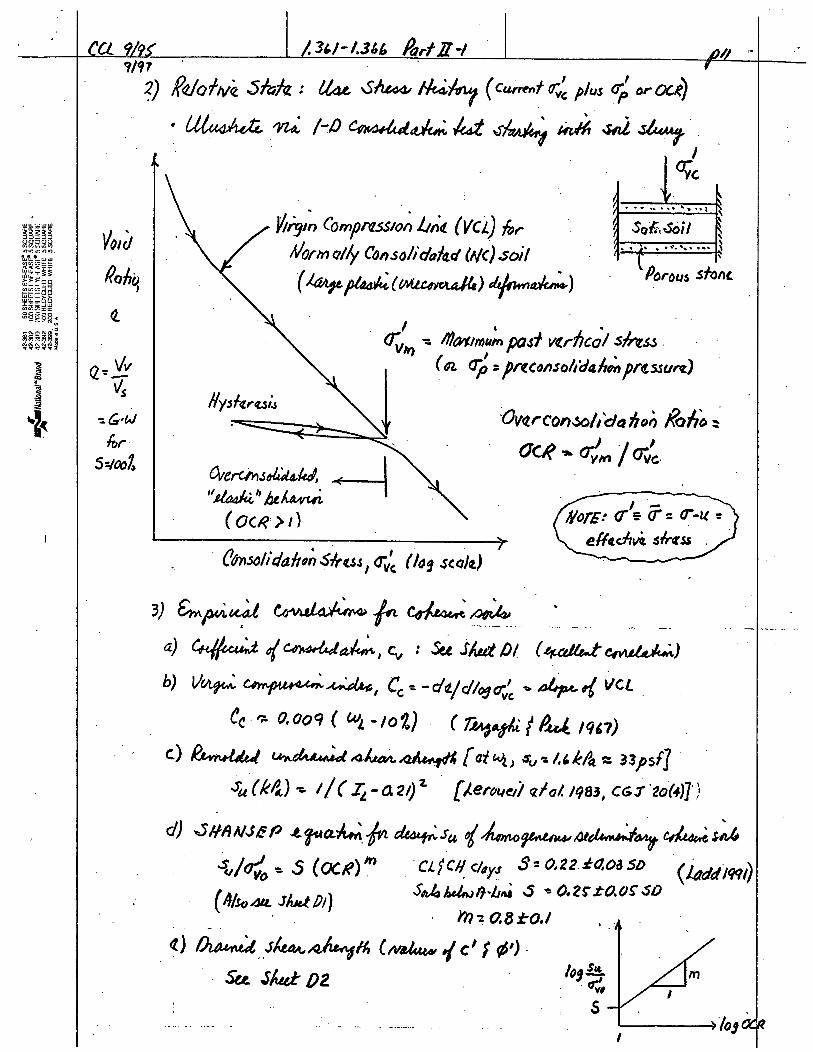
Note: Cu = SuUndrained shear strength for design(stability analyses)
Note: Linear Regression Lines for Clay Data
**
*
**
**
*
*
Source of Strength DataA- LineAboveBelow
Field cu/σp: Larsson (1980)Lab CKoU τave/σvc:Table 4Lab CKoUDSS τh/σvc: MIT*
cu/σp
τh/σvc
τave/σvc
50
40
30
20
10
00 20 40 60 80 100 200 400 600 1000
Fric
tion A
ngle
, φ', D
egre
es
Plasticity Index, Ip, percent
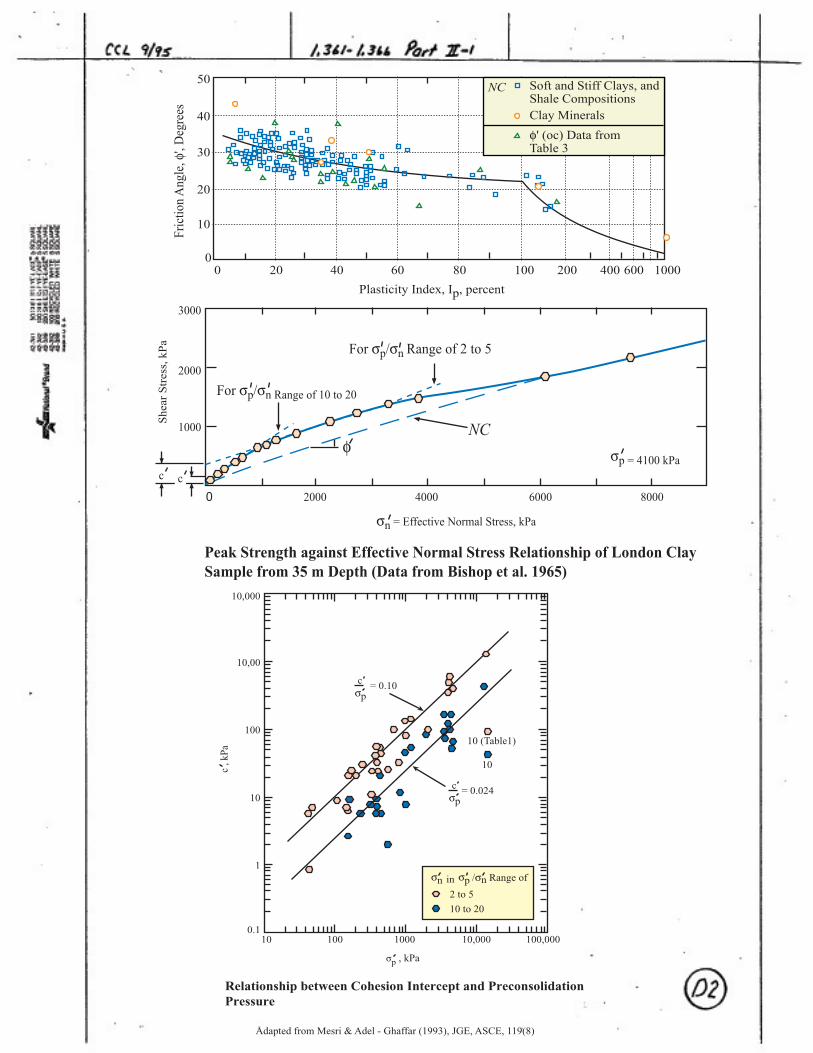
Soft and Stiff Clays, and Shale CompositionsClay Mineralsφ' (oc) Data from Table 3
NC
Values of Friction Angle φ' for Natural Clay Compositions
NC
For σp/σn Range of 10 to 20
For σp/σn Range of 2 to 5
σp = 4100 kPac c
3000
2000
1000
0 2000 4000 6000 8000
Shea
r Stre
ss, k
Pa
σn = Effective Normal Stress, kPa
φ
Peak Strength against Effective Normal Stress Relationship of London ClaySample from 35 m Depth (Data from Bishop et al. 1965)
10,000
10,00
100
10
1
0.110 100 1000 10,000 100,000
c
pσ= 0.024
10 (Table1)
10
c
pσ= 0.10
c , k
Pa
σp , kPa
Relationship between Cohesion Intercept and Preconsolidation Pressure
Adapted from Mesri & Adel - Ghaffar (1993), JGE, ASCE, 119(8)
2 to 5
10 to 20
nσ pσin /σn Range of
60
50
40
30
20
10740 0 10 16 20 30 40 50
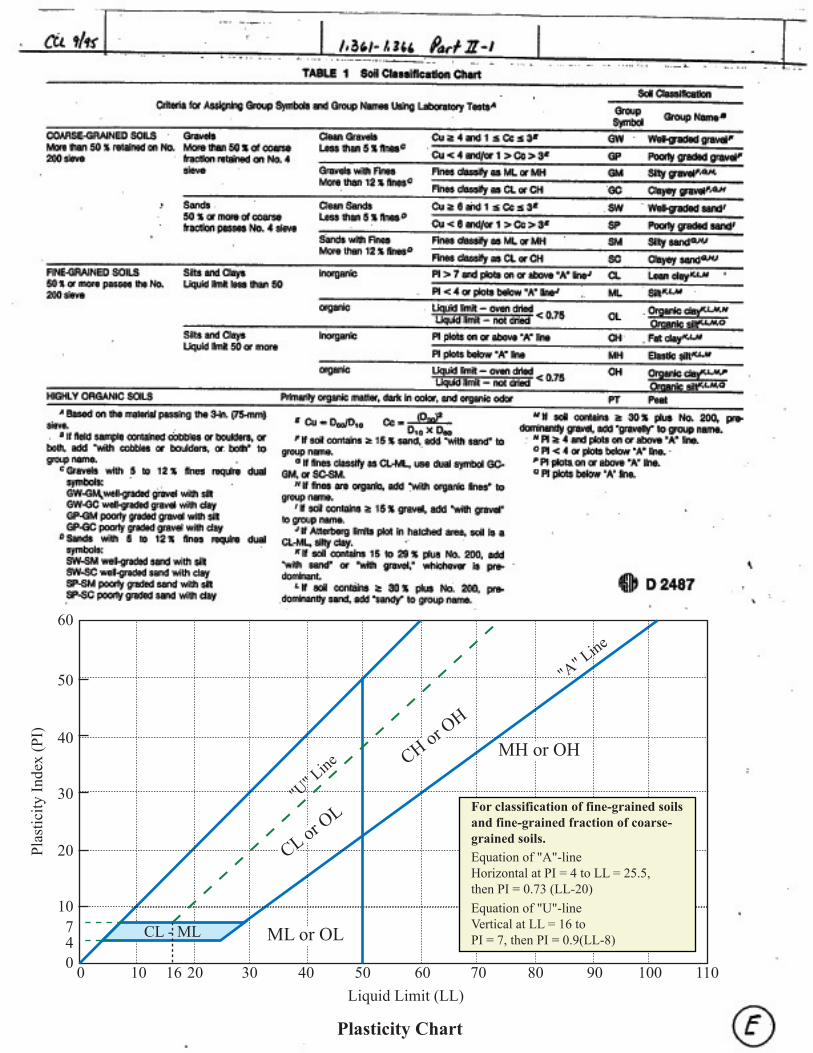
ML or OL
MH or OH
60 70 80 90 100 110
Plas
ticity
Inde
x (P
I)
Liquid Limit (LL)
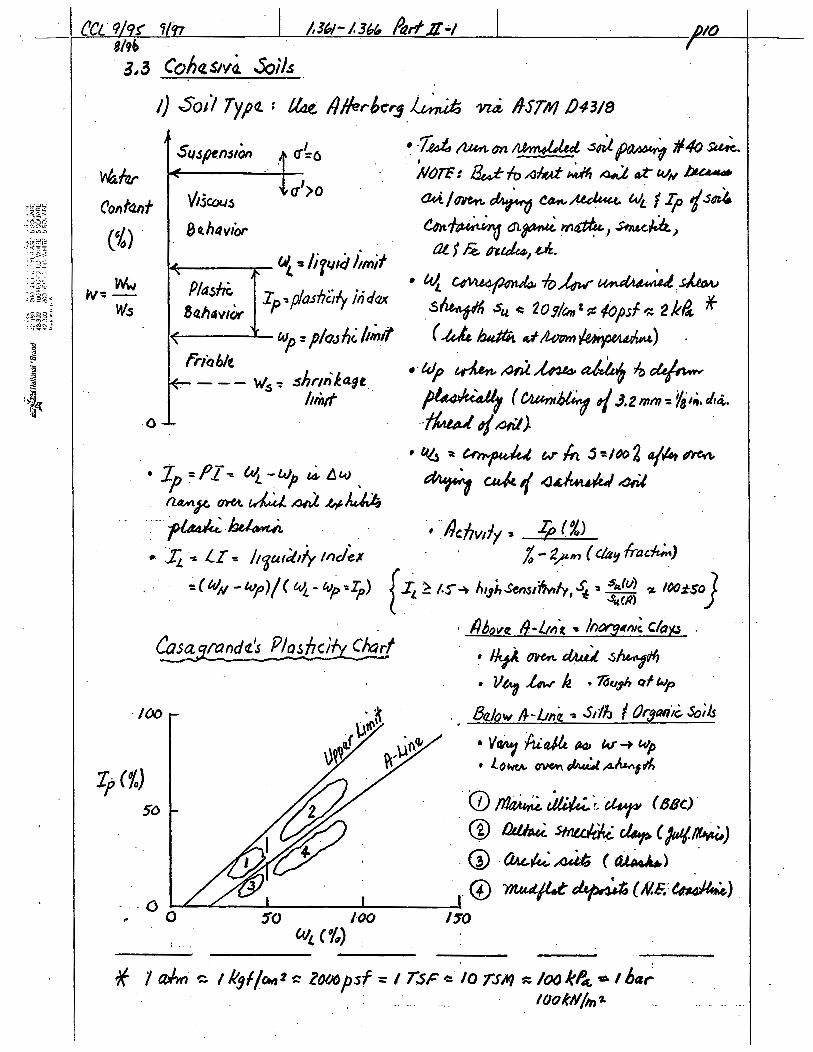
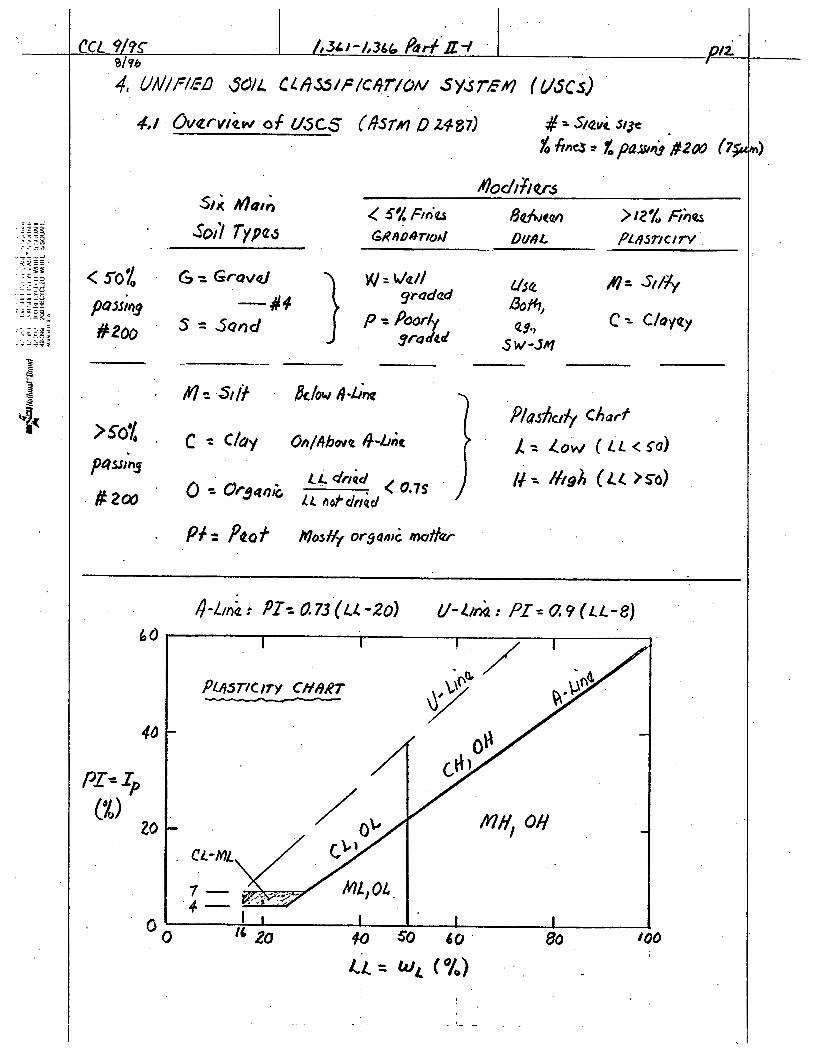
Plasticity Chart
"U" L
ine
CL or OL
CH or OH
"A" L
ine
For classification of fine-grained soils and fine-grained fraction of coarse-grained soils.Equation of "A"-line Horizontal at PI = 4 to LL = 25.5, then PI = 0.73 (LL-20)Equation of "U"-line Vertical at LL = 16 to PI = 7, then PI = 0.9(LL-8)CL - ML