PALS C t ll d P Gl PALS on Controlled Pore Glass ...
20
PALS C t ll d P Gl PALS on Controlled Pore Glass – Porosimetry and Phase Transition of Gas in Confinement S Thraenert 1 D Enke 2 S. Thraenert , D. Enke , R. Krause-Rehberg 1 Martin-Luther-Universität Halle-Wittenberg Halle Wittenberg Naturwissenschaftliche Fakultät II 1 Institut für Physik 2 Institut für Chemie
Transcript of PALS C t ll d P Gl PALS on Controlled Pore Glass ...
PALS C t ll d P Gl PALS on Controlled Pore Glass –Porosimetry and Phase Transition m y
of Gas in Confinement
S Thraenert1 D Enke2 S. Thraenert , D. Enke , R. Krause-Rehberg1
Martin-Luther-Universität Halle-WittenbergHalle Wittenberg
Naturwissenschaftliche Fakultät II1Institut für Physik
2Institut für Chemie
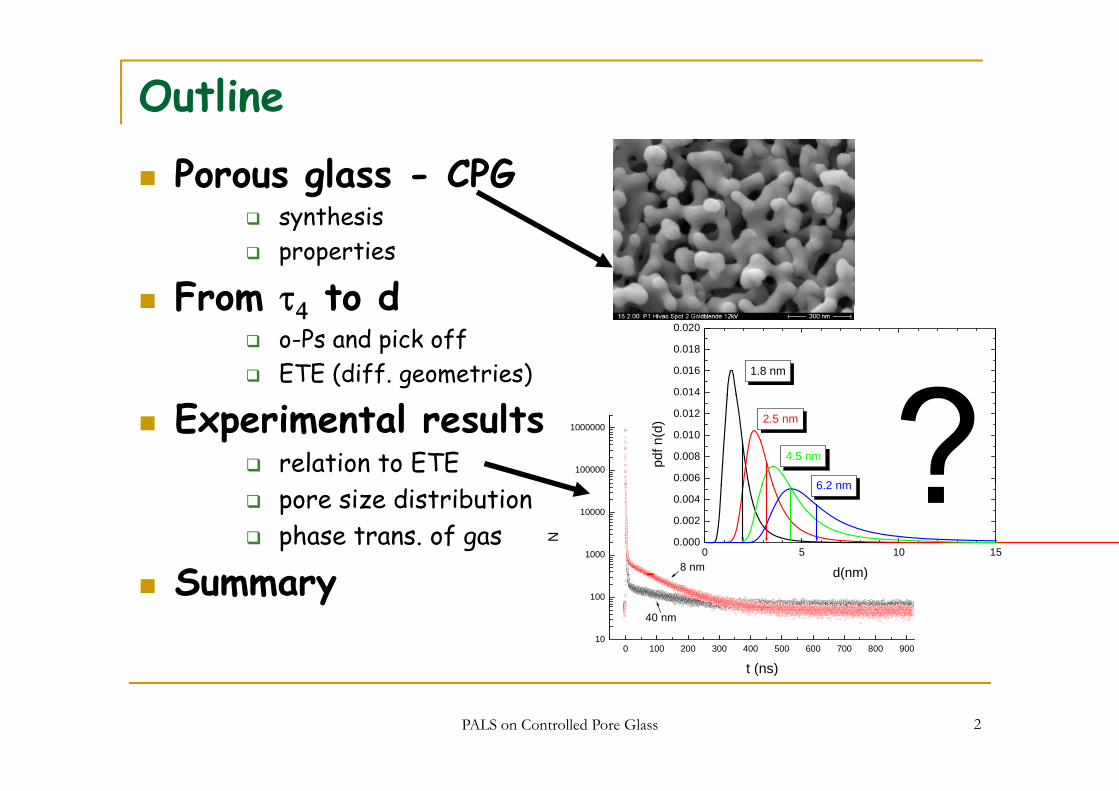
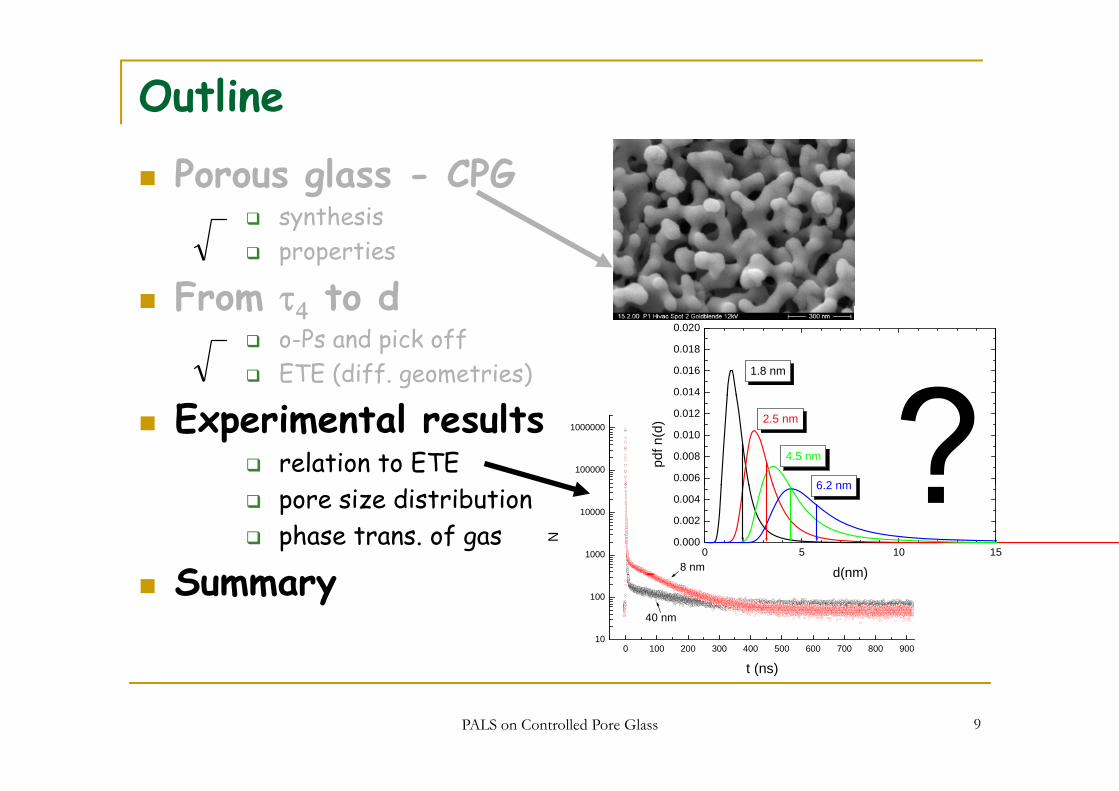
Outline
Porous glass - CPGsynthesissynthesisproperties
From τ4 to dFrom τ4 to do-Ps and pick offETE (diff. geometries)
0.014
0.016
0.018
0.020
1.8 nm
Experimental resultsrelation to ETE 100000
1000000
0.006
0.008
0.010
0.012
6 2 nm
4.5 nm
2.5 nm
pdf n
(d)
pore size distributionphase trans. of gas
S mm1000
10000
8 nm
N0 5 10 15
0.000
0.002
0.0046.2 nm
d(nm)Summary0 100 200 300 400 500 600 700 800 900
10
100
40 nm
t ( )
d(nm)
PALS on Controlled Pore Glass 2
t (ns)
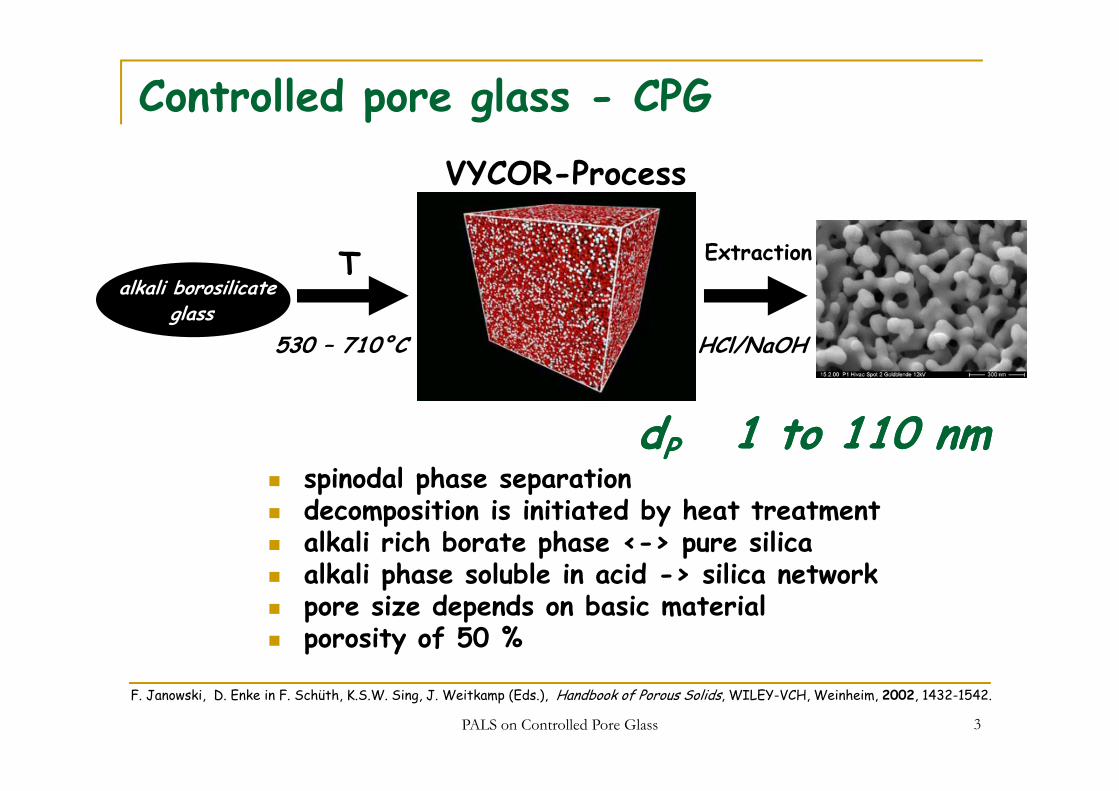
Controlled pore glass - CPGVYCOR-Process
alkali borosilicate
ExtractionTl
HCl/NaOH530 – 710°Cglass
ddPP 1 to 110 nm1 to 110 nmspinodal phase separationspinodal phase separationdecomposition is initiated by heat treatmentalkali rich borate phase <-> pure silicaalkali phase soluble in acid -> silica networkalkali phase soluble in acid -> silica networkpore size depends on basic materialporosity of 50 %
PALS on Controlled Pore Glass 3
F. Janowski, D. Enke in F. Schüth, K.S.W. Sing, J. Weitkamp (Eds.), Handbook of Porous Solids, WILEY-VCH, Weinheim, 2002, 1432-1542.
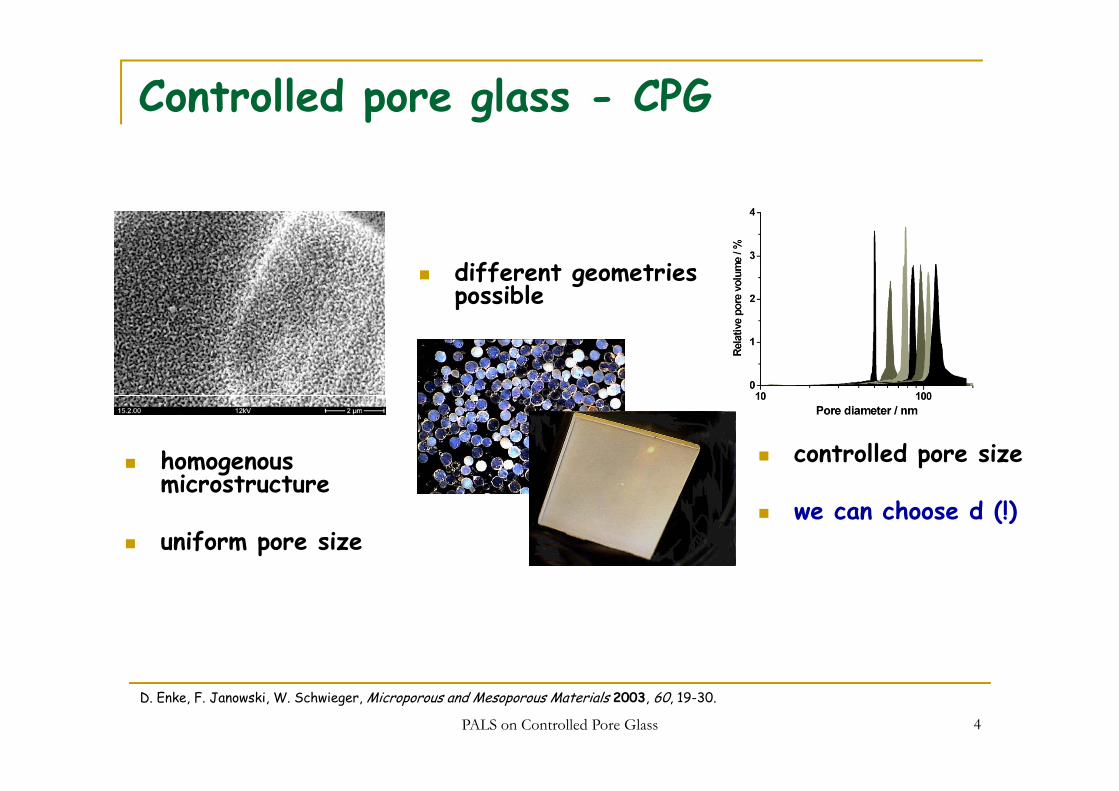
Controlled pore glass - CPG
different geometries possiblep
homogenous microstructure
controlled pore sizemicrostructure
uniform pore sizewe can choose d (!)
PALS on Controlled Pore Glass 4
D. Enke, F. Janowski, W. Schwieger, Microporous and Mesoporous Materials 2003, 60, 19-30.
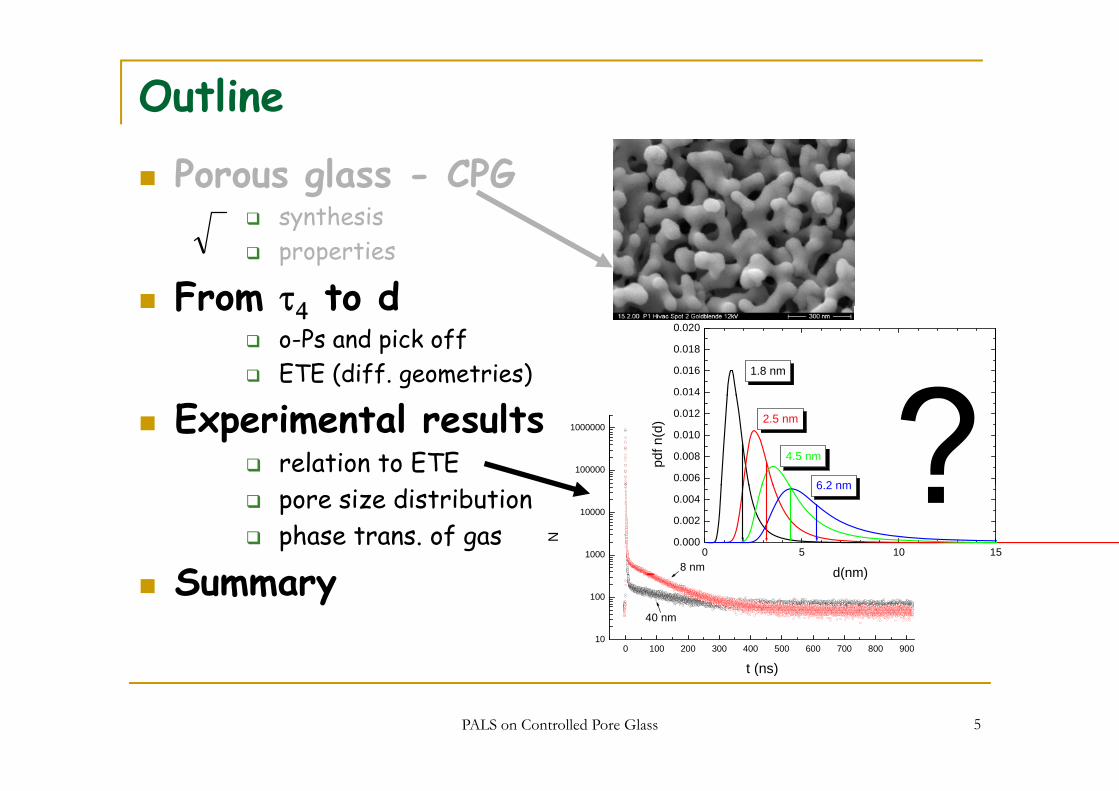
Outline
Porous glass - CPGsynthesissynthesisproperties
From τ4 to dFrom τ4 to do-Ps and pick offETE (diff. geometries)
0.014
0.016
0.018
0.020
1.8 nm
Experimental resultsrelation to ETE 100000
1000000
0.006
0.008
0.010
0.012
6 2 nm
4.5 nm
2.5 nm
pdf n
(d)
pore size distributionphase trans. of gas
S mm1000
10000
8 nm
N0 5 10 15
0.000
0.002
0.0046.2 nm
d(nm)Summary0 100 200 300 400 500 600 700 800 900
10
100
40 nm
t ( )
d(nm)
PALS on Controlled Pore Glass 5
t (ns)
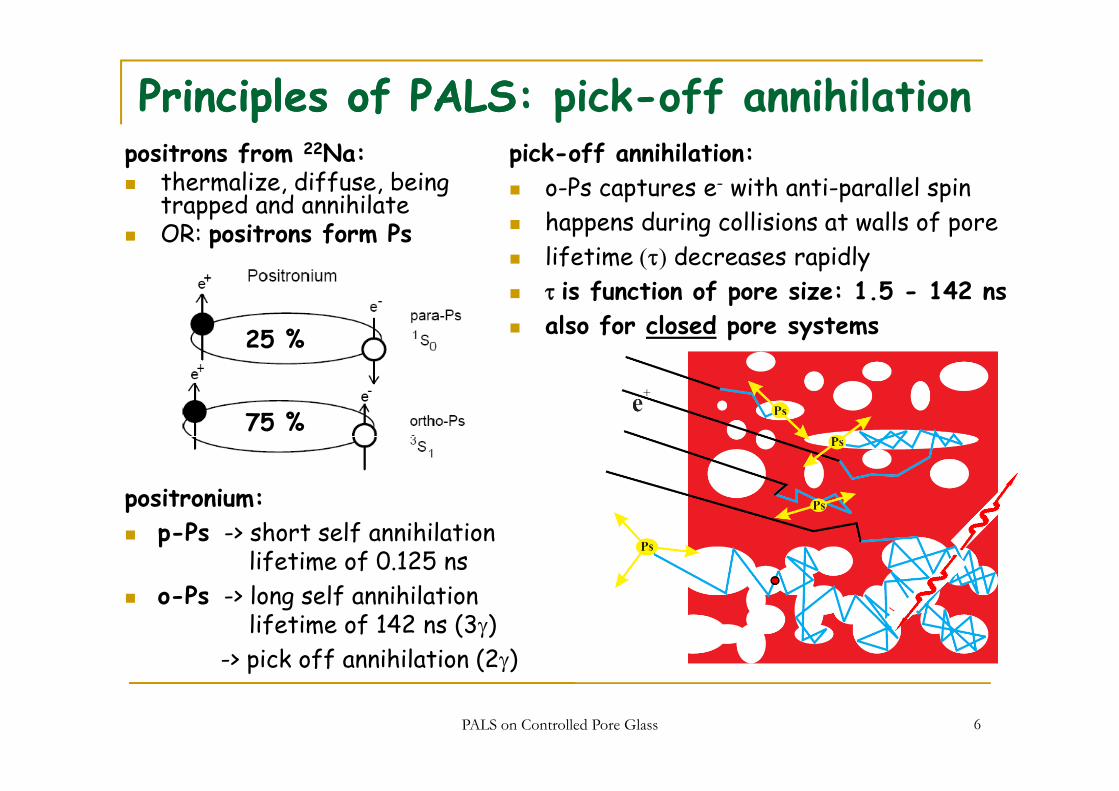
Principles of PALS: pick-off annihilationPrinciples of PALSpick-off annihilation:
o-Ps captures e- with anti-parallel spinh d i lli i t ll f
positrons from 22Na: thermalize, diffuse, being trapped and annihilate
happens during collisions at walls of porelifetime (τ) decreases rapidlyτ is function of pore size: 1.5 - 142 ns
ppOR: positrons form Ps
palso for closed pore systems25 %
75 %
positronium: p-Ps -> short self annihilation
lifetime of 0.125 nso-Ps -> long self annihilation
lifetime of 142 ns (3γ)-> pick off annihilation (2γ)
PALS on Controlled Pore Glass 6
> pick off annihilation (2γ)
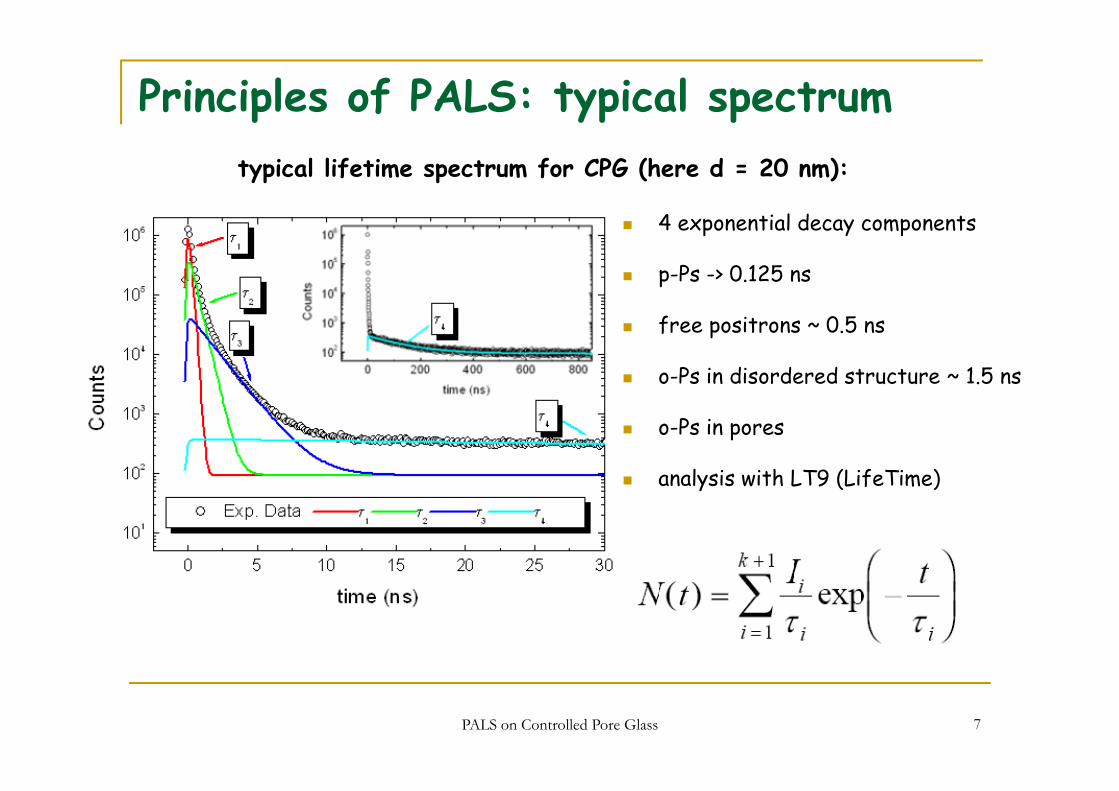
Principles of PALS: typical spectrumtypical lifetime spectrum for CPG (here d = 20 nm):
4 ti l d t4 exponential decay components
p-Ps -> 0.125 ns
free positrons ~ 0.5 ns
o-Ps in disordered structure ~ 1.5 ns
o-Ps in pores
analysis with LT9 (LifeTime)analysis with LT9 (LifeTime)
PALS on Controlled Pore Glass 7
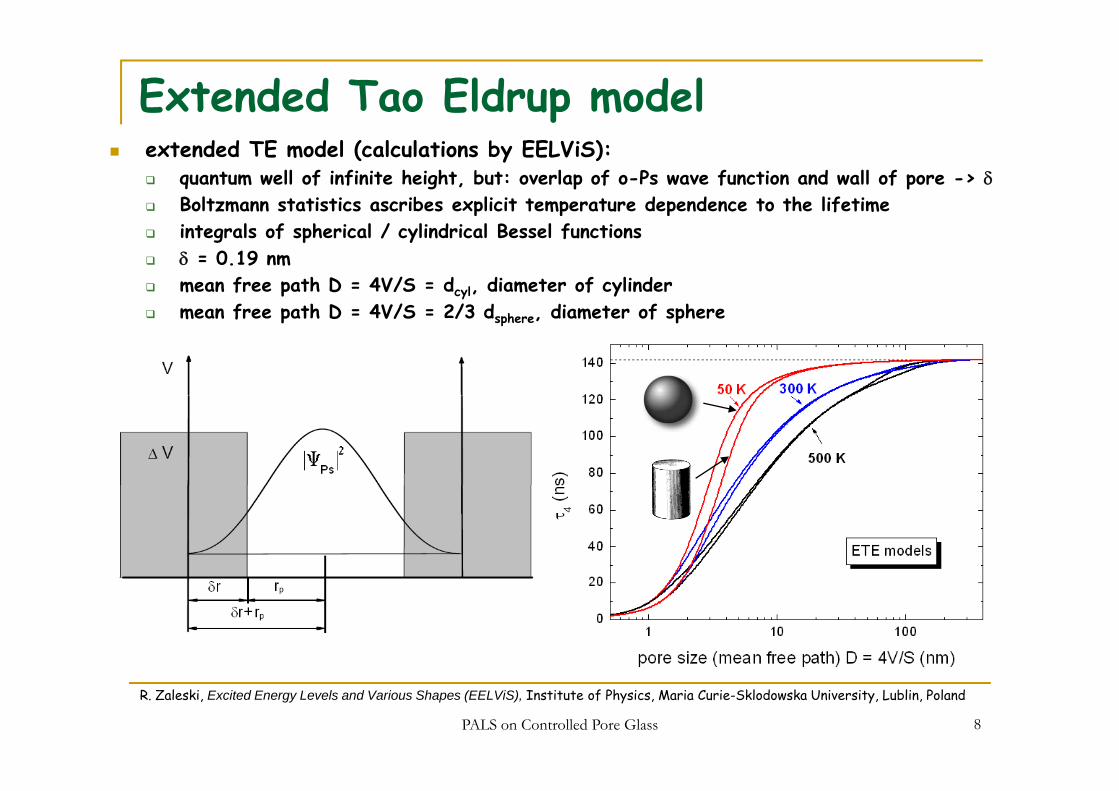
Extended Tao Eldrup model extended TE model (calculations by EELViS):
quantum well of infinite height, but: overlap of o-Ps wave function and wall of pore -> δBoltzmann statistics ascribes explicit temperature dependence to the lifetimep p pintegrals of spherical / cylindrical Bessel functionsδ = 0.19 nm mean free path D = 4V/S = dcyl, diameter of cylinder
f th D 4V/S 2/3 d di t f hmean free path D = 4V/S = 2/3 dsphere, diameter of sphere
PALS on Controlled Pore Glass 8
R. Zaleski, Excited Energy Levels and Various Shapes (EELViS), Institute of Physics, Maria Curie-Sklodowska University, Lublin, Poland
Outline
Porous glass - CPGsynthesissynthesisproperties
From τ4 to dFrom τ4 to do-Ps and pick offETE (diff. geometries)
0.014
0.016
0.018
0.020
1.8 nm
Experimental resultsrelation to ETE 100000
1000000
0.006
0.008
0.010
0.012
6 2 nm
4.5 nm
2.5 nm
pdf n
(d)
pore size distributionphase trans. of gas
S mm1000
10000
8 nm
N0 5 10 15
0.000
0.002
0.0046.2 nm
d(nm)Summary0 100 200 300 400 500 600 700 800 900
10
100
40 nm
t ( )
d(nm)
PALS on Controlled Pore Glass 9
t (ns)
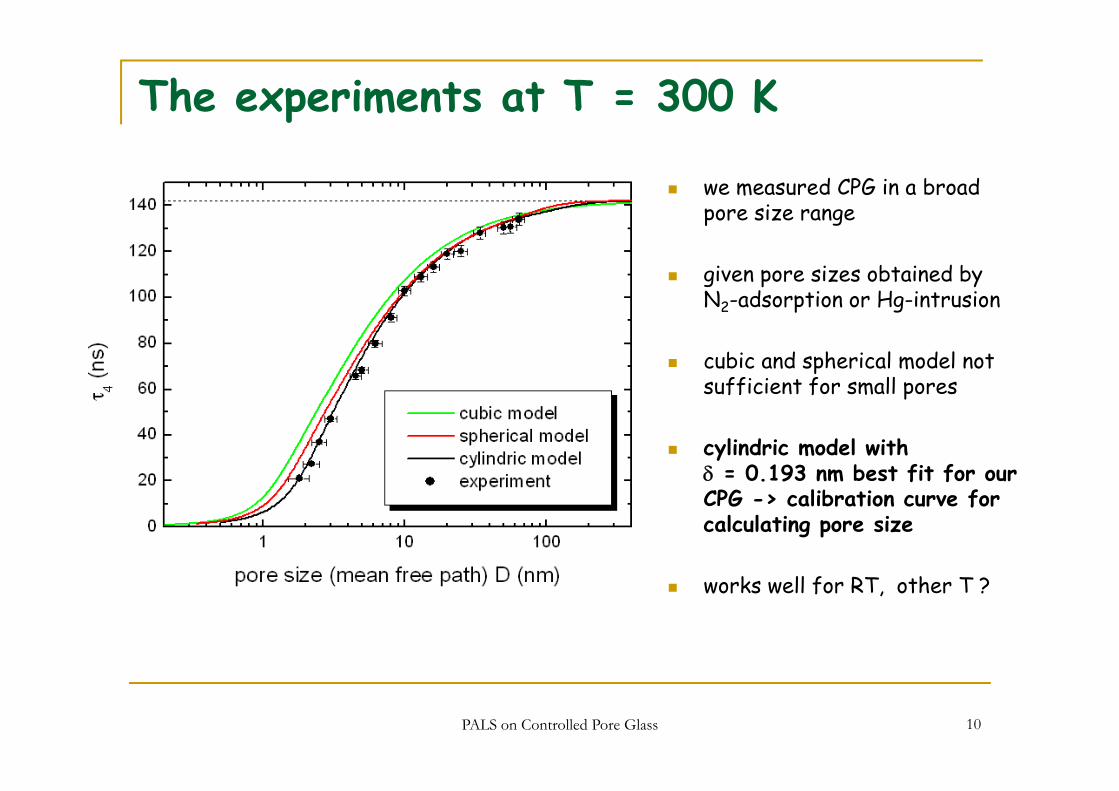
The experiments at T = 300 K
we measured CPG in a broad pore size rangepore size range
given pore sizes obtained by N2-adsorption or Hg-intrusionN2 adsorption or Hg intrusion
cubic and spherical model not sufficient for small poresp
cylindric model with δ = 0.193 nm best fit for our CPG -> calibration curve for calculating pore size
works well for RT, other T ?
PALS on Controlled Pore Glass 10
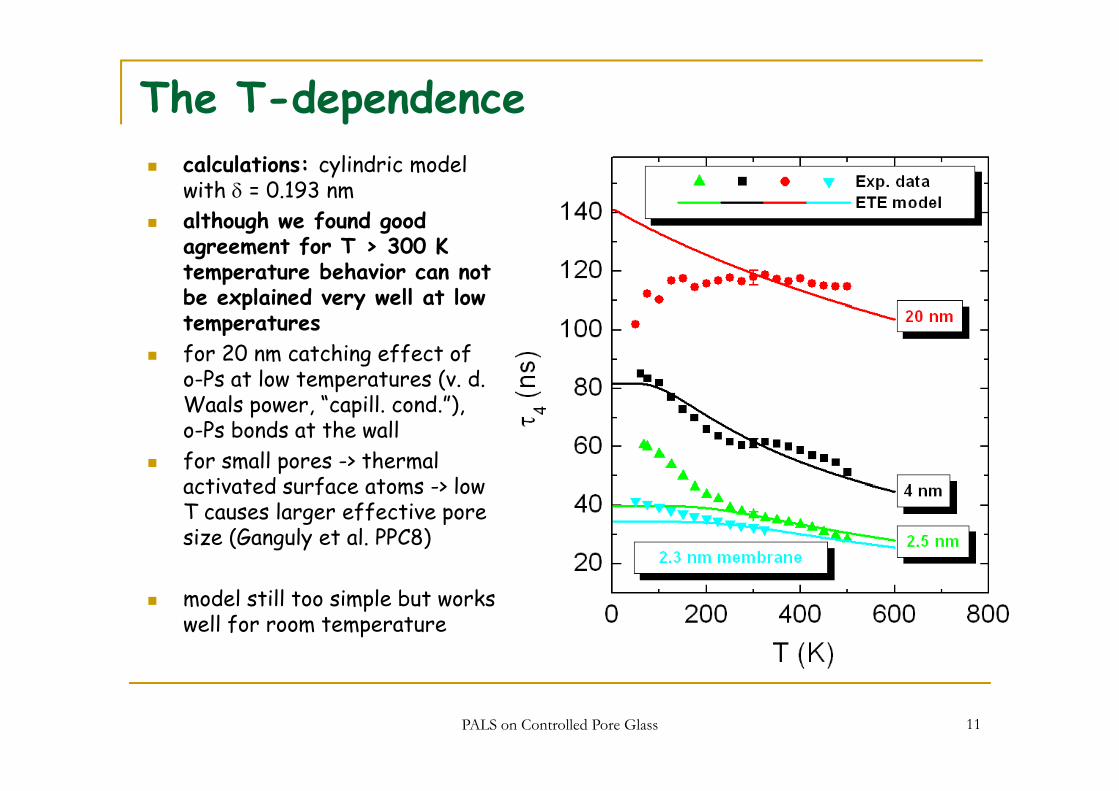
The T-dependencecalculations: cylindric model with δ = 0.193 nmlth h f d d although we found good
agreement for T > 300 K temperature behavior can not be explained very well at low p ytemperaturesfor 20 nm catching effect of o-Ps at low temperatures (v. d.
l “ ll d ”) Waals power, “capill. cond.”), o-Ps bonds at the wallfor small pores -> thermal activated surface atoms > low activated surface atoms -> low T causes larger effective pore size (Ganguly et al. PPC8)
model still too simple but works well for room temperature
PALS on Controlled Pore Glass 11

Pore size distribution
D τ4 σ41.8 nm 21.1 ns 14.8 ns2.5 nm 46.9 ns 17.6 ns4 5 nm 65 9 ns 18 9 ns4.5 nm 65.9 ns 18.9 ns6.2 nm 80.0 ns 19.3 ns
and its distribution by τ4 and its distribution σ4 by analysis of truncated spectra starting from 20 ns
problem of LT: limit of 142 ns is not taken into account, for large pores unphysically large σ4
distribution for 4 smaller selected pores
PALS on Controlled Pore Glass 12
Pore size distribution0 016
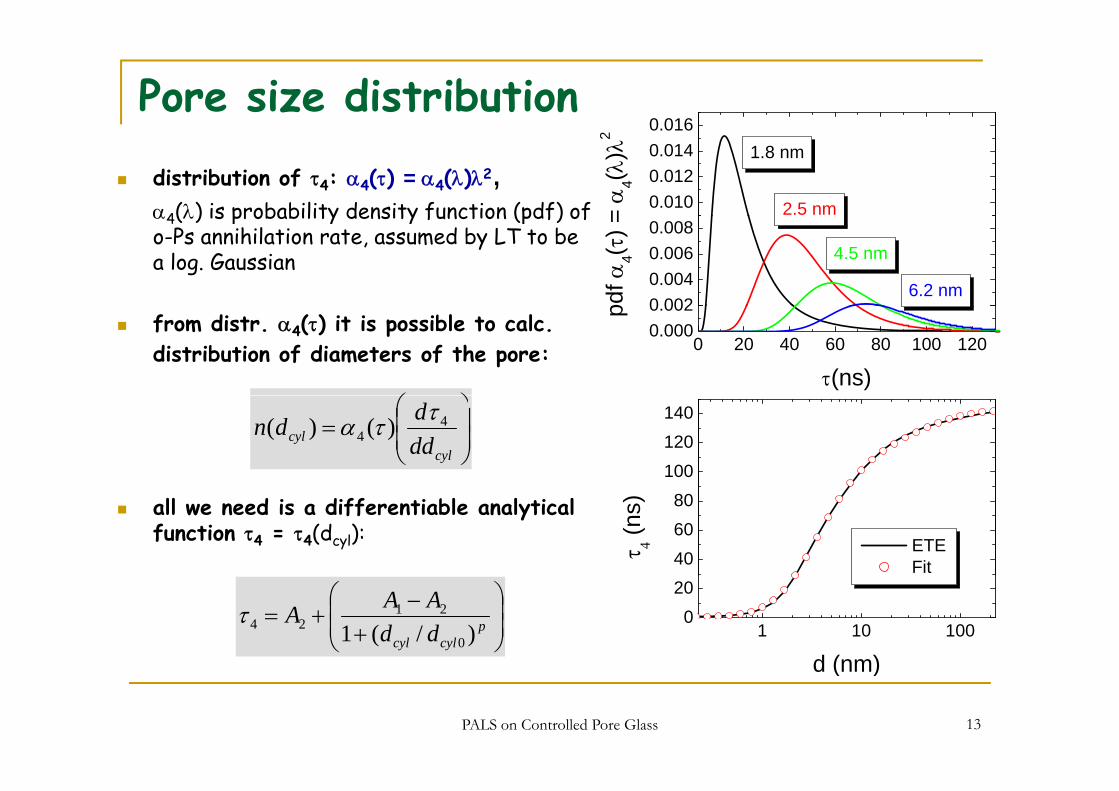
distribution of τ4: α4(τ) = α4(λ)λ2, α4(λ) is probability density function (pdf) of 0.010
0.0120.0140.016
2.5 nm
1.8 nm
= α
4(λ)λ
2
α4(λ) is probability density function (pdf) of o-Ps annihilation rate, assumed by LT to be a log. Gaussian
0 0020.0040.0060.008
6.2 nm
4.5 nm
pdf α
4(τ) =
from distr. α4(τ) it is possible to calc.distribution of diameters of the pore:
⎞⎛
0 20 40 60 80 100 1200.0000.002p
τ(ns)
⎟⎟⎠
⎞⎜⎜⎝
⎛=
cylcyl dd
ddn 44 )()( ττα
100120140
all we need is a differentiable analytical function τ4 = τ4(dcyl):
406080
ETEFit
τ 4 (n
s)⎟⎟⎠
⎞⎜⎜⎝
⎛
+−
+= pcylcyl dd
AAA)/(1 0
2124τ 1 10 100
020
d (nm)
PALS on Controlled Pore Glass 13
d (nm)

Pore size distributiondistribution norm. to 1
arrows show d directly calculated from mean o-Ps lifetime using cylindric model (1.77 nm, 3.09 nm, 4.38 nm and 5.80 nm)
this distribution contains the true variation of pore sizes true variation of pore sizes but also the effect of irregular not linear character of poresof pores
long tail for larger pores:
overestimation of α4(τ)f 4( )
nonlinear char. τ4 vs. d
PALS on Controlled Pore Glass 14
to be published
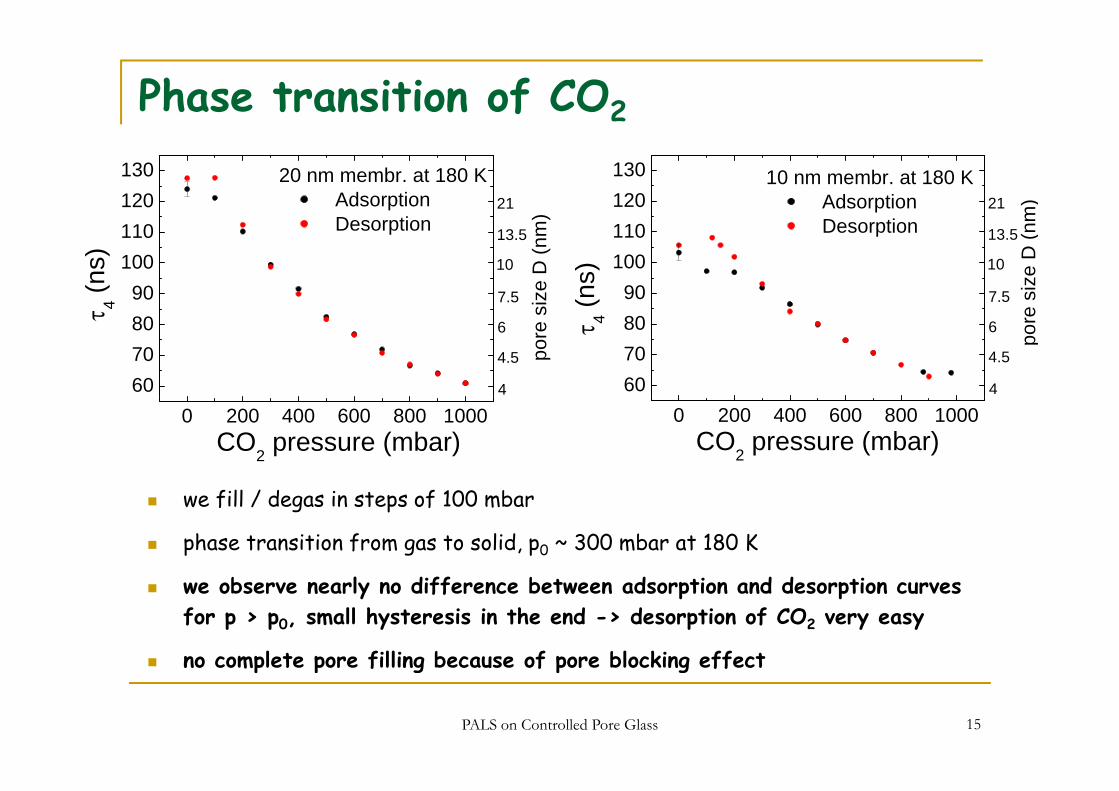
Phase transition of CO2
120130
21 )
20 nm membr. at 180 K Adsorption 120
13021
m)
10 nm membr. at 180 K Adsorption
90100110
7.5
10
13.5
ize
D (n
m)
Desorption
4 (ns)
90100110
7.5
10
13.5
size
D (n
m
Desorption
(ns)
607080
4.5
4
pore
s
6
τ 4
607080
4.5
4
pore
6τ 4 (
0 200 400 600 800 1000CO2 pressure (mbar)
0 200 400 600 800 1000CO2 pressure (mbar)
we fill / degas in steps of 100 mbar
phase transition from gas to solid, p0 ~ 300 mbar at 180 K
we observe nearly no difference between adsorption and desorption curves for p > p0, small hysteresis in the end -> desorption of CO2 very easy
no complete pore filling because of pore blocking effect
PALS on Controlled Pore Glass 15
no complete pore filling because of pore blocking effect
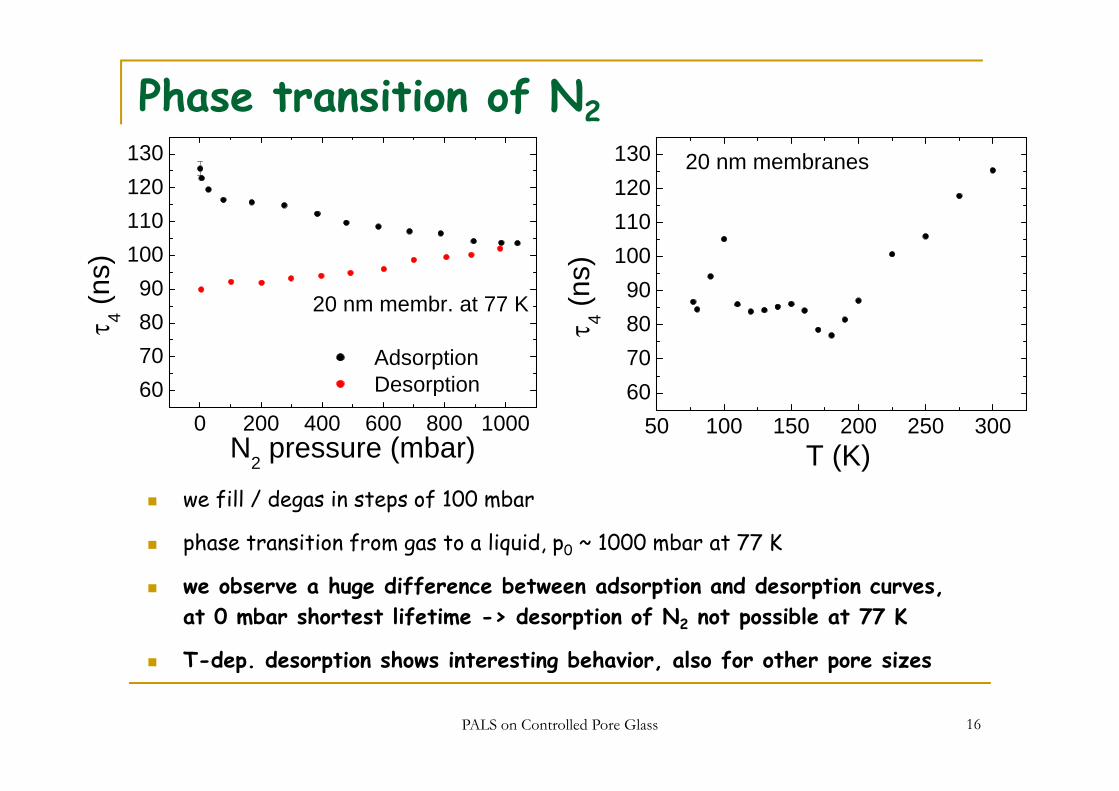
Phase transition of N2
110120130
110120130 20 nm membranes
90100110
20 nm membr at 77 K(ns)
90100110
(ns)
607080
20 nm membr. at 77 K
AdsorptionDesorption
τ 4
607080τ 4
0 200 400 600 800 100060 p
N2 pressure (mbar)50 100 150 200 250 300
60
T (K)we fill / degas in steps of 100 mbar
phase transition from gas to a liquid, p0 ~ 1000 mbar at 77 K
we observe a huge difference between adsorption and desorption curves, at 0 mbar shortest lifetime -> desorption of N2 not possible at 77 K
T-dep desorption shows interesting behavior also for other pore sizes
PALS on Controlled Pore Glass 16
T dep. desorption shows interesting behavior, also for other pore sizes

Outline
Porous glass - CPGsynthesissynthesisproperties
From τ4 to dFrom τ4 to do-Ps and pick offETE (diff. geometries)
0.014
0.016
0.018
0.020
1.8 nm
Experimental resultsrelation to ETE 100000
1000000
0.006
0.008
0.010
0.012
6 2 nm
4.5 nm
2.5 nm
pdf n
(d)
pore size distributionphase trans. of gas
S mm1000
10000
8 nm
N0 5 10 15
0.000
0.002
0.0046.2 nm
d(nm)Summary0 100 200 300 400 500 600 700 800 900
10
100
40 nm
t ( )
d(nm)
PALS on Controlled Pore Glass 17
t (ns)
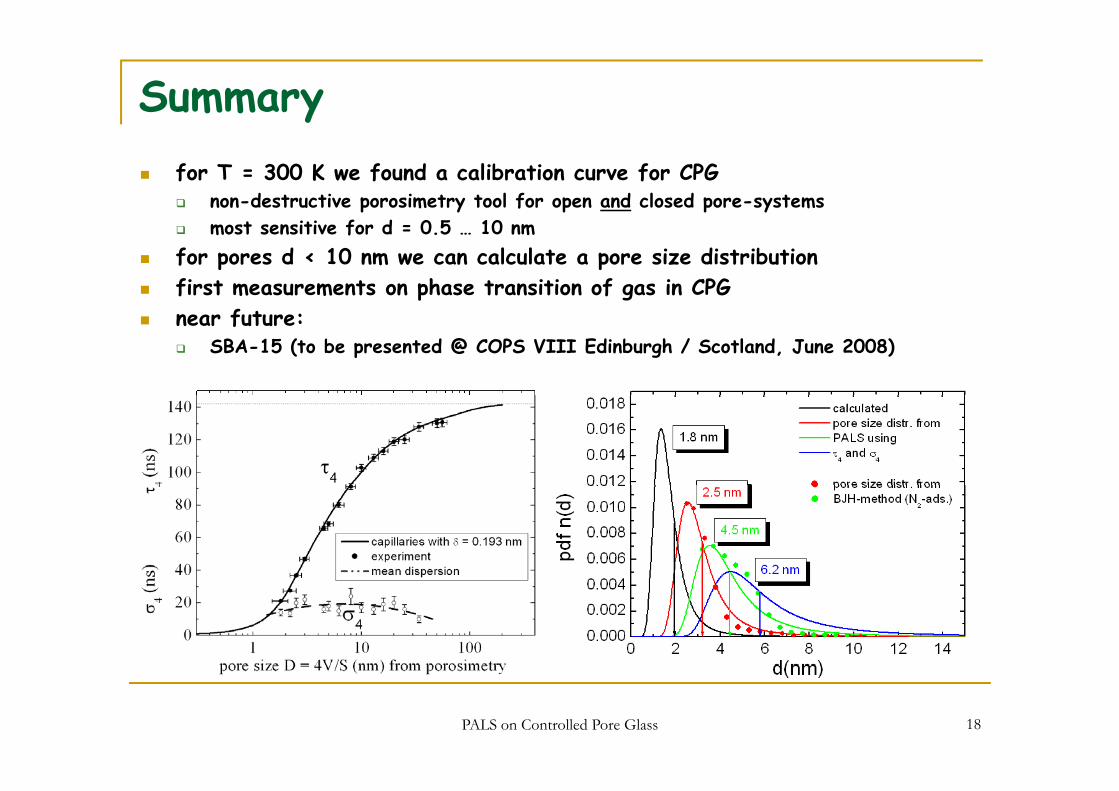
Summaryfor T = 300 K we found a calibration curve for CPG
non-destructive porosimetry tool for open and closed pore-systemsmost sensitive for d = 0.5 … 10 nm
for pores d < 10 nm we can calculate a pore size distributionfirst measurements on phase transition of gas in CPGnear future:
SBA-15 (to be presented @ COPS VIII Edinburgh / Scotland, June 2008)
PALS on Controlled Pore Glass 18
Acknowledgment
谢谢special 谢谢 from our group go to:
R Z l ki d hi R. Zaleski and his group (Lublin/Poland) for EELViS
G. Dlubek (Halle/Germany) for fruitful discussions
all organizers of PPC9
PALS on Controlled Pore Glass 19
谢谢 for your patience!
this talk as pdf?this talk as pdf?
http://positron physik uni halle dehttp://positron.physik.uni-halle.de
PALS on Controlled Pore Glass 20