
Page 1 of 37 - Home | Molecular...
56
MOL 7278 Page 1 of 37 Title Page Constitutive Expression of Peroxisome Proliferator-Activated Receptor α−Regulated Genes in Dwarf Mice Anja J. Stauber, Holly Brown-Borg, Jie Liu, Michael P. Waalkes, Ashley Laughter, Rebecca A. Staben, Jaqueline C. Coley, Cynthia Swanson, Kenneth A. Voss, John J. Kopchick and J. Christopher Corton CIIT Centers for Health Research, Research Triangle Park, NC 27709 Molecular Pharmacology Fast Forward. Published on December 2, 2004 as doi:10.1124/mol.104.007278 Copyright 2004 by the American Society for Pharmacology and Experimental Therapeutics. This article has not been copyedited and formatted. The final version may differ from this version. Molecular Pharmacology Fast Forward. Published on December 2, 2004 as DOI: 10.1124/mol.104.007278 at ASPET Journals on November 24, 2018 molpharm.aspetjournals.org Downloaded from
Transcript of Page 1 of 37 - Home | Molecular...
MOL 7278
Page 1 of 37
Title Page
Constitutive Expression of Peroxisome Proliferator-Activated Receptor α−Regulated Genes in
Dwarf Mice
Anja J. Stauber, Holly Brown-Borg, Jie Liu, Michael P. Waalkes, Ashley Laughter, Rebecca A. Staben,
Jaqueline C. Coley, Cynthia Swanson, Kenneth A. Voss, John J. Kopchick and J. Christopher Corton
CIIT Centers for Health Research, Research Triangle Park, NC 27709
Molecular Pharmacology Fast Forward. Published on December 2, 2004 as doi:10.1124/mol.104.007278
Copyright 2004 by the American Society for Pharmacology and Experimental Therapeutics.
This article has not been copyedited and formatted. The final version may differ from this version.Molecular Pharmacology Fast Forward. Published on December 2, 2004 as DOI: 10.1124/mol.104.007278
at ASPE
T Journals on N
ovember 24, 2018
molpharm
.aspetjournals.orgD
ownloaded from
MOL 7278
Page 2 of 37
Running Title Page Running title: PPARα-regulated genes in dwarf mice
To whom correspondence should be addressed: J. Christopher Corton, ToxicoGenomics, 209 Silver Creek Tr., Chapel Hill, NC 27514, USA. Tel.: 919-801-0887; Fax: 919-408-0365; E-mail: [email protected] Number of text pages: 36 Number of tables: 3 Number of figures: 1A,B; 2A,B,C,D,E; 3; 4A,B,C,D; 5A,B,C,D,E; 6A,B,C Number of references: 40 Words in abstract: 221 Words in introduction: 746 Words in discussion: 1303 Supplementary materials: None
ABBREVIATIONS: APP, acute phase response proteins; CTE, cytosolic thioesterase; GHRH, growth
hormone releasing hormone; GHR, growth hormone receptor; MTE, mitochondrial thioesterase; PAGE,
polyacrylamide gel electrophoresis; PBST, phosphate buffered saline plus Tween; PCR, polymerase chain
reaction; PPAR, peroxisome proliferator-activated receptor; PP, peroxisome proliferator; RT, reverse-
transcriptase; RXR, retinoid X receptor; SDS, sodium dodecyl sulfate.
This article has not been copyedited and formatted. The final version may differ from this version.Molecular Pharmacology Fast Forward. Published on December 2, 2004 as DOI: 10.1124/mol.104.007278
at ASPE
T Journals on N
ovember 24, 2018
molpharm
.aspetjournals.orgD
ownloaded from
MOL 7278
Page 3 of 37
ABSTRACT
Defects in growth hormone secretion or signaling in mice are associated with decreased body weights
(dwarfism), increased longevity, increased resistance to stress and decreases in factors which contribute to
cardiovascular disease and cancer. Peroxisome proliferators (PP) alter a subset of these changes in wild-
type mice through activation of the nuclear receptor family member, PP-activated receptor α (PPARα).
We tested the hypothesis that an overlap in the transcriptional programs between untreated dwarf mice
and PP-treated wild-type mice underlies these similarities. Using transcript profiling, we observed a
statistically significant overlap in the expression of genes differentially regulated in control Snell dwarf
mice (Pit-1dw) compared to phenotypically normal heterozygote (+/dw) controls and those altered by the
PP, WY-14,643 in +/dw mice. The genes included those involved in β- and ω-oxidation of fatty acids
(Acox1, Cyp4a10, Cyp4a14) and those involved in stress responses (the chaperonin, T-complex
protein1ε) and cardiovascular disease (fibrinogen). The levels of some of these gene products were also
altered in other dwarf mouse models including Ames, Little and growth hormone receptor-null mice. The
constitutive increases in PPARα-regulated genes may be partly due to increased expression of PPARα
mRNA and protein as observed in the livers of control Snell dwarf mice. These results indicate that some
of the beneficial effects associated with the dwarf phenotype may be due to constitutive activation of
PPARα and regulated genes.
This article has not been copyedited and formatted. The final version may differ from this version.Molecular Pharmacology Fast Forward. Published on December 2, 2004 as DOI: 10.1124/mol.104.007278
at ASPE
T Journals on N
ovember 24, 2018
molpharm
.aspetjournals.orgD
ownloaded from
MOL 7278
Page 4 of 37
Introduction
The peroxisome proliferator-activated receptors (PPAR) are members of the nuclear receptor
superfamily and are activated by a structurally diverse group of compounds. Many of these compounds
increase the size and number of peroxisomes and are thus called peroxisome proliferators (PP). The three
PPAR subtypes (α,β/δ,γ) have unique tissue distributions and ligand-specificities. In rodents, PP elicit a
predictable course of adaptive responses in the liver, including peroxisome proliferation, induction of
lipid-metabolizing genes, and hepatomegaly (Corton et al., 2000). There is overwhelming evidence that
PPARα mediates most, if not all of these effects in the rodent liver (Lee et al., 1995; Klaunig et al., 2003).
Growth hormone plays an essential role in maintaining cellular and tissue homeostasis. Many PP-
regulated genes are under control of growth hormone. Hypophysectomization of female rats enhanced
expression of PP-inducible proteins that was reversed by growth hormone infusion (Sugiyama et al.,
1994). STAT5b, a growth hormone-inducible transcription factor inhibited the ability of PPARα to
activate PPARα-dependent reporter gene transcription by endogenous or xenobiotic PP in vitro (Zhou and
Waxman, 1999a,b). STAT5b-null mice expressed higher levels of some PPARα-regulated gene products
involved in lipid metabolism (Zhou et al., 2002). These studies provide evidence that growth hormone
negatively regulates PPARα in the intact animal through activation of STAT5b.
Strains of dwarf mice have lower circulating levels of growth hormone or defects in growth
hormone signaling (Tatar et al., 2003). Snell dwarf mice carry a mutation in the Pit1 gene (Pit1dw)
required for development of pituitary cell bodies which produce growth hormone, prolactin, and thyroid
stimulating hormone (TSH). The levels of these hormones are virtually undetectable in these mice. Ames
dwarf mice are homozygous for the df mutation on the Prophet of Pit-1 gene (Prop1df), a transcription
factor controlling expression of Pit1. Ames mice have very low levels of circulating growth hormone,
prolactin and TSH. “Little” mice carry a mutation in the growth hormone releasing hormone receptor
(Ghrhr) gene and mice homozygous for the Ghrhrlit mutation cannot respond to hypothalamic GHRH.
This article has not been copyedited and formatted. The final version may differ from this version.Molecular Pharmacology Fast Forward. Published on December 2, 2004 as DOI: 10.1124/mol.104.007278
at ASPE
T Journals on N
ovember 24, 2018
molpharm
.aspetjournals.orgD
ownloaded from
MOL 7278
Page 5 of 37
Little mice have ~5% of normal levels of circulating growth hormone. Inactivation of the growth
hormone receptor/binding protein (Ghr) by homologous recombination results in a dwarf mouse unable to
respond to growth hormone (Zhou et al., 1997). Dwarf mice live significantly longer than their
heterozygous littermates maintained under the same conditions (Tatar et al., 2003).
Dwarf mice share phenotypic similarities with PP-treated rodent models. Compared to their
heterozygote counterparts, Ames dwarf mice had decreased circulating cholesterol, triglycerides (Brown-
Borg, unpublished), insulin and glucose levels (Borg et al., 1995) whereas growth hormone increased
triglyceride and cholesterol levels in wild-type mice (Marmary et al., 1999). PPARα agonists have been
used clinically for many years to lower cholesterol and triglyceride levels in patients at risk of coronary
heart disease (Corton et al., 2000). Snell dwarf mice had decreased incidences and severities of
dimethylbenzanthracene-induced skin papillomas (Bielschowsky and Bielschowsky, 1961) and sarcoma
180 (Rennels et al., 1965). Ames dwarf mice had decreased numbers and severity grade of spontaneous
lung adenocarcinomas (Ikeno et al., 2003), and the Little dwarf mutation suppressed spontaneous liver
tumors in the susceptible C3H/HeJ strain (Bugni et al., 2001). In contrast to the well-known effects of
strong PP on induction of liver cancer (Klaunig et al., 2003), PPARα agonists suppressed certain types of
diethylnitrosamine-induced preneoplastic foci in the rat liver (Cattley and Popp, 1989) as well as skin
cancer in mice (Thuiller et al., 2000). PPARα-null mice had a higher incidence of spontaneous
hepatocellular adenomas and carcinomas than wild-type mice (Howroyd et al., 2004). Snell dwarf mouse
fibroblasts exhibited increased resistance to diverse physical and chemical stressors (Murakami et al.,
2003). Likewise, either pretreatment with PPARα agonists in wild-type mice or an intact PPARα gene
itself (compared to PPARα-null mice) protected the livers of mice from chemical or physical stress
(Mehendale, 2000; Anderson et al., 2002). One explanation for this phenotypic overlap is that dwarf mice
have an increased level of PPARα-regulated gene expression. Although there is clear evidence that
STAT5b-null mice express higher levels of PPARα-regulated gene products (Zhou et al., 2002), the effect
This article has not been copyedited and formatted. The final version may differ from this version.Molecular Pharmacology Fast Forward. Published on December 2, 2004 as DOI: 10.1124/mol.104.007278
at ASPE
T Journals on N
ovember 24, 2018
molpharm
.aspetjournals.orgD
ownloaded from
MOL 7278
Page 6 of 37
of mutations in other genes that control growth hormone secretion and signaling on PPARα-regulated
gene expression is not known.
We posed the hypothesis that the overlap in the phenotypic characteristics of PP-treated rodents
and dwarf mutations has at its basis an overlap in the transcriptional programs regulated by PPARα. We
tested this hypothesis by examining transcript profiles in the livers of control and PP-treated wild-type
and Snell dwarf mice. Our analysis of a number of transcriptional and post-transcriptional targets
demonstrated that the overlap includes PPARα-dependent genes with functions in lipid metabolism, stress
responses and cardiovascular disease.
Materials and Methods
Animal Treatments. This study was conducted under federal guidelines for the use and care of
laboratory animals and was approved by the Institutional Animal Care and Use Committees for CIIT
Centers for Health Research. Male mice were used throughout these studies. Nine week old DW/J-
Pit1dw/dwln/ln homozygous (dw/dw) Snell dwarf, DW/J-Pit1+/dwln/ln heterozygous (+/dw), C57BL/6J-
Ghrhrlit homozygous (lit/lit) Little dwarf or heterozygous (+/lit) mice were purchased from Jackson Labs
(Bar Harbor, ME). Wild-type and PPARα-null mice on a SV129 background, ~12 weeks of age were
from a colony established at CIIT. Control and treated mice were provided with NIH-07 rodent chow
(Ziegler Brothers, Gardner, PA) and deionized filtered water ad libitum. Lighting was on a 12-hr
light/dark cycle. Snell dwarf and heterozygous mice were given a single gavage dose of WY-14,643
(ChemSyn Science Laboratories, Lenexa, KS) at a concentration of 50 mg/kg body weight in
methylcellulose vehicle (0.1%) and sacrificed 12 h later. Snell, Little mice and their heterozygous
controls were given gavage doses (50 mg/kg body weight) each day for 3 days with sacrifice 24 h after
the last dose. Controls were dosed with methylcellulose (0.1%) vehicle alone. In separate experiments,
wild-type and PPARα-null mice were fed a control diet or a diet containing WY-14,643 in the diet (500
This article has not been copyedited and formatted. The final version may differ from this version.Molecular Pharmacology Fast Forward. Published on December 2, 2004 as DOI: 10.1124/mol.104.007278
at ASPE
T Journals on N
ovember 24, 2018
molpharm
.aspetjournals.orgD
ownloaded from
MOL 7278
Page 7 of 37
ppm) for one week. At the designated time after treatment (12, 72 hours or 1 week) mice were deeply
anesthetized by pentobarbital injection and killed by exsanguination. The livers were removed, rinsed
with isotonic saline, snap-frozen in liquid nitrogen and stored at -70°C until analysis.
Ames dwarf (Prop1df) mice, ~16 wks of age, and GHR-null mice, ~12-16 wks of age and
corresponding groups of age-matched heterozygote (+/df) or wild type mice were maintained at the
University of North Dakota (UND) (Brown-Borg and Rakoczy, 2000) or Ohio University (Zhou et al.,
1997) vivarium facilities. All procedures involving animals were reviewed and approved by the
appropriate Institutional Animal Care and Use Committees.
Analysis of Gene Expression by Gene Arrays. Because we were initially interested in effects of
dwarf mutations on the ability of PPARα to regulate endpoints associated with liver cancer (Styles et al.,
1990), we utilized the Clontech Atlas 1.2 Cancer arrays containing 1178 genes with direct or indirect
involvement in cancer. Total RNA was isolated by modification of guanidium isothiocyanate method
using RNA Stat60 according to the manufacturer's instructions (Tel-Test, Friendswood, TX). 32P-labeled
first-strand cDNA was generated by reverse transcribing poly A+ RNA in the presence of oligo-dT
primers. 32P-labeled cDNA was purified using ProbeQuant G-50 Micro Columns (Amersham Pharmacia
Biotech, Piscataway, NJ). Membranes were pre-hybridized with salmon testes DNA to block non-specific
binding of probe to the membrane. Labeled probes were denatured and incubated with Cot-1 DNA to
block repetitive sequences and subsequently neutralized prior to adding to the membrane. Labeled probe
from each of 12 samples (3 mice in each of 4 groups) representing approximately 2-5 x 10⁶ cpm was
incubated with a separate but identical array overnight at 68° C. Membranes were heat-sealed in Seal-A-
Meal® bags and exposed to Phosphorimager autoradiography cassettes for 24 h. Macroarray imaging was
performed using the Molecular Imaging System (Bio-Rad). Macroarray data analysis was performed
using Atlas Image 1.5 software (Clontech) to determine levels of alterations in gene expression. Local
This article has not been copyedited and formatted. The final version may differ from this version.Molecular Pharmacology Fast Forward. Published on December 2, 2004 as DOI: 10.1124/mol.104.007278
at ASPE
T Journals on N
ovember 24, 2018
molpharm
.aspetjournals.orgD
ownloaded from
MOL 7278
Page 8 of 37
background-subtracted spot intensities (Int) were log2 transformed. The transformed data were then fitted
to the following ANOVA-type model:
ijkikkijijkijk IntY ∑++== δξβ )()(log2
where I represents the ith strain/treatment, j represents the jth replicate of a strain/treatment and k
represents the kth gene on the array. In the initial stage, trend effects ( ξk) are removed by local regression
(Kepler et al., 2002), which assumes that the expression of most genes is not changed from treatment to
treatment. Genes with low “between treatment variation” (i.e. variance of the gene across all replicates of
all treatments) compared to the “within treatment variation” (i.e. variance of the replicates of a single
treatment) are selected iteratively to create a “not changed” population (i.e. high ‘within treatment
variation’ genes). It is assumed that the “between treatment effect” for genes in this population
approximates zero. The entire population is then normalized based on this selected subset and the overall
treatment effect (δik) is calculated. The entire modeling process repeats (in cyclical fashion) until a stable,
recurring set of “not changed” genes is obtained. For this ANOVA-type model, the interaction term (βij
(ξk)) considers the “array effect” and “gene effect” to be related; thus it is non-parametric. The threshold
for significance was set at p < 0.005 and genes which exhibited a >1.5-fold or <-1.5-fold were reported as
a log2 fold-change relative to the control. Regulated genes were visualized using CLUSTER and
TreeView (Eisen et al., 1998). Spearman rank correlation test of the regulated genes was performed using
SAS (v6.12, SAS Institute, Research Triangle Park, NC).
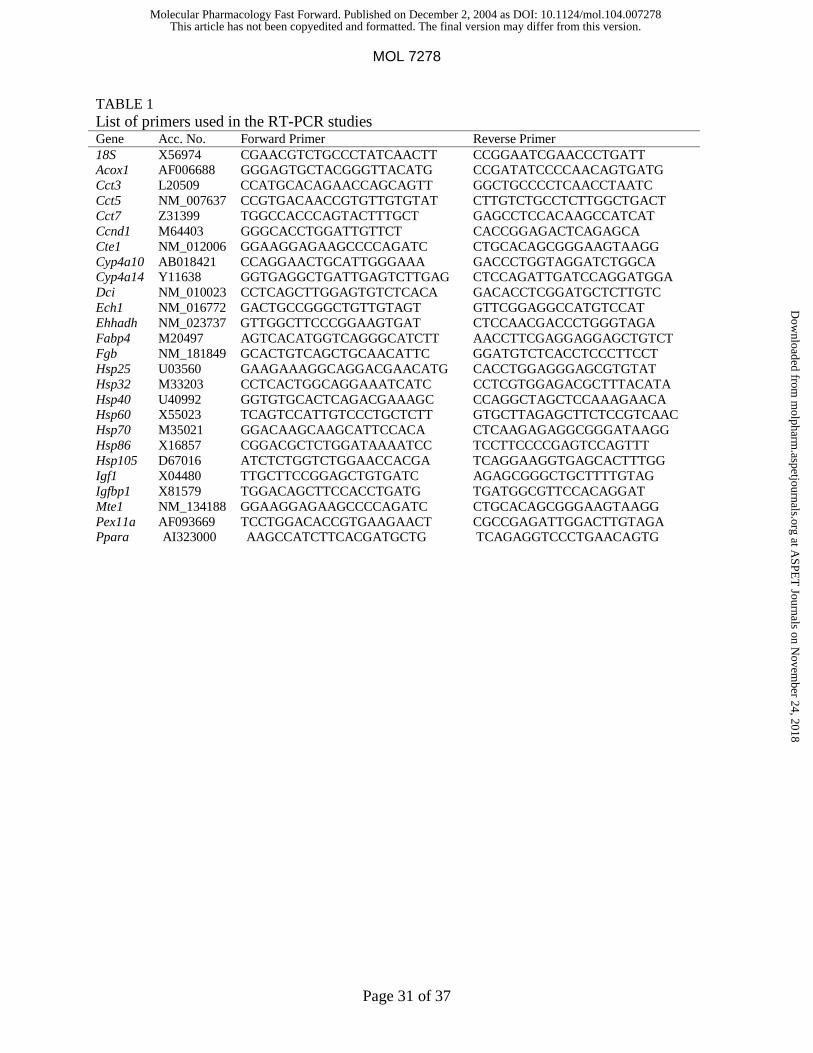
Real-time RT-PCR Analysis. Expression levels of selected genes were quantified using real-
time RT-PCR analysis. Briefly, total RNA was extracted as described above, purified with RNeasy
column and on-column DNase I digestion (Qiagen, Valencia, CA). Purified total RNA was reverse
transcribed with MuLV reverse transcriptase and oligo-dT primers. The forward and reverse primers
(Table 1) were designed using Primer Express software, v2.0 (Applied Biosystems, Foster City, CA). The
This article has not been copyedited and formatted. The final version may differ from this version.Molecular Pharmacology Fast Forward. Published on December 2, 2004 as DOI: 10.1124/mol.104.007278
at ASPE
T Journals on N
ovember 24, 2018
molpharm
.aspetjournals.orgD
ownloaded from
MOL 7278
Page 9 of 37
SYBR green PCR master mix (Applied Biosystems, Foster City, CA) was used for real-time PCR
analysis. The dissociation curve (melting curve) for each gene was performed to verify the quality of the
primers. The standard curve for each gene was performed to quantify the gene expression. The
expressions of genes were first normalized with 18S ribosomal RNA gene of the same sample, and then
the relative differences between control and treatment groups were calculated and expressed as relative
increases setting the control as 100%.
Analysis of Palmitoyl-CoA Oxidase Activity. Analysis of palmitoyl-CoA oxidase activity was
determined using the procedures in Sausen et al. (1995). Liver from the left lobe was used to prepare 20%
homogenates in 50 mM Tris-HCl, 154 mM KCl, pH 7.2. Homogenates were prepared on the day of
enzyme assays by centrifugation at 2500g for 10 min. Palmitoyl-CoA oxidase activity was assayed by
measurement of hydrogen peroxide production in the presence of 25 µM palmitoyl-CoA. Enzyme activity
was normalized per g of protein.
Western Analysis. Liver lysates were prepared in 250mM sucrose, 10mM Tris-HCl, pH 7.4,
1mM EDTA with protease inhibitors (0.2mM PMSF, 0.1% aprotinin, 1µg/ml pepstatin, 1µg/ml
leupeptin). Fifty µg of whole cell lysate was subjected to 12% SDS-PAGE followed by transfer to
nitrocellulose membranes. Immunoblots were developed using primary antibodies against acyl-CoA
oxidase (ACO) (a gift from Dr. S. Alexson, Huddinge University Hospital, Huddinge, Sweden), MFP-I,
MFP-II and thiolase (gifts from Dr. Hashimoto, Japan), Cyp4a (GenTest, Waltham, MA), PPARα
(Affinity Bioreagents, Inc., Golden, CO), T-complex protein1ε and other chaperones and chaperonins
(Stress Gen, Victoria, British Columbia), and α1-antitrypsin and fibrinogen (Affinity Biologicals, South
Bend, IN) followed by appropriate secondary antibodies conjugated with HRP (Santa Cruz
Biotechnology, Santa Cruz, CA) in the presence of chemiluminescent substrate ECL (Amersham
Biosciences, Piscataway, NJ). Cyp4a antibody likely recognizes multiple members of the Cyp4a family
This article has not been copyedited and formatted. The final version may differ from this version.Molecular Pharmacology Fast Forward. Published on December 2, 2004 as DOI: 10.1124/mol.104.007278
at ASPE
T Journals on N
ovember 24, 2018
molpharm
.aspetjournals.orgD
ownloaded from
MOL 7278
Page 10 of 37
(Cyp4a10, Cyp4a12, Cyp4a14). MFP-I likely recognizes multiple forms of the MFP-I complex including
protein products encoded by Dci, Ech1 and Ehhadh. MFP-II was raised against the product of the gene
Hsd17b4. Blots were quantitated densitometrically (BioRad Imaging Densitometer and Molecular
Analyst software) following exposure of the membrane to X-ray film.
Statistical Analysis of Data. Means and SEM (n = 3-4) for RT-PCR data were calculated by the
Students' t-test. The level of significance was set at p < 0.05. The expression ratios between WY-14,643-
treatment and controls, between dwarf mice and heterozygote mice were used for comparisons. For
western data, a two-way ANOVA was used to determine statistical significance (p < 0.05). Students’ t-
tests were utilized for comparisons within genotype when significant interactions were detected between
genotype and treatment. Spearman rank correlation test was performed using SAS (SAS v6.12, SAS
Institute, Research Triangle Park, NC).
This article has not been copyedited and formatted. The final version may differ from this version.Molecular Pharmacology Fast Forward. Published on December 2, 2004 as DOI: 10.1124/mol.104.007278
at ASPE
T Journals on N
ovember 24, 2018
molpharm
.aspetjournals.orgD
ownloaded from
MOL 7278
Page 11 of 37
Results
The pit-1dw Mutation Results in Constitutive Increases in a Subset of WY-14,643-responsive
Genes. We used transcript profiling to gain insight into the underlying gene expression patterns that may
explain phenotypic similarities between dwarf mice and PP-treated heterozygote mice. Heterozygous
(+/dw) and homozygous (dw/dw) Snell dwarf mice were treated with the PP, WY-14,643 or
methylcellulose carrier and sacrificed 12 hrs later. The livers were examined for gene expression using
the Atlas mouse cancer 1.2 arrays containing 1178 genes. Genes with a p value < 0.005 and > 1.5-fold or
< -1.5-fold were reported as a log2 fold-change relative to the respective controls. Regulated genes were
visualized using CLUSTER and TreeView programs (Eisen et al., 1998) using two-dimensional
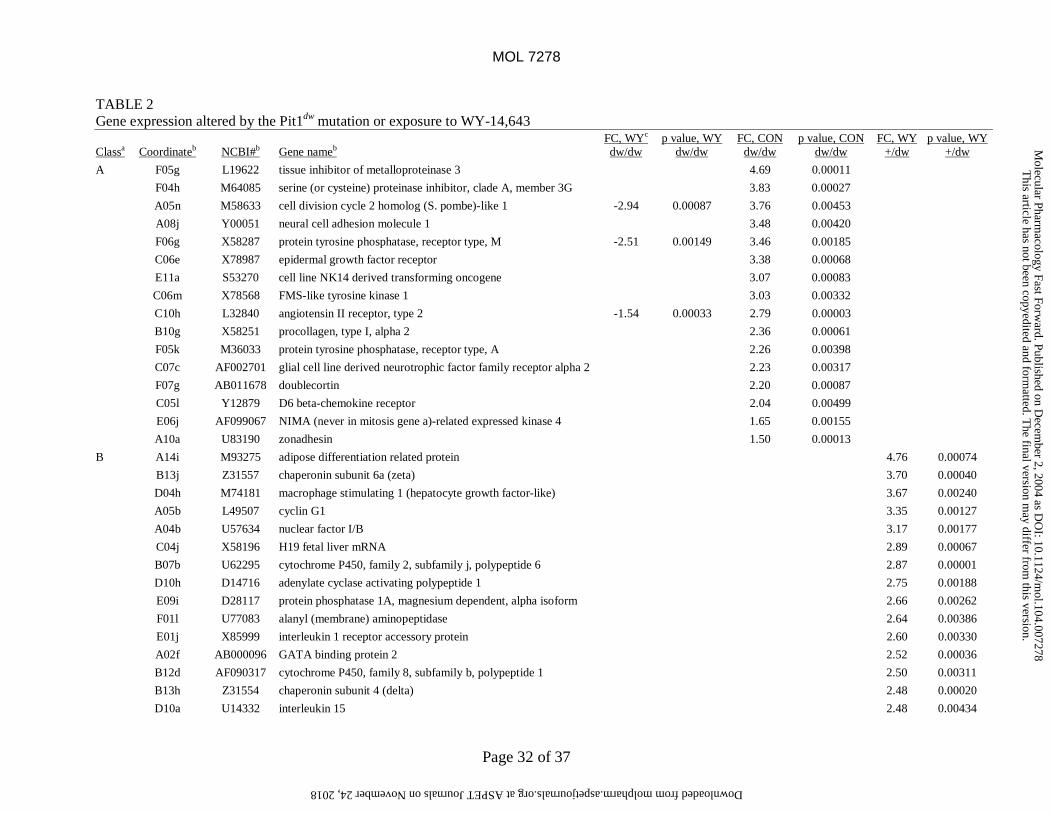
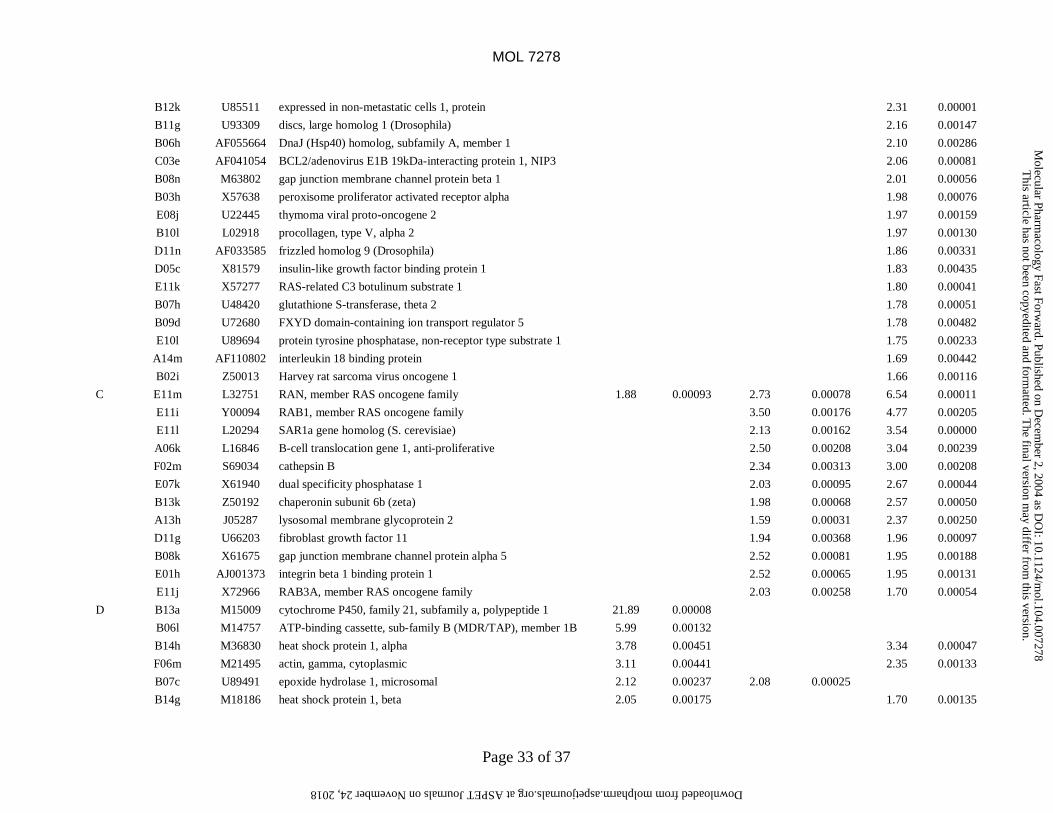
clustering. Fig. 1A shows the 111 genes with significant changes in one or more groups. The regulated
genes were divided into groups (A-H) based on expression behavior differences. Although the Atlas
mouse cancer arrays do not contain typical markers of PPARα activation such as genes involved in fatty
acid β-oxidation, the genes regulated by WY-14,643 in the +/dw mice vs. control +/dw mice (Fig. 1A,
Groups B-D, F, G) included genes or their products regulated by PP in other studies. These genes were
cathepsin B (Conway et al., 1989), adipose differentiation related protein (Liu et al., 2003), as well as
PPARα itself (Sterchele et al., 1996) (Table 2). WY-14,643 exposure in +/dw mice also led to increased
expression of chaperones (Hsp86 and Hsp84) and chaperonin genes (chaperonin subunits 4 (delta), 6a
(zeta), 6b (zeta), 7 (eta)). We showed in recent studies that PP exposure increases expression of a large
number of genes in wild-type mice that maintain the health of the proteome including Hsp86 and
chaperonin subunits (Anderson et al., s2004).
The dw mutation itself resulted in the altered regulation of a total of 41 genes found within
Groups A, C, G and H (Fig. 1A). Using GenBank numbers as unique identifiers, we compared our list of
genes with the genes identified as different in 6 month old dw/dw mice compared to wild-type controls
using a similar array platform (Dozmorov et al., 2002). Only 4 of the genes identified in the previous
This article has not been copyedited and formatted. The final version may differ from this version.Molecular Pharmacology Fast Forward. Published on December 2, 2004 as DOI: 10.1124/mol.104.007278
at ASPE
T Journals on N
ovember 24, 2018
molpharm
.aspetjournals.orgD
ownloaded from
MOL 7278
Page 12 of 37
study (insulin receptor, interleukin 15, Cyp1a1 and insulin-like binding protein 1) were altered in one of
the three comparisons in our study. None of these genes was significantly altered in the control dw/dw vs.
control +/dw mice in our study; however, insulin-like binding protein 1 (Igf1bp1) was up-regulated in
control dw/dw vs. control +/dw mice (~2-fold; p = 0.034) but did not pass the statistical cut-off. Igf1bp1
was found by RT-PCR to be induced in control dw/dw mice (Table 3). The fact that there was no overlap
in the two studies could be due to differences in animal husbandry and age of mice (9 wks vs. 6 mo.).
Hierarchical clustering of the compared groups showed that the control dw/dw pattern was more
similar to that of the WY-14,643-treated +/dw pattern than that of the pattern of WY-14,643-treated
dw/dw mice (Fig. 1A). We used Spearman correlation to determine the statistical significance of
similarities between groups. The control dw/dw pattern was more similar to WY-14,643 +/dw pattern
(0.216, p = 0.023) than the WY-14,643 dw/dw pattern (-0.013; p = 0.892). This similarity was driven
primarily by 16 out of 40 genes (40%) similarly regulated in control dw/dw and WY-14,643-treated +/dw
mice. These included 12 up-regulated (Group C) and 4 down-regulated (Group G) genes (Fig. 1B). The
genes included down-regulation of receptors for interleukin-1 and interferon γ (Fig. 1, group G) predicted
to decrease responsiveness to these inflammatory mediators. These data indicate that control dw/dw mice
constitutively express genes that are also regulated by WY-14,643 in +/dw mice.
The WY-14,643 +/dw and WY-14,643 dw/dw patterns exhibited similarity that approached
significance (0.179; p = 0.06). WY-14,643 treatment in dw/dw mice did little to further alter the
expression of most of the overlapping genes regulated in dw/dw mice. However, two genes up-regulated
in control dw/dw mice (epoxide hydrolase 1, microsomal and RAN) were further up-regulated by WY-
14,643 while three genes up-regulated in control dw/dw mice (angiotensin II receptor, type 2; protein
tyrosine phosphatase, receptor type, M; cell division cycle 2 homolog (S. pombe)-like 1) were down-
regulated by WY-14,643, indicating more complex control by the Pit-1dw gene and WY-14,643.
Given the overlap in the transcript profiles of control dw/dw and WY-14,643 in +/dw, we
determined the mRNA expression of known PPARα-regulated genes in the livers of +/dw and dw/dw
This article has not been copyedited and formatted. The final version may differ from this version.Molecular Pharmacology Fast Forward. Published on December 2, 2004 as DOI: 10.1124/mol.104.007278
at ASPE
T Journals on N
ovember 24, 2018
molpharm
.aspetjournals.orgD
ownloaded from
MOL 7278
Page 13 of 37
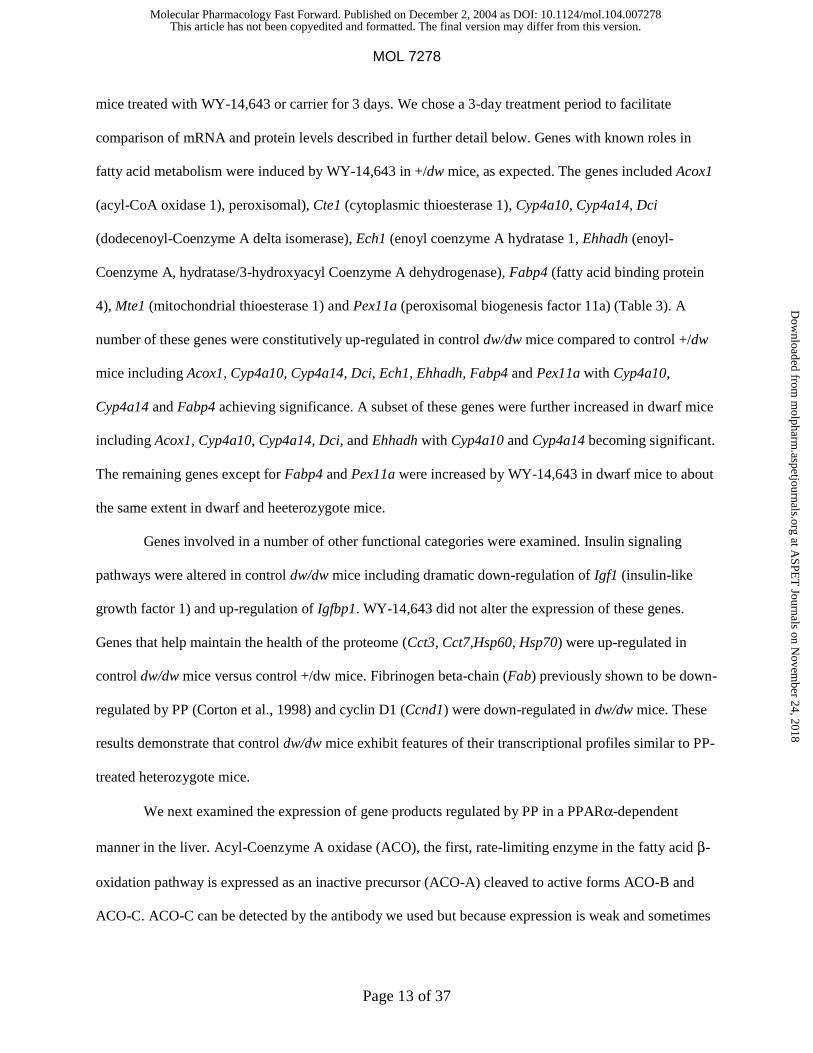
mice treated with WY-14,643 or carrier for 3 days. We chose a 3-day treatment period to facilitate
comparison of mRNA and protein levels described in further detail below. Genes with known roles in
fatty acid metabolism were induced by WY-14,643 in +/dw mice, as expected. The genes included Acox1
(acyl-CoA oxidase 1), peroxisomal), Cte1 (cytoplasmic thioesterase 1), Cyp4a10, Cyp4a14, Dci
(dodecenoyl-Coenzyme A delta isomerase), Ech1 (enoyl coenzyme A hydratase 1, Ehhadh (enoyl-
Coenzyme A, hydratase/3-hydroxyacyl Coenzyme A dehydrogenase), Fabp4 (fatty acid binding protein
4), Mte1 (mitochondrial thioesterase 1) and Pex11a (peroxisomal biogenesis factor 11a) (Table 3). A
number of these genes were constitutively up-regulated in control dw/dw mice compared to control +/dw
mice including Acox1, Cyp4a10, Cyp4a14, Dci, Ech1, Ehhadh, Fabp4 and Pex11a with Cyp4a10,
Cyp4a14 and Fabp4 achieving significance. A subset of these genes were further increased in dwarf mice
including Acox1, Cyp4a10, Cyp4a14, Dci, and Ehhadh with Cyp4a10 and Cyp4a14 becoming significant.
The remaining genes except for Fabp4 and Pex11a were increased by WY-14,643 in dwarf mice to about
the same extent in dwarf and heeterozygote mice.
Genes involved in a number of other functional categories were examined. Insulin signaling
pathways were altered in control dw/dw mice including dramatic down-regulation of Igf1 (insulin-like
growth factor 1) and up-regulation of Igfbp1. WY-14,643 did not alter the expression of these genes.
Genes that help maintain the health of the proteome (Cct3, Cct7,Hsp60, Hsp70) were up-regulated in
control dw/dw mice versus control +/dw mice. Fibrinogen beta-chain (Fab) previously shown to be down-
regulated by PP (Corton et al., 1998) and cyclin D1 (Ccnd1) were down-regulated in dw/dw mice. These
results demonstrate that control dw/dw mice exhibit features of their transcriptional profiles similar to PP-
treated heterozygote mice.
We next examined the expression of gene products regulated by PP in a PPARα-dependent
manner in the liver. Acyl-Coenzyme A oxidase (ACO), the first, rate-limiting enzyme in the fatty acid β-
oxidation pathway is expressed as an inactive precursor (ACO-A) cleaved to active forms ACO-B and
ACO-C. ACO-C can be detected by the antibody we used but because expression is weak and sometimes
This article has not been copyedited and formatted. The final version may differ from this version.Molecular Pharmacology Fast Forward. Published on December 2, 2004 as DOI: 10.1124/mol.104.007278
at ASPE
T Journals on N
ovember 24, 2018
molpharm
.aspetjournals.orgD
ownloaded from
MOL 7278
Page 14 of 37
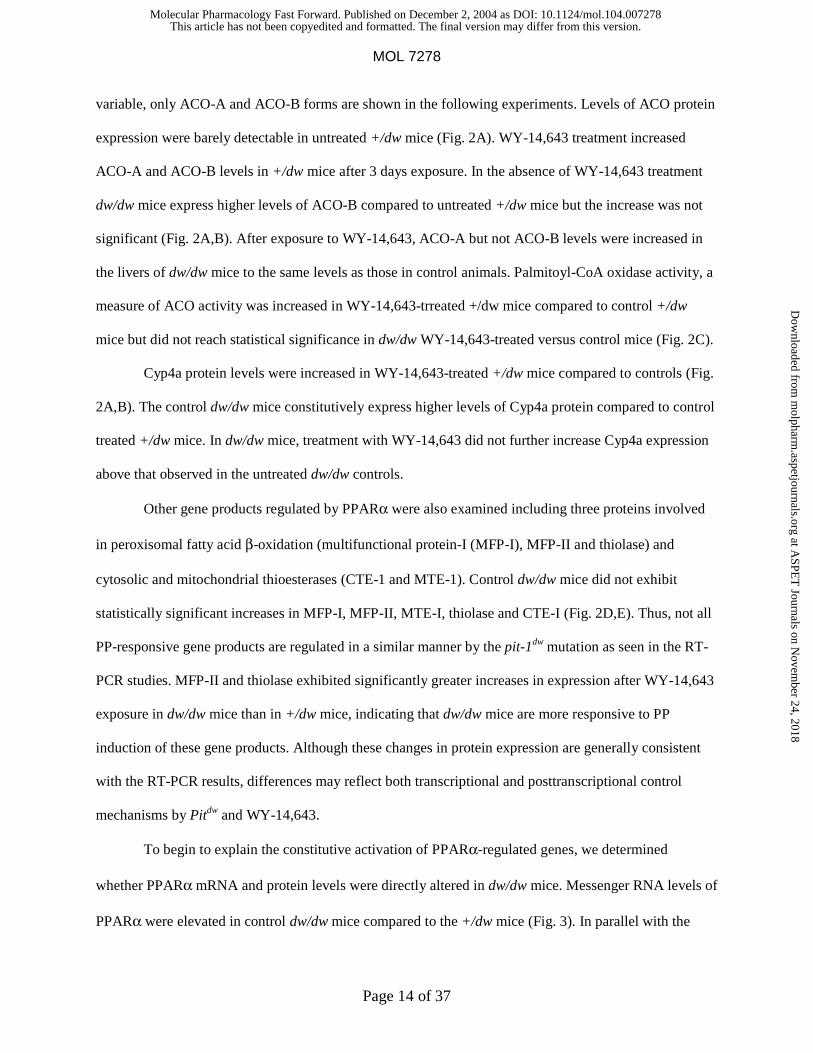
variable, only ACO-A and ACO-B forms are shown in the following experiments. Levels of ACO protein
expression were barely detectable in untreated +/dw mice (Fig. 2A). WY-14,643 treatment increased
ACO-A and ACO-B levels in +/dw mice after 3 days exposure. In the absence of WY-14,643 treatment
dw/dw mice express higher levels of ACO-B compared to untreated +/dw mice but the increase was not
significant (Fig. 2A,B). After exposure to WY-14,643, ACO-A but not ACO-B levels were increased in
the livers of dw/dw mice to the same levels as those in control animals. Palmitoyl-CoA oxidase activity, a
measure of ACO activity was increased in WY-14,643-trreated +/dw mice compared to control +/dw
mice but did not reach statistical significance in dw/dw WY-14,643-treated versus control mice (Fig. 2C).
Cyp4a protein levels were increased in WY-14,643-treated +/dw mice compared to controls (Fig.
2A,B). The control dw/dw mice constitutively express higher levels of Cyp4a protein compared to control
treated +/dw mice. In dw/dw mice, treatment with WY-14,643 did not further increase Cyp4a expression
above that observed in the untreated dw/dw controls.
Other gene products regulated by PPARα were also examined including three proteins involved
in peroxisomal fatty acid β-oxidation (multifunctional protein-I (MFP-I), MFP-II and thiolase) and
cytosolic and mitochondrial thioesterases (CTE-1 and MTE-1). Control dw/dw mice did not exhibit
statistically significant increases in MFP-I, MFP-II, MTE-I, thiolase and CTE-I (Fig. 2D,E). Thus, not all
PP-responsive gene products are regulated in a similar manner by the pit-1dw mutation as seen in the RT-
PCR studies. MFP-II and thiolase exhibited significantly greater increases in expression after WY-14,643
exposure in dw/dw mice than in +/dw mice, indicating that dw/dw mice are more responsive to PP
induction of these gene products. Although these changes in protein expression are generally consistent
with the RT-PCR results, differences may reflect both transcriptional and posttranscriptional control
mechanisms by Pitdw and WY-14,643.
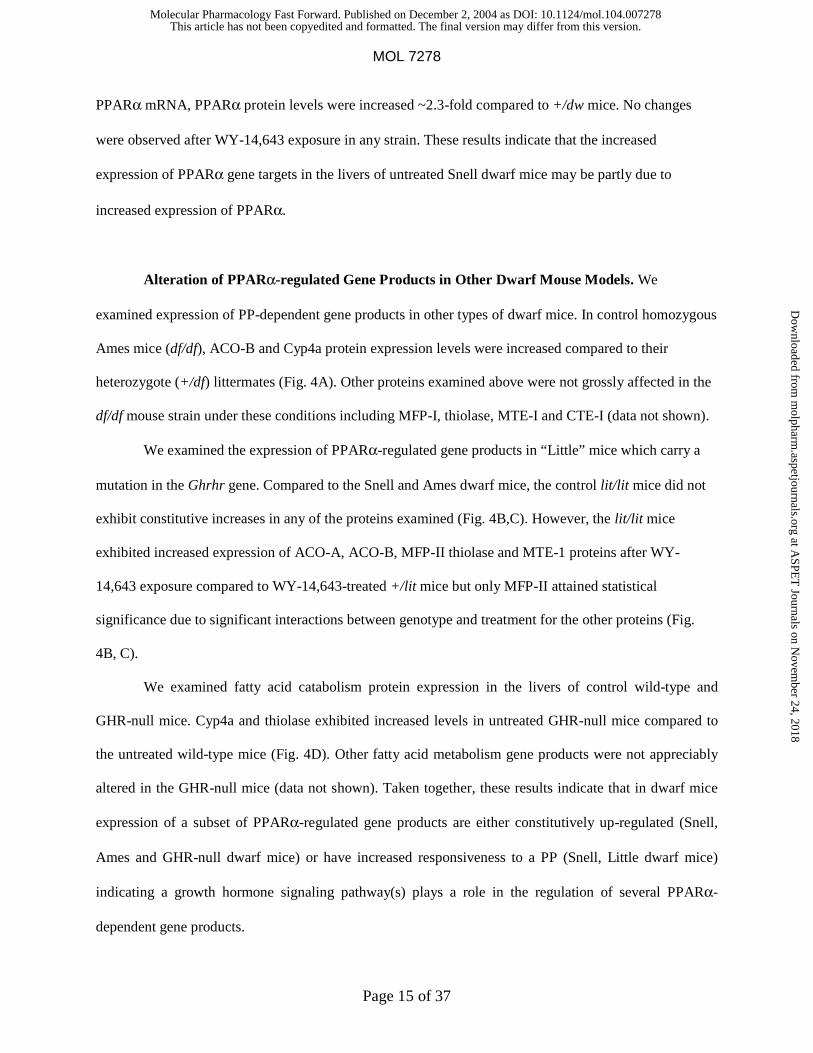
To begin to explain the constitutive activation of PPARα-regulated genes, we determined
whether PPARα mRNA and protein levels were directly altered in dw/dw mice. Messenger RNA levels of
PPARα were elevated in control dw/dw mice compared to the +/dw mice (Fig. 3). In parallel with the
This article has not been copyedited and formatted. The final version may differ from this version.Molecular Pharmacology Fast Forward. Published on December 2, 2004 as DOI: 10.1124/mol.104.007278
at ASPE
T Journals on N
ovember 24, 2018
molpharm
.aspetjournals.orgD
ownloaded from
MOL 7278
Page 15 of 37
PPARα mRNA, PPARα protein levels were increased ~2.3-fold compared to +/dw mice. No changes
were observed after WY-14,643 exposure in any strain. These results indicate that the increased
expression of PPARα gene targets in the livers of untreated Snell dwarf mice may be partly due to
increased expression of PPARα.
Alteration of PPARα-regulated Gene Products in Other Dwarf Mouse Models. We
examined expression of PP-dependent gene products in other types of dwarf mice. In control homozygous
Ames mice (df/df), ACO-B and Cyp4a protein expression levels were increased compared to their
heterozygote (+/df) littermates (Fig. 4A). Other proteins examined above were not grossly affected in the
df/df mouse strain under these conditions including MFP-I, thiolase, MTE-I and CTE-I (data not shown).
We examined the expression of PPARα-regulated gene products in “Little” mice which carry a
mutation in the Ghrhr gene. Compared to the Snell and Ames dwarf mice, the control lit/lit mice did not
exhibit constitutive increases in any of the proteins examined (Fig. 4B,C). However, the lit/lit mice
exhibited increased expression of ACO-A, ACO-B, MFP-II thiolase and MTE-1 proteins after WY-
14,643 exposure compared to WY-14,643-treated +/lit mice but only MFP-II attained statistical
significance due to significant interactions between genotype and treatment for the other proteins (Fig.
4B, C).
We examined fatty acid catabolism protein expression in the livers of control wild-type and
GHR-null mice. Cyp4a and thiolase exhibited increased levels in untreated GHR-null mice compared to
the untreated wild-type mice (Fig. 4D). Other fatty acid metabolism gene products were not appreciably
altered in the GHR-null mice (data not shown). Taken together, these results indicate that in dwarf mice
expression of a subset of PPARα-regulated gene products are either constitutively up-regulated (Snell,
Ames and GHR-null dwarf mice) or have increased responsiveness to a PP (Snell, Little dwarf mice)
indicating a growth hormone signaling pathway(s) plays a role in the regulation of several PPARα-
dependent gene products.
This article has not been copyedited and formatted. The final version may differ from this version.Molecular Pharmacology Fast Forward. Published on December 2, 2004 as DOI: 10.1124/mol.104.007278
at ASPE
T Journals on N
ovember 24, 2018
molpharm
.aspetjournals.orgD
ownloaded from
MOL 7278
Page 16 of 37
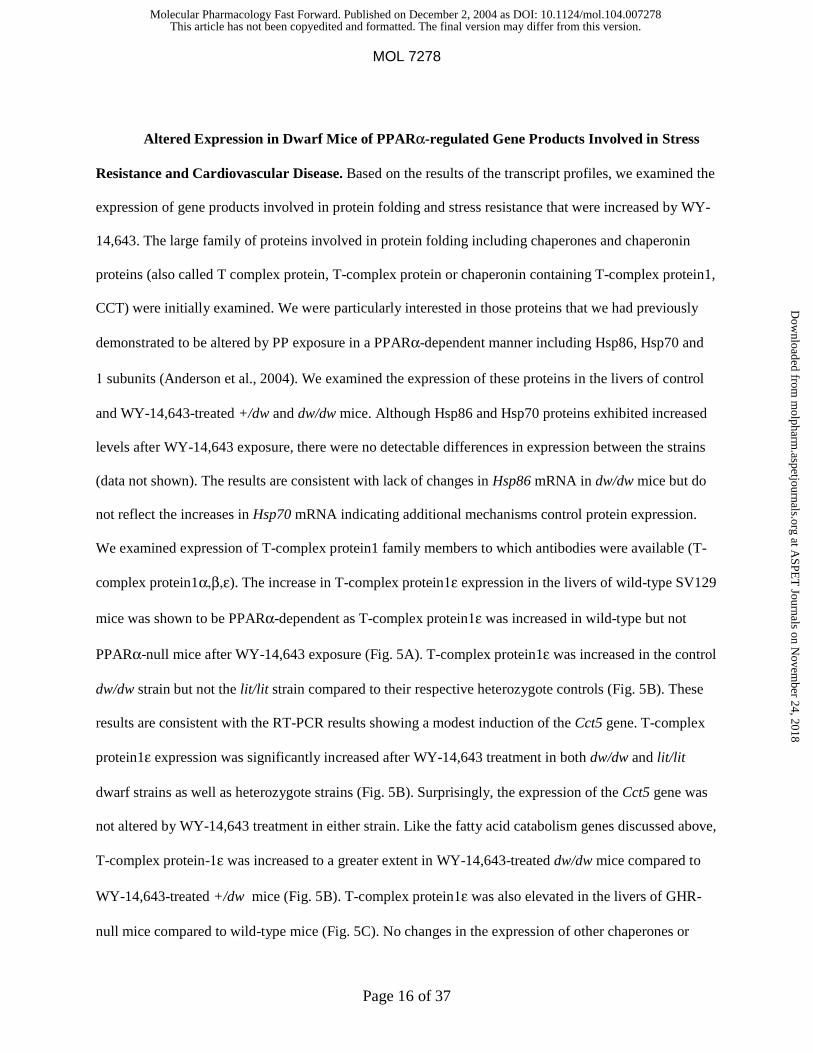
Altered Expression in Dwarf Mice of PPARα-regulated Gene Products Involved in Stress
Resistance and Cardiovascular Disease. Based on the results of the transcript profiles, we examined the
expression of gene products involved in protein folding and stress resistance that were increased by WY-
14,643. The large family of proteins involved in protein folding including chaperones and chaperonin
proteins (also called T complex protein, T-complex protein or chaperonin containing T-complex protein1,
CCT) were initially examined. We were particularly interested in those proteins that we had previously
demonstrated to be altered by PP exposure in a PPARα-dependent manner including Hsp86, Hsp70 and
1 subunits (Anderson et al., 2004). We examined the expression of these proteins in the livers of control
and WY-14,643-treated +/dw and dw/dw mice. Although Hsp86 and Hsp70 proteins exhibited increased
levels after WY-14,643 exposure, there were no detectable differences in expression between the strains
(data not shown). The results are consistent with lack of changes in Hsp86 mRNA in dw/dw mice but do
not reflect the increases in Hsp70 mRNA indicating additional mechanisms control protein expression.
We examined expression of T-complex protein1 family members to which antibodies were available (T-
complex protein1α,β,ε). The increase in T-complex protein1ε expression in the livers of wild-type SV129
mice was shown to be PPARα-dependent as T-complex protein1ε was increased in wild-type but not
PPARα-null mice after WY-14,643 exposure (Fig. 5A). T-complex protein1ε was increased in the control
dw/dw strain but not the lit/lit strain compared to their respective heterozygote controls (Fig. 5B). These
results are consistent with the RT-PCR results showing a modest induction of the Cct5 gene. T-complex
protein1ε expression was significantly increased after WY-14,643 treatment in both dw/dw and lit/lit
dwarf strains as well as heterozygote strains (Fig. 5B). Surprisingly, the expression of the Cct5 gene was
not altered by WY-14,643 treatment in either strain. Like the fatty acid catabolism genes discussed above,
T-complex protein-1ε was increased to a greater extent in WY-14,643-treated dw/dw mice compared to
WY-14,643-treated +/dw mice (Fig. 5B). T-complex protein1ε was also elevated in the livers of GHR-
null mice compared to wild-type mice (Fig. 5C). No changes in the expression of other chaperones or
This article has not been copyedited and formatted. The final version may differ from this version.Molecular Pharmacology Fast Forward. Published on December 2, 2004 as DOI: 10.1124/mol.104.007278
at ASPE
T Journals on N
ovember 24, 2018
molpharm
.aspetjournals.orgD
ownloaded from
MOL 7278
Page 17 of 37
chaperonins including T-complex protein1α, T-complex protein1β, ERp72, Hsp25, Hsp60, Hsp65 and
Hsp84 were noted in the livers or hearts from control and WY-14,643-treated Snell dwarf mice or in the
livers from GHR-null mice (data not shown).
We performed a preliminary examination of PPARα-regulated gene products in the kidneys of
Snell dwarf mice from the same 3-day WY-14,643 study described above. Like the liver, Cyp4a protein
levels were elevated in the kidneys of WY-14,643-treated +/dw and dw/dw mice (Fig. 5D). T-complex
protein1ε exhibited increased expression in WY-14,643-treated +/dw mice compared to control +/dw
mice (Fig. 5E). The expression of the chaperone Hsp25 was also increased in control dw/dw mice
compared to control +/dw mice but not after WY-14,643-treatment in either strain (Fig. 5E). No changes
in the expression of T-complex protein1α, T-complex protein1β, ERp72, Hsp60, Hsp65 and Hsp84 were
noted in the kidneys from control and WY-14,643-treated Snell dwarf mice (data not shown). These
results indicate that the chaperonin T-complex protein1ε and Hsp25 are constitutively elevated in the
kidneys of Snell dwarf mice.
PPARα regulates a large battery of genes expressed in the liver whose gene products play roles in
atherosclerosis through lipid transport, inflammation and clot formation. A number of these genes encode
acute phase proteins (APP) that are elevated during times of acute or chronic infection. PP generally
down-regulate the expression of these APP possibly through the negative regulation by PPARα of
transcription factors controlling APP gene expression (Corton et al., 2000). Given that the transcript
profiling results predicted a general decrease in inflammatory responses in control dw/dw and WY-
14,643-treated +/dw mice through decreases in receptors for interleukin 1 and interferon gamma, we
examined the expression of APP in the livers of dwarf mice known to be regulated by WY-14,643
(Corton et al., 1998). All fibrinogen subunits (α, β and γ) were down-regulated in control dw/dw
compared to control +/dw mice although decreases in α- and β-fibrinogen did not reach statistical
significance (Fig. 6A). Under these conditions WY-14,643 had no significant effect on fibrinogen levels
in +/dw mice. Longer exposure times may be required to decrease fibrinogen gene and protein levels
This article has not been copyedited and formatted. The final version may differ from this version.Molecular Pharmacology Fast Forward. Published on December 2, 2004 as DOI: 10.1124/mol.104.007278
at ASPE
T Journals on N
ovember 24, 2018
molpharm
.aspetjournals.orgD
ownloaded from
MOL 7278
Page 18 of 37
(Corton et al., 1998) and would explain why α-fibrinogen, a gene on the Atlas Cancer 1.2 array was not
identified as down-regulated 12 hrs after WY-14,643 exposure. There was a significant decrease in the
expression of α- and γ-fibrinogen in WY-14,643-treated dw/dw mice compared to WY-14,643-treated
+/dw mice. Another APP gene product, α1-antitrypsin exhibited decreased expression in WY-14,643-
treated +/dw compared to control +/dw mice (Fig. 6A). Decreased levels of α1-anti-trypsin in control and
WY-14,643-treated dw/dw mice were not comparable to +/dw mice due to a significant interaction. β-
fibrinogen levels exhibited decreases by WY-14,643 in both +/lit and lit/lit strains (Fig. 6B). Although
levels of β-fibrinogen were decreased in the control lit/lit compared to the control +/lit strain a significant
interaction between genotype and treatment prevented statistical comparison . Finally, GHR-null mice
had decreased levels of β-fibrinogen compared to wild-type controls (Fig. 6C). These results indicate that
some markers of inflammation and atherosclerosis are decreased in dwarf mice in a manner similar to PP
exposure in wild-type mice.
Discussion
We posed the hypothesis that the overlap in the phenotypic effects of PP treatment in wild-type
mice and dwarf mutations has at its basis, an overlap in the transcriptional programs regulated by PPARα.
We examined gene expression by transcript profiling in the livers of Snell (Pit-1dw) dwarf (dw/dw) and
heterozygote (+/dw) mice treated with WY-14,643. Control dw/dw mice exhibited characteristics of
PPARα activation. Out of the 41 genes identified as differentially regulated in control dw/dw mice vs.
control +/dw mice, 41% of the genes were regulated similarly by WY-14,643 in +/dw mice. Many
PPARα target genes and their protein products involved in fatty acid metabolism were increased in
control Snell dwarf livers. The increase in PPARα-regulated gene products involved in lipid metabolism
was found to various extents in the livers of three additional dwarf mouse models which have in common,
defects in growth hormone secretion and/or signaling. Ames dwarf mice exhibited increased expression of
This article has not been copyedited and formatted. The final version may differ from this version.Molecular Pharmacology Fast Forward. Published on December 2, 2004 as DOI: 10.1124/mol.104.007278
at ASPE
T Journals on N
ovember 24, 2018
molpharm
.aspetjournals.orgD
ownloaded from
MOL 7278
Page 19 of 37
ACO and Cyp4a while GHR-null mice exhibited increases in thiolase and Cyp4a. Little and Snell mice
exhibited greater inductions of lipid metabolism gene products after WY-14,643 exposure compared to
corresponding WY-14,643-treated heterozygote strains, demonstrating greater responsiveness to PP in
these dwarf mice. The increases in lipid metabolism genes may be due to increases in PPARα mRNA and
protein as observed in the livers of control dw/dw mice. These results are consistent with two studies
which showed an inverse relationship between growth hormone signaling and PPARα-regulated gene
expression. Mice with defects in growth hormone-responsive STAT5b transcription factor also exhibited
constitutive increases in PPARα-regulated gene expression (Zhou et al., 2002). Conversely, a transcript
profiling study in the livers of growth hormone-treated rats revealed a subset of PPARα-regulated genes
that were down-regulated including CYP4A3 as well as PPARα itself (Tollet-Egnell et al., 2001). Taken
together, mice with defects in growth hormone secretion and signaling exhibit increased constitutive
expression of a subset of lipid metabolizing gene products under control of PPARα.
In addition to the lipid metabolism genes identified here, WY-14,643 and dwarf mutations alter
additional gene products with links to cardiovascular disease. Fibrinogen and α1-anti-trypsin are acute
phase proteins that are used as general indicators of inflammatory processes associated with atherogenesis
(Barbier et al., 2002). An elevated plasma fibrinogen level is an independent risk factor for coronary heart
disease, stroke and peripheral vascular disease. APP genes are negatively regulated by PP in a PPARα-
dependent manner (Corton et al., 1998, 2000). At least one of the fibrinogen family members was down-
regulated in two dwarf mouse models (Snell, GHR-null). α1-anti-trypsin was down-regulated in Snell
mice. The basis for the down-regulation of the APP by PP may be the ability of PPARα to negatively
interfere with the actions of transcription factors NF-kB, AP-1, NFAT and C/EBPβ that regulate pro-
inflammatory genes (Barbier et al., 2002). As PPARα is a common regulator of factors that impact
atherosclerosis (Barbier et al., 2002), the induction of PPARα and regulated genes in dwarf mice may
lead to decreases in not only circulating triglyceride and cholesterol levels (Brown-Borg, unpublished)
This article has not been copyedited and formatted. The final version may differ from this version.Molecular Pharmacology Fast Forward. Published on December 2, 2004 as DOI: 10.1124/mol.104.007278
at ASPE
T Journals on N
ovember 24, 2018
molpharm
.aspetjournals.orgD
ownloaded from
MOL 7278
Page 20 of 37
through modulation of lipid metabolism genes but negative regulation of inflammatory genes that
contribute to cardiovascular disease.
The chaperonin family of related T-complex protein1 proteins interact with hydrophobic regions
on nacent polypeptide chains preventing aggregation and subsequent toxicity. Like the chaperone heat
shock proteins, the chaperonins are induced after physical or chemical stress in which protein
denaturation is a prominent feature (Yokota et al., 2000). Low level exposure to different stressors leads
to increased expression of chaperonins and chaperones which better protect the cell from further insults
(Latchman, 2001). We found that the T-complex protein1ε protein was induced by both WY-14,643 and
dwarf mutations. Increased expression was found in the livers of Snell and GHR-null mice. The T-
complex protein1 gene (Cct5) was also induced in control dw/dw mice but not by WY-14,643 in either
strain. Although additional genes involved in protein folding were induced in control dw/dw mice
including Cct3, Hsp60 and Hsp70, other genes were not, indicating the dwarf mutations do not lead to a
general increase in the expression of the protein folding machinery. The livers of PP-treated wild-type
mice in which many HSPs and T-complex protein1ε are induced are protected from different types of
chemical insults (Mehendale, 2000) including oxidative stress (Anderson et al., 2004). The relationship
between the expression of T-complex protein1ε and increased protection of Snell fibroblasts to different
forms of stress (Murakami et al., 2003) needs to be examined.
The basis of the constitutive activation of PPARα and PPARα-regulated gene products in dwarf
mice may be the abolishment of growth hormone-responsive STAT5b interference of PPARα activity.
The ability of STAT5b to negatively regulate PPARα required the ligand-independent activation function
(AF-1) in the N-terminus of PPARα but not the C-terminal ligand-dependent AF-2 (Zhou et al., 1999a,b).
These AFs likely recognize overlapping sets of interacting co-activators and co-repressors resulting in
regulation of distinct sets of genes. Negative interference of PPARα by STAT5b could occur by a number
of mechanisms including 1) interference with the ability of PPARα to bind a PPRE or interact with
appropriate co-activators/co-repressors or 2) competition for essential coactivators or other interacting
This article has not been copyedited and formatted. The final version may differ from this version.Molecular Pharmacology Fast Forward. Published on December 2, 2004 as DOI: 10.1124/mol.104.007278
at ASPE
T Journals on N
ovember 24, 2018
molpharm
.aspetjournals.orgD
ownloaded from
MOL 7278
Page 21 of 37
proteins (Zhou et al., 1999a,b). In our study, not all PP-dependent gene products were constitutively
regulated by pit-1dw but required WY-14,643 exposure for induction in dwarf mice. Differences in pit-1
dependent (e.g., Acox1, Cyp4a10, Cyp4a14) and WY-14,643-dependent (e.g., Mte1) induction in Snell
dwarf mice may reflect differences in the requirement for AF-1 vs. AF-2 for gene activation. Only those
genes that require the STAT5b-inhibitable AF-1 would be pit-1 dependent. Exposure of dwarf mice to
WY-14,643 did not further increase the expression of some pit-1-dependent gene products (e.g., Fabp4)
possibly due to the high intrinsic activity of AF-1 compared to AF-2.
In addition to the interference of PPARα activity by STAT5b, PPARα can negatively interfere
with the ability of STAT5b to activate growth hormone-responsive genes. The AF-1 of PPARα was
required for negative interference of STAT5b but how PPARα interferes with STAT5b function is not
known (Shipley and Waxman, 2003). These studies imply that given the correct cellular context in which
PPARα and STAT5b are both expressed, PP could act as dwarf mouse mimetics through inhibition of
STAT5b. Thus, it may not only be possible that some of the beneficial effects of the dwarf genotype are
through activation of PPARα, but activation of PPARα by PP in wild-type animals may negatively
interfere with growth hormone signaling and lead to dwarf mouse-like effects. PP exposure leads to some
of the same changes as defects in growth hormone signaling including the increases in the fatty acid
metabolizing genes identified here as well as down-regulation of growth hormone-regulated CYP family
members (Corton et al., 1998). Ideally, compounds that mimic the dwarf mouse phenotype would target
the PPARα AF-1. With this in mind, MAP kinase activates PPARα through the AF-1 activation domain
important for insulin-dependent signaling (Juge-Aubry et al., 1999) and cardiac metabolic stress
responses (Barger et al., 2001).
PPARα may play roles in other models of stress resistance and/or longevity. Using
comprehensive transcript profiling PPARα was required for ~20% of the gene expression changes in the
liver after a 5 week caloric restriction (CR) and is required for CR to protect the liver from a lethal dose
of thioacetamide, a hepatotoxic agent (Corton et al., 2004). Like in the livers of Snell dwarf mice, the
This article has not been copyedited and formatted. The final version may differ from this version.Molecular Pharmacology Fast Forward. Published on December 2, 2004 as DOI: 10.1124/mol.104.007278
at ASPE
T Journals on N
ovember 24, 2018
molpharm
.aspetjournals.orgD
ownloaded from
MOL 7278
Page 22 of 37
PPARα-dependent CR genes included those involved in fatty acid metabolism, i.e., Cyp4a10, Cyp4a14.
With our findings of increased expression of PPARα-dependent genes in dwarf mice, alterations in
PPARα target gene regulation appears to be common in many animal models of longevity and/or stress
resistance. A dwarf mouse strain in which the PPARα gene is inactivated will be important to
unequivocally establish PPARα’s role in the beneficial effects associated with defects in growth hormone
signaling.
This article has not been copyedited and formatted. The final version may differ from this version.Molecular Pharmacology Fast Forward. Published on December 2, 2004 as DOI: 10.1124/mol.104.007278
at ASPE
T Journals on N
ovember 24, 2018
molpharm
.aspetjournals.orgD
ownloaded from
MOL 7278
Page 23 of 37
ACKNOWLEDGMENTS
We thank Dr. Andrzej Bartke for tissues, Mr. Dennis House for assistance in performing some of the
statistics, the CIIT Animal Care and Necropsy and Histology Units for assistance in performing these
studies, Drs. Alexson and Hashimoto for antibodies, Drs. Igor Dozmorov and Richard Miller for
providing the list of genes regulated in dwarf mice, Sharlene Rakoczy for technical assistance and Drs.
Kevin Gaido and Rusty Thomas for critical review of the manuscript.
This article has not been copyedited and formatted. The final version may differ from this version.Molecular Pharmacology Fast Forward. Published on December 2, 2004 as DOI: 10.1124/mol.104.007278
at ASPE
T Journals on N
ovember 24, 2018
molpharm
.aspetjournals.orgD
ownloaded from
MOL 7278
Page 24 of 37
References
Anderson SP, Yoon L, Richard EB, Dunn CS, Cattley R C and Corton J C (2002) Delayed liver regeneration in peroxisome proliferator-activated receptor-alpha-null mice. Hepatology. 36:544-54.
Barbier O, Torra IP, Duguay Y, Blanquart C, Fruchart JC, Glineur C and Staels B (2002) Pleiotropic actions of peroxisome proliferator-activated receptors in lipid metabolism and atherosclerosis. Arterioscler Thromb Vasc Biol. 22:717-26.
Barger PM, Browning AC, Garner AN, and Kelly DP (2001) p38 mitogen-activated protein kinase activates peroxisome proliferator-activated receptor alpha: a potential role in the cardiac metabolic stress response. J. Biol. Chem. 276:44495-44501.
Bielschowsky F and Bielschowsky M (1961) Carcinogenesis in the pituitary of dwarf mouse. The response to dimethylbenzanthracene applied to the skin. Br. J. Cancer 15:257-62.
Borg KE, Brown-Borg HM and Bartke A (1995) Assessment of the primary adrenal cortical and pancreatic hormone basal levels in relation to plasma glucose and age in the unstressed Ames dwarf mouse. Proc Soc Exp Biol Med. 210:126-33.
Brown-Borg HM and Rakoczy SG (2000) Catalase expression in delayed and premature aging mouse models. Exp. Gerontol. 35:199-212.
Bugni JM, Poole TM and Drinkwater NR (2001) The little mutation suppresses DEN-induced hepatocarcinogenesis in mice and abrogates genetic and hormonal modulation of susceptibility. Carcinogenesis 22:1853-1862.
Cattley RC and Popp JA. (1989) Differences between the promoting activities of the peroxisome proliferator WY-14,643 and phenobarbital in rat liver. Cancer Res. 49:3246-51.
Conway JG, Tomaszewski KE, Olson MJ, Cattley RC, Marsman DS, and Popp JA. (1989) Relationship of oxidative damage to the hepatocarcinogenicity of the peroxisome proliferators di(2-ethylhexyl)phthalate and Wy-14,643. Carcinogenesis. 10:513-9.
Corton JC, Fan LQ, Brown S, Anderson SP, Bocos C, Cattley RC, Mode A, and Gustafsson JA (1998) Down-regulation of cytochrome P450 2C family members and positive acute-phase response gene expression by peroxisome proliferator chemicals Mol. Pharmacol. 54:463-473.
Corton JC, Anderson SP, and Stauber A (2000) Central role of peroxisome proliferator-activated receptors in the actions of peroxisome proliferators. Annu. Rev. Pharmacol. Toxicol. 40:491-518.
Corton JC, Apte U, Anderson SP, Limaye P, Yoon L, Latendresse J, Dunn C, Everitt JI, Voss KA, Swanson C, et al., (2004) Caloric restriction mimetics include agonists of lipid-activated nuclear receptors. J. Biological Chem. 279:46204-12.
Coschigano KT, Clemmons D, Bellush LL and Kopchick JJ (2000) Assessment of growth parameters and life span of GHR/BP gene-disrupted mice. Endocrinology. 141:2608-13.
Dozmorov I, Galecki A, Chang Y, Krzesicki R, Vergara M, and Miller RA (2002) Gene expression profile of long-lived snell dwarf mice. J. Gerontol. A. Biol. Sci. Med. Sci. 57:B99-B108.
Eisen MB, Spellman PT, Brown PO and Botstein D (1998) Cluster analysis and display of genome-wide expression patterns. Proc Natl Acad Sci U S A. 95:14863-8.
Howroyd P, Swanson C, Dunn C, Cattley RC, and Corton JC (2004) Decreased longevity and enhancement of age-dependent lesion in mice lacking the nuclear receptor peroxisome proliferator-activated receptor α (PPARα) Tox Path In press.
Ikeno Y, Bronson RT, Hubbard GB, Lee S and Bartke A (2003) Delayed occurrence of fatal neoplastic diseases in Ames dwarf mice: correlation to extended longevity. J Gerontol A Biol Sci Med Sci. 58:291-6.
Juge-Aubry CE, Hammar E, Siegrist-Kaiser C, Pernin A, Takeshita A, Chin WW, Burger AG, and Meier CA. (1999) Regulation of the transcriptional activity of the peroxisome proliferator-activated receptor alpha by phosphorylation of a ligand-independent trans-activating domain. J. Biol. Chem. 274:10505-10510.
This article has not been copyedited and formatted. The final version may differ from this version.Molecular Pharmacology Fast Forward. Published on December 2, 2004 as DOI: 10.1124/mol.104.007278
at ASPE
T Journals on N
ovember 24, 2018
molpharm
.aspetjournals.orgD
ownloaded from
MOL 7278
Page 25 of 37
Kepler TB, Crosby L, and Morgan KT (2002). Normalization and analysis of DNA microarray data by self-consistency and local regression. Genome Biol.3:RESEARCH0037.
Klaunig JE, Babich MA, Baetcke KP, Cook JC, Corton JC, David RM, DeLuca JG, Lai DY, McKee RH, Peters JM, et al. (2003) PPARalpha agonist-induced rodent tumors: modes of action and human relevance. Crit Rev Toxicol. 33:655-780.
Latchman DS (2001) Heat shock proteins and cardiac protection. Cardiovasc Res. 51:637-46. Lee SS, Pineau T, Drago J, Lee EJ, Owens JW, Kroetz DL, Fernandez-Salguero PM, Westphal H and
Gonzalez FJ (1995) Targeted disruption of the alpha isoform of the peroxisome proliferator-activated receptor gene in mice results in abolishment of the pleiotropic effects of peroxisome proliferators. Mol Cell Biol. 15:3012-22.
Liu PC, Huber R, Stow MD, Schlingmann KL, Collier P, Liao B, Link J, Burn TC, Hollis G, Young PR, et al. (2003) Induction of endogenous genes by peroxisome proliferator activated receptor alpha ligands in a human kidney cell line and in vivo. J Steroid Biochem Mol Biol. 85:71-9.
Marmary Y, Parlow AF, Goldsmith CM, He X, Wellner RB, Satomura K, Kriete MF, Robey PG, Nieman LK, and Baum BJ (1999) Construction and in vivo efficacy of a replication-deficient recombinant adenovirus encoding murine growth hormone. Endocrinology 140:260-265.
Mehendale HM (2000) PPAR-alpha: a key to the mechanism of hepatoprotection by clofibrate. Toxicol Sci. 57:187-90.
Murakami S, Salmon A, and Miller RA (2003) Multiplex stress resistance in cells from long-lived dwarf mice FASEB J. 17:1565-1566.
Rennels EG, Anigstein DM and Anigstein L (1965) A cumulative study of the growth of sarcoma 180 in anterior pituitary dwarf mice. Tex Rep Biol Med. 23:776-81.
Sausen PJ, Lee DC, Rose ML and Cattley RC (1995) Elevated 8-hydroxydeoxyguanosine in hepatic DNA of rats following exposure to peroxisome proliferators: relationship to mitochondrial alterations. Carcinogenesis. 16:1795-801.
Shipley JM and Waxman DJ (2003) Down-regulation of STAT5b transcriptional activity by ligand-activated peroxisome proliferator-activated receptor (PPAR) alpha and PPARgamma. Mol. Pharmacol. 64:355-364.
Sterchele PF, Sun H, Peterson RE, and Vanden Heuvel JP (1996) Regulation of peroxisome proliferator-activated receptor-alpha mRNA in rat liver. Arch. Biochem. Biophys. 326:281-289.
Styles JA, Kelly MD, Pritchard NR, and Foster JR (1990) Effects produced by the non-genotoxic hepatocarcinogen methylclofenapate in dwarf mice: peroxisome induction uncoupled from DNA synthesis and nuclearity changes. Carcinogenesis 11:387-391.
Sugiyama H, Yamada J, and Suga T (1994) Effects of testosterone, hypophysectomy and growth hormone treatment on clofibrate induction of peroxisomal beta-oxidation in female rat liver. Biochem. Pharmacol. 47:918-921.
Tatar M, Bartke A, Antebi A. (2003) The endocrine regulation of aging by insulin-like signals. Science 299:1346-51.
Thuillier P, Anchiraico GJ, Nickel KP, Maldve RE, Gimenez-Conti I, Muga SJ, Liu KL, Fischer SM, and Belury MA (2000) Activators of peroxisome proliferator-activated receptor-alpha partially inhibit mouse skin tumor promotion. Mol. Carcinog. 29:134-142.
Tollet-Egnell P, Flores-Morales A, Stahlberg N, Malek RL, Lee N, and Norstedt G (2001) Gene expression profile of the aging process in rat liver: normalizing effects of growth hormone replacement. Mol. Endocrinol. 15:308-318.
Yokota SI, Yanagi H, Yura T, and Kubota H (2000) Cytosolic chaperonin-containing t-complex polypeptide 1 changes the content of a particular subunit species concomitant with substrate binding and folding activities during the cell cycle. Eur. J. Biochem. 267:1658-1664.
Zhou Y, Xu BC, Maheshwari HG, He L, Reed M, Lozykowski M, Okada S, Cataldo L, Coschigamo K, Wagner TE, Baumann G and Kopchick JJ (1997) A mammalian model for Laron syndrome produced by targeted disruption of the mouse growth hormone receptor/binding protein gene (the Laron mouse). Proc Natl Acad Sci U S A. 94:3215-20.
This article has not been copyedited and formatted. The final version may differ from this version.Molecular Pharmacology Fast Forward. Published on December 2, 2004 as DOI: 10.1124/mol.104.007278
at ASPE
T Journals on N
ovember 24, 2018
molpharm
.aspetjournals.orgD
ownloaded from
MOL 7278
Page 26 of 37
Zhou YC and Waxman DJ (1999a) STAT5b down-regulates peroxisome proliferator-activated receptor alpha transcription by inhibition of ligand-independent activation function region-1 trans-activation domain. J. Biol. Chem. 274:2672-2681.
Zhou YC and Waxman DJ (1999b) STAT5b down-regulates peroxisome proliferator-activated receptor alpha transcription by inhibition of ligand-independent activation function region-1 trans-activation domain. J. Biol. Chem. 274:29874-29882.
Zhou YC, Davey HW, McLachlan MJ, Xie T, and Waxman DJ (2002) Elevated basal expression of liver peroxisomal beta-oxidation enzymes and CYP4A microsomal fatty acid omega-hydroxylase in STAT5b(-/-) mice: cross-talk in vivo between peroxisome proliferator-activated receptor and signal transducer and activator of transcription signaling pathways. Toxicol. Appl. Pharmacol. 182:1-10.
This article has not been copyedited and formatted. The final version may differ from this version.Molecular Pharmacology Fast Forward. Published on December 2, 2004 as DOI: 10.1124/mol.104.007278
at ASPE
T Journals on N
ovember 24, 2018
molpharm
.aspetjournals.orgD
ownloaded from
MOL 7278
Page 27 of 37
Footnotes
CIIT Centers for Health Research, Research Triangle Park, NC 27709 (AJS, AL, RAS, JCC, CS, JCC)
Present address: Eli Lilly & Company, P.O. Box 708, Greenfield, IN 46140 (AJS)
Department of Pharmacology, Physiology and Therapeutics, University of North Dakota School of
Medicine, 501 N. Columbia Road, Grand Forks, ND 58203-2817 (HBB)
NIEHS, Research Triangle Park, NC 27709 (JL, MPW)
Toxicology & Mycotoxin Research Unit, USDA-Agricultural Research Service, Athens, GA 30604
(KAV)
Department of Biomedical Sciences, College of Osteopathic Medicine and Edison Biotechnology
Institute, Ohio University, Athens, Ohio 45701 (JJK)
ToxicoGenomics, 209 Silver Creek Tr., Chapel Hill, NC 27514 (JCC)
To whom all correspondence should be addressed:
J. Christopher Corton, ToxicoGenomics, 209 Silver Creek Tr., Chapel Hill, NC 27514 (919) 801-0887 (tel); (919) 408-0365 (fax); [email protected] (email).
This article has not been copyedited and formatted. The final version may differ from this version.Molecular Pharmacology Fast Forward. Published on December 2, 2004 as DOI: 10.1124/mol.104.007278
at ASPE
T Journals on N
ovember 24, 2018
molpharm
.aspetjournals.orgD
ownloaded from
MOL 7278
Page 28 of 37
FIGURE LEGENDS
Fig. 1. Altered gene expression in dw/dw Snell dwarf mice before and after WY-14,643 treatment.
Heterozygous (+/dw) and homozygous (dw/dw) dwarf mice were administered a single gavage dose (50
mg/kg) of WY-14,643 in methylcellulose or methylcellulose alone and sacrificed after 12 hr. Gene
expression was determined using Clontech Atlas Cancer 1.2 macroarrays as described in the Materials
and Methods. Genes whose expression was significantly (p < 0.005) different between two or more
groups and exhibited a > 1.5-fold or <-1.5-fold change were reported as a log2 fold-change relative to the
corresponding control. Significant genes were clustered and visualized using CLUSTER and TreeView.
(A) Two-dimensional cluster diagram of similarly regulated genes showing groups, A-H (described in
further detail in the text). The numbers on the scale are in fold-changes. “WY dw/dw” show the changes
in WY-14,643 treated dw/dw mice normalized to control dw/dw mice. “Con dw/dw“ show the changes in
control dw/dw mice normalized to control +/dw mice. “WY +/dw” show the changes in WY-14,643
treated +/dw mice normalized to control +/dw mice. (B) Venn diagram showing the overlap in the genes
regulated by Pit1dw or WY-14,643 in the +/dw or dw/dw strains.
Fig. 2. Constitutive expression of PPARα-regulated gene products in Snell dwarf mice. Dw/dw and +/dw
mice were administered three consecutive gavage doses of WY-14,643 (50 mg/kg) in methylcellulose or
methylcellulose alone and sacrificed after 72 h. (A) Western blots showing ACO and Cyp4a expression.
(B) Quantitation of Western blots in (A). (C) Palmitoyl-CoA oxidase activity. (D,E) Expression of other
gene products under control of PPARα. Expression of multifunctional protein-I (MFP-I), multifunctional
protein-II (MFP-II), thiolase, mitochondrial thioesterase-I (MTE-I) and cytosolic thioesterase-I (CTE-I)
were determined by westerns using the same extracts described in (A) and quantified as in (B). Error bars
are means ± standard error (n = 3-4/group). *, Indicates significant difference between the WY-14,643-
treated and control group for each strain (p < 0.05). #, Indicates significant difference between the dw/dw
and +/dw groups (p < 0.05).
This article has not been copyedited and formatted. The final version may differ from this version.Molecular Pharmacology Fast Forward. Published on December 2, 2004 as DOI: 10.1124/mol.104.007278
at ASPE
T Journals on N
ovember 24, 2018
molpharm
.aspetjournals.orgD
ownloaded from
MOL 7278
Page 29 of 37
Fig. 3. Increased expression of PPARα in the livers of Snell dwarf mice. Expression of PPARα mRNA
and protein were determined in the mouse livers described in Fig. 2. Error bars are means ± standard error
(n = 3-4/group). #, Indicates significant difference between the control dw/dw and +/dw groups (p <
0.05).
Fig. 4. Expression of PPARα-regulated lipid metabolizing enzymes in dwarf mice. Mice were
administered three consecutive gavage doses of WY-14,643 (50 mg/kg) in methylcellulose or
methylcellulose alone and sacrificed after 72 h. (A) Expression of ACO-B and Cyp4a proteins in the
livers of control heterozygote (+/df) and Ames dwarf (df/df) mice. (B, C) Expression of PPARα-regulated
gene products in control or WY-14,643-treated heterozygote (+/lit) or Little dwarf (lit/lit) mice. (D)
Expression of thiolase and Cyp4a determined in the livers of control wild-type and GHR-null mice. Error
bars are means ± standard error (n = 3-4/group). *, Indicates significant difference between the WY-
14,643-treated and control group (p < 0.05). #, Indicates significant difference between the dwarf and
wild-type groups (p < 0.05).
Fig. 5. Altered expression of a PPARα-regulated chaperonin in dwarf mice. (A) WY-14,643-induction of
T-complex protein1ε is PPARα-dependent. Wild-type and PPARα-null mice were treated with WY-
14,643 by gavage for 6 consecutive days. Liver homogenates were used to determine expression of T-
complex protein1ε by western analysis. (B) T-complex protein1ε expression in dwarf mouse livers. T-
complex protein1ε protein expression was assessed by western blot in the livers of WY-14,643- and
control-treated dw/dw (Snell) and +/dw mice and lit/lit (Little) and +/lit mice described in Fig. 2 and 4,
respectively. (C) T-complex protein1ε expression in GHR-null mouse livers. (D) Expression of Cyp4a in
the kidneys of dw/dw and +/dw mice. (E) Expression of T-complex protein1ε and Hsp25 in the kidneys
of dw/dw and +/dw mice. T-complex protein1ε and Hsp25 protein expression was assessed by western
This article has not been copyedited and formatted. The final version may differ from this version.Molecular Pharmacology Fast Forward. Published on December 2, 2004 as DOI: 10.1124/mol.104.007278
at ASPE
T Journals on N
ovember 24, 2018
molpharm
.aspetjournals.orgD
ownloaded from
MOL 7278
Page 30 of 37
blot in the kidneys of WY-14,643- and control-treated +/dw and dw/dw mice described in Fig. 2. Error
bars are means ± standard error (n = 3-4/group). *, Indicates significant difference between the WY-
14,643-treated and control group (p < 0.05). #, Indicates significant difference between the dwarf and
wild-type groups (p < 0.05).
Fig. 6. Altered expression in dwarf mice of PPARα-regulated gene products involved in cardiovascular
disease. (A) Expression of fibrinogen (Fib) and α1-antitrypsin (α1-AT) in the livers of +/dw and dw/dw
mice. Expression was determined by westerns in the livers of mice described in Fig. 2. (B) Expression of
β-fibrinogen in the livers of Little dwarf mice. Expression was determined by westerns in the livers of
mice described in Fig. 4. (C) Expression of β-fibrinogen in the livers of wild-type and GHR-null mice.
Expression of β-fibrinogen was determined in the livers of mice described in Fig. 4. Error bars are means
± standard error (n = 3-4/group). *, Indicates significant difference between the WY-14,643-treated and
control groups (p < 0.05). #, Indicates significant difference between the control dwarf and wild-type
groups (p < 0.05).
This article has not been copyedited and formatted. The final version may differ from this version.Molecular Pharmacology Fast Forward. Published on December 2, 2004 as DOI: 10.1124/mol.104.007278
at ASPE
T Journals on N
ovember 24, 2018
molpharm
.aspetjournals.orgD
ownloaded from
MOL 7278
Page 31 of 37
TABLE 1 List of primers used in the RT-PCR studies Gene Acc. No. Forward Primer Reverse Primer 18S Acox1
X56974 AF006688
CGAACGTCTGCCCTATCAACTT GGGAGTGCTACGGGTTACATG
CCGGAATCGAACCCTGATT CCGATATCCCCAACAGTGATG
Cct3 L20509 CCATGCACAGAACCAGCAGTT GGCTGCCCCTCAACCTAATC Cct5 NM_007637 CCGTGACAACCGTGTTGTGTAT CTTGTCTGCCTCTTGGCTGACT Cct7 Z31399 TGGCCACCCAGTACTTTGCT GAGCCTCCACAAGCCATCAT Ccnd1 M64403 GGGCACCTGGATTGTTCT CACCGGAGACTCAGAGCA Cte1 NM_012006 GGAAGGAGAAGCCCCAGATC CTGCACAGCGGGAAGTAAGG Cyp4a10 AB018421 CCAGGAACTGCATTGGGAAA GACCCTGGTAGGATCTGGCA Cyp4a14 Y11638 GGTGAGGCTGATTGAGTCTTGAG CTCCAGATTGATCCAGGATGGA Dci NM_010023 CCTCAGCTTGGAGTGTCTCACA GACACCTCGGATGCTCTTGTC Ech1 NM_016772 GACTGCCGGGCTGTTGTAGT GTTCGGAGGCCATGTCCAT Ehhadh NM_023737 GTTGGCTTCCCGGAAGTGAT CTCCAACGACCCTGGGTAGA Fabp4 M20497 AGTCACATGGTCAGGGCATCTT AACCTTCGAGGAGGAGCTGTCT Fgb NM_181849 GCACTGTCAGCTGCAACATTC GGATGTCTCACCTCCCTTCCT Hsp25 U03560 GAAGAAAGGCAGGACGAACATG CACCTGGAGGGAGCGTGTAT Hsp32 M33203 CCTCACTGGCAGGAAATCATC CCTCGTGGAGACGCTTTACATA Hsp40 U40992 GGTGTGCACTCAGACGAAAGC CCAGGCTAGCTCCAAAGAACA Hsp60 X55023 TCAGTCCATTGTCCCTGCTCTT GTGCTTAGAGCTTCTCCGTCAAC Hsp70 M35021 GGACAAGCAAGCATTCCACA CTCAAGAGAGGCGGGATAAGG Hsp86 X16857 CGGACGCTCTGGATAAAATCC TCCTTCCCCGAGTCCAGTTT Hsp105 D67016 ATCTCTGGTCTGGAACCACGA TCAGGAAGGTGAGCACTTTGG Igf1 X04480 TTGCTTCCGGAGCTGTGATC AGAGCGGGCTGCTTTTGTAG Igfbp1 X81579 TGGACAGCTTCCACCTGATG TGATGGCGTTCCACAGGAT Mte1 NM_134188 GGAAGGAGAAGCCCCAGATC CTGCACAGCGGGAAGTAAGG Pex11a AF093669 TCCTGGACACCGTGAAGAACT CGCCGAGATTGGACTTGTAGA Ppara AI323000 AAGCCATCTTCACGATGCTG TCAGAGGTCCCTGAACAGTG
This article has not been copyedited and formatted. The final version may differ from this version.Molecular Pharmacology Fast Forward. Published on December 2, 2004 as DOI: 10.1124/mol.104.007278
at ASPE
T Journals on N
ovember 24, 2018
molpharm
.aspetjournals.orgD
ownloaded from
MOL 7278
Page 32 of 37
TABLE 2 Gene expression altered by the Pit1dw mutation or exposure to WY-14,643
Classa Coordinateb NCBI#b Gene nameb FC, WYc dw/dw
p value, WY dw/dw
FC, CON dw/dw
p value, CON dw/dw
FC, WY +/dw
p value, WY +/dw
A F05g L19622 tissue inhibitor of metalloproteinase 3 4.69 0.00011
F04h M64085 serine (or cysteine) proteinase inhibitor, clade A, member 3G 3.83 0.00027
A05n M58633 cell division cycle 2 homolog (S. pombe)-like 1 -2.94 0.00087 3.76 0.00453
A08j Y00051 neural cell adhesion molecule 1 3.48 0.00420
F06g X58287 protein tyrosine phosphatase, receptor type, M -2.51 0.00149 3.46 0.00185
C06e X78987 epidermal growth factor receptor 3.38 0.00068
E11a S53270 cell line NK14 derived transforming oncogene 3.07 0.00083
C06m X78568 FMS-like tyrosine kinase 1 3.03 0.00332
C10h L32840 angiotensin II receptor, type 2 -1.54 0.00033 2.79 0.00003
B10g X58251 procollagen, type I, alpha 2 2.36 0.00061
F05k M36033 protein tyrosine phosphatase, receptor type, A 2.26 0.00398
C07c AF002701 glial cell line derived neurotrophic factor family receptor alpha 2 2.23 0.00317
F07g AB011678 doublecortin 2.20 0.00087
C05l Y12879 D6 beta-chemokine receptor 2.04 0.00499
E06j AF099067 NIMA (never in mitosis gene a)-related expressed kinase 4 1.65 0.00155
A10a U83190 zonadhesin 1.50 0.00013
B A14i M93275 adipose differentiation related protein 4.76 0.00074
B13j Z31557 chaperonin subunit 6a (zeta) 3.70 0.00040
D04h M74181 macrophage stimulating 1 (hepatocyte growth factor-like) 3.67 0.00240
A05b L49507 cyclin G1 3.35 0.00127
A04b U57634 nuclear factor I/B 3.17 0.00177
C04j X58196 H19 fetal liver mRNA 2.89 0.00067
B07b U62295 cytochrome P450, family 2, subfamily j, polypeptide 6 2.87 0.00001
D10h D14716 adenylate cyclase activating polypeptide 1 2.75 0.00188
E09i D28117 protein phosphatase 1A, magnesium dependent, alpha isoform 2.66 0.00262
F01l U77083 alanyl (membrane) aminopeptidase 2.64 0.00386
E01j X85999 interleukin 1 receptor accessory protein 2.60 0.00330
A02f AB000096 GATA binding protein 2 2.52 0.00036
B12d AF090317 cytochrome P450, family 8, subfamily b, polypeptide 1 2.50 0.00311
B13h Z31554 chaperonin subunit 4 (delta) 2.48 0.00020
D10a U14332 interleukin 15 2.48 0.00434
This article has not been copyedited and form
atted. The final version m
ay differ from this version.
Molecular Pharm
acology Fast Forward. Published on D
ecember 2, 2004 as D
OI: 10.1124/m
ol.104.007278 at ASPET Journals on November 24, 2018 molpharm.aspetjournals.org Downloaded from
MOL 7278
Page 33 of 37
B12k U85511 expressed in non-metastatic cells 1, protein 2.31 0.00001
B11g U93309 discs, large homolog 1 (Drosophila) 2.16 0.00147
B06h AF055664 DnaJ (Hsp40) homolog, subfamily A, member 1 2.10 0.00286
C03e AF041054 BCL2/adenovirus E1B 19kDa-interacting protein 1, NIP3 2.06 0.00081
B08n M63802 gap junction membrane channel protein beta 1 2.01 0.00056
B03h X57638 peroxisome proliferator activated receptor alpha 1.98 0.00076
E08j U22445 thymoma viral proto-oncogene 2 1.97 0.00159
B10l L02918 procollagen, type V, alpha 2 1.97 0.00130
D11n AF033585 frizzled homolog 9 (Drosophila) 1.86 0.00331
D05c X81579 insulin-like growth factor binding protein 1 1.83 0.00435
E11k X57277 RAS-related C3 botulinum substrate 1 1.80 0.00041
B07h U48420 glutathione S-transferase, theta 2 1.78 0.00051
B09d U72680 FXYD domain-containing ion transport regulator 5 1.78 0.00482
E10l U89694 protein tyrosine phosphatase, non-receptor type substrate 1 1.75 0.00233
A14m AF110802 interleukin 18 binding protein 1.69 0.00442
B02i Z50013 Harvey rat sarcoma virus oncogene 1 1.66 0.00116
C E11m L32751 RAN, member RAS oncogene family 1.88 0.00093 2.73 0.00078 6.54 0.00011
E11i Y00094 RAB1, member RAS oncogene family 3.50 0.00176 4.77 0.00205
E11l L20294 SAR1a gene homolog (S. cerevisiae) 2.13 0.00162 3.54 0.00000
A06k L16846 B-cell translocation gene 1, anti-proliferative 2.50 0.00208 3.04 0.00239
F02m S69034 cathepsin B 2.34 0.00313 3.00 0.00208
E07k X61940 dual specificity phosphatase 1 2.03 0.00095 2.67 0.00044
B13k Z50192 chaperonin subunit 6b (zeta) 1.98 0.00068 2.57 0.00050
A13h J05287 lysosomal membrane glycoprotein 2 1.59 0.00031 2.37 0.00250
D11g U66203 fibroblast growth factor 11 1.94 0.00368 1.96 0.00097
B08k X61675 gap junction membrane channel protein alpha 5 2.52 0.00081 1.95 0.00188
E01h AJ001373 integrin beta 1 binding protein 1 2.52 0.00065 1.95 0.00131
E11j X72966 RAB3A, member RAS oncogene family 2.03 0.00258 1.70 0.00054
D B13a M15009 cytochrome P450, family 21, subfamily a, polypeptide 1 21.89 0.00008
B06l M14757 ATP-binding cassette, sub-family B (MDR/TAP), member 1B 5.99 0.00132
B14h M36830 heat shock protein 1, alpha 3.78 0.00451 3.34 0.00047
F06m M21495 actin, gamma, cytoplasmic 3.11 0.00441 2.35 0.00133
B07c U89491 epoxide hydrolase 1, microsomal 2.12 0.00237 2.08 0.00025
B14g M18186 heat shock protein 1, beta 2.05 0.00175 1.70 0.00135
This article has not been copyedited and form
atted. The final version m
ay differ from this version.
Molecular Pharm
acology Fast Forward. Published on D
ecember 2, 2004 as D
OI: 10.1124/m
ol.104.007278 at ASPET Journals on November 24, 2018 molpharm.aspetjournals.org Downloaded from
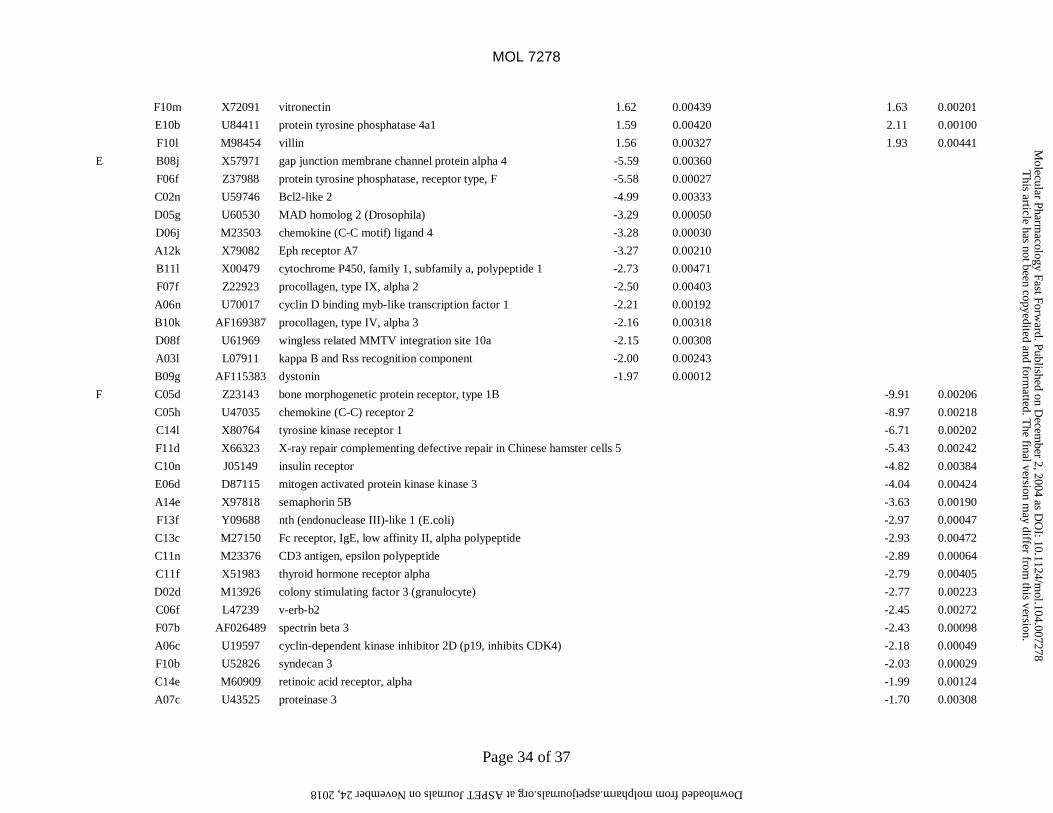
MOL 7278
Page 34 of 37
F10m X72091 vitronectin 1.62 0.00439 1.63 0.00201
E10b U84411 protein tyrosine phosphatase 4a1 1.59 0.00420 2.11 0.00100
F10l M98454 villin 1.56 0.00327 1.93 0.00441
E B08j X57971 gap junction membrane channel protein alpha 4 -5.59 0.00360
F06f Z37988 protein tyrosine phosphatase, receptor type, F -5.58 0.00027
C02n U59746 Bcl2-like 2 -4.99 0.00333
D05g U60530 MAD homolog 2 (Drosophila) -3.29 0.00050
D06j M23503 chemokine (C-C motif) ligand 4 -3.28 0.00030
A12k X79082 Eph receptor A7 -3.27 0.00210
B11l X00479 cytochrome P450, family 1, subfamily a, polypeptide 1 -2.73 0.00471
F07f Z22923 procollagen, type IX, alpha 2 -2.50 0.00403
A06n U70017 cyclin D binding myb-like transcription factor 1 -2.21 0.00192
B10k AF169387 procollagen, type IV, alpha 3 -2.16 0.00318
D08f U61969 wingless related MMTV integration site 10a -2.15 0.00308
A03l L07911 kappa B and Rss recognition component -2.00 0.00243
B09g AF115383 dystonin -1.97 0.00012
F C05d Z23143 bone morphogenetic protein receptor, type 1B -9.91 0.00206
C05h U47035 chemokine (C-C) receptor 2 -8.97 0.00218
C14l X80764 tyrosine kinase receptor 1 -6.71 0.00202
F11d X66323 X-ray repair complementing defective repair in Chinese hamster cells 5 -5.43 0.00242
C10n J05149 insulin receptor -4.82 0.00384
E06d D87115 mitogen activated protein kinase kinase 3 -4.04 0.00424
A14e X97818 semaphorin 5B -3.63 0.00190
F13f Y09688 nth (endonuclease III)-like 1 (E.coli) -2.97 0.00047
C13c M27150 Fc receptor, IgE, low affinity II, alpha polypeptide -2.93 0.00472
C11n M23376 CD3 antigen, epsilon polypeptide -2.89 0.00064
C11f X51983 thyroid hormone receptor alpha -2.79 0.00405
D02d M13926 colony stimulating factor 3 (granulocyte) -2.77 0.00223
C06f L47239 v-erb-b2 -2.45 0.00272
F07b AF026489 spectrin beta 3 -2.43 0.00098
A06c U19597 cyclin-dependent kinase inhibitor 2D (p19, inhibits CDK4) -2.18 0.00049
F10b U52826 syndecan 3 -2.03 0.00029
C14e M60909 retinoic acid receptor, alpha -1.99 0.00124
A07c U43525 proteinase 3 -1.70 0.00308
This article has not been copyedited and form
atted. The final version m
ay differ from this version.
Molecular Pharm
acology Fast Forward. Published on D
ecember 2, 2004 as D
OI: 10.1124/m
ol.104.007278 at ASPET Journals on November 24, 2018 molpharm.aspetjournals.org Downloaded from
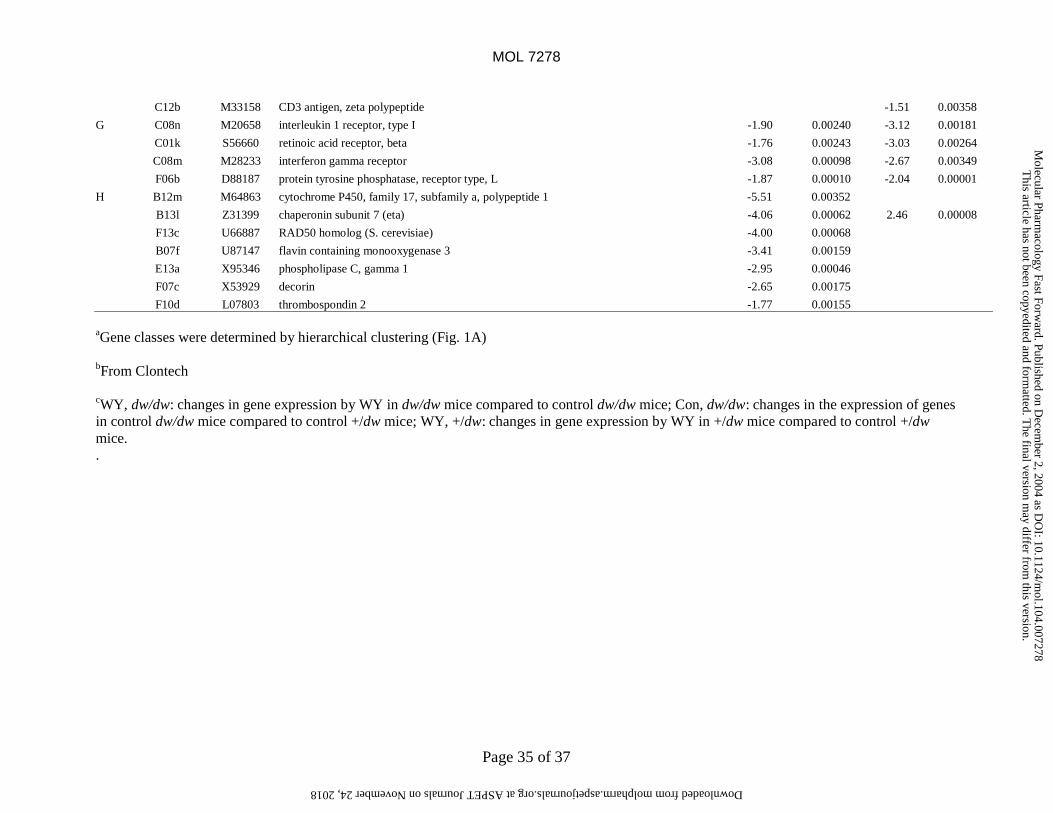
MOL 7278
Page 35 of 37
C12b M33158 CD3 antigen, zeta polypeptide -1.51 0.00358
G C08n M20658 interleukin 1 receptor, type I -1.90 0.00240 -3.12 0.00181
C01k S56660 retinoic acid receptor, beta -1.76 0.00243 -3.03 0.00264
C08m M28233 interferon gamma receptor -3.08 0.00098 -2.67 0.00349
F06b D88187 protein tyrosine phosphatase, receptor type, L -1.87 0.00010 -2.04 0.00001
H B12m M64863 cytochrome P450, family 17, subfamily a, polypeptide 1 -5.51 0.00352
B13l Z31399 chaperonin subunit 7 (eta) -4.06 0.00062 2.46 0.00008
F13c U66887 RAD50 homolog (S. cerevisiae) -4.00 0.00068
B07f U87147 flavin containing monooxygenase 3 -3.41 0.00159
E13a X95346 phospholipase C, gamma 1 -2.95 0.00046
F07c X53929 decorin -2.65 0.00175
F10d L07803 thrombospondin 2 -1.77 0.00155
aGene classes were determined by hierarchical clustering (Fig. 1A) bFrom Clontech cWY, dw/dw: changes in gene expression by WY in dw/dw mice compared to control dw/dw mice; Con, dw/dw: changes in the expression of genes in control dw/dw mice compared to control +/dw mice; WY, +/dw: changes in gene expression by WY in +/dw mice compared to control +/dw mice. .
This article has not been copyedited and form
atted. The final version m
ay differ from this version.
Molecular Pharm
acology Fast Forward. Published on D
ecember 2, 2004 as D
OI: 10.1124/m
ol.104.007278 at ASPET Journals on November 24, 2018 molpharm.aspetjournals.org Downloaded from
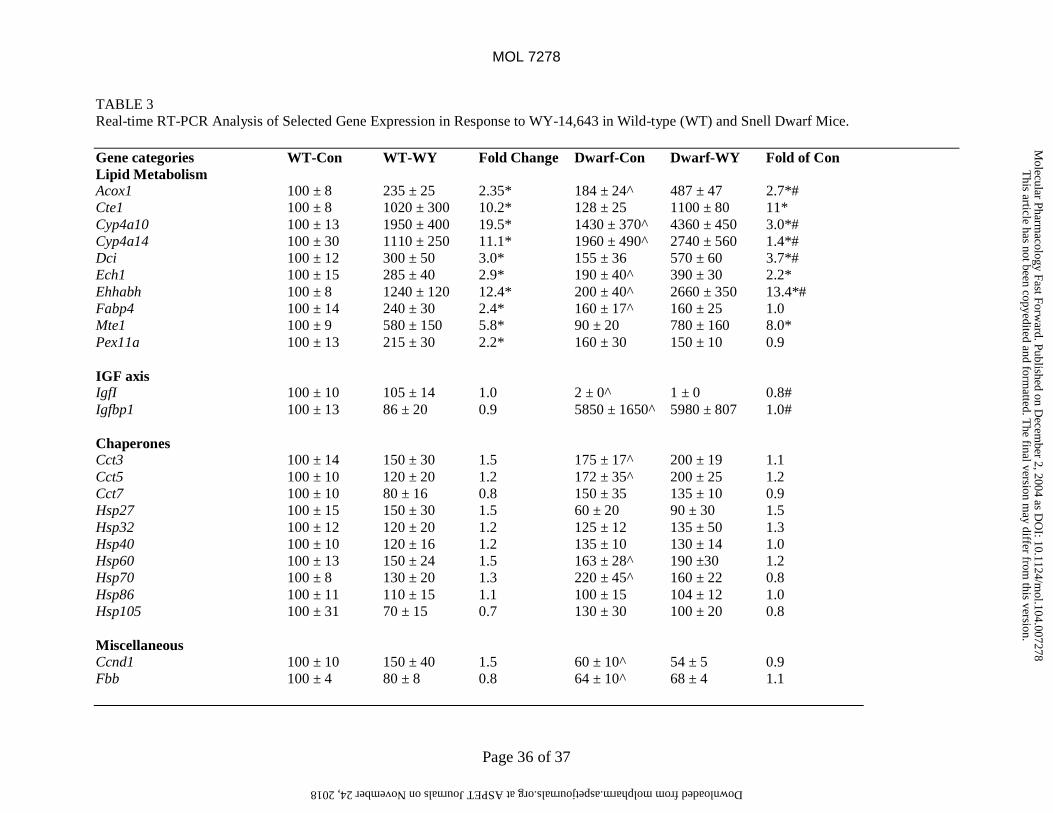
MOL 7278
Page 36 of 37
TABLE 3 Real-time RT-PCR Analysis of Selected Gene Expression in Response to WY-14,643 in Wild-type (WT) and Snell Dwarf Mice. Gene categories WT-Con WT-WY Fold Change Dwarf-Con Dwarf-WY Fold of Con Lipid Metabolism Acox1 100 ± 8 235 ± 25 2.35* 184 ± 24^ 487 ± 47 2.7*# Cte1 100 ± 8 1020 ± 300 10.2* 128 ± 25 1100 ± 80 11* Cyp4a10 100 ± 13 1950 ± 400 19.5* 1430 ± 370^ 4360 ± 450 3.0*# Cyp4a14 100 ± 30 1110 ± 250 11.1* 1960 ± 490^ 2740 ± 560 1.4*# Dci 100 ± 12 300 ± 50 3.0* 155 ± 36 570 ± 60 3.7*# Ech1 100 ± 15 285 ± 40 2.9* 190 ± 40^ 390 ± 30 2.2* Ehhabh 100 ± 8 1240 ± 120 12.4* 200 ± 40^ 2660 ± 350 13.4*# Fabp4 100 ± 14 240 ± 30 2.4* 160 ± 17^ 160 ± 25 1.0 Mte1 100 ± 9 580 ± 150 5.8* 90 ± 20 780 ± 160 8.0* Pex11a 100 ± 13 215 ± 30 2.2* 160 ± 30 150 ± 10 0.9 IGF axis IgfI 100 ± 10 105 ± 14 1.0 2 ± 0^ 1 ± 0 0.8# Igfbp1 100 ± 13 86 ± 20 0.9 5850 ± 1650^ 5980 ± 807 1.0# Chaperones Cct3 100 ± 14 150 ± 30 1.5 175 ± 17^ 200 ± 19 1.1 Cct5 100 ± 10 120 ± 20 1.2 172 ± 35^ 200 ± 25 1.2 Cct7 100 ± 10 80 ± 16 0.8 150 ± 35 135 ± 10 0.9 Hsp27 100 ± 15 150 ± 30 1.5 60 ± 20 90 ± 30 1.5 Hsp32 100 ± 12 120 ± 20 1.2 125 ± 12 135 ± 50 1.3 Hsp40 100 ± 10 120 ± 16 1.2 135 ± 10 130 ± 14 1.0 Hsp60 100 ± 13 150 ± 24 1.5 163 ± 28^ 190 ±30 1.2 Hsp70 100 ± 8 130 ± 20 1.3 220 ± 45^ 160 ± 22 0.8 Hsp86 100 ± 11 110 ± 15 1.1 100 ± 15 104 ± 12 1.0 Hsp105 100 ± 31 70 ± 15 0.7 130 ± 30 100 ± 20 0.8 Miscellaneous Ccnd1 100 ± 10 150 ± 40 1.5 60 ± 10^ 54 ± 5 0.9 Fbb 100 ± 4 80 ± 8 0.8 64 ± 10^ 68 ± 4 1.1
This article has not been copyedited and form
atted. The final version m
ay differ from this version.
Molecular Pharm
acology Fast Forward. Published on D
ecember 2, 2004 as D
OI: 10.1124/m
ol.104.007278 at ASPET Journals on November 24, 2018 molpharm.aspetjournals.org Downloaded from
MOL 7278
Page 37 of 37
Data are mean ± SEM of 4 individual animals. *Significantly different from controls p<0.05; #Significantly different from WT-WY, p<0.05; ^Significantly different from WT-Con, p<0.05.
This article has not been copyedited and form
atted. The final version m
ay differ from this version.
Molecular Pharm
acology Fast Forward. Published on D
ecember 2, 2004 as D
OI: 10.1124/m
ol.104.007278 at ASPET Journals on November 24, 2018 molpharm.aspetjournals.org Downloaded from
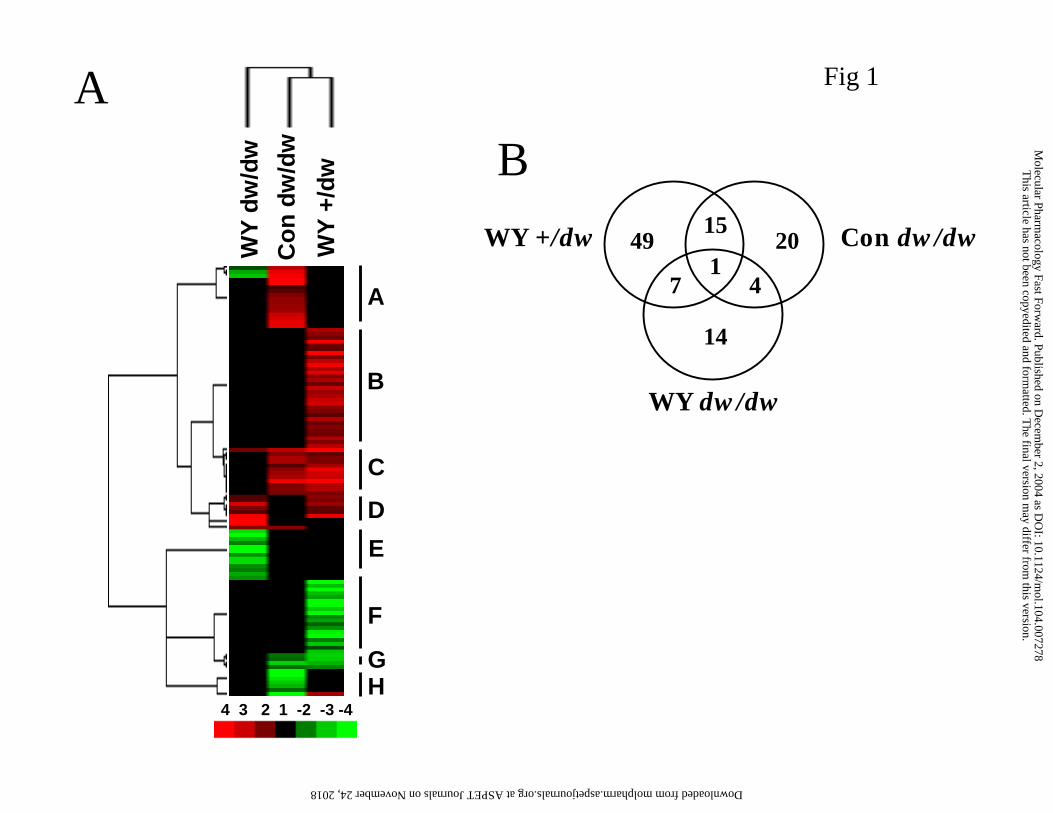
WY
dw
/dw
Co
n d
w/d
w
WY
+/d
wA
B
C
D
E
F
GH
A
4 3 2 1 -2 -3 -4
Fig 1
BWY +/dw Con dw/dw
WY dw/dw
1
1549 20
4
14
7
This article has not been copyedited and form
atted. The final version m
ay differ from this version.
Molecular Pharm
acology Fast Forward. Published on D
ecember 2, 2004 as D
OI: 10.1124/m
ol.104.007278 at ASPET Journals on November 24, 2018 molpharm.aspetjournals.org Downloaded from
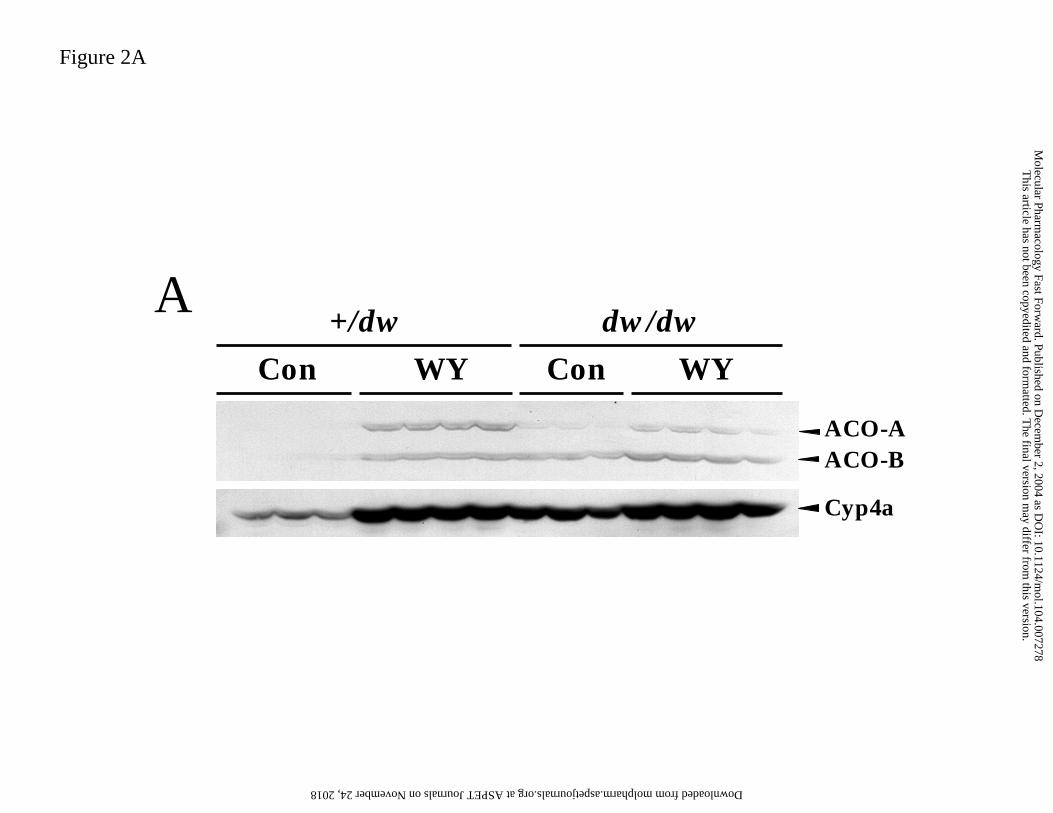
Figure 2A
ACO-AACO-B
Cyp4a
ACon WY Con WY
+/dw dw/dw
This article has not been copyedited and form
atted. The final version m
ay differ from this version.
Molecular Pharm
acology Fast Forward. Published on D
ecember 2, 2004 as D
OI: 10.1124/m
ol.104.007278 at ASPET Journals on November 24, 2018 molpharm.aspetjournals.org Downloaded from
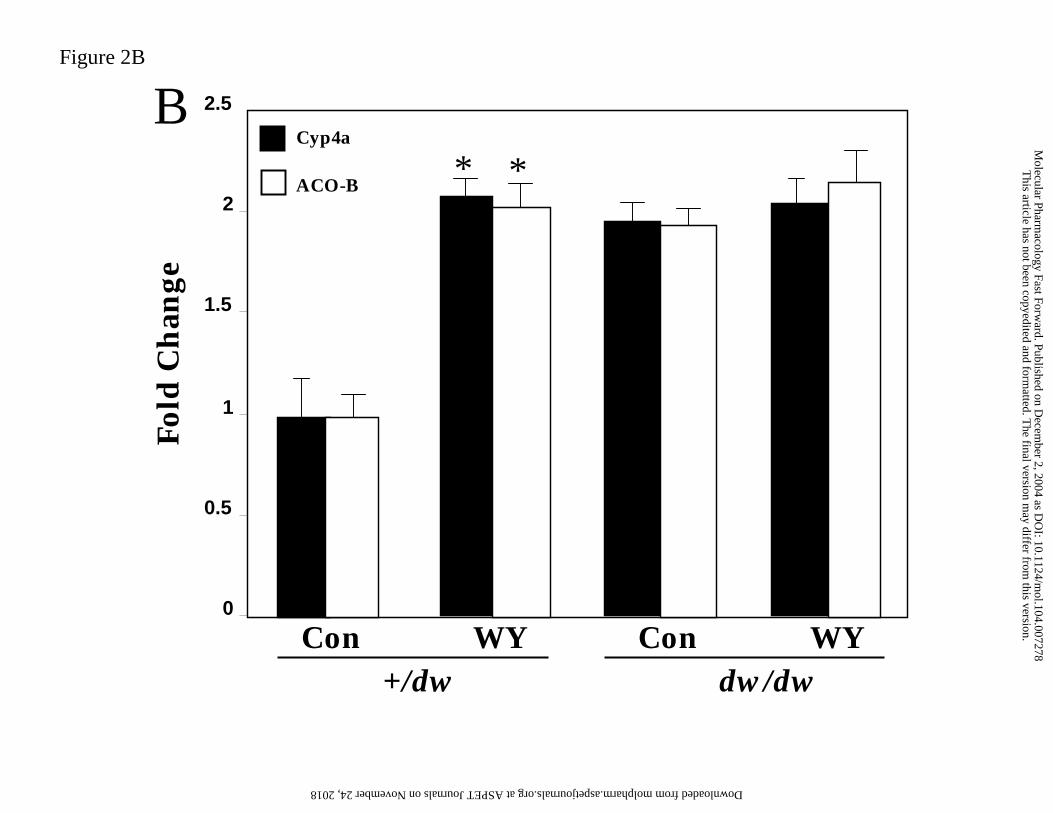
Figure 2B
B
0
0.5
1
1.5
2
2.5
Fold
Ch
ange
Cyp4a
ACO-B
Con WY Con WY+/dw dw/dw
* * This article has not been copyedited and form
atted. The final version m
ay differ from this version.
Molecular Pharm
acology Fast Forward. Published on D
ecember 2, 2004 as D
OI: 10.1124/m
ol.104.007278 at ASPET Journals on November 24, 2018 molpharm.aspetjournals.org Downloaded from
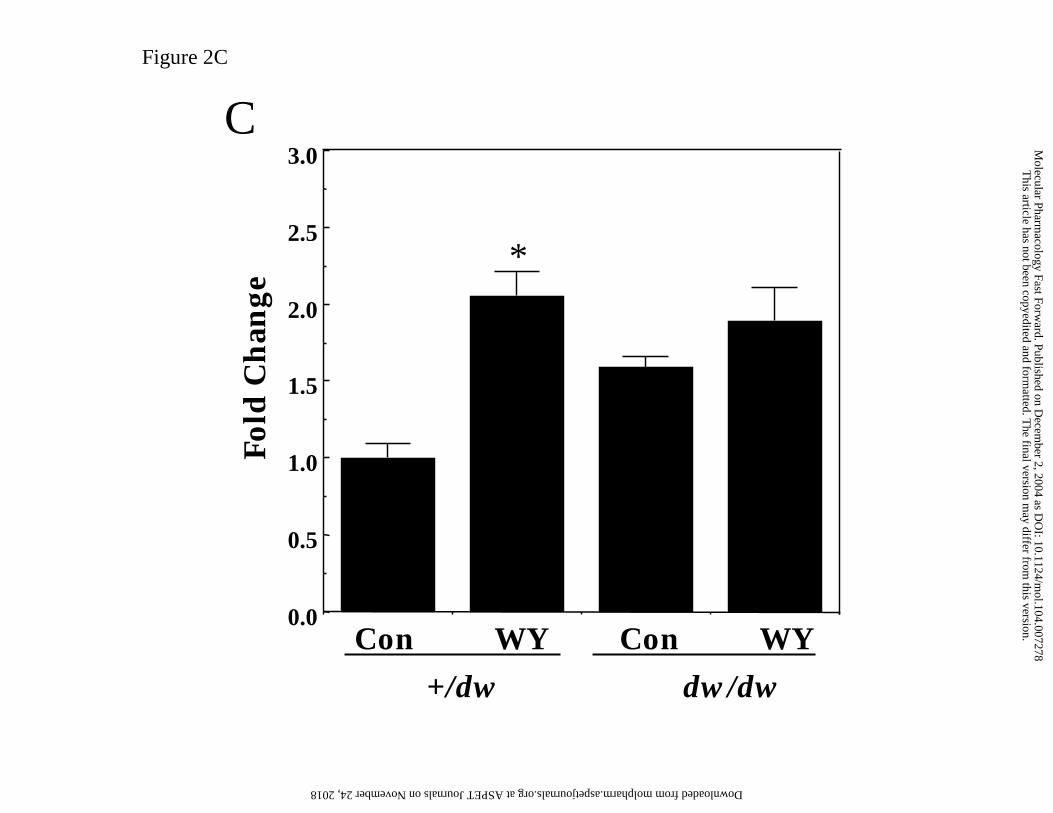
Figure 2C
0.0
0.5
1.0
1.5
2.0
2.5
3.0
Fold
Ch
ange*
Con WY Con WY
+/dw dw/dw
C
This article has not been copyedited and form
atted. The final version m
ay differ from this version.
Molecular Pharm
acology Fast Forward. Published on D
ecember 2, 2004 as D
OI: 10.1124/m
ol.104.007278 at ASPET Journals on November 24, 2018 molpharm.aspetjournals.org Downloaded from
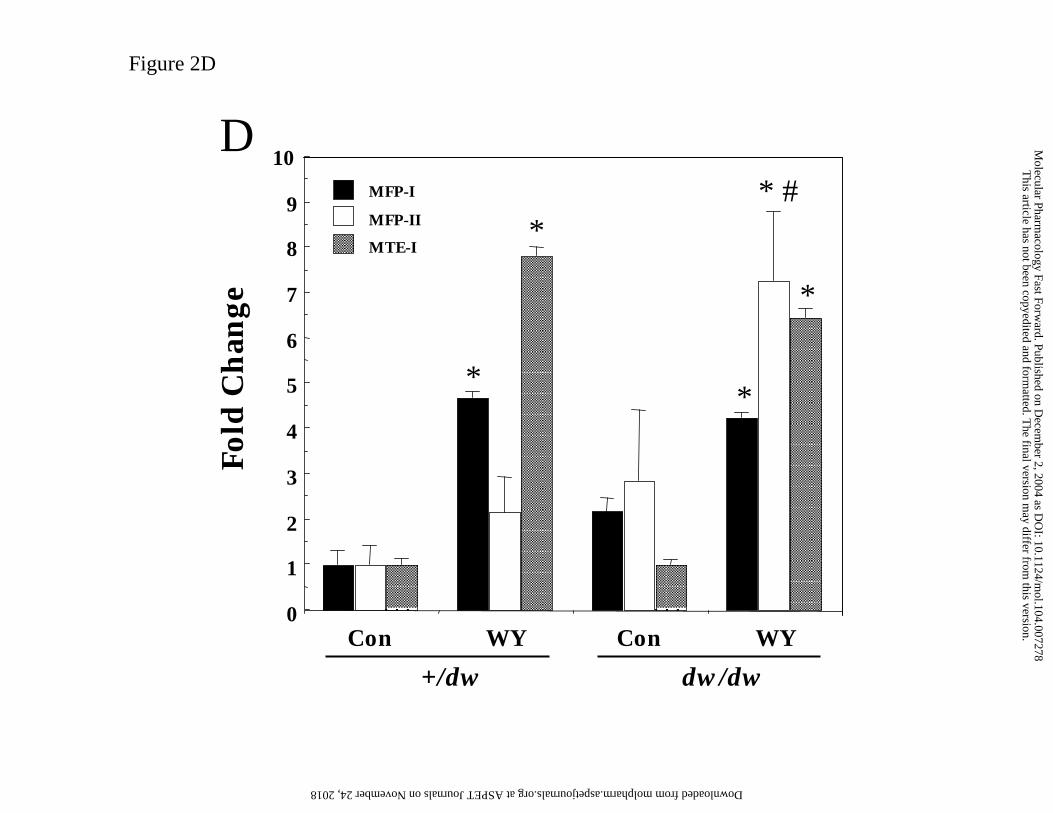
Figure 2D
Con WY Con WY0
1
2
3
4
5
6
7
8
9
10
MFP-I
MFP-II
MTE-IFo
ld C
han
ge
+/dw dw/dw
**
* #*
*
D
This article has not been copyedited and form
atted. The final version m
ay differ from this version.
Molecular Pharm
acology Fast Forward. Published on D
ecember 2, 2004 as D
OI: 10.1124/m
ol.104.007278 at ASPET Journals on November 24, 2018 molpharm.aspetjournals.org Downloaded from
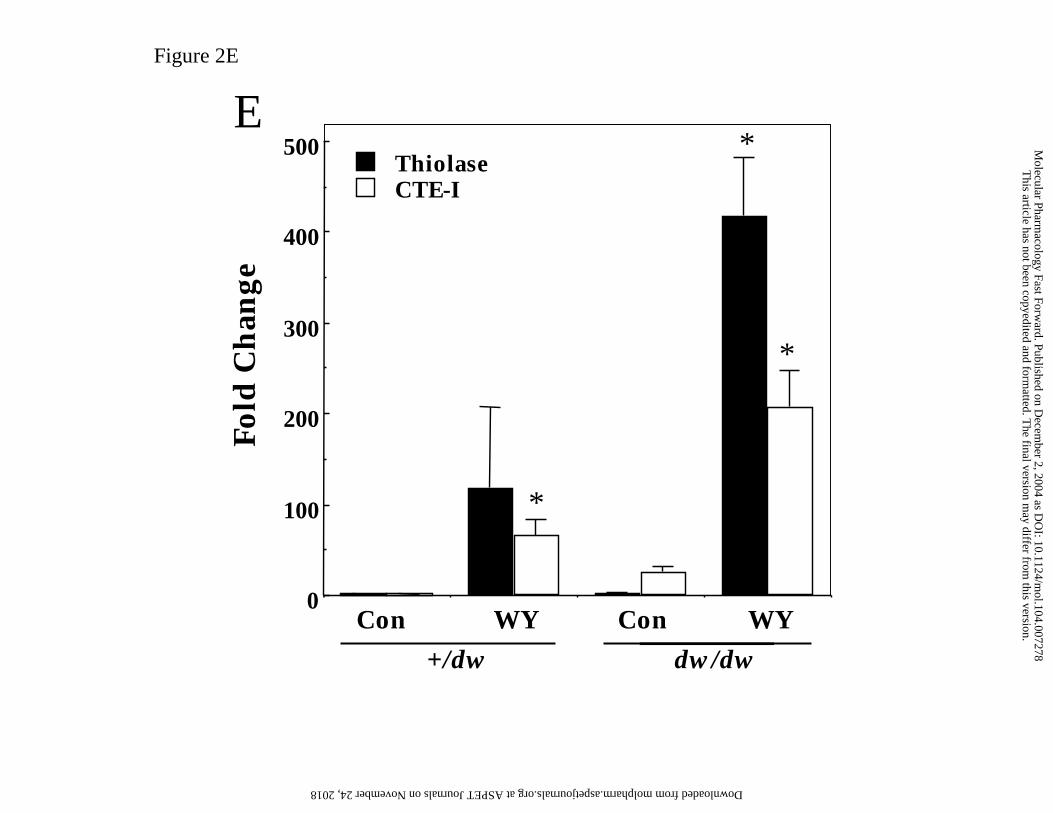
Con WY Con WY0
100
200
300
400
500ThiolaseCTE-I
Fold
Ch
ange
+/dw dw/dw
*
*
Figure 2E
E
*
This article has not been copyedited and form
atted. The final version m
ay differ from this version.
Molecular Pharm
acology Fast Forward. Published on D
ecember 2, 2004 as D
OI: 10.1124/m
ol.104.007278 at ASPET Journals on November 24, 2018 molpharm.aspetjournals.org Downloaded from
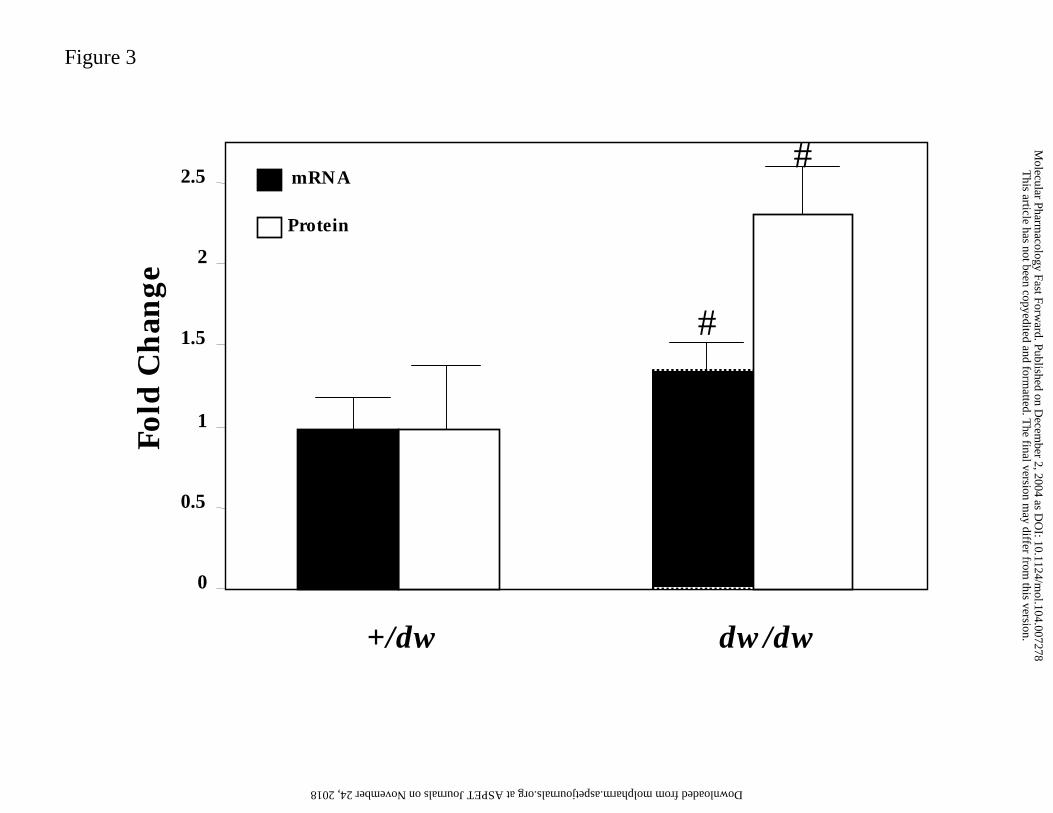
Figure 3
0
0.5
1
1.5
2
2.5Fo
ld C
han
gemRNA
Protein
+/dw dw/dw
#
# This article has not been copyedited and form
atted. The final version m
ay differ from this version.
Molecular Pharm
acology Fast Forward. Published on D
ecember 2, 2004 as D
OI: 10.1124/m
ol.104.007278 at ASPET Journals on November 24, 2018 molpharm.aspetjournals.org Downloaded from
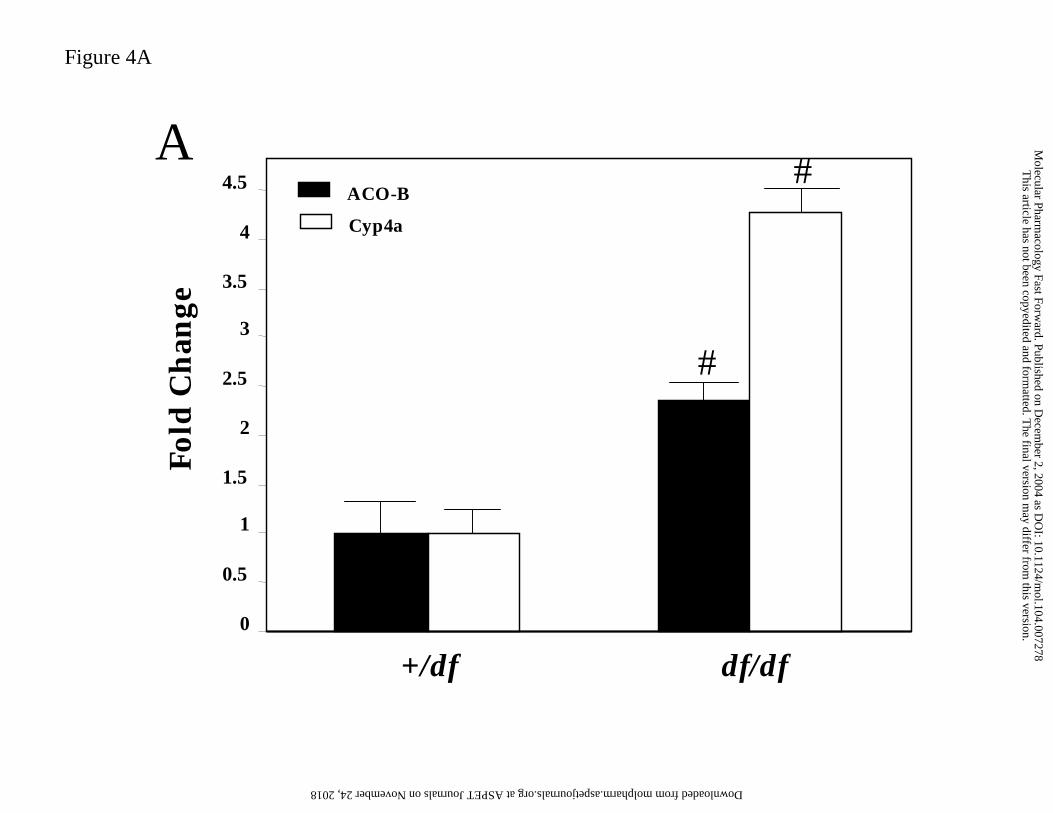
Figure 4A
0
0.5
1
1.5
2
2.5
3
3.5
4
4.5Fo
ld C
han
geACO-B
Cyp4a
A
+/df df/df
#
# This article has not been copyedited and form
atted. The final version m
ay differ from this version.
Molecular Pharm
acology Fast Forward. Published on D
ecember 2, 2004 as D
OI: 10.1124/m
ol.104.007278 at ASPET Journals on November 24, 2018 molpharm.aspetjournals.org Downloaded from
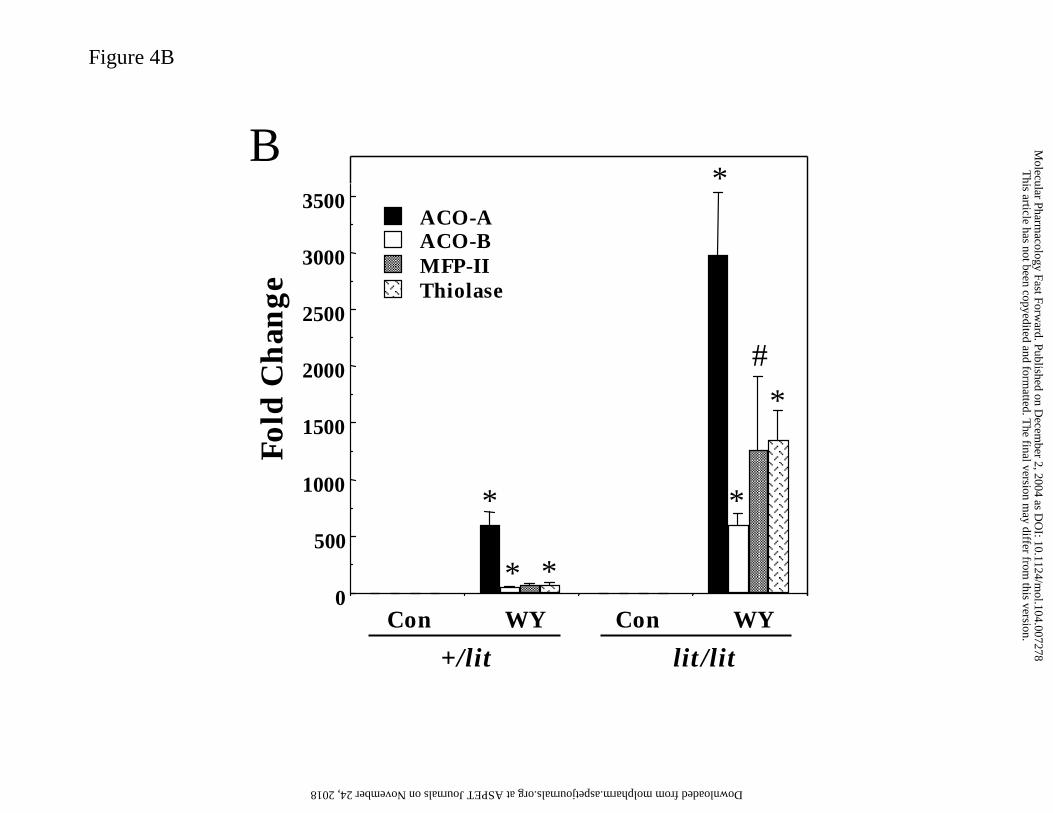
Con WY Con WY0
500
1000
1500
2000
2500
3000
3500ACO-AACO-BMFP-IIThiolase
Fold
Ch
ange
B
*
* *
*
*
*
+/lit lit/lit
Figure 4B
#
This article has not been copyedited and form
atted. The final version m
ay differ from this version.
Molecular Pharm
acology Fast Forward. Published on D
ecember 2, 2004 as D
OI: 10.1124/m
ol.104.007278 at ASPET Journals on November 24, 2018 molpharm.aspetjournals.org Downloaded from
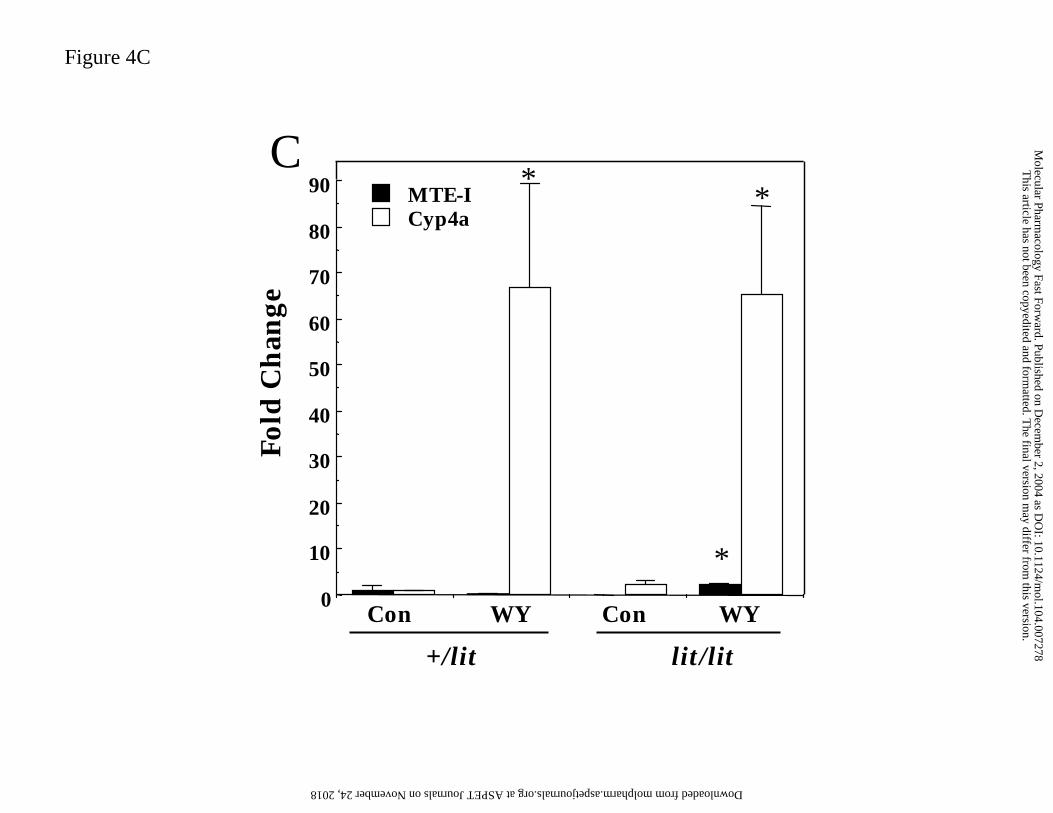
0
10
20
30
40
50
60
70
80
90 MTE-ICyp4a
Fold
Ch
ange
Con WY Con WY
+/lit lit/lit
C
Figure 4C
*
**
This article has not been copyedited and form
atted. The final version m
ay differ from this version.
Molecular Pharm
acology Fast Forward. Published on D
ecember 2, 2004 as D
OI: 10.1124/m
ol.104.007278 at ASPET Journals on November 24, 2018 molpharm.aspetjournals.org Downloaded from
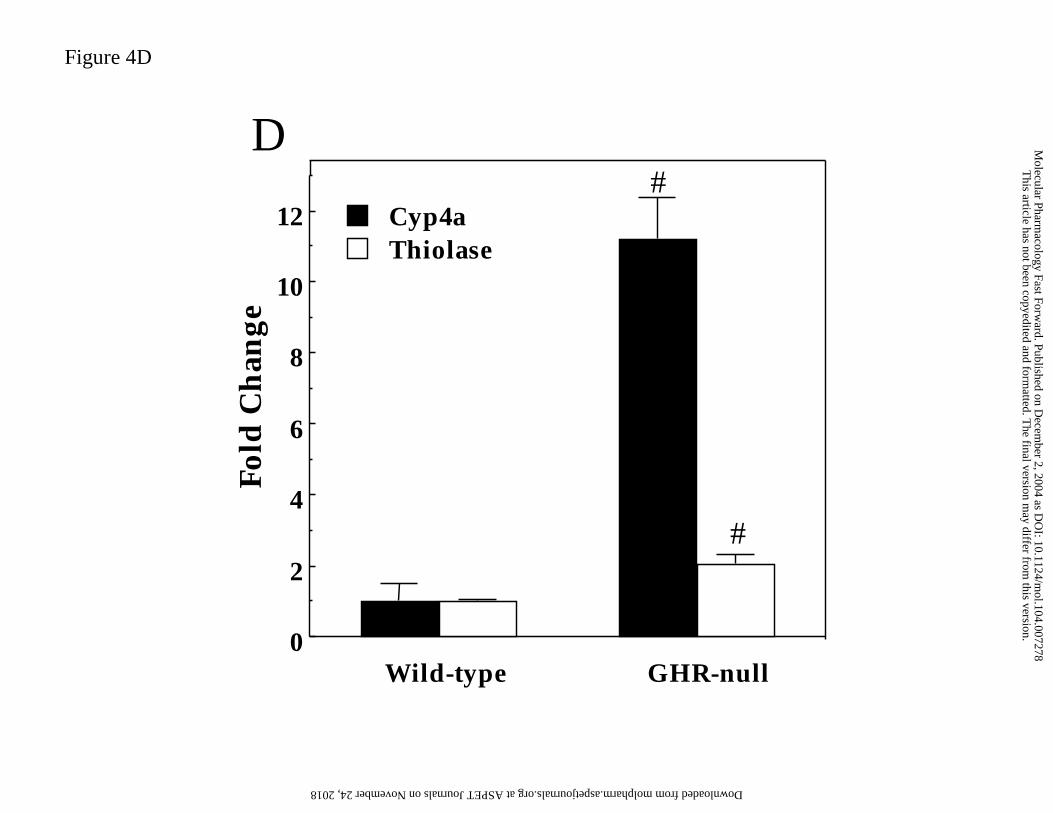
Figure 4D
0
2
4
6
8
10
12 Cyp4aThiolase
Fold
Ch
ange
Wild-type GHR-null
#
#
D
This article has not been copyedited and form
atted. The final version m
ay differ from this version.
Molecular Pharm
acology Fast Forward. Published on D
ecember 2, 2004 as D
OI: 10.1124/m
ol.104.007278 at ASPET Journals on November 24, 2018 molpharm.aspetjournals.org Downloaded from
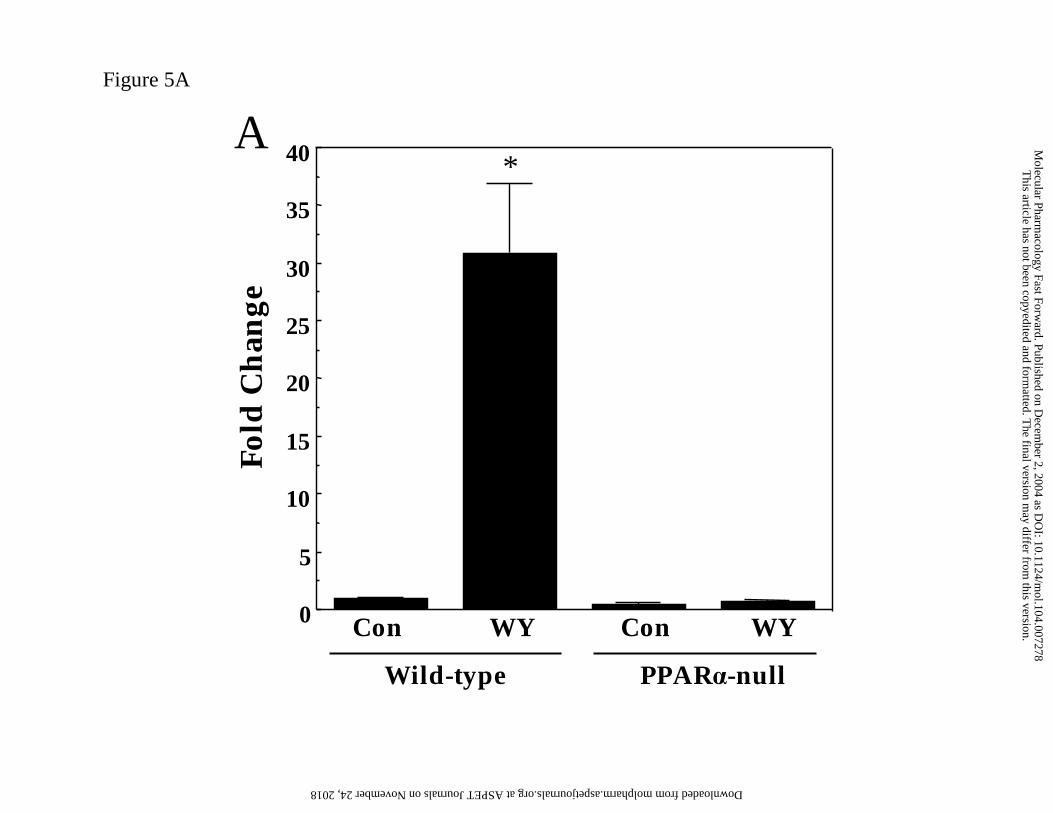
Figure 5A
0
5
10
15
20
25
30
35
40
Fold
Ch
ange
*
Con WY Con WY
Wild-type PPARα-null
A
This article has not been copyedited and form
atted. The final version m
ay differ from this version.
Molecular Pharm
acology Fast Forward. Published on D
ecember 2, 2004 as D
OI: 10.1124/m
ol.104.007278 at ASPET Journals on November 24, 2018 molpharm.aspetjournals.org Downloaded from
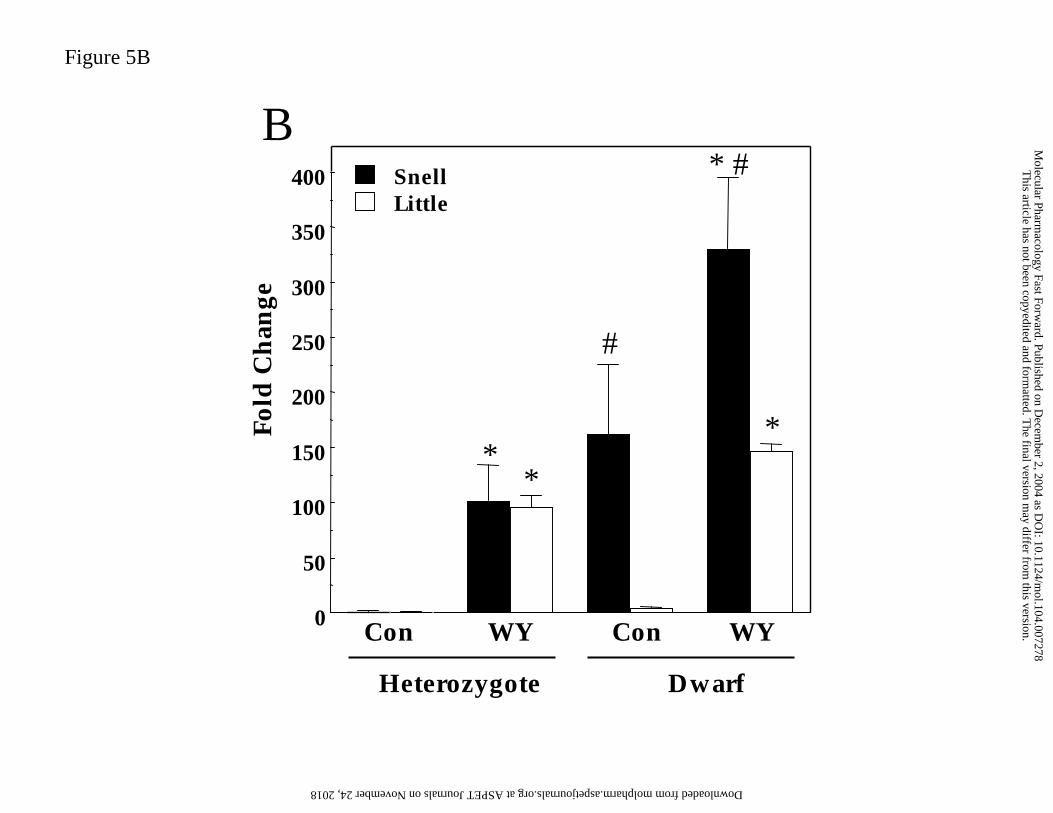
Figure 5B
0
50
100
150
200
250
300
350
400 SnellLittle
Fold
Ch
ange
Con WY Con WY
Heterozygote Dwarf
*
* #
*
B
*
#
This article has not been copyedited and form
atted. The final version m
ay differ from this version.
Molecular Pharm
acology Fast Forward. Published on D
ecember 2, 2004 as D
OI: 10.1124/m
ol.104.007278 at ASPET Journals on November 24, 2018 molpharm.aspetjournals.org Downloaded from
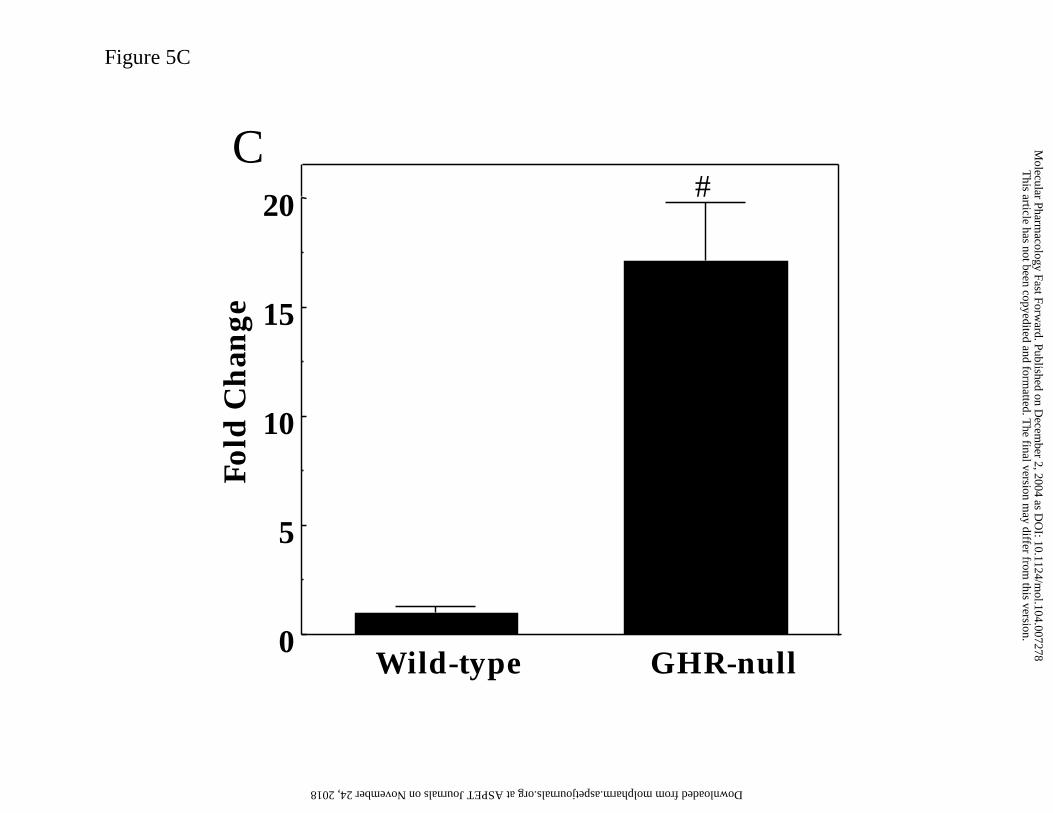
Figure 5C
Wild-type GHR-null0
5
10
15
20Fo
ld C
han
ge
#C
This article has not been copyedited and form
atted. The final version m
ay differ from this version.
Molecular Pharm
acology Fast Forward. Published on D
ecember 2, 2004 as D
OI: 10.1124/m
ol.104.007278 at ASPET Journals on November 24, 2018 molpharm.aspetjournals.org Downloaded from
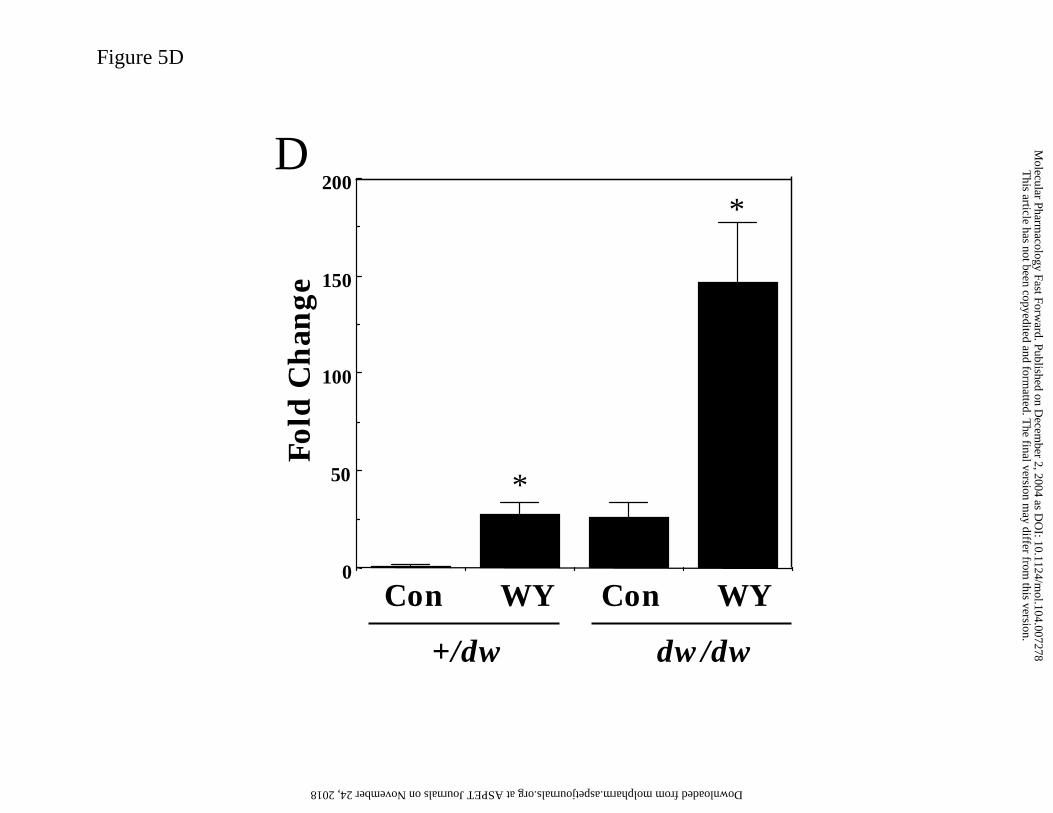
0
50
100
150
200
Fold
Ch
ange
*
*
Con WY Con WY
+/dw dw/dw
D
Figure 5D
This article has not been copyedited and form
atted. The final version m
ay differ from this version.
Molecular Pharm
acology Fast Forward. Published on D
ecember 2, 2004 as D
OI: 10.1124/m
ol.104.007278 at ASPET Journals on November 24, 2018 molpharm.aspetjournals.org Downloaded from
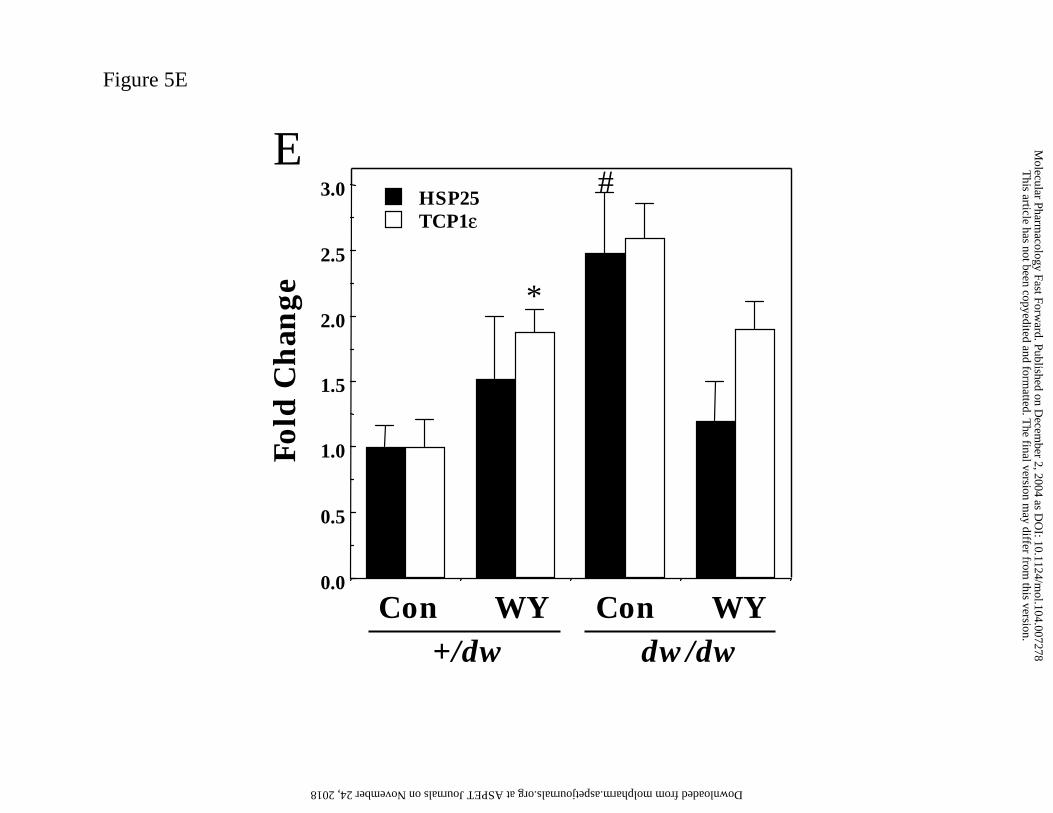
Figure 5E
0.0
0.5
1.0
1.5
2.0
2.5
3.0 HSP25TCP1ε
Fold
Ch
ange
E
Con WY Con WY+/dw dw/dw
#
*
This article has not been copyedited and form
atted. The final version m
ay differ from this version.
Molecular Pharm
acology Fast Forward. Published on D
ecember 2, 2004 as D
OI: 10.1124/m
ol.104.007278 at ASPET Journals on November 24, 2018 molpharm.aspetjournals.org Downloaded from
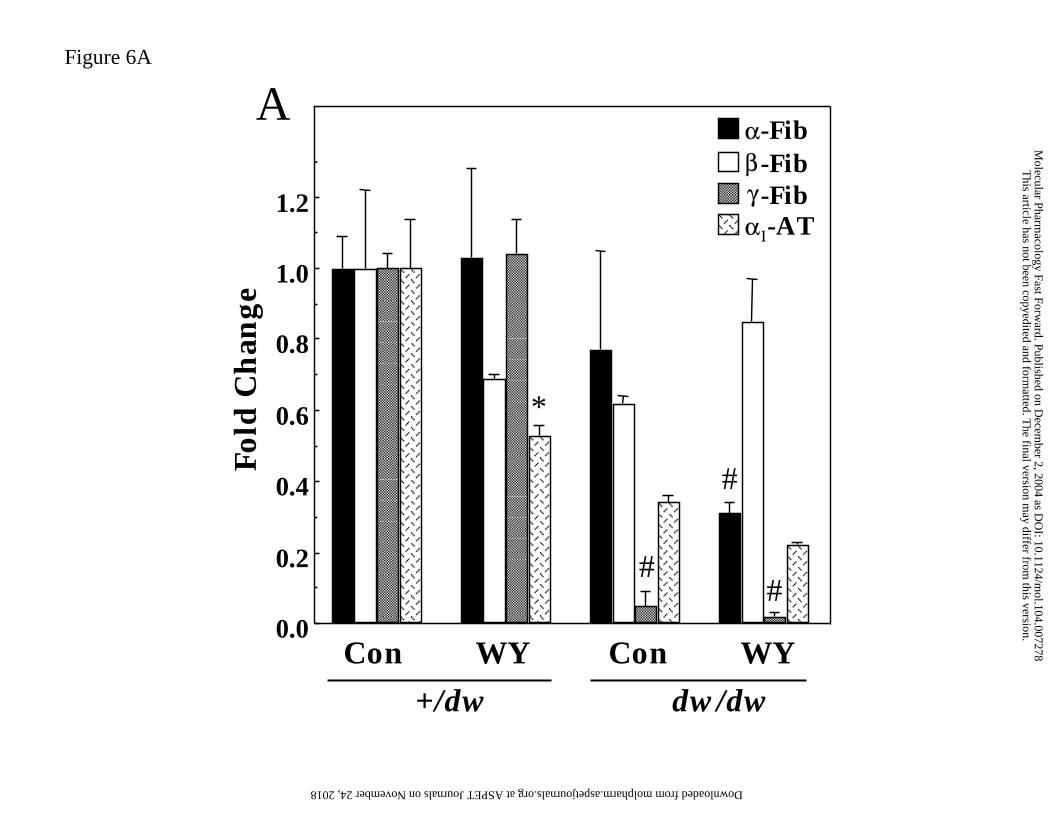
Figure 6A
0.0
0.2
0.4
0.6
0.8
1.0
1.2
-Fib-Fib-Fib-AT
αβγα1
Fold
Ch
ange
*
##
Con WY Con WY
+/dw dw/dw
A
#
This article has not been copyedited and form
atted. The final version m
ay differ from this version.
Molecular Pharm
acology Fast Forward. Published on D
ecember 2, 2004 as D
OI: 10.1124/m
ol.104.007278 at ASPET Journals on November 24, 2018 molpharm.aspetjournals.org Downloaded from
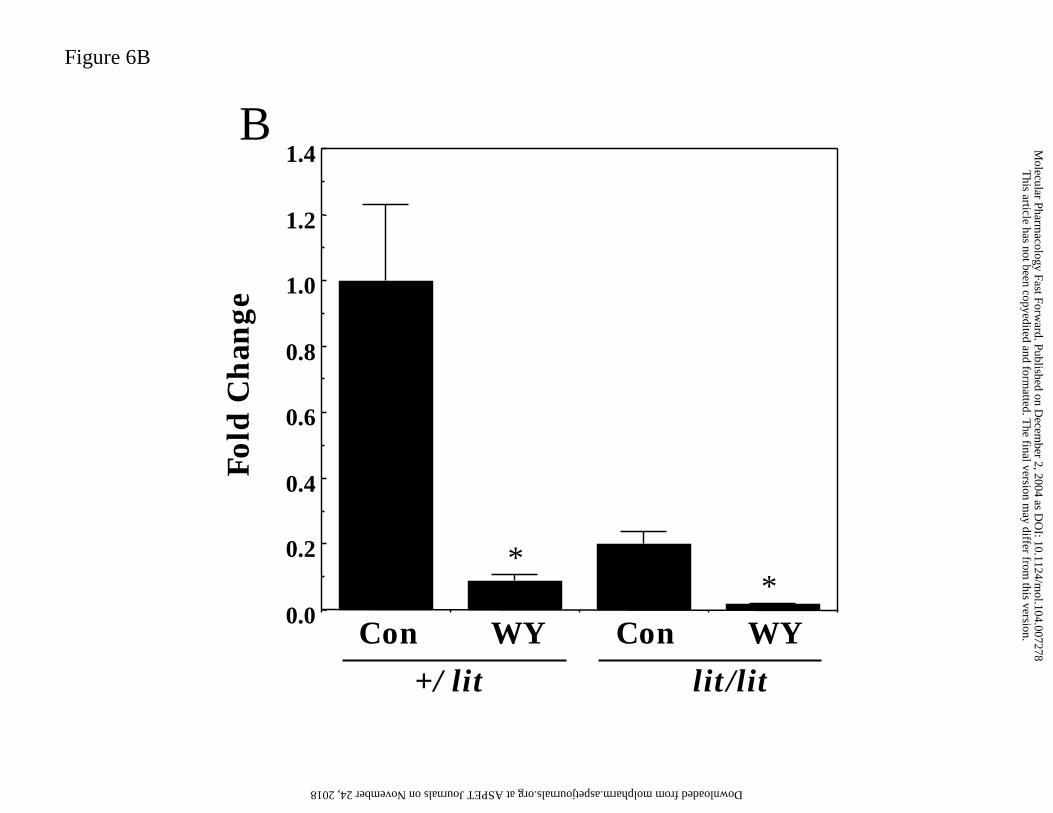
Figure 6B
0.0
0.2
0.4
0.6
0.8
1.0
1.2
1.4
Fold
Ch
ange
**
Con WY Con WY
+/ lit lit/lit
B
This article has not been copyedited and form
atted. The final version m
ay differ from this version.
Molecular Pharm
acology Fast Forward. Published on D
ecember 2, 2004 as D
OI: 10.1124/m
ol.104.007278 at ASPET Journals on November 24, 2018 molpharm.aspetjournals.org Downloaded from
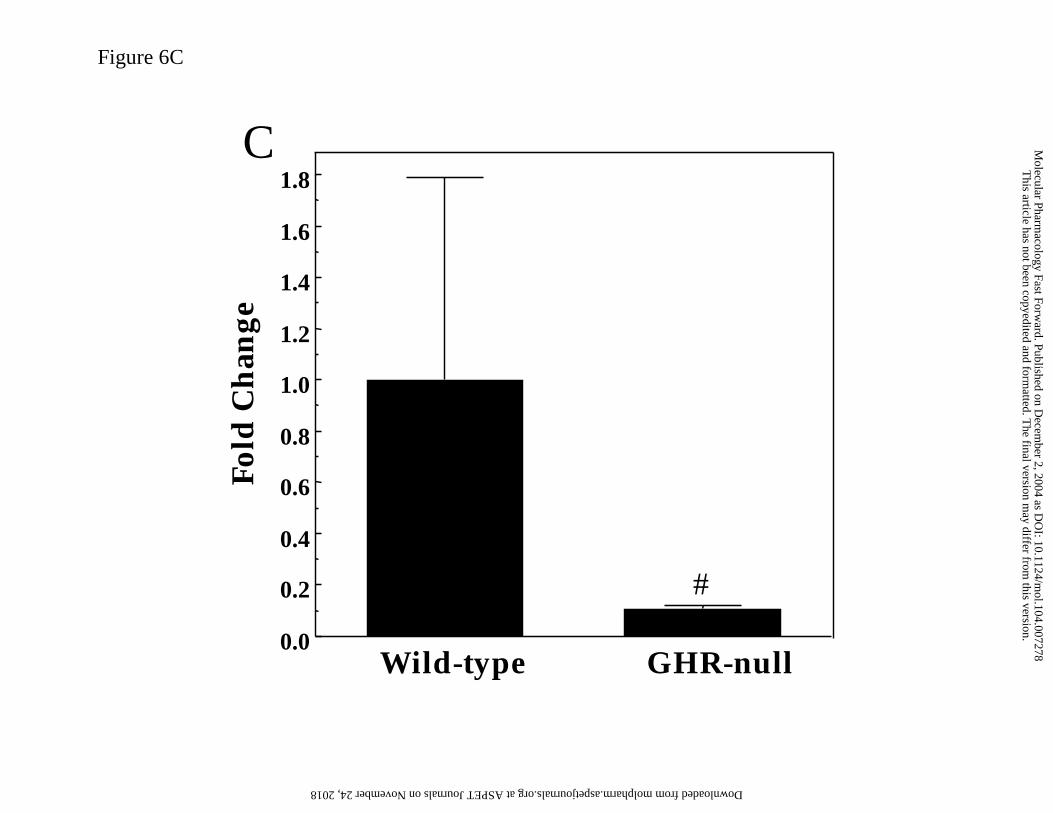
Figure 6C
0.0
0.2
0.4
0.6
0.8
1.0
1.2
1.4
1.6
1.8
Fold
Ch
ange
Wild-type GHR-null
#
C
This article has not been copyedited and form
atted. The final version m
ay differ from this version.
Molecular Pharm
acology Fast Forward. Published on D
ecember 2, 2004 as D
OI: 10.1124/m
ol.104.007278 at ASPET Journals on November 24, 2018 molpharm.aspetjournals.org Downloaded from