OXIDATIVE STABILITY, CHARACTERIZATION AND FOOD ...
141
OXIDATIVE STABILITY, CHARACTERIZATION AND FOOD APPLICATIONS OF A RICE BRAN OIL-BASED STRUCTURED LIPID by BRENDA HOLMES JENNINGS (Under the Direction of Casimir C. Akoh) ABSTRACT Rice bran oil structured lipid (RBOSL) was synthesized from rice bran oil (RBO) and caprylic acid (a medium chain fatty acid) by Lipozyme RM IM lipase-catalyzed acidolysis in a continuous packed-bed reactor. The vitamin E content of RBOSL was significantly lower than RBO while the γ-oryzanol concentration of RBOSL was not significantly different from RBO (P > 0.05). The oxidative stability of RBOSL was significantly lower than RBO (P ≤ 0.05). Natural and synthetic antioxidants were evaluated for their ability to increase the oxidative stability of RBOSL. The natural antioxidant carnosic acid from rosemary extract was as effective as the synthetic antioxidant TBHQ in increasing the oxidative stability of RBOSL. RBOSL contained 32.1 mol% caprylic acid which was primarily at the sn-1,3 positions. Saponification value, iodine value, and viscosity were significantly different for RBO and RBOSL (P > 0.05). Free fatty acid content and smoke point were not significantly different for RBO and RBOSL (P > 0.05). Melting onset temperatures were not significantly different while endpoint and melting enthalpies were significantly different (P ≤ 0.05). Sweet potato chips (SPC) were fried separately in RBO and RBOSL and energy bars (EB) were formulated with RBO or RBOSL. Triangle test (TT) results for SPC showed no
Transcript of OXIDATIVE STABILITY, CHARACTERIZATION AND FOOD ...
OXIDATIVE STABILITY, CHARACTERIZATION AND FOOD
APPLICATIONS OF A
RICE BRAN OIL-BASED STRUCTURED LIPID
by
BRENDA HOLMES JENNINGS
(Under the Direction of Casimir C. Akoh)
ABSTRACT
Rice bran oil structured lipid (RBOSL) was synthesized from rice bran oil (RBO) and caprylic
acid (a medium chain fatty acid) by Lipozyme RM IM lipase-catalyzed acidolysis in a
continuous packed-bed reactor. The vitamin E content of RBOSL was significantly lower than
RBO while the γ-oryzanol concentration of RBOSL was not significantly different from RBO
(P > 0.05). The oxidative stability of RBOSL was significantly lower than RBO (P ≤ 0.05).
Natural and synthetic antioxidants were evaluated for their ability to increase the oxidative
stability of RBOSL. The natural antioxidant carnosic acid from rosemary extract was as effective
as the synthetic antioxidant TBHQ in increasing the oxidative stability of RBOSL.
RBOSL contained 32.1 mol% caprylic acid which was primarily at the sn-1,3 positions.
Saponification value, iodine value, and viscosity were significantly different for RBO and
RBOSL (P > 0.05). Free fatty acid content and smoke point were not significantly different for
RBO and RBOSL (P > 0.05). Melting onset temperatures were not significantly different while
endpoint and melting enthalpies were significantly different (P ≤ 0.05).
Sweet potato chips (SPC) were fried separately in RBO and RBOSL and energy bars
(EB) were formulated with RBO or RBOSL. Triangle test (TT) results for SPC showed no
significant difference in SPC fried in RBO or RBOSL and TT for EB showed a significant
difference in RBO and RBOSL formulations (P ≤ 0.05). Willingness to purchase consumer
panel (5 point scale) results revealed that the most frequent response was probably would buy for
SPC and EB prepared with RBOSL.
Shortening blends were formulated with RBO or RBOSL and palm stearin (PS). The
caprylic acid content of shortening blends containing RBOSL and palm stearin ranged from 9.9-
22.1 mol%. RBOSL blended with PS was comparable to RBO blended with PS in producing
shortening with similar fatty acid profiles, solid fat content, melting and crystallization properties
and crystal morphologies similar to commercial shortenings. RBOSL blended with PS can
provide a healthier alternative to vegetable oils currently blended with PS to produce trans-free
shortening.
INDEX WORDS: Antioxidant, Biological catalyst, Caprylic acid,
Continuous packed-bed bioreactor, Energy bar, Frying, Lipase
catalyzed acidolysis, Lipozyme RM IM, Oxidative stability, Rice
bran oil, Structured lipids, Sweet potato chips, Triangle test
OXIDATIVE STABILITY, CHARACTERIZATION AND FOOD
APPLICATIONS OF A
RICE BRAN OIL-BASED STRUCTURED LIPID
by
BRENDA HOLMES JENNINGS
BS., Mississippi State University, 1983
M.Ed., Mississippi State University, 1985
M.S., The University of Georgia, 1999
A Dissertation Submitted to the Graduate Faculty of The University Of Georgia in Partial
Fulfillment of the Requirements for the Degree
DOCTOR OF PHILOSOPHY
ATHENS, GEORGIA
2009
© 2009
Brenda Holmes Jennings
All Rights Reserved
OXIDATIVE STABILITY, CHARACTERIZATION AND FOOD
APPLICATIONS OF A
RICE BRAN OIL-BASED STRUCTURED LIPID
by
BRENDA HOLMES JENNINGS
Major Professor: Casimir C. Akoh
Committee: Robert L. Shewfelt
Rakesh Singh
Yao-Wen Huang
Louise Wicker
Electronic Version Approved:
Maureen Grasso
Dean of the Graduate School
The University of Georgia
December 2009
iv
DEDICATION
Dedicated to my grandparents, parents, husband and children

v
ACKNOWLEDGEMENTS
I want to thank God for leading me through this very difficult journey. I always felt his
presence and guidance and I truly could not have done it without him. I would like to thank Dr.
Casimir Akoh for giving me the opportunity to pursue my master’s degree then my Ph.D. in his
laboratory. I will always appreciate his patience and guidance. Also special thanks to my
graduate committee Drs. Shewfelt, Huang, Kerr, Eitenmiller, and Wicker for their guidance.
Very special thanks to the graduate students and staff past and present in my lab and in
other labs. Among those who were very helpful included Stephen Enyam Lumor, Byung Hee
Kim, Lydia Fumoso, Darlene Samuel and Ki Teak Lee. To Victoria Wentzel, Ashanty Pina and
Garima Pande, I enjoyed working with everyone and they taught me a great deal about many
things.
I am truly grateful to my family for their support and all of their sacrifices during my
pursuit of this degree. To my husband Dr. Cecil Jennings, your never-ending support and
guidance was invaluable and truly appreciated.
vi
TABLE OF CONTENTS
Page
ACKNOWLEDGEMENTS----------------------------------------------------------------------------------v
LIST OF TABLES------------------------------------------------------------------------------------------vii
LIST OF FIGURES------------------------------------------------------------------------------------------ix
CHAPTER
1 INTRODUCTION--------------------------------------------------------------------------1
2 LITERATURE REVIEW------------------------------------------------------------------4
3 EFFECTIVENESS OF NATURAL VERSUS SYNTHETIC
ANTIOXIDANTS IN A RICE BRAN OIL-BASED STRUCTURED
LIPID----------------------------------------------------------------------------------------29
4 CHARACTERIZATION OF A RICE BRAN OIL-BASED
STRUCTURED LIPID--------------------------------------------------------------------59
5 FOOD APPLICATIONS OF A RICE BRAN OIL STRUCTURED LIPID
IN FRIED SWEET POTATO CHIPS AND AN ENERGY BAR-----------------81
6 TRANS FREE PLASTIC FATS PREPARED WITH PALM STEARIN
AND RICE BRAN OIL STRUCTURED LIPID------------------------------------107
7 CONCLUSIONS-------------------------------------------------------------------------129
vii
LIST OF TABLES
Page
Table 3.1: Fatty acid profile of rice bran oil before and after modification (mol%)----------------49
Table 3.2: Vitamin E content of rice bran oil (RBO) in mg/100 mL before modification and rice
bran oil-based structured lipid (RBOSL) after modification-------------------------------------------50
Table 3.3: Gamma oryzanol major components of rice bran oil (RBO) before modification and
rice bran oil-based structured lipid (RBOSL) after modification (µg/mL)-------------51
Table 3.4: Oxidative stability index (OSI) values (h) at different antioxidant concentrations----52
Table 4.1: Fatty acid composition (mol %) of total, sn-2, and sn-1,3 positions of TAG of rice
bran oil and rice bran oil structured lipid (RBOSL)-------------------------------------------74
Table 4.2: Chemical and physical properties of rice bran oil and rice bran oil structured lipid
(RBOSL) --------------------------------------------------------------------------------------75
Table 4.3: CIE L*a*b* Color of rice bran oil and rice bran oil structured lipid (RBOSL)----- 76
Table 4.4: Volatile compounds in rice bran oil and rice bran oil structured lipid (RBOSL)---- 77
Table 4.5: Differential scanning calorimetry (DSC) melting properties of rice bran oil and rice
bran oil structured lipid (RBOSL)--------------------------------------------------------------78
Table 5.1: Fatty acid profile (mol%) of rice bran oil structured lipid (RBOSL) before and after
frying sweet potato chips at 185⁰C-------------------------------------------------------------100
Table 5.2: Chemical characteristics of rice bran oil (RBO) and rice bran oil structured lipid
(RBOSL) before frying sweet potato chips---------------------------------------------------101
iv
Table 5.3: Chemical characteristics of rice bran oil (RBO) and rice bran oil structured lipid
(RBOSL) after frying sweet potato chips--------------------------------------------------101
Table 5.4: Color values of sweet potato chips after frying in rice bran oil (RBO) and rice bran oil
structured lipid (RBOSL) ------------------------------------------------------------------102
Table 6.1: Fatty acid profiles of shortening blends, commercial shortening, palm stearin,
rice bran oil (RBO) and rice bran oil structured lipid (RBOSL)-----------------------121
iv
LIST OF FIGURES
Page
Figure 3.1: Peroxide values of rice bran oil structured lipid (RBOSL) with various
antioxidants and antioxidant concentrations-----------------------------------------------54
Figure 3.2: p-Anisidine values of rice bran oil structured lipid (RBOSL) with various
antioxidants and antioxidant concentrations-----------------------------------------------56
Figure 4.1: Differential scanning calorimetry (DSC) thermograms of rice bran oil and rice bran
oil structured lipid (RBOSL)-----------------------------------------------------------------80
Figure 5.1: Willingness to purchase sweet potato chips fried in rice bran oil structured lipid
--------------------------------------------------------------------------------------------------104
Figure 5.2: Willingness to purchase energy bars formulated with rice bran oil structured lipid
-------------------------------------------------------------------------------------------------106
Figure 6.1: Solid fat contents of shortening blends of rice bran oil (RBO) or rice bran oil
structured lipid (RBOSL) and palm stearin and commercial shortenings-----------124
Figure 6.2: Melting profiles of shortening blends containing rice bran oil (RBO) or rice bran
oil structured lipid (RBOSL) and palm stearin and commercial shortenings ------126
Figure 6.3: Crystallization profiles of shortening blends containing rice bran oil (RBO) or rice
bran oil structured lipid (RBOSL) and palm stearin and commercial shortenings
------------------------------------------------------------------------------------------------128
1
CHAPTER 1
INTRODUCTION
Akoh and Kim (2008) defined structured lipids (SL) as triacylglycerols (TAGs) that have
been modified by incorporation of new fatty acids, restructured to change the positions of fatty
acids or the fatty acid profile, from the natural state, or synthesized to yield novel TAGs. SL
components include short chain fatty acids (SCFA), medium chain fatty acids (MCFA), and long
chain fatty acids (LCFA). SCFA are lower in calories and more rapidly absorbed than MCFA or
LCFA. LCFA such as linoleic acid are essential fatty acids and are therefore important SL
components. MCFAs provide a quick energy source which can be rapidly oxidized and utilized.
They are metabolized through the portal system instead of the lymphatic system as are LCFA.
MCFAs have been used to treat patients with fat absorption abnormalities and by athletes with
increased energy requirements (Kennedy 1991; Megremis 1991). Previous animal and human
studies have shown that the composition of TAGs containing MCFA result in increased energy
expenditure and decreased weight gain (St-Onge and Jones 2002, St-Onge and others, 2003).
The mobility, solubility and ease of metabolism of MCFAs provide health benefits when
incorporated into SL. Therefore, the characteristic component fatty acids of SL determine the
physical properties, digestion, absorption, and metabolism of SL. Improved immune function,
reduction in LDL cholesterol, improved nitrogen balance, and reduction in cancer risk are among
the health benefits of SLs (Akoh and Kim, 2008).
Specific fatty acids can serve as acyl donors and can be esterified onto specific positions
of TAG using sn-1, 3 lipases such as Lipozyme RM IM. For this study rice bran oil was
transesterified with the MCFA (caprylic acid) targeted at the sn-1 and sn-3 positions with
primarily LCFA oleic and linoleic acids at the sn-2 position. Fatty acids at the sn-1 and sn-3
2
positions are rapidly hydrolyzed and not stored as fat, whereas fatty acids at the sn-2 position are
more readily absorbed (Jandacek, 1987).
SLs are produced enzymatically from transesterification and direct esterification
reactions. In direct esterification reactions, free fatty acids are reacted with glycerol.
Transesterification for SL synthesis for this study was an acidolysis reaction (a reaction between
an ester and a free acid). Enzymatic esterification offers distinct advantages of positional
specificity and milder reaction conditions compared to chemical esterification (Akoh, 1995;
Akoh and Kim, 2008).
Lipase-catalyzed modification of TAGs can result in changes in the oxidative stability
and chemical and physical characteristics of the end product different from the starting TAGs.
Determination of oxidative stability and characterization of enzymatically modified TAG is
necessary to improve oxidative stability and determine potential nutraceutical and food
applications. Rice bran oil structured lipid (RBOSL) which is liquid at room temperature can
potentially be used in frying and baking applications and in shortening blends.
OBJECTIVES
The specific research objectives were:
1. To prepare a rice bran structured lipid and determine the extent to which natural
antioxidants affect the oxidative stability of rice bran oil structured lipid
compared to synthetic antioxidants
2. To determine the chemical and physical characteristics of a rice bran oil
structured lipid compared to the unmodified rice bran oil
3. To use a rice bran oil structured lipid for frying sweet potato chips and in an
energy bar that will be acceptable to a sensory panel
3
4. To prepare shortening containing different ratios of palm stearin and rice bran oil
structured lipid and to determine how the physical characteristics compare with
commercial shortenings and blends of rice bran oil and palm stearin
REFERENCES
Akoh CC. 1995. Structured lipids-enzymatic approach. INFORM 6(9):1055-62.
Akoh CC, Kim BH 2008. Structured lipids. In: Akoh CC, Min DB, editors. Food lipids-
chemistry, nutrition, and biotechnology, 3rd edn CRC Press; Boca Raton, FL pp 841-42.
Jandacek RJ, Whiteside JA, Holcombe BN, Volpenhein RA, Taulbee JD.1987. The rapid
hydrolysis and efficient absorption of triacylglycerides with octanoic acid at the 1 and 3 positions
and long-chain fatty acids in the 2 position. Am J Clin Nutr 45(5):940-45.
Kennedy JP. 1991. Structured Lipids: fats of the future. Food Technol 45(11):76-83.
Megremis CJ.1991. Medium-chain triglycerides: a nonconventional fat. Food Technol
45(2):108-14.
St-Onge MP, Jones PJH. 2002. Physiological effects of medium-chain triglycerides: Potential
agents in the prevention of obesity. J Nutr 132(3):329-32.
St-Onge M.-P.; Ross R, Pearsons WD, Jones PJH.2003. Medium-chain triglycerides increase
energy expenditure and decrease adiposity in overweight men. Obesity Res 11(3):395-402.
4
CHAPTER 2
LITERATURE REVIEW
RICE BRAN OIL
Rice bran oil is a by-product of rice milling and is consumed widely in Asia (Sharkar and
Bhattacharuua, 1991). Rice bran oil for use in foods has been commercially produced in the
United States since 1994. Rice bran oil has a very appealing nut-like flavor, high oxidative
stability, and is well suited for frying (McCaskill and Zhang, 1999). The nutraceutical potential
of tocotrienol, sterol, and γ-oryzanol in rice bran oil contributes to rising interest in rice bran oil
in U.S. markets.
Gamma-oryzanol, which is a mixture of ferulic acid esters of sterols (campesterol,
stigmasterol, and β-sitosterol) and terpene alcohols (cycloartanol, cycloartenol, 24-
methylenecycloartanol and cyclobranol) is found on RBO and of special interest to researchers
because of the health promoting properties and commercial potential offered by these bioactive
compounds (Lerma-Garcia and others, 2009). γ-Oryzanol has been found to lower plasma
cholesterol (Rukmini and Rughuram, 1991), reduce cholesterol absorption (Seetharamaiah and
Chadrasekhara 1990) and inhibit platelet aggregation (Seetharamaiah and others, 1990). Rice
bran oil consists of 38% oleic acid, 34% linoleic acid, 1% myristic acid, 22% palmitic acid, 3%
stearic acid and 2% linolenic acid (Rukmini and Raghuram, 1991).
Jennings and Akoh (2000b) successfully incorporated capric acid (C10:0) into rice bran
oil. This study determined the effects of incubation time, substrate mole ratio, enzyme load and
water addition in a small scale study. This is an area of potential research because of the health
benefits of rice bran oil would be combined with the health benefits of medium chain fatty acids
(MCFA) in a rice bran oil structured lipid used in a food application.
5
STRUCTURED LIPIDS
Structured lipids (SLs) are produced by modifying triacylglycerols (TAGs) from their
natural state to incorporate new fatty acids or to change the position of fatty acids or the fatty
acid profile (Akoh and Kim, 2008). TAGs are modified to produce SL from their natural state
to change their nutritional and functional properties for medical and food applications. Specific
fatty acids can be targeted at specific positions to produce SL with desired chemical and physical
properties.
Some examples of commercially available structured lipids containing medium chain
fatty acids include Betapol™ (Loders Croklaan Company, Holland), which has a fatty acid
profile similar to human milk and Bohenin which consists of behenic and oleic acids (Fuji
Vegetable Oil Inc., GA). Another example is Caprenin (Proctor and Gamble, OH) which consists
of long and short chain fatty acids and Salatrim (Coulter Food science, NY) which consists of
short and long chain fatty acids (Akoh, 2002).
STRUCTURED LIPID COMPONENTS
Short Chain Fatty Acids
Short chain fatty acids (SCFAs) with 2 to 6 carbon fatty acids are also referred to as
volatile fatty acids. They are the end products of microbial digestion of carbohydrates and occur
throughout the digestive tract of mammals (Wolin, 1981) and are important to ruminant
metabolism (Kristensen and Harman, 2006). The three major straight chain SCFAs are acetic,
propionic, and butyric acids (Leng, 1970). Humans ingest SCFA during the consumption of
bovine milk, which contains 5-10% butyric acid and 3-5% caproic acid (Brekenridge and Kuksis,
1967; Garton, 1963). SCFAs are used in the synthesis of reduced-calorie structured lipids
because they contain fewer calories than LCFA or MCFA. SCFA are also more rapidly absorbed
6
and more soluble in water because of their smaller molecular size and chain length (Akoh and
Kim, 2008). SCFA have been found to stimulate leptin production which in turn regulates
physiological functions such as metabolic rate and immune function (Xiong and others, 2004).
Medium Chain Fatty Acids
Coconut oil and palm kernel oil are the major sources of MCFA which usually contain 6-
12 carbons. MCFA are used to treat medical conditions such as fat absorption abnormalities in
newborn infants and in patients with cystic fibrosis (Kennedy, 1991). Medium chain
triacylglycerols (MCT) also have been used by athletes requiring high energy diets (Megremis,
1991). Composition of TAGs containing MCFA increases energy expenditure and decreases
weight gain in animal and human studies (St-Onge and Jones 2002, St-Onge and others, 2003).
MCFA are metabolized through the portal system, whereas long chain fatty acids are
metabolized through the lymphatic system. MCFA are therefore quickly absorbed by the body
and not stored as fat (Babayan, 1988). MCFA alone do not supply essential fatty acids (EFA)
and can be toxic (Akoh, 1995). Therefore, MCFA are used in structured lipids that contain EFA
on the glycerol backbone. MCFA often are targeted at the 1- and 3- positions and EFA at the 2-
position of TAGs during SL synthesis. Fatty acids at the 1- and 3- positions are hydrolyzed by
pancreatic lipase, and fatty acids at the 2-position are more readily absorbed than 1- and 3-
position fatty acids (Haumann, 1997). Two-position fatty acids pass through the intestinal wall
and are incorporated into the chylomicrons (Nettleton, 1995).
The properties that contribute to more efficient metabolism of MCFA are lower melting
point, higher solubility in water and biological fluids, and smaller molecular size as compared to
long chain fatty acids (Bach and Babayan, 1982). MCTs are effective in obesity control,
lowering serum cholesterol and providing quick concentrated energy as well as providing a
7
nutritional source for the growth and physiological development of newborn infants (Babayan,
1988).
Essential Fatty Acids
Essential fatty acids cannot be synthesized by the body and must be supplied by the diet
(Min and Crawford, 2004). Examples of EFA include linoleic acid (18:2n-6), alpha-linolenic
acid (18:3n-3), and arachidonic acid (20:4n-6). These fatty acids are also considered long chain
fatty acids (LCFA) and include n-3 and n-6 fatty acids. Linolenic acid is converted to gamma-
linolenic acid, arachidonic acid, and alpha-linolenic acid through a series of carbon chain
elongation and desaturation steps by enzymes called elongases and desaturases (Min and
Crawford, 2004). Deficiencies of these fatty acids lead to the loss of excessive amounts of water
through the skin and disturbances in growth and hormonal balance (Newton, 1996). Arachidonic
acid is a precursor to prostanoids, thromboxane, and leukotrienes, which are known as
eicosanoids. These biochemicals play a major role in immune function and platelet aggregation
(Kinsella, 1988).
LIPASES
Plants, animals, bacteria, molds, and yeasts are sources of lipases which are also known
as triacylglycerol ester hydrolases (EC 3.1.1.3). Lipases from microbial sources are more widely
studied than other lipases because they are more readily available, being easy to isolate, and very
stable, and because they can distinguish between enantiomers of chiral molecules. Lipases act at
the oil water-interface and therefore do not strictly follow Michaelis Menton kinetics (Villeneuve
and Foglia, 1997). Lipases have three-dimensional structures and catalyze the hydrolysis of
TAG to yield monoacylglycerol (MAG), diacylglycerol (DAG), glycerol, and free fatty acids
(FFA). The active site of lipases is buried under a short stretch of helix or hydrophobic lid.
8
During activation at the oil-water interface, the lid opens and goes into the lipid phase and
exposes the substrate to the active site (Weete and others, 2008).
Lipases catalyze ester hydrolysis, direct esterification and transesterification reactions.
Acidolysis, alcoholysis and interesterification are types of transesterification reactions.
Acidolysis is the exchange of acyl groups between an acid and an ester; alcoholysis is acyl group
exchange between an alcohol and an ester and interesterification is the exchange of two acyl
groups (Willis and Marangoni, 2008).
Lipases are often immobilized to increase cost effectiveness and reusability, shorten
reaction times, and control product formation and to more easily separate reactants from products
(Willis and Marangoni, 2008). Immobilization is the conversion of enzymes from a water-
soluble, mobile state to a water-insoluble, immobile solid state by the attachment of the enzyme
to a solid support material. Adsorption can occur through ion exchange, hydrophobic,
hydrophilic, and van der Waals interactions (Mustranta and others, 1993). Examples of
hydrophobic support media used to immobilize enzymes include organic supports such as
polyethylene, polypropylene, styrene, and acrylic polymers. Lipases generally retain the highest
degree of activity when immobilized on hydrophobic supports (Malcata and others, 1990). This
higher activity is ascribed to increased amounts of hydrophobic substrate at the interface
(Malcata and others, 1990; Malcata and others, 1992). Among hydrophilic supports are Duolite,
Celite, silica gel, activated carbon, clay, and Sepharose (Malcata and others, 1990).
Lipozyme RM IM is an immobilized lipase that catalyzes esterification and
interesterification reactions. Specific interesterification reactions involve the sn 1 and 3 positions
of triacylglycerols. Lipozyme RM IM is derived from Mucor miehei. The gene coding from the
lipase has been transferred to Aspergillus oryzae. This enzyme is granular with a particle size
9
that ranges from 0.2-0.6 mm with a bulk density of 350-450 kg/m3.
Lipozyme RM IM is
immobilized on a macroporpus anion exchange phenolic resin which is bound by adsorption
without the use of crosslinking agents with an activity of 5-6 BAUN/g (Novo Nordisk, 1992).
PRODUCTION OF STRUCTURED LIPIDS BY ACIDOLYSIS
Acidolysis can be used to incorporate different fatty acids into TAGs producing SLs.
The incorporation of free acids of the n-3 PUFAs, EPA and DHA into vegetable oils to increase
their nutritional value is one example (Willis and Marangoni, 2008). Another example is cocoa
butter substitutes being produced by acidolysis. In this process, 1,3-dipalmitoyl-oleoyl-glycerol
from palm oil is esterified with stearic acid (Macrae, 1983; Macrae and Hammond, 1985). Other
examples include the enzymatic modification of sesame oil (Jennings and Akoh, 2000a), rice
bran oil (Jennings and Akoh, 2000b) and fish oils with capric acid (Jennings and Akoh, 1999;
Jennings and Akoh 2001). Fomuso and others (2002) and Kim and Akoh (2006) enzymatically
modified olive oil and sesame oil respectively with caprylic acid. The production of milk fat
substitutes for the replacement of milk fat in baby foods by the acidolysis of palm oil top
fraction, which is high in 2-palmitoyl glycerides with unsaturated fatty acids so that it more
closely resembles human milk, is yet another example (King and Padley, 1990; Akoh, 2002).
ENZYMATIC INTERESTERIFICATION REACTORS
Fixed-bed reactors are a type of continuous flow reactor for enzymatic interesterification
reactions. Fixed-bed reactors are well suited for large scale production and are efficient to
operate and cost effective. In addition, these reactors provide a large surface area per unit
volume for the enzymatic interesterification reaction to occur. Fixed-bed reactors consist of a
pump to keep a constant flow rate through the system and a water-jacketed outer column to allow
for constant temperature control. An immobilized enzyme is packed in the inner column and the
10
substrates are fed through the column, and the products exits from an opening on the opposite
end of the column (Akoh and Kim, 2008).
Stirred-batch reactors are also commonly used in lipase catalyzed interesterification
reactions because they are simple and economical. Reactants and products are added and
removed before and after the reactions. The amount of substrate is reduced as the reaction
proceeds, which decreases reaction rate. The stirred-batch reactor consists of a vessel with an
agitator to mix the substrate and enzyme. Temperature is controlled by water circulated between
the outer and inner wall of the vessel. Continuous stirred-tank reactors consist of an agitated
tank with reactant and products are added and removed at the same rate. This type of reactor
combines elements of the fixed bed and batch reactors (Akoh and Kim, 2008).
Another type of enzymatic interesterification reactors is a membrane reactor which
consists of a two-phase system with the interface at the membrane. The membranes provide a
large reaction surface area per unit volume. This type of reactor also results in reduced pressure
drops and fluid channeling (Akoh and Kim, 2008).
PURIFICATION OF STRUCTURED LIPIDS
Distillation is a common thermal-separation method. Short-path distillation is used to
separate heat sensitive high boiling point materials with very low pressures (1.0 - 0.001 mbar)
which decrease the temperature necessary for evaporation. In short-path distillation evaporation
occurs on a heated wiped film and is caused by the pressure drop between the place of
vaporization and the vacuum system. The short distance from the evaporator surface to the
condenser allows the pressure drop (Xu, 2005). Short-path distillation is used for the purification
of SLs by removing free fatty acids which are vaporized and then condensed and removed as
11
waste. Other methods used to purify SLs include thin layer chromatography and alkaline
deacidification.
PROPERTIES OF STRUCTURED LIPIDS
Enzymatic modification of TAGs results in changes in the physical and chemical
properties of the resulting SLs. Kim and Akoh (2006) enzymatically modified sesame oil to
contain caprylic acid and noted that physical and chemical properties such as viscosity, color,
saponification value, iodine value, melting and crystallization behavior, and oxidative stability
and volatile compounds were significantly different from that of unmodified sesame oil (Kim
and Akoh, 2006). Vu and others (2008) produced a SL enzymatically produced with Lipozyme
RM IM as biocatalyst from corn oil, capric acid and conjugated linoleic acid and found that the
iodine value was lower in the SL while the saponification value was higher in the SL when
compared to unmodified corn oil.
Oxidative Stability
Several studies have shown that the oxidative stability of SL decreases after downstream
processing because of the removal of natural antioxidants such as toocopherols (Yankah and
Akoh, 2000; Akoh and Moussata, 2001; Hamam & Shahidi, 2006). Health concerns over
synthetic antioxidants such as tertiary butyl hydroquinone (TBHQ), which is potentially
carcinogenic, has led to efforts to replace synthetic antioxidants with natural antioxidants
(Shahidi, 2000). Lee and others (2004) demonstrated that 300 ppm rosemary extract (as
compared to 100 and 200 ppm rosemary extract) containing 25% carnosic acid and 4% carnisol
was most effective at increasing the oxidative stability of a structured lipid produced from the
lipase catalyzed esterification of safflower oil and conjugated linoleic acid. Determining the
oxidative stability of a SL is necessary before use in a food application.
12
Fatty Acid Profile
The fatty acid profiles of fats and oils from various sources as well as fats and oils
modified to produce SL are unique and also determine properties such as solid fat content,
melting and crystallization behavior and crystal structure and functionality in foods. The fatty
acid profile can also determine the health effects of lipids. Some saturated fatty acids such as
lauric, myristic and palmitic acids contribute to coronary artery disease (Mensink and Plat,
2008). Monounsaturated and polyunsaturated fatty acids such as oleic, linoleic, alpha- and
gamma- linolenic, eicosapentaenoic and docohexaenoicsanoic acids have disease preventative
and health promoting effects (Klurfeld, 2008; Mensink and Plat, 2008).
Gas chromatography (GC) is frequently used to determine lipid fatty acid profiles. For
GC analysis volatile compounds are injected into a column containing a liquid absorbent
supported on an inert solid. Separation of compounds in the volatile mixture occurs because of
differences in partition coefficients of components carried through the column by an inert gas
which is often helium. A flame ionization detector is commonly used for GC analysis which
burns the material in a hydrogen flame producing electrons and ions. These electrons and ions
move to the anode which produces a small current which is modified to produce an electrical
current directly proportional to the amount of material present. Low molecular weight, volatile,
nonpolar derivaties such as fatty acid methyl esters must be produced from the original lipids
before GC analysis can occur. This is often by a reaction in which the TAG is displaced by an
alcohol in an acid (Cserháti and Forgács, 1999).
Solid Fat Content
Determination of solid fat content (SFC) allows a description of the amounts of solid fat
crystals in relation to the amount of liquid oil which gives a measure of plasticity (Johnson,
13
2008). A fat plastic range is the temperature range over which a fat is neither too hard or too soft
or still moldable without being solid or liquid. SFC determines spreadability, sensory properties,
appearance and packing properties (Ming and others, 1999, Noor Lida and others, 2002,
Norizzah and others, 2004, Khatoon and Reddy, 2005, Farmani and others, 2006). Pulsed
nuclear magnetic resonance spectroscopy is used to determine SFC by measuring the percent of
solid fat over a temperature range usually reported from 10 to 37.8 ⁰C (Johnson, 2008).
Plasticity is an important functional property of margarine, bakery shortenings and confectionary
fats.
Melting and Crystallization Profiles
Differential scanning calorimetry (DSC) determines endothermic and exothermic
processes that help describe physical and chemical characteristics by measuring the effect of
changing temperature on a sample. Melting and crystallization properties of fats and changes in
enthalpy can be determined with DSC. Solid fats with a greater degree of hydrogenation melt at
higher temperatures than liquid fats which have a lower degree of hydrogenation. The close
molecular interactions and stacked linear structures of saturated fatty acids require more energy
to melt.
Unsaturated fatty acids have a bent structure that has weaker molecular interactions and
require less energy to melt (Ophardt, 2003). A more diverse fatty acid profile produces broad
melting peaks which may overlap whereas a less diverse fatty acid profile will produce sharper
peaks (Humphrey, 2003).
Crystal Properties
The 3 major polymorphic forms of fats consist of α, β and β'. These forms are also
referred to as hexagonal, orthorhombic, and triclinic respectively. β' crystals, which have a
14
smaller thinner structure are more desirable because of their smoother mouthfeel. β' crystals can
also hold more air and liquid component than larger β crystals which are more stable and have a
higher melting point and a grainy texture. In comparison the α crystal form has the lowest
melting point and is the least stable of the polymorphs (Lawler and Dimick, 2008).
X-ray diffraction is used to determine crystal polymorphic forms. Crystal structures are
determined by diffraction patterns produced when the crystals are hit by an electron beam and
produce a pattern based on electron density. α Polymorphs show d-spacings at 0.415 nm, β
polymorphs at 0.420 and 0.380 nm, and β' polymorphs at 0.460, 0.385 and 0.370 nm (Lawler and
Dimick, 2008).
TRANS FATTY ACIDS
The consumption of trans fatty acids (TFA) has been found to have negative health
effects (Willet and others, 1993, Kholsa and Hayes, 1996, Pietinen and others, 1997,
Mozaffarian and others, 2006). TFA are produced from the partial hydrogenation of vegetable
oils. Other natural sources of TFA include the digestive tract of ruminants as well as dairy
products. Partially hydrogenated fats are found in shortening, margarine, frying oils, fast food
and baked goods. TFA increase LDL cholesterol levels and decrease HDL cholesterol levels
which increases total plasma cholesterol levels therefore increasing the risk of cardiovascular
disease (Mensink and Plat, 2008). The health risks associated with TFA have led to efforts to
eliminate or significantly decrease the TFA content of many foods.
PALM OIL
Palm oil is high in palmitic, oleic, and linoleic acids and has a higher polyunsaturated fat
content than coconut and palm kernel oils. Palm oil is extracted from the mesocarp of the oil
palm (Elaeis guineensis) fruit, is economical to produce and can be fractionated into liquid
15
fraction (palm olein) and solid fraction (palm stearin). The color of palm oil ranges from yellow
to red depending on the carotenoid content. Refining usually destroys most carotenoids and
produces a light yellow color. The high oxidative stability of palm oil is due to its high
tocopherol content. The carotenoids and tocopherols present in palm oil protect against certain
cancers and lower serum cholesterol respectively (Edem, 2002). Palm oil does not promote
atherosclerosis and arterial thrombosis although it contains 50% saturated fatty acids. The solid
fat content of palm oil gives consistency without hydrogenation and can be used in food
products with variable plastic ranges (Edem, 2002).
SHORTENING
Shortening provides desirable textural properties by lubricating, weakening, or shortening
food components. Shortening used in frying allows uniform heat transfer and forms a moisture
barrier. Other desirable functions of shortening in food include, imparting tenderness and
mouthfeel, providing structural integrity, incorporation of air, and extending shelf life
(Ghotra and others, 2002). Shortening is produced from the partial hydrogentation of vegetable
oils. The hydrogentation process produces trans fatty acids which have negative health effects.
Fractionation and blending of palm oil with other vegetable oils has resulted in trans free
shortenings (Jeyarani and others, 2003).
ENERGY BARS
Energy bars are also known as nutrition bars, sports nutrition bars, granola bars and meal
replacement bars were first created for athletes and body builders (Painter and Prisecaru, 2002).
Although energy bars are convenient, they are believed to be no substitute for a healthy diet and
proper nutrition. Energy bars offer some advantages over candy because they are lower in fat and
sugars and higher in fiber. Bars that provide real food such as whole grains and dried fruits are
16
recommended over others (Hurley and Leibman, 2000). Foods formulated with higher
carbohydrate concentrations cause more extreme fluctuations in blood sugar and can lead to
insulin resistance, diabetes and weight gain. Foods formulated with added protein and fat result
in more gradual increases in blood sugar (Painter and Prisecaru, 2002). Between 2001 & 2004,
sales of energy bars sales were expected to increase by 10% with 1 billion in new sales added
each year (Nutrition Business International 2000 & 2001, cited in Painter and Prisecaru, 2002).
FRYING
Golden brown color, crisp texture and fried food flavor are desirable sensory
characteristics of fried foods. During deep fat frying food is cooked via heat transfer from the oil
to the food. Frying also dries food due to mass transfer, with both processes occurring
simultaneously. In addition, among the physical and chemical changes that occur are aeration,
oxidation, absorption, vaporization, hydrolysis, and polymerization. These chemical reactions
and their reaction products contribute to distinctive fried flavor and the type of oil, frying
conditions and degradation products affect flavor quality (Warner, 2008).
Rice bran oil is a very good frying oil that imparts a pleasant flavor to fried food.
Cottonseed oil, which is high in linoleic acid produces higher intensity of flavor in potato chips
and french fried potatoes than oils with low linoleic acid. In addition, the low linolenic acid
content of rice bran oil allows good storage stability and fry life (McCaskill and Zhang, 1999).
A study by Valsalan and others (2004) assessed rice bran oils as a cooking medium and found it
to be generally well accepted.
Negishi and others (2003) determined the relationship between amount of frying oil
foaming and molecular weight of oils containing MCFAs. They found that some canola oil
17
containing MCFAs (either physical mixtures or esterified) had low foaming properties and were
suitable for frying.
SWEET POTATO CHIPS
Sweet potatoes are high in nutritional value and ranked seventh as the world’s most
important food crop (Kays, 2006). Sweet potatoes provide 262.2% daily value (DV) of vitamin
A (in the form of beta carotene), 12.6% DV of fiber, 28.4% DV of vitamin C, and 8.1% DV of
iron (www.whfoods.org). Although a high yield crop that can be grown in a wide variety of
areas world wide, production has remained unchanged over the last 40 years and has declined in
some countries. The flavor of sweet potatoes is believed to be a factor in consumption.
Processed sweet potato products are a possible means of increasing sweet potato consumption.
Examples of sweet potato products that have been developed include baby food, breads,
breakfast cereals, cakes, candy and chips among others (Kays, 2006).
Sweet potatoes have been marketed on small scale in the U.S. in part because current
varieties have strong sweet potato flavor. Some varieties of sweet potatoes have been developed
that are higher in starch, lower in sweetness and moisture than conventional U.S. sweet potatoes.
These varieties produce a more desirable flavor and texture when made into chips (Becker,
2001).
Singh and others (2003) used response surface methodology to develop models to predict
the product quality of sweet potato chips. Moisture loss, oil uptake, crispness, color, flavor, and
texture sensory attributes were used to predict sweet potato chip product quality. Optimum
conditions determined were moisture loss at 11.65% on wet basis, minimum oil uptake 2.57%,
frying temperature 174.7 °C and crispness 794.37 g. Akpapunam and Abiante (1991)
determined that a moisture content of 16.52% (after dehydration and before frying) resulted in
18
optimum texture of sweet potato chips as determined by a taste panel using a 5-point hedonic
scale. Sulaeman and others (2003) demonstrated that deep fried carrot chips retain α and β-
carotene content and vitamin A activity >82% for up to 5 months at various relative humidity
conditions when packaged in partially vacuumed opaque pouches. Their work also demonstrates
that most carotenoids can be retained at frying conditions.
SENSORY ANALYSIS
The triangle test is an overall difference test in which subjects are given two identical
samples and one different sample and are asked to choose the sample different from the other
two. The triangle test is used to determine whether product differences result from a change in
ingredients, processing, packaging, or storage. Quantitative descriptive analysis (QDA) involves
the use of a group of carefully chosen panelists that are trained to reliably identify product
characteristics with results expressed on a graphical scale (Meilgaard and others, 2007). QDA
test results are can be used to help further explain triangle test results.
Osborn and others (2003) conducted sensory analysis of a nutritional beverage containing
a canola oil/caprylic acid structured lipid with a triangle test and qualitative descriptive analysis.
For the triangle test, 23 out of 38 panelists were able to identify the odd sample containing
canola oil/structured lipid versus the sample containing canola oil alone. QDA indicated the
substituting the canola oil/caprylic acid structured lipid for unmodified canola oil enhanced the
perception of sweet flavor and decreased bubble formation while the other attributes were
unchanged.
Kim and others (2005) conducted sensory analysis of a butterfat-vegetable oil blend
spread prepared with SL containing canola oil and caprylic acid by conducting a triangle test and
QDA to determine the effect of SL on the sensory profile of the spread. QDA tests indicated that
19
the blend containing SL was significantly more cold spreadable than pure butter with a textural
profile similar to the sample without SL. Significant differences were not found
between the spread samples flavor attributes. These results suggest that other foods can be
formulated with SLs containing caprylic acid without adversely affecting flavor and texture.
20
REFERENCES
Akoh CC. 2002. Structured and specialty lipids. In: Akoh CC, Lai OM, editors. Healthful lipids.
AOCS Press, Champaign, Il pp 591-606.
Akoh CC. 1995. Structured lipids-enzymatic approach. INFORM 6(9):1055-60.
Akoh CC, Jennings BH, Lillard DA. 1995. Enzymatic modification of trilinolein: incorporation
of n-3 polyunsaturated fatty acids, J Am Oil Chem Soc 72(11):1317-21.
Akoh CC, Kim BH. 2008. Structured lipids. In: Akoh CC, Min DB, editors. Food lipids:
chemistry, nutrition, and biotechnology. 3rd ed. Boca Raton, FL: CRC Press. p 841-72.
Akoh CC, Moussata C. 2001. Characterization and oxidative stability of fish oil and canola oil
based structured lipids. J Am Oil Chem Soc 78(1):25-30.
Akpapunum MA, Abiante DA. 1991. Processing and quality evaluation of sweet potato chips,
Plant Food Hum Nutr 41(4):291-7.
Babayan VK. 1988. Medium Chain Triglycerides In: Beare-Rogers J, editor. Dietary fat
requirements in health and development Champaign, IL: American Oil Chemists’ Society. p
73-86.
Bach AC, Babayan VK. 1982. Medium-chain triglycerides: an update. Am J Clin Nutr
36(5):950-62.
Becker H. 2001. Tater treats: nutritious sweet potato chips and fries. Agr Res 49(5):8-9.
Brekenridge WC, Kuksis A. 1967. Molecular weight distributions of milk fat triglycerides from
seven species. J Lipid Res 8(5):473-8.
Cserháti T, Forgács E. 1999. Chromatography in food science and technology. Boca Raton, FL:
CRC Press. p 1-298.
21
Edem DO. 2002. Palm oil: biochemical, physiological, nutritional, hematological, and
toxicological aspects: a review. Plant Food Hum Nutr 57(3-4):319-41.
Farmani J, Safari M, Hamedi M. 2006. Application of palm olein in the production of zero trans
Iranian vanaspati through enzymatic transesterification. Eur J lipid Sci Technol 108(8):636-
48.
Fomuso LB, Corredig M, Akoh CC. 2001. A comparative study of mayonnaise and Italian
dressing prepared with lipase-catalyzed transesterified olive oil and caprylic acid. J Am Oil
Chem Soc 78(7): 771-4.
Fomuso LB, Akoh CC. 2002. Lipase-catalyzed acidolysis of olive oil and caprylic acid in a
bench-scale packed-bed bioreactor. Food Res Int 35(1):15-21.
Garton GA. 1963. The composition and biosynthesis of milk lipids. J Lipid Res 4(10):237-54.
Ghorta BS, Dyal SD, Narine SS. 2002. Lipid shortenings: a review. Food Res Int 35(10):1015-
48.
Hendriske PW, Harwood JL, Kates M. 1994. Analytical methods. In: Gunstone FD, Harwood JL,
Padley FB, editors. The lipid handbook. New York: Chapman and Hall. p 319-58.
Hamam F, Shahidi F. 2006. Acidolysis reactions lead to esterification of endogenous
tocopherols and compromised oxidative stability of modified oils. J Agric Food Chem 54
(19):7319-23.
Haumann BF.1997. Structured lipids allow fat tailoring. INFORM. 8(10):1004-11.
Humphrey KL, Humphrey PHL, Narine SS. 2003. Phase behavior of a binary lipid shortening
system: from molecules to rheology. J Am Oil Chem Soc 80(12):1175-82.
Hurley J, Liebman B. 2000. Behind Bars. Nutrition action health letter. 27(10):10-3.
22
Jennings BH, Akoh CC. 1999. Enzymatic modification of triacylgylcerols of high
eicosapentaenoic and docosahexaenoic acids content to produce structured lipids. J Am Oil
Chem Soc 75(10):1133-7.
Jennings BH, Akoh CC. 2000a. Lipase-catalyzed modification of sesame oil to incorporate
capric acid. J Food Lipids 7(1):21-30.
Jennings BH, Akoh CC. 2000b. Lipase-catalyzed modification of rice bran oil to incorporate
capric acid. J Agric Food Chem 48(9):4439-43.
Jennings BH, Akoh CC. 2001. Lipase catalyzed modification of fish oil to incorporate capric
acid. Food Chem 72(3):273-8.
Jeyarani T, Yella Reddy S. 2003. Preparation of plastic fats with zero trans FA from palm oil. J
Am Oil Chem Soc 80(11): 1107-13.
Johnson LA. 2008. Recovery, refining, converting, and stabilizing edible fats and oils. In: Akoh
CC, Min DB, editors. Food lipids: chemistry, nutrition and biotechnology. 3rd ed. Boca
Raton, FL: CRC Press. p 205-244.
Kays SJ. 2006. Flavor-the key to sweet potato consumption. In: Tan SL, editor. Proceedings of
the second international symposium of sweet potato and cassava: “innovative technologies for
commercialization”. Acta Horticulturae. International Society of Horticultural Science. p. 97-
105.
Kennedy JP. 1991. Structured lipids: fats of the future. Food Technol. 45(11):76-83.
Khatoon S. Reddy SRY. 2005. Plastic fats with zero trans fatty acids by interesterification of
mango, mahua and palm oils. Eur J Lipid Sci Technol 107(11):786-91.
Kholsa P, Hayes KC. 1996. Dietary trans-monounsaturated fatty acids negatively impact plasma
lipids in humans: critical review of evidence. J Am Coll Nutr 15(4) :325-39.
23
Kim BH, Shewfelt RL, Lee H, Akoh CC. 2005. Sensory evaluation of butterfat-vegetable oil
blend spread prepared with structured lipid containing canola oil and caprylic acid. J Food Sci
70(7):S406-S12.
Kim BH, Akoh CC. 2006. Characteristics of structured lipid prepared by lipase-catalyzed
acidolysis of roasted sesame oil and caprylic acid in a bench-scale continuous packed-bed
reactor. J Agric Food Chem 54(10):5132-41.
King DM, Padley FB. 1990. Milk fat substitutes. European Patent No. 0209 327(Unilever plc).
Kinsella JE. 1988. Food lipids and fatty acids: importance in food quality, nutrition, and health.
Food Technol. 42(10):124-45.
Klurfield DM. 2008 Dietary fats, eicosanoids, and the immune system. In: Akoh CC, Min DB,
editors. Food lipids: chemistry, nutrition, and biotechnology. 3rd ed. Boca Raton, FL: CRC
Press. p 539-50.
Kristensen NB, Harman DL. 2006. Splanchnic metabolism of short chain fatty acids in the
ruminant. In: Sejrsen K, Hvelplund T, Nielsen MO editors. Ruminant physiology: digestion,
metabolism and impact on nutrition on gene expression, immunology and stress. Engfield,
NH: Wageningen Academic Publishers. p 249-66.
Lai OM, Ghazali HM, Let CC. 1999. Use of enzymatic transesterified palm stearin-sunflower oil
blends in preparation of table margarine formulation. Food Chem 64(1):83-8.
Lawler PJ, Dimick PS. 2008. Crystallization and polymorphism of fats. In: Akoh CC, Min DB,
editors. Food lipids: chemistry, nutrition, and biotechnology. 3rd ed. Boca Raton, FL: CRC
Press. p 245-66.
24
Lee JH, Shin JH, Lee JH, Lee KT. 2004. Production of lipase catalyzed structured lipids from
safflower oil with conjugated linoleic acid and oxidation studies with rosemary extracts. Food
Res Int 37(10):967-74.
Leng RA. 1970. Formation and production of volatile fatty acids in the rumen. In: Phillipson AT,
editor, Physiology of digestion and metabolism in the ruminant. Newcastle Upon Tyne,
England :Oriel Press. p 406-21.
Lerma-García MJ, Herrero-Martínez JM, Simό-Alfonso EF, Mendonça CRB, Ramis-Ramos G.
2009. Composition, industrial processing and applications of rice bran γ-oryzanol. Food
Chem 115(2):389-404.Macrae AR. 1983. Lipase-catalyzed interesterification of oils and fats.
J Am Soc
60(2):291-94.
Macrae AR, Hammond RC. 1985. Present and future applications of lipases. Biotech Genet Eng
Rev 3:193-217.
Malcata FX, Reyes HR, Garcia HS, Hill Jr CG, Amundson CH. 1990. Immobilized lipase
reactors for modification of fats and oils - a review. J Am Oil Chem Soc 67(12):890-910.
Malcata FX, Reyes HR, Garcia HS., Hill Jr, CG and Amundson CH. 1992. Kinetics and
mechanisms catalyzed by immobilized lipases. Enzyme Microb Technol 14(6):426-46.
Megremis CJ. 1991. Medium-chain triglycerides: a nonconventional fat. Food Technol
45(2):108-14.
Meilgaard M, Civlle GV, Carr BT. 2007. Sensory evaluation techniques, 4th ed. Boca Raton, FL:
CRC Press 448 p.
Mensink RP, Plat J. 2008. Dietary fats and heart disease. In: Akoh CC, Min DB, editors. Food
lipids: chemistry, nutrition, and biotechnology. 3rd ed. Boca Raton, FL: CRC Press. p 551-78.
25
McCaskill DR, Zhang F.1999. Use of rice bran oil in foods. Food Technol 53(2):50-2.
Min Y, Crawford MA. 2004. Essential fatty acids. In: Curtis-Prior PB, editor. The eicosanoids,
Hoboken, NJ: John Wiley and Sons; p 257-265.
Mozaffarian D, Katan MB, Ascherio A, Stampfer MJ, Willett WC. 2006. Trans fatty acids and
cardiovascular disease, N Engl J Med 354(15):1601-13.
Mustranta A, Forssell P, Poutanen K. 1993. Applications of immobilized lipases to
transesterification and esterification reactions in non-aqueous systems. Enzyme Microb
Technol 15(2):133-39.
Negishi S, Itakura M, Arimoto S, Nagasawa T, Tsuchiya K. 2003. Measurement of foaming of
frying oil and effect of the composition of TG on foaming. J Am Oil Chem Soc 80(5):471-74.
Nettleton JA. 1995. Omega-3 fatty acids and health. New York:Chapman and Hall; 359 p.
Newton IS. 1996. Long chain fatty acids in health and nutrition. J Food Lipids 3(4):233-49.
Noor Lida HMD, Sundram K, Siew WL, Aminah A, Mamot S. 2002. TAG composition and
solid fat content of palm oil, sunflower oil, and palm kernel olein blends before and after
chemical interesterification. J Am Oil Chem Soc 79(11):1137-44.
Norizzah AR, Chong CL, Cheow CS, Zaliha O. 2004. Effect of chemical interesterification on
physiochemical properties of palm stearin and palm kernel olein blends. Food Chem.
86(2):225-35.
Novo Nordisk. 1992. Lipozyme IM product sheet. Enzyme process division.
Nutrition Business International. 2000. Nutrition business journal’s sixth annual overview of the
nutrition industry. San Diego, CA: Nutrition Business International.
Nutrition Business International. 2001. Nutrition business journal’s sports nutrition &
weight loss report. San Diego, CA: Nutrition Business International.
26
Ophardt CE. 2003 Virtual chembook. Fatty acids.
http://www.elmhurst.edu/~chm/vchembook/551fattyacids.html (accessed October 2008).
Osborn HT, Shewfelt RL, Akoh CC. 2003. Sensory evaluation of a nutritional beverage
containing canola oil/caprylic acid structured lipid. J Am Oil Chem Soc 80(4):357-60.
Painter J, Prisecaru V. 2002. The effects of various protein and carbohydrate ingredients in
energy bars on blood glucose levels in humans. Cereal Food World 47(6):236-41.
Pietinen P, Ascherio A, Korhonen P, Hartman AM, Willet WC. 1997. Intake of trans fatty acids
and risk of coronary heart disease in a cohort of Finnish men. Am J Epid 145(10):876-87.
Rukmini C, Raghuram T. 1991. Nutritional and biochemical aspects of the hypolipidemic action
of rice bean oil: a review. J Am Coll Nutr 10(6):593-601.
Seetharamaiah GS, Chandrasekhara N. 1990. Effect of oryzanol on cholesterol absorption &
biliary & fecal bile acids in rats. Ind J Med Res 92:471-75.
Seetharamaiah GS, Krishnakantha TP, Chandrasekhara N. 1990. Influence of oryzanol on
platelet aggregation in rats. J Nutri Sci Vitaminol 36(3):291-97.
Sharkar S, Bhattaacharyya DK. 1991. Nutrition of rice bran oil in relation to its purification. J
Am Oil Chem Soc 68(12):956-62.
Shahidi F. 2000. Natural antioxidants: sources, effects and applications,
www.sifest.org.sg/pdf/article-natural antioxidants.
Singh S, Raina CS, Bawa AS, Saxena DC. 2003. Optimization of processing variables in the
preparation of sweet potato chips using response surface methodology. Eur Food Res Technol
217(5):374-81.
St-Onge MP, Jones PJH. 2002. Physiological effects of medium-chain triglycerides: potential
agents in the prevention of obesity. J Nutr 132(3):329-32.
27
St-Onge M.-P.; Ross R, Pearsons WD, Jones PJH.2003. Medium-chain triglycerides increase
energy expenditure and decrease adiposity in overweight men. Obesity Res. 11(3):395-402.
Sulaeman A, Keeler L, Giraud DW, Taylor SL, Driskell JA. 2003. Changes in carotenoid,
physiochemical and sensory values of deep fried carrot chips during storage. Int J Food Sci
Technol 38(5):603-13.
Valsalan A, Shiddhu A, Sundararaj P. 2004. Assessment of rice bran oil as a cooking medium.
J Food Sci Technol 41(3):248-55.
Villeneuve P Foglia TA.1997. Lipase specificities: potential application in bioconversions.
INFORM. 8(6):640-50.
Vu PL, Shin JA, Lee YJ, Nam HY, Lee JH, Akoh CC, Lee KT. 2008. Development and
characterization of structured lipids containing capric acid and conjugated linoleic acids as
functional dietary lipid molecules. Int J Food Sci Nutr 59(2):95-104.
Warner K. 2008. Chemistry of frying oils. In: Akoh CC, Min DB, editors. Food lipids:
chemistry, nutrition, and biotechnology. 3rd ed. Boca Raton, FL: CRC Press. p 189-204.
Willet WC, Stampfer MJ, Manson JE, Cloditz GA, Speizer FE, Rosner BA, Sampson LA,
Hennekens CH. 1993. Intake or trans fatty acids and risks of coronary heart disease among
women. Lancet 341(8845):581-83.
Willis WM, Marangoni AG. 2008. Enzymatic interesterification. In: Akoh CC, Min DB, editors.
Food lipids: chemistry, nutrition, and biotechnology. 3rd ed. Boca Raton, FL: CRC Press. p
807-840.
Weete JD, Lai OM, Akoh CC. 2008. Microbial lipases. In: Akoh CC, Min DB, editors. Food
lipids: chemistry, nutrition, and biotechnology. 3rd ed. Boca Raton, FL: CRC Press. p 767-
806.
28
Wolin MJ. (1981). Fermentation in the rumen and large intestine. Science 213(4515):1463-68.
World’s Healthiest Foods. www.whfoods.org
Xiong Y, Miyamoto N, Shibata K, Valasek MA, Motoike T, Kedzierski RM, Yanagisawa M.
2004. Short-chain fatty acids stimulate leptin production in adipocytes through the G protein-
coupled receptor GPR41. Proc Nat Acad Sci USA 101(4):1045-50.
Xu X, 2005. Short-path distillation for lipid processing, In: Akoh CC, Lai OM, editors. Healthful
lipids. Champaign, Il: AOCS Press. p 127-44.
Yankah V, Akoh CC. 2000. Batch enzymatic synthesis, characterization and oxidative stability
of DHA-containing structured lipids. J Food Lipids 7(4):247-61.
29
CHAPTER 3
EFFECTIVENESS OF NATURAL VERSUS SYNTHETIC ANTIOXIDANTS IN A RICE
BRAN OIL-BASED STRUCTURED LIPID
Jennings, B.H. and C.C. Akoh 2009 Food Chemistry. 114:1456-1461.
Reprinted here with permission of publisher.
30
ABSTRACT
Antioxidants were evaluated for their ability to improve oxidative stability index (OSI) of
enzymatically prepared rice bran oil-based structured lipid (RBOSL) containing caprylic acid.
RBOSL was purified by short-path distillation. Vitamin E concentration decreased significantly
in RBOSL after enzymatic modification. Total γ-oryzanol concentration after modification was
not significantly different. OSI of RBOSL containing rosemary extract (RE), carnosic acid
(CA), tertiary butyl hydroquinone (TBHQ), ethylenediamine tetraacetic acid (EDTA), and α-
tocopherol (TOC), and 50:50 (w/w) combinations in concentrations of 200, 300, 400 and 500
ppm were determined. The OSI of unmodified rice bran oil (RBO) was 12.4 ± 0.2 hr and
significantly higher than RBOSL which was 11.4±0.0. Mean peroxide and p-anisidine values for
antioxidant treatments in RBOSL with the highest OSI values were determined after incubation
at 60 ⁰C for 21 days and sampled every 3 days. Mean peroxide and p-anisidine values for CA
and CA/RE were comparable to TBHQ.
keywords: Antioxidant, Enzymatic modification, Oxidative stability, Rice bran oil, Structured
lipid
31
Introduction
The nutraceutical potential of tocotrienol, sterol, and γ-oryzanol in rice bran oil (RBO) as
well as its flavor, oxidative stability, and frying performance contributes to the rising interest in
RBO product in U.S. markets (McCaskill & Zhang, 1999). The γ-oryzanol in rice bran oil is a
mixture of ferulic acid esters of sterols (campesterol, stigmasterol, and β-sitosterol) and terpene
alcohols (cycloartanol, cycloartenol, 24-methylenecycloartanol and cyclobranol). RBO contains
γ-oryzanol, which is a ferulic acid ester of sterols and terpene alcohols. γ-Oryzanol has been
found to lower plasma cholesterol (Rukmini and Rughuram 1991), reduce cholesterol
absorption (Seetharamaiah and Chadrasekhara 1990) and inhibit platelet aggregation
(Seetharamaiah et al., 1990). RBO consists of approximately 38% oleic, 34% linoleic, 1%
myristic, 22% palmitic, 3% stearic, and 2% linolenic acids (Rukmini and Raghuram, 1991).
The health benefits of RBO can possibly be improved by enzymatic modification which
incorporates medium chain fatty acids. Jennings and Akoh (2000) successfully incorporated
capric acid (C10:0) into RBO and determined the effects of incubation time, substrate mole ratio,
enzyme load, and water addition in a small-scale study. The health benefits of medium chain
triacylglycerols such as those containing capric and caprylic acid have been outlined by Kennedy
(1991) and Megremis (1991). Additional studies involving the enzymatic modification of rice
bran oil have been limited. Because of the possible combined health benefits of RBO
enzymatically modified to contain a medium chain fatty acid, further studies are needed to
determine the chemical and physical characteristics. These studies also should investigate the
oxidative stability of SL produced in kilogram quantities to be used in a food applications.
32
Several studies have shown that the oxidative stability of SL decreases after downstream
processing because of the removal of natural antioxidants such as tocopherols (Yankah & Akoh,
2000; Akoh & Moussata, 2001; Hamam & Shahidi, 2006). Health concerns over synthetic
antioxidants such as tertiary butyl hydroquinone (TBHQ) and butylated hydroxyanisole (BHA),
which are potentially carcinogenic (Peters, Rivera, Jones, Monks and Lau, 1996) have led to
efforts to replace synthetic antioxidants with natural antioxidants (Shahidi, 2000). Lee, Shin,
Lee & Lee, (2004) and Lee, Lee, Akoh, Chung & Kim (2006) demonstrated that rosemary
extract at 100, 200 and 300 ppm was effective at increasing the oxidative stability of a structured
lipid produced from the lipase-catalyzed esterification of safflower oil and conjugated linoleic
acid and extra virgin olive oil and conjugated linoleic acid. Among advantages of natural
antioxidants are wide acceptance by consumers and health officials, potential to be labeled as
flavorings and positive affects on sensory properties (Pokorný, 2007). The oxidative stability of
structured lipids should be determined and antioxidants added, if necessary, to improve oxidative
stability before use in a food application.
The objectives of this study were to modify the fatty acid profile of RBO to contain caprylic
acid and to compare the antioxidant capability of the synthetic antioxidant, tertiary
butylhydroquinone (TBHQ), to that of natural antioxidants and antioxidant combinations added
to a rice bran oil-based structured lipid. The tocopherol content and the γ-oryzanol content of
rice bran oil before and after enzymatic modification were also determined.
33
Materials and Methods
Materials
RBO was purchased from California Rice Oil Company (Novato, CA). Caprylic acid,
EDTA, α-tocopherol, and TBHQ were purchased from Sigma Chemical Co. (St. Louis, MO).
Carnosic acid was purchased from A.G. Scientific (San Diego, CA). Rosemary extract was
donated by Kalsec (Kalamazoo, MI). Lipozyme RM IM (immobilized lipase on a macroporous
anion exchange resin) from Rhizomucor miehei was donated by Brenntag Mid-South, Inc.
(Atlanta, GA).
Synthesis of rice bran oil structured lipid
The SL was produced in 1 kg quantities in a packed-bed reactor with a flow rate of 1ml/min,
1:6 substrate mole ratio (rice bran oil: caprylic acid), and a temperature of 45 °C (Kim & Akoh,
2006). A bioreactor with a jacketed stainless steel column (47 mm x 500 mm) and a FMI Lab
pump model QV from Fluid Metering, Inc. (Oyster Bay, NY) was used for SL synthesis. The
bioreactor set up was as reported by Fomuso and Akoh (2002). A circulating water bath was
used to maintain a constant column temperature. The column was packed with immobilized
Lipozyme RM IM and plugged at both ends with approximately 3 cm of glass wool.
34
Short-path distillation
The SL reaction products were passed through a short-path distillation apparatus 4 times to
remove free fatty acids to a level below 0.1 %. A KDL-4 (UIC Inc., Joliet, IL) distillation unit
was used. The heating oil temperature was 185 °C, the coolant temperature was15 °C, and the
vacuum pressure was below 1 Torr (Fomuso & Akoh, 2002).
Gas chromatography
Gas liquid chromatography (GLC) was used to determine the fatty acid profiles of rice bran
oil-based structured lipid and the unmodified rice bran oil. Fatty acid methyl esters were
prepared as described by Jennings and Akoh (2000). The gas chromatograph was an Agilent
6890N (Wilmington, PA) equipped with an AT-225 fused-silica capillary column 30 m x 0.25
mm i.d. (Alltech, Deerfield, IL), flame-ionization detector, and operated in a splitless mode. The
injector and detector temperatures were held at 250 and 260 C, respectively. The column
temperature was at 130 C for 3 min and programmed to 215 C for 20 min at a rate of 20
C/min. The carrier gas was helium and the total gas flow rate was 23 ml/min. The relative
concentration of FAME as mol% was calculated by computer with 17:0 as internal standard.
35
Tocopherol analysis
RBO and RBOSL were analyzed on a normal phase HPLC system equipped with a Shimadzu
LC-6A pump, a Shimadzu RF-10A spectrofluorometric detector, a Spectra series AS 100
autosampler (Thermo Separation Products Inc., San Jose, CA) and a LiChrosorb Si 60 column
(25cm x 4mm, 5 µm; Hibar Fertigsaube RT, Darmstadt, Germany) equipped with a precolumn
packed with Perisorb A 30-40 µm (Fertigsaube RT, Darmstadt, Germany). Tocopherols and
tocotrienols were identified and quantified as described by Ye, Landon, Lee and Eitenmiller
(1998). The isocratic mobile phase contained 0.9% isopropanol in hexane at a flow rate of 1.0
ml/min. The wavelengths for excitation and emission were 290 and 330 nm, respectively (Lee,
Landen, Phillips & Eitenmiller, 1998).
γ-Oryzanol analysis
HPLC analysis to determine γ-oryzanol content of rice bran oil before and after modification
was performed with an Agilent (Wilmington, PA) model 1100 liquid chromatograph equipped
with a diode array UV-visible detector. γ-Oryzanol standards were prepared from γ-oryzanol
powder purchased from TCI America (Portland, OR). The stationary phase was a Phenomenex
(Torrence, CA), ODS-2, RP C18 column. The initial mobile phase conditions were 45%
acetonitrile, 40% methanol, 5% isopropyl alcohol, and 10% aqueous acetic acid. After 4 min,
the mobile phase was changed linearly to 25% acetonitrile, 70% methanol, 5% isopropyl alcohol
for 10 min and held for 11 min with a total run time of 25 min. After each run, the solvent
36
gradient was changed linearly to 95% methanol and 5% isopropyl alcohol and held for 1 min
before returning to initial mobile phase conditions. γ-Oryzanol peaks were detected at 325 nm
and quantified from a standard curve (Chen & Bergman, 2005).
Determination of oxidative stability
An oxidative stability instrument (Omnion, Inc., Rockland, MA) was used to determine the
oxidative stability index of RBO and RBOSL. American Oil Chemists’ Society (AOCS,1998)
official method Cd 12b-92 was used. The instrument temperature was set at 110 °C and the air
flow rate was 2.5 ml/s. Peroxide value was determined by AOCS official method Cd 8b-90. The
p-anisidine value was determined by AOCS official method Cd 18-90. The antioxidants tested
in RBOSL were rosemary extract (RE), carnosic acid (CA), tertiary butyl hydroquinone
(TBHQ), ethylenediamine tetraacetic acid (EDTA), and α-tocopherol (TOC) in concentrations of
200, 300, 400 and 500 ppm. In addition, four other separate treatments of 50:50 combinations
(in equal concentrations that total 200, 300, 400 & 500 ppm) of TOC/RE, TOC/TBHQ,
TOC/EDTA, RE/TBHQ, EDTA/TBHQ, CA/RE, CA/TBHQ, CA/EDTA and RE/EDTA were
added to the RBOSL. The control was RBOSL without added antioxidants. The oxidative
stability index was determined for each treatment. Fifty grams of RBOSL with antioxidant
treatments at 300, 400 and 500 ppm originally tested with the highest OSI values were incubated
in an open flask at 60 °C in an oven for 21 days (Hamilton & Rossel, 1986). Peroxide value and
p-anisidine value were determined as described above in triplicate at days 0, 3, 6, 9, 12, 15, 18,
and 21.
37
Statistical analysis
Statistical analysis was conducted with the SAS software package (SAS Inst., 2000).
A t-test was used to determine the differences between mean OSI values of RBO and RBOSL
without added antioxidant. A two-way analysis of variance (ANOVA) and mean separation tests
were used to evaluate differences among mean OSI values from the various antioxidant
treatments. The Ryan-Einot-Gabriel-Welch mean separation test was used to determine
differences among mean OSI values. The Bonferroni mean separation test was used to determine
differences between mean peroxide values and mean p-anisidine values. Statistical differences
with P ≤ 0.05 were considered significant.
Results and Discussion
Rice bran oil was enzymatically modified to contain 32.1 mol% caprylic acid (Table 3.1).
Myristic, palmitic, oleic, linoleic, and linolenic acids were significantly lower for RBOSL than in
unmodified RBO decreasing by 0.4, 13.3, 2.0, 10.6, 6.2 and 0.4 mol% respectively, indicating
that caprylic acid replaced the other fatty acids. Total monounsaturated fatty acid content and
polyunsaturated fatty acid content decreased by 10.6 and 6.6 mol%, respectively, in the RBOSL.
Tocopherols and Tocotrienols
The vitamin E content of RBOSL as compared to RBO was significantly lower by 43.4%
for all tocopherol and tocotrienol homologs except δ-tocopherol which was not significantly
38
different (Table 3.2). δ -Tocopherol is more stable than α-tocopherol which oxidizes to
tocopheryl radicals at a faster rate (Nogala-Kalucka, Korczak, Elmadfa & Wagoner, 2005). The
waste from short-path distillation in this study was analyzed and found to contain α-tocopherol ,
γ-tocopherol and γ-tocotrienol at 2.2±.0.0, 2.5±0.1 and 7.6±0.9 mg/100 ml, respectively,
indicating that significant amounts of vitamin E were lost in the waste during the short-path
distillation. Kamal-Elden & Appleqvist (1996) indicated that δ-tocopherol has a higher
antioxidant activity than the other tocopherol homologs. Jennings and Akoh (2000)
demonstrated that the vitamin E content of the enzymatically modified rice bran oil was slightly
lower than the unmodified rice bran oil. The difference in results was probably due to the
difference in enzymatic modification and purification methods. In the earlier study by Jennings
and Akoh (2000), enzymatically modified rice bran oil was prepared in mg quantities in a culture
tube and purified by thin layer chromatography.
γ- Oryzanol
The concentration of γ-oryzanol measured by comparing the concentration of the γ-
oryzanol components, cycloartenyl ferulate, 24-methylenecycloartenyl ferulate and camperseryl
ferulate in RBO and RBOSL were not significantly different from each other (Table 3.3). γ-
Oryzanol content of rice bran oil has been shown not to change after frying for up to 1 hr at
180 ⁰C (Krishna, Katoon & Babylatha, 2005). The high stability of rice bran oil as a frying oil is
attributed in part to its γ-oryzanol content. A study by Nyström, Achrenius, Lampi, Moreau &
Piironen (2007) indicated that the γ-oryzanol component, sitosteryl ferulate, degraded at a slower
39
rate than α-tocopherol and that these compounds did not exert a synergistic effect as
antioxidants.
Oxidative stability index
Table 3.4 shows the oxidative stability index (OSI) values (obtained at 110 ⁰C) at
different antioxidant concentrations. The OSI value of RBO without antioxidant addition (12.4
±0.2 h) was significantly higher than the OSI value for RBOSL (11.4±0.0 h). The OSI value for
EDTA/TBHQ at 500 ppm was the highest of all antioxidant treatments with an OSI value of
27.5±0.4 h. The increased mean OSI values for EDTA/TBHQ indicated a strong synergistic
effect between the metal chelator EDTA and TBHQ. The antioxidants EDTA/TBHQ,
CA/TBHQ, CA/RE, CA, and TBHQ were among those that showed the highest OSI values and
were significantly higher than the OSI value for RBOSL without added antioxidant. Mean OSI
values increased for most antioxidants as antioxidant concentrations increased.
When compared at 200 ppm (the maximum limit for the amount of TBHQ that can be
added to oils in the U.S.A.), TBHQ, CA/RE and CA/TBHQ were not significantly different.
Lee, Shin, Lee & Lee (2004) also found that rosemary extract reduced oxidation of a safflower
oil based structured lipid. EDTA and TOC antioxidant treatments at 400 ppm were the least
effective with OSI values of 9.8±0.4 h and 9.8±0.5 h respectively and were significantly below
the OSI value for RBOSL without added antioxidant. The mean OSI value for α-tocopherol
added to RBOSL at 400, and 500 ppm was significantly lower than that of the RBOSL without
added antioxidant while at 200 and 300 ppm α-tocopherol, there was no significant difference
40
from RBOSL without added antioxidant. These results were possibly because α-tocopherol
concentrations were above the optimum concentration of 250 ppm. At greater than 250 ppm, α-
tocopherol becomes a prooxidant or may exert a prooxidant synergistic effect when combined
with transition metal ions or lipid hydroperoxides (Kulas & Ackman, 2001).
TOC/TBHQ at 500 ppm was not significantly different from TBHQ at 500 ppm with
mean OSI values of 20.4±0.6 h and 19.7±0.6 h, respectively. Akoh and Moussata (2001) also
found that a 50:50 combination of TOC/TBHQ at 50 and 100 ppm was effective in increasing the
oxidative stability of a fish oil and canola oil-based structured lipid. The 50:50 combination of
the natural and synthetic antioxidants CA/TBHQ and TOC/TBHQ mean OSI values at 500 ppm
were 21.4±0.1h and 20.4±0.6 h respectively, and were not significantly different. These values
also were not significantly different from TBHQ at 500 ppm. Therefore, a combination of
natural and synthetic antioxidants may be an alternative to totally replacing synthetic
antioxidants with natural antioxidants allowing lower levels of synthetic antioxidants to be used.
The mean OSI value of the rosemary extract phenolic compound CA at 500 ppm was
19.8±0.6 h. The mean OSI values for rosemary extract (RE) at 200, 300, 400, and 500 ppm
ranged from 11.4±0.4 h to 12.5±0.9 h and were not significantly different from the OSI value of
11.4±0.0 h for RBOSL without added antioxidant. These results may have been because of low
concentrations of the rosemary extract phenolic compounds carnosic acid, carnisol and
rosmarinic acid as well as other compounds. The 50:50 combination of CA/RE at 500 ppm had
an OSI value of 19.6±0.2 h which was not significantly different from CA at 500 ppm with a
mean OSI value of 19.8±0.6 h. Use of purified carnosic acid (97.4%) allowed a more controlled
41
amount of carnosic acid used as an antioxidant for this study. Carnosic acid is the most abundant
and the most active antioxidant in rosemary extract. The amount of carnosic acid in rosemary
extract varies, possibly making some rosemary extracts less effective antioxidants. A
disadvantage of the use of purified carnosic acid from rosemary extract as an antioxidant
treatment was high cost. Another possible disadvantage is toxicity. However, a study by
Anadón, Martínez-Larrañaga, Matínez, Ares, García-Risco, Señoráns and Reglero (2008)
showed that rosemary extracts consisting of predominately carnosic acid fed to rats at 2000
mg/kg produced no adverse effects. The use of a rosemary extract with 24.6% carnosic acid
which have been shown to be effective in structured lipids (Lee et al., 2004 and Lee et al., 2006)
rather than purified carnosic acid would be more feasible from a cost perspective.
Peroxide values and p-Anisidine values
EDTA/TBHQ, CA/TBHQ, CA/RE, CA and TBHQ antioxidant treatments of RBOSL at 300,
400 and 500 ppm were among the highest OSI values obtained at 110 ⁰C (Table 3.4). These
treatments were then incubated at 60 ⁰C and peroxide and p-anisidine values were determined at
0, 3, 6, 9, 12, 15, 18, and 21 days. Figure 3.1 shows peroxide values that were significantly
lower than that of RBOSL without added antioxidant. Generally, as incubation time increased,
peroxide value also increased. Peroxide value which measures hydroperoxide formation, is an
indicator of primary oxidative changes. Most treatments and concentrations on given sampling
days yielded peroxide values that were not significantly different from RBOSL. There was no
significant difference among peroxide values at different treatment concentrations which
possibly indicate that antioxidant concentrations at 300 ppm or lower were sufficient to lower
42
peroxide value. For day 21, none of the treatments were significantly different form RBOSL
without added antioxidant. Other studies (Lee et al., 2004; Lee et al., 2006) also showed lower
peroxide and p-anisidine values for structured lipids containing safflower oil and conjugated
linoleic acid or extra virgin olive oil and conjugated linoleic acid with added rosemary extract
with 24.6 % carnosic acid than the control without added antioxidant. Overall, CA/RE, CA,
EDTA/TBHQ, CA/TBHQ and TBHQ performed well in lowering the peroxide value to levels
significantly lower than RBOSL through day 18. These findings indicate that the natural
antioxidants CA and CA/RE are as effective as TBHQ in lowering peroxide values in RBOSL.
The decomposition of hydroperoxides into secondary oxidation products causes
undesirable secondary flavor and odor compound formation. p-Anisidine value is a measure of
the amount of aldehydes present, which are secondary oxidation carbonyl compounds. Figure
3.2 shows p-anisidine values that were significantly lower than that of RBOSL without added
antioxidant. p-Anisidine values for day 0 for all treatments were significantly lower than
RBOSL without added antioxidant. None of the p-anisidine values were significantly different
from RBOSL without added antioxidant on day 3. p-Anisidine values for treatments at 500
ppm were generally lower than at other concentrations. Mean p-anisidine values for CA 500
ppm on days 6, 9, 12 and 15 were significantly lower than RBOSL without added antioxidant
and were comparable to TBHQ at 500 ppm. The 500 ppm may be acceptable for natural
antioxidants, but not for TBHQ, which can only be added up to 200 ppm. p-Anisidine values
increased as incubation time at 60 ⁰C increased and the largest increases in p-anisidine values
occurred between days 3 and 9. On day 18, all p-anisidine values were significantly higher than
RBOSL without added antioxidant indicating an increased rate of p-anisidine formation. On day
21, p-anisidine values for CA 300 ppm and TBHQ 300 ppm were comparable and significantly
43
lower than RBOSL and overall levels of p-anisidine were lower than on day 18. p-Anisidine
values for TBHQ, CA and CA/RE on days 0, 6, 9, 12 and 15 were significantly below RBOSL
without added antioxidant and results were generally in agreement with findings from peroxide
value results indicating that the effectiveness of natural and synthetic antioxidants were similar.
Conclusion
Rice bran oil was enzymatically modified to contain caprylic acid. The vitamin E content was
significantly lower in RBOSL than in unmodified RBO because of the removal of tocopherols
during short-path distillation. Differences in γ-oryzanol concentration before and after
enzymatic modification were not significant. OSI values for CA and CA/RE were not
significantly different from TBHQ. Peroxide values for CA and CA/RE were significantly lower
than RBOSL without added antioxidant but not statistically different from TBHQ at days 9, 15,
and 18. Mean p-anisidine values for CA 500 ppm on days 6, 9, 12 and 15 were significantly
lower than RBOSL without added antioxidant and were comparable to TBHQ 500 ppm. The
natural antioxidants, CA and CA/RE, were therefore shown to be as effective as TBHQ in
increasing the oxidative stability of RBOSL. The effectiveness of combinations of natural and
synthetic antioxidants such as CA/TBHQ is also notable and can provide an alternative that will
allow for lower amounts of synthetic antioxidants to be used. The possible carcinogenic effect of
synthetic antioxidant TBHQ and consumer demand for natural healthier products make natural
antioxidants more desirable. Natural antioxidants are more accepted by consumers and health
officials, can be labeled as flavorings, and may have positive effects on sensory properties. Our
44
results indicate that natural antioxidants are viable alternatives to the synthetic antioxidant
TBHQ for increasing the oxidative stability of a rice bran oil-based structured lipid.
45
References
Akoh, C.C., & Moussata, C. (2001). Characterization and oxidative stability of fish oil and
canola oil-based structured lipids, Journal of the American Oil Chemists’ Society, 78, 25-
30.
Anadón, A., Martínez-Larrañaga, M.R., Matínez, M.A., Ares, I., García-Risco, M.R.,Señoráns,
F. J., & Reglero, G. (2008). Acute oral safety of rosemary extracts in rats. Journal of
Food Protection, 71, 790-795.
AOCS American Oil Chemists’ Society. (1998). Official Methods and Recommended Practices
of the American Oil Chemists’ Society. 5th
ed. Cd 8b-90; Cd 12b-92; Cd 18-90. Champaign,
IL: American Oil Chemists’ Society.
Bucci, R., Magrí, A.D., Margí, A.L., & Marini, F. (2003). Comparison of three spectrophotometric
methods for determination of γ-oryzanol in rice bran oil. Analytical and Bioanaytical
Chemistry, 375, 1254-1259.
Chen, M.-H., & Bergman, C.J. (2005). A rapid procedure for analyzing rice bran tocopherol,
tocotrienol and γ-oryzanol contents. Journal of Food Composition and Analysis, 18, 319-
331.
Fumoso, L.B., & Akoh, C.C. (2002). Lipase-catalyzed acidolysis of olive oil and caprylic acid in
a bench-scale packed-bed bioreactor. Food Research International, 35, 15-21.
Jennings, B.H., & Akoh, C.C. (2000). Lipase-catalyzed modification of rice bran oil to
incorporate capric acid. Journal of Agricultural and Food Chemistry, 48, 4439-4443.
46
Hamam, F., & Shahidi, F. (2006). Acidolysis reactions lead to esterification of endogenous
tocopherols and compromised oxidative stability of modified oils. Journal of Agricultural
and Food Chemistry, 54, 7319-7323.
Hamilton, R.J, & Rossel, J.B. (1986). Classical analysis of fats and oils. In Analysis of oils and
fats, (pp. 29-30). New York: Elsevier.
Kamal-Elden, A., & Appleqvist, L.A. (1996). The chemistry and antioxidant properties of
tocopherols and tocotrienols. Lipids, 31, 812-822.
Kennedy, J.P. (1991). Structured Lipids: fats of the future. Food Technology. 45, 76-83.
Kim, B.H., & Akoh, C.C. (2006). Characteristics of structured lipid prepared by lipase-catalyzed
acidolysis of roasted sesame oil and caprylic acid in a bench-scale continuous packed-
bed reactor. Journal of Agricultural and Food Chemistry, 54, 5132-5141.
Krishna, A.G.G., Khatoon, S., & Babylatha, R. (2005). Frying performance of processed rice
bran oils. Journal of Food Lipids, 12, 1-11.
Kulas, E., & Ackman, G. (2001). Protection of α-tocopherol in nonpurified and purified fish oil.
Journal of the American Oil Chemists’ Society, 78, 197-203.
Lee, J., Landen Jr., W.O., Phillips, R.D., & Eitenmiller, R.R. (1998). Application of direct
solvent extraction to the LC quantification of vitamin E in peanuts, peanut butter and
selected nuts. Peanut Science, 25,123-128.
Lee, J.H., Lee, K.T., Akoh C.C., Chung, S.K. & Kim M.R. (2006). Antioxidant evaluation and
oxidative stability of structured lipids from extra virgin olive oil and conjugated linoleic
acid. Journal of Agricultural and Food Chemistry, 54, 5416-5421.
47
Lee, J.H., Shin, J.H., Lee, J.H., & Lee, K.T. (2004). Production of lipase catalyzed structured
lipids from safflower oil with conjugated linoleic acid and oxidation studies with
rosemary extracts. Food Research International, 37, 967-74.
McCaskill, D.R., & Zhang, F. (1999). Use of rice bran oil in foods. Food Technology, 53,
50-52.
Megremis, C.J. (1991). Medium-chain triglycerides: a nonconventional fat. Food Technology,
45, 108-114.
Nogala-Kalucka, M., Korczak, J., Elmadfa, I., &Wagoner, K.H. (2005). Effect of α-tocopherol
and δ-tocopherol on the oxidative stability of a mixed hydrogenated fat under frying
conditions. European Food Research and Technology, 221, 291-297.
Nystrom. L., Achrenius, T., Lampi, A.-M., Moreau, R.A., & Piironen, V. (2007). A comparison
of the antioxidant properties of steryl ferulates with tocopherol at high temperatures.
Food Chemistry, 101, 947-954.
Peters, M. M. C. G., Rivera, M.I., Jones, T.W., Monks, T.J. and Lau, S.S. (1996). Glutathione
conjugates of tert-butyl-hydroquinone, a metabolite of the urinary tract tumor promoter 3-
tert-butyl-hyroxyanisole, are toxic to kidney and bladder. Cancer Research, 56, 1006-
1011.
Pokorný, J. (2007). Are natural antioxidants better - and safer - than synthetic antioxidants?
European Journal of Lipid Science and Technology, 109, 629-642.
Rukmini, C., & Raghuram, T. (1991). Nutritional and biochemical aspects of the hypolipidemic
action of rice bean oil: a review. Journal of the American College of Nutrition, 10, 593-
601.
48
Seetharamaiah, G.S. & Chandrasekhara, N. (1990). Effect of oryzanol on cholesterol absorption
and biliary and fecal bile acids in rats. Indian Journal of Medical Research, 92, 471-
475.
Seetharamaiah, G.S., Krishnakantha, TP. & Chandrasekhara, N. (1990) Influence of oryzanol on
platelet aggregation in rats. Journal of Nutritional Science and Vitaminology, 36, 291-
477.
Shahidi, F. (2000). Natural antioxidants: sources, effects and applications,
www.sifest.org.sg/pdf/article-natural antioxidants.
Yankah, V., & Akoh C.C. (2000). Batch enzymatic synthesis, characterization and oxidative
stability of DHA-containing structured lipids. Journal of Food Lipids, 7, 247-61.
Ye, L., Landen Jr., W.O. Jr., Lee, J., Eitenmiller, R.R. (1998). Vitamin E content of margarine
and related fat products using a simplified extraction procedure and HPLC determination.
Journal of Liquid Chromatography Related Technology, 21, 1227-1238.
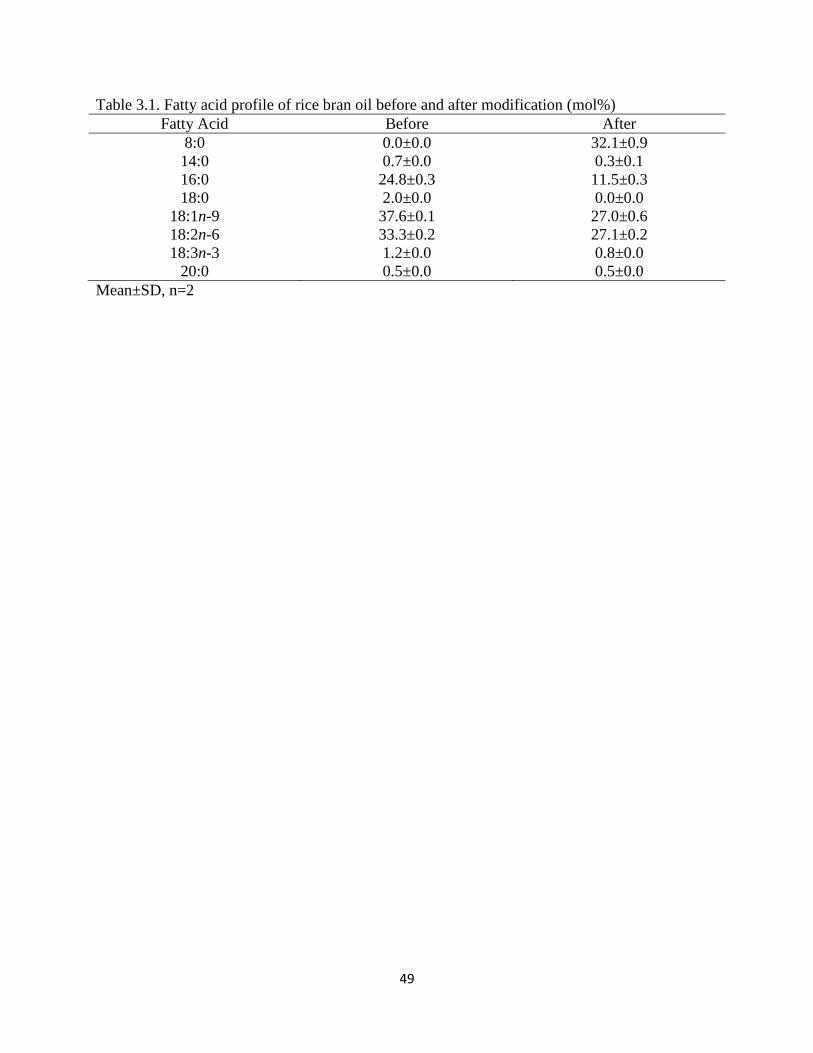
49
Table 3.1. Fatty acid profile of rice bran oil before and after modification (mol%)
Fatty Acid Before After
8:0 0.0±0.0 32.1±0.9
14:0 0.7±0.0 0.3±0.1
16:0 24.8±0.3 11.5±0.3
18:0 2.0±0.0 0.0±0.0
18:1n-9 37.6±0.1 27.0±0.6
18:2n-6 33.3±0.2 27.1±0.2
18:3n-3 1.2±0.0 0.8±0.0
20:0 0.5±0.0 0.5±0.0
Mean±SD, n=2
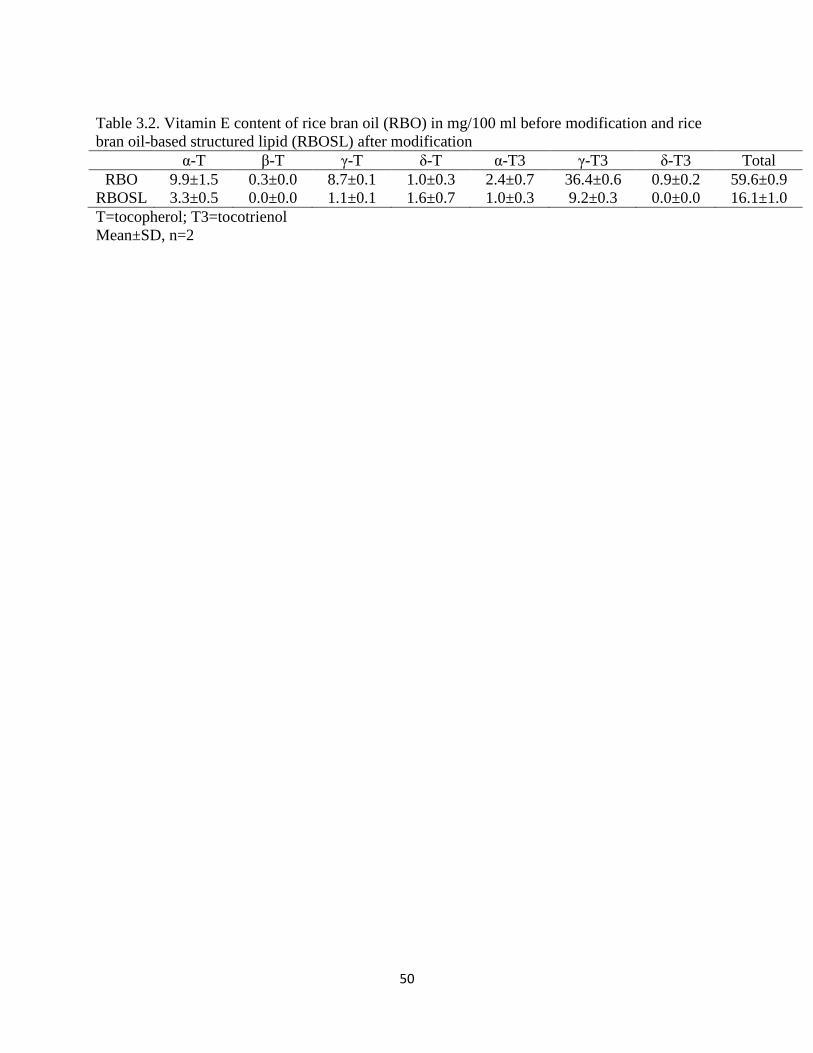
50
Table 3.2. Vitamin E content of rice bran oil (RBO) in mg/100 ml before modification and rice
bran oil-based structured lipid (RBOSL) after modification
α-T β-T γ-T δ-T α-T3 γ-T3 δ-T3 Total
RBO 9.9±1.5 0.3±0.0 8.7±0.1 1.0±0.3 2.4±0.7 36.4±0.6 0.9±0.2 59.6±0.9
RBOSL 3.3±0.5 0.0±0.0 1.1±0.1 1.6±0.7 1.0±0.3 9.2±0.3 0.0±0.0 16.1±1.0
T=tocopherol; T3=tocotrienol
Mean±SD, n=2
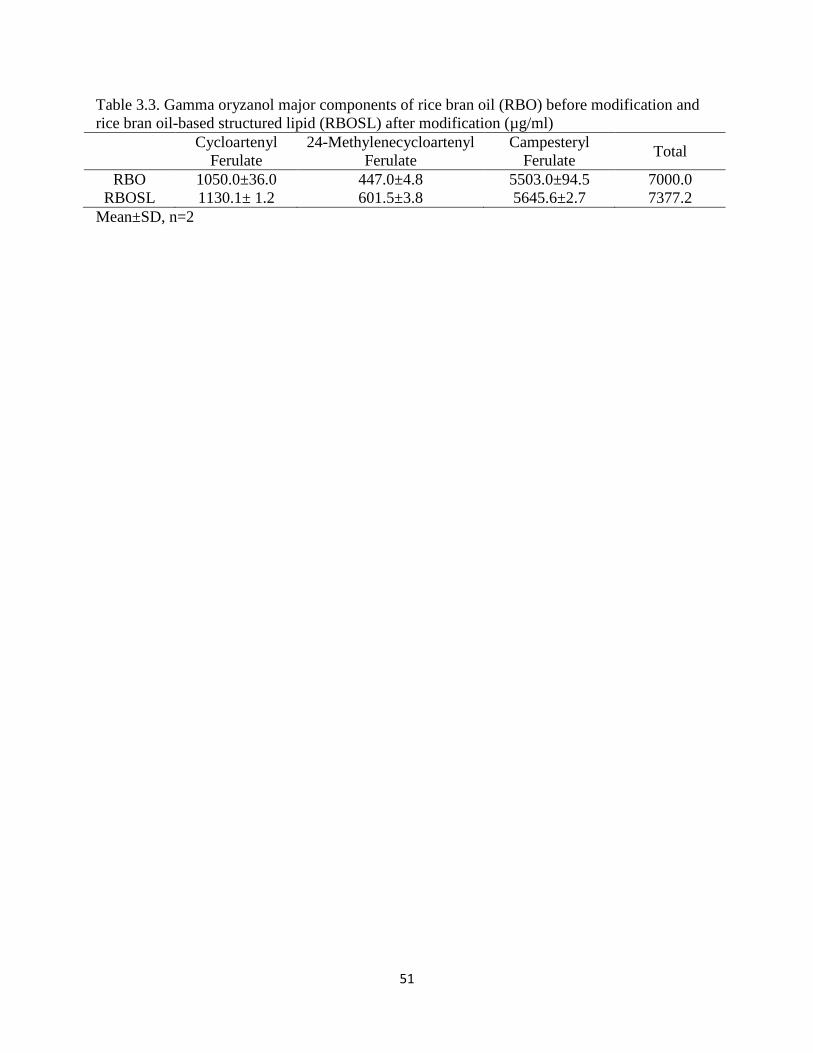
51
Table 3.3. Gamma oryzanol major components of rice bran oil (RBO) before modification and
rice bran oil-based structured lipid (RBOSL) after modification (µg/ml)
Cycloartenyl
Ferulate
24-Methylenecycloartenyl
Ferulate
Campesteryl
Ferulate Total
RBO 1050.0±36.0 447.0±4.8 5503.0±94.5 7000.0
RBOSL 1130.1± 1.2 601.5±3.8 5645.6±2.7 7377.2
Mean±SD, n=2
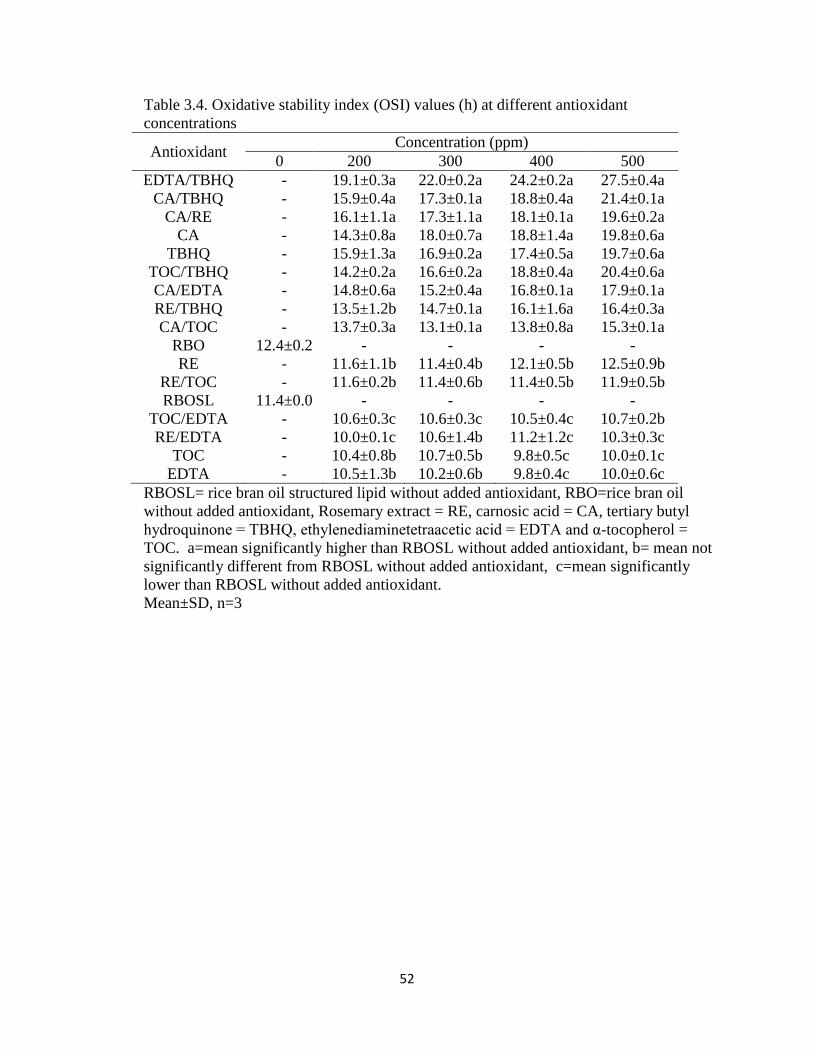
52
Table 3.4. Oxidative stability index (OSI) values (h) at different antioxidant
concentrations
Antioxidant Concentration (ppm)
0 200 300 400 500
EDTA/TBHQ - 19.1±0.3a 22.0±0.2a 24.2±0.2a 27.5±0.4a
CA/TBHQ - 15.9±0.4a 17.3±0.1a 18.8±0.4a 21.4±0.1a
CA/RE - 16.1±1.1a 17.3±1.1a 18.1±0.1a 19.6±0.2a
CA - 14.3±0.8a 18.0±0.7a 18.8±1.4a 19.8±0.6a
TBHQ - 15.9±1.3a 16.9±0.2a 17.4±0.5a 19.7±0.6a
TOC/TBHQ - 14.2±0.2a 16.6±0.2a 18.8±0.4a 20.4±0.6a
CA/EDTA - 14.8±0.6a 15.2±0.4a 16.8±0.1a 17.9±0.1a
RE/TBHQ - 13.5±1.2b 14.7±0.1a 16.1±1.6a 16.4±0.3a
CA/TOC - 13.7±0.3a 13.1±0.1a 13.8±0.8a 15.3±0.1a
RBO 12.4±0.2 - - - -
RE - 11.6±1.1b 11.4±0.4b 12.1±0.5b 12.5±0.9b
RE/TOC - 11.6±0.2b 11.4±0.6b 11.4±0.5b 11.9±0.5b
RBOSL 11.4±0.0 - - - -
TOC/EDTA - 10.6±0.3c 10.6±0.3c 10.5±0.4c 10.7±0.2b
RE/EDTA - 10.0±0.1c 10.6±1.4b 11.2±1.2c 10.3±0.3c
TOC - 10.4±0.8b 10.7±0.5b 9.8±0.5c 10.0±0.1c
EDTA - 10.5±1.3b 10.2±0.6b 9.8±0.4c 10.0±0.6c
RBOSL= rice bran oil structured lipid without added antioxidant, RBO=rice bran oil
without added antioxidant, Rosemary extract = RE, carnosic acid = CA, tertiary butyl
hydroquinone = TBHQ, ethylenediaminetetraacetic acid = EDTA and α-tocopherol =
TOC. a=mean significantly higher than RBOSL without added antioxidant, b= mean not
significantly different from RBOSL without added antioxidant, c=mean significantly
lower than RBOSL without added antioxidant.
Mean±SD, n=3
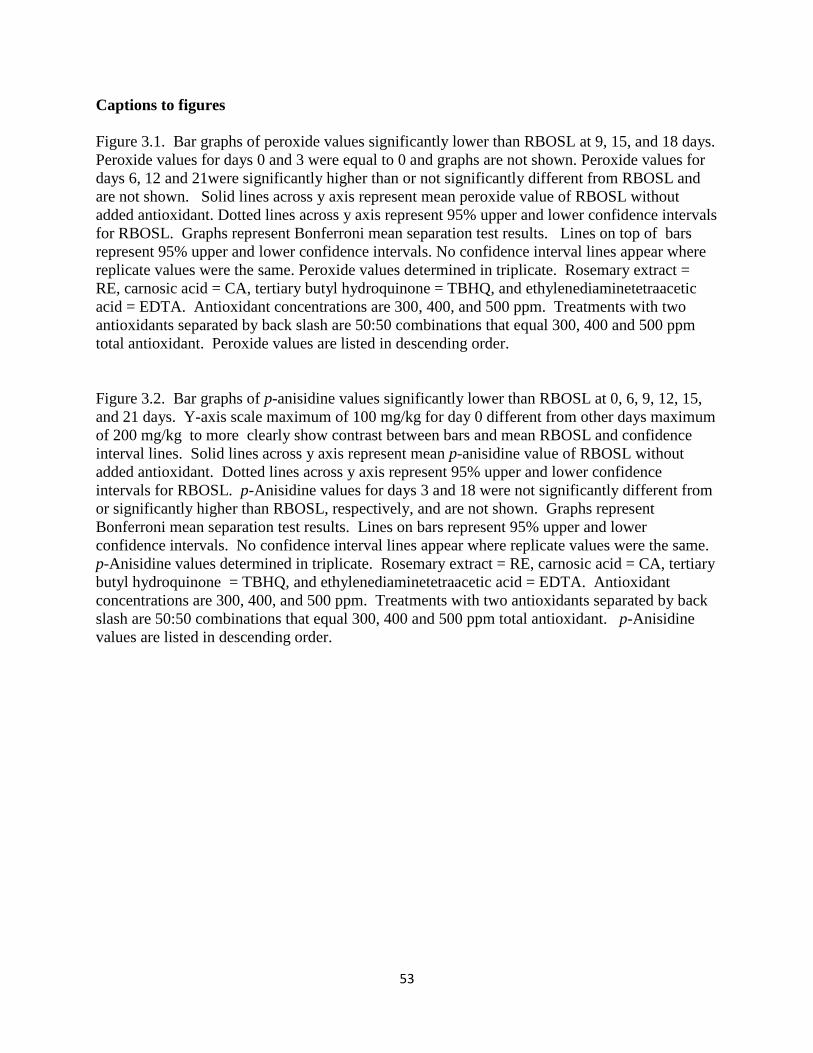
53
Captions to figures
Figure 3.1. Bar graphs of peroxide values significantly lower than RBOSL at 9, 15, and 18 days.
Peroxide values for days 0 and 3 were equal to 0 and graphs are not shown. Peroxide values for
days 6, 12 and 21were significantly higher than or not significantly different from RBOSL and
are not shown. Solid lines across y axis represent mean peroxide value of RBOSL without
added antioxidant. Dotted lines across y axis represent 95% upper and lower confidence intervals
for RBOSL. Graphs represent Bonferroni mean separation test results. Lines on top of bars
represent 95% upper and lower confidence intervals. No confidence interval lines appear where
replicate values were the same. Peroxide values determined in triplicate. Rosemary extract =
RE, carnosic acid = CA, tertiary butyl hydroquinone = TBHQ, and ethylenediaminetetraacetic
acid = EDTA. Antioxidant concentrations are 300, 400, and 500 ppm. Treatments with two
antioxidants separated by back slash are 50:50 combinations that equal 300, 400 and 500 ppm
total antioxidant. Peroxide values are listed in descending order.
Figure 3.2. Bar graphs of p-anisidine values significantly lower than RBOSL at 0, 6, 9, 12, 15,
and 21 days. Y-axis scale maximum of 100 mg/kg for day 0 different from other days maximum
of 200 mg/kg to more clearly show contrast between bars and mean RBOSL and confidence
interval lines. Solid lines across y axis represent mean p-anisidine value of RBOSL without
added antioxidant. Dotted lines across y axis represent 95% upper and lower confidence
intervals for RBOSL. p-Anisidine values for days 3 and 18 were not significantly different from
or significantly higher than RBOSL, respectively, and are not shown. Graphs represent
Bonferroni mean separation test results. Lines on bars represent 95% upper and lower
confidence intervals. No confidence interval lines appear where replicate values were the same.
p-Anisidine values determined in triplicate. Rosemary extract = RE, carnosic acid = CA, tertiary
butyl hydroquinone = TBHQ, and ethylenediaminetetraacetic acid = EDTA. Antioxidant
concentrations are 300, 400, and 500 ppm. Treatments with two antioxidants separated by back
slash are 50:50 combinations that equal 300, 400 and 500 ppm total antioxidant. p-Anisidine
values are listed in descending order.
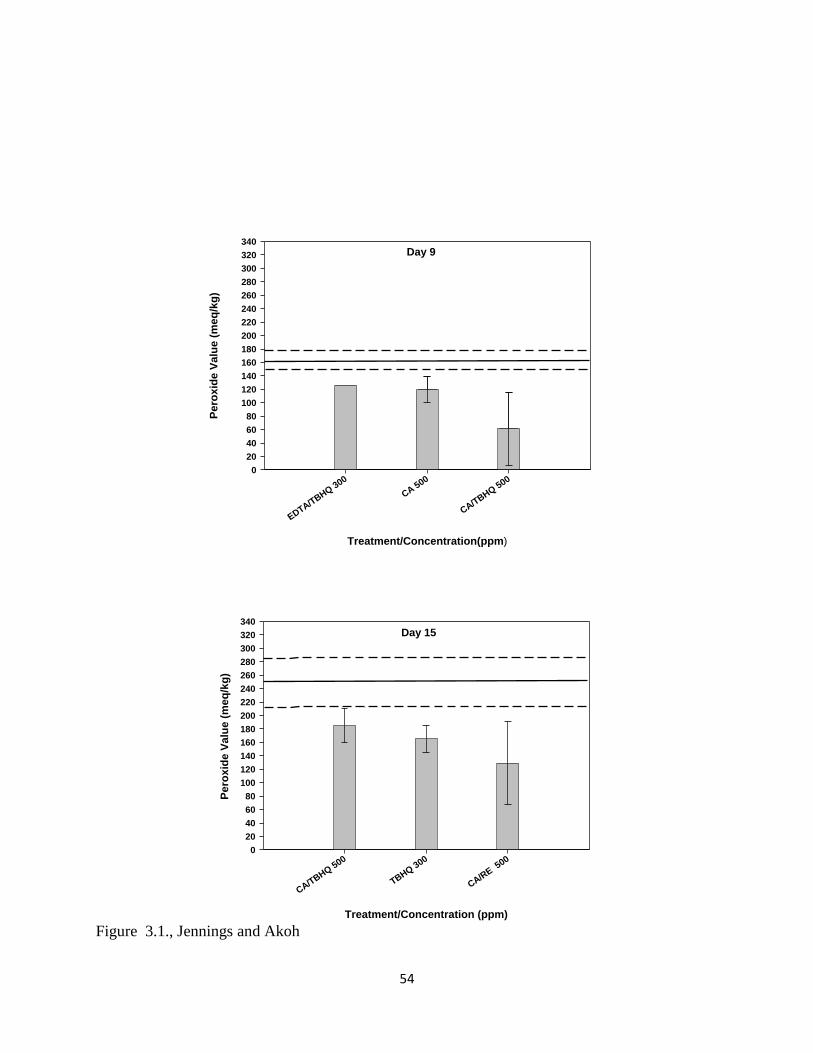
54
Day 15
Treatment/Concentration (ppm)
CA/TBHQ 5
00
TBHQ 300
CA/RE 5
00
Pe
rox
ide
Va
lue
(m
eq
/kg
)
0
20
40
60
80
100
120
140
160
180
200
220
240
260
280
300
320
340
Day 9
Treatment/Concentration(ppm)
EDTA/TBHQ 3
00
CA 500
CA/TBHQ 5
00
Pe
rox
ide
Va
lue
(m
eq
/kg
)
0
20
40
60
80
100
120
140
160
180
200
220
240
260
280
300
320
340
Figure 3.1., Jennings and Akoh
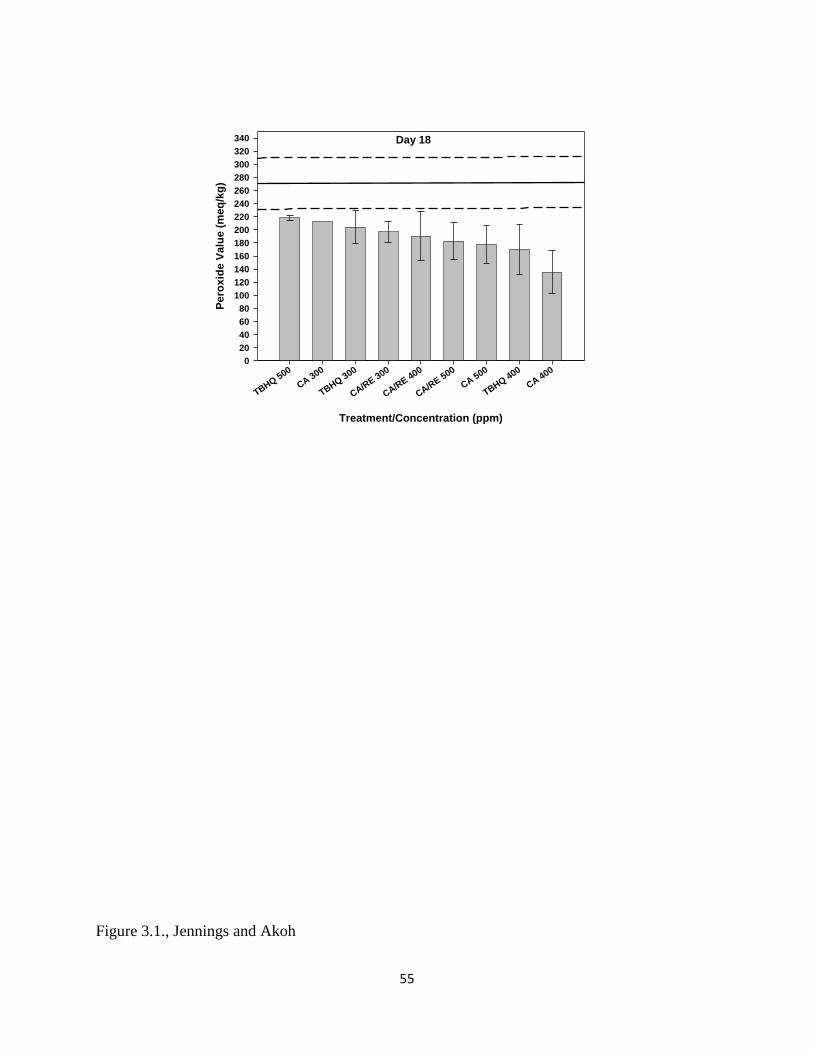
55
Day 18
Treatment/Concentration (ppm)
TBHQ 500
CA 300
TBHQ 300
CA/RE 3
00
CA/RE 4
00
CA/RE 5
00
CA 500
TBHQ 400
CA 400
Pe
rox
ide
Va
lue
(m
eq
/kg
)
0
20
40
60
80
100
120
140
160
180
200
220
240
260
280
300
320
340
Figure 3.1., Jennings and Akoh
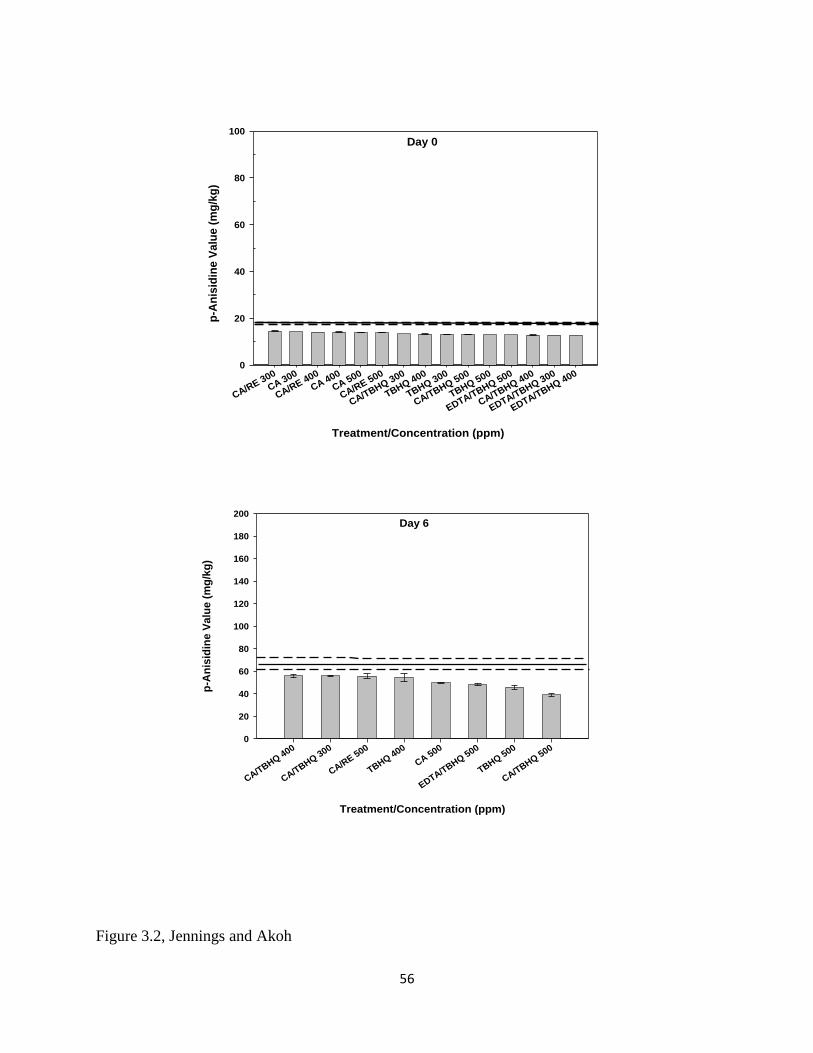
56
Day 6
Treatment/Concentration (ppm)
CA/TBHQ 4
00
CA/TBHQ 3
00
CA/RE 5
00
TBHQ 400
CA 500
EDTA/TBHQ 5
00
TBHQ 500
CA/TBHQ 5
00
p-A
nis
idin
e V
alu
e (
mg
/kg
)
0
20
40
60
80
100
120
140
160
180
200
Day 0
Treatment/Concentration (ppm)
CA/RE 300
CA 300
CA/RE 400
CA 400
CA 500
CA/RE 500
CA/TBHQ 300
TBHQ 400
TBHQ 300
CA/TBHQ 500
TBHQ 500
EDTA/TBHQ 500
CA/TBHQ 400
EDTA/TBHQ 300
EDTA/TBHQ 400
p-A
nis
idin
e V
alu
e (
mg
/kg
)
0
20
40
60
80
100
Figure 3.2, Jennings and Akoh
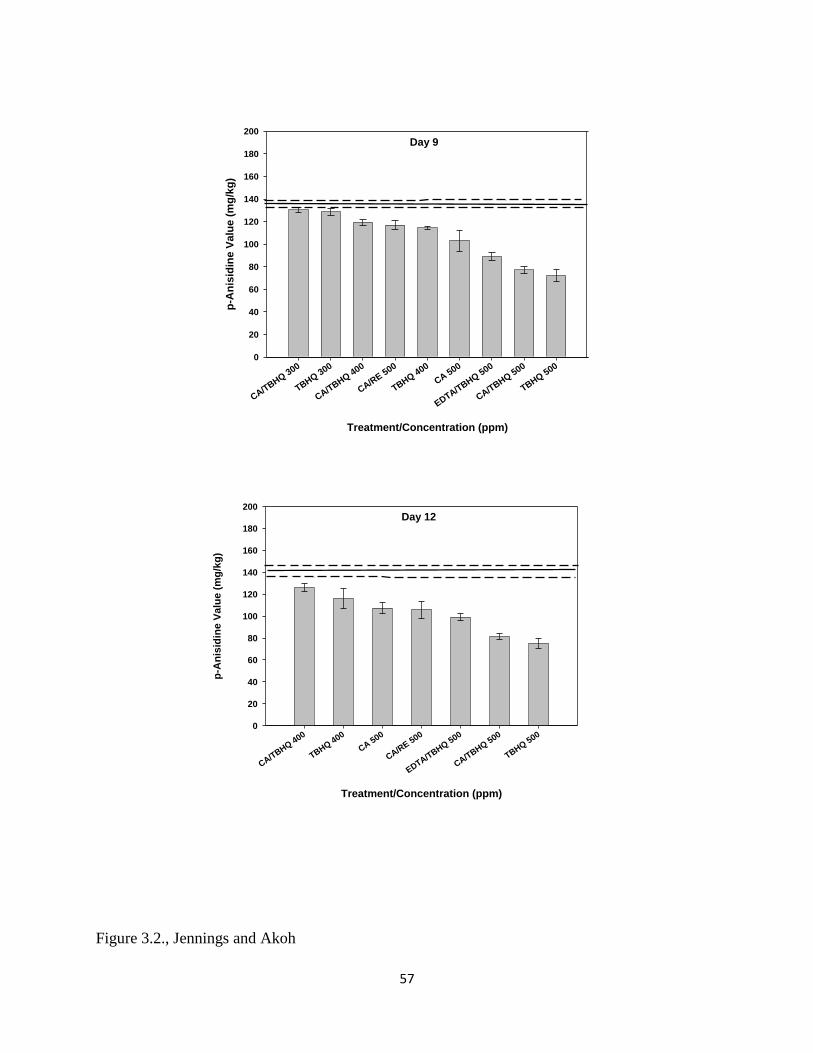
57
Day 12
Treatment/Concentration (ppm)
CA/TBHQ 4
00
TBHQ 400
CA 500
CA/RE 5
00
EDTA/TBHQ 5
00
CA/TBHQ 5
00
TBHQ 500
p-A
nis
idin
e V
alu
e (
mg
/kg
)
0
20
40
60
80
100
120
140
160
180
200
Day 9
Treatment/Concentration (ppm)
CA/TBHQ 3
00
TBHQ 300
CA/TBHQ 4
00
CA/RE 5
00
TBHQ 400
CA 500
EDTA/TBHQ 5
00
CA/TBHQ 5
00
TBHQ 500
p-A
nis
idin
e V
alu
e (
mg
/kg
)
0
20
40
60
80
100
120
140
160
180
200
Figure 3.2., Jennings and Akoh
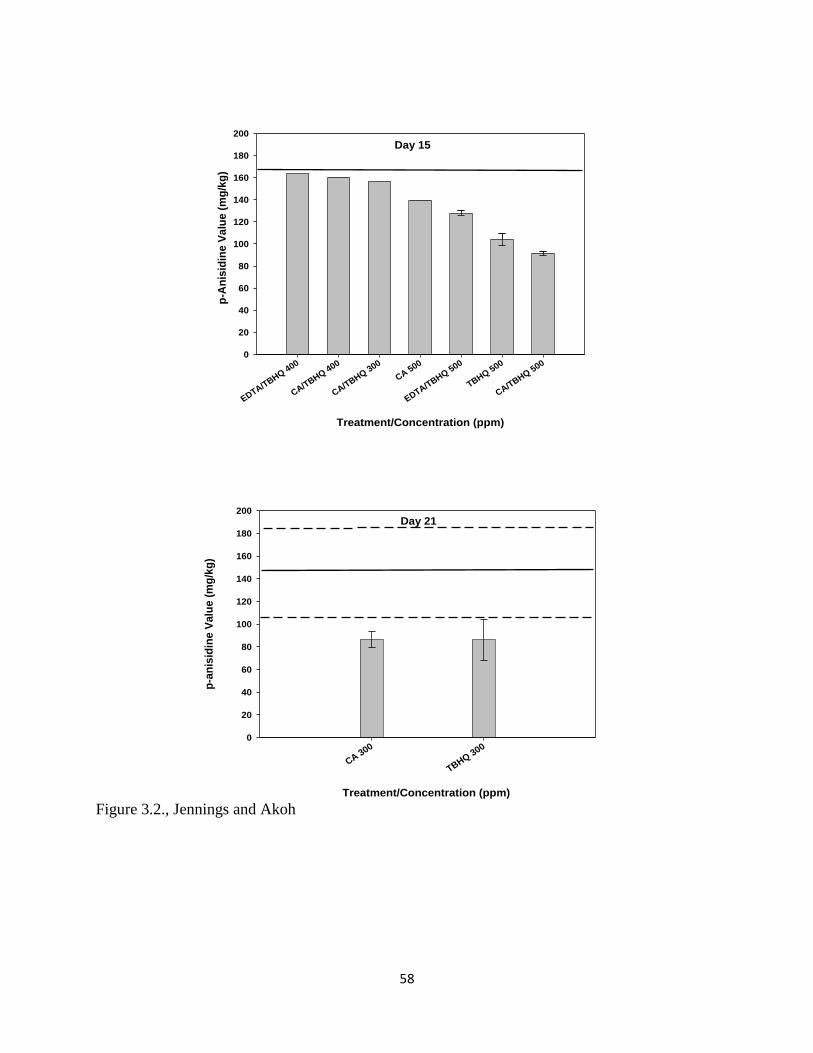
58
Day 15
Treatment/Concentration (ppm)
EDTA/TBHQ 4
00
CA/TBHQ 4
00
CA/TBHQ 3
00
CA 500
EDTA/TBHQ 5
00
TBHQ 500
CA/TBHQ 5
000
20
40
60
80
100
120
140
160
180
200
p-A
nis
idin
e V
alu
e (
mg
/kg
)
Day 21
Treatment/Concentration (ppm)
CA 300
TBHQ 300
p-a
nis
idin
e V
alu
e (
mg
/kg
)
0
20
40
60
80
100
120
140
160
180
200
Figure 3.2., Jennings and Akoh
59
CHAPTER 4
CHARACTERIZATION OF A RICE BRAN OIL STRUCTURED LIPID
Jennings, B.H. and C.C. Akoh 2009 Journal of Agricultural and Food Chemistry. 57:3346-3350
Reprinted here with permission of publisher.
60
ABSTRACT
Rice bran oil (RBO) was enzymatically modified in a continuous packed-bed bioreactor to
incorporate caprylic acid with Lipozyme RM IM as biocatalyst. The reaction product was
purified by short-path distillation. Rice bran oil structured lipid (RBOSL) contained 32.1 mol%
caprylic acid. Positional analysis revealed 0.7 mol% caprylic acid at the sn-2 position and 47.8
mol% caprylic acid at the sn-1,3 positions. Composition of free fatty acids and smoke point of
RBO and RBOSL were not significantly different. Saponification value, iodine value, and
viscosity of RBO were significantly different from RBOSL. The color of RBOSL was darker,
more yellow and less green than RBO. Volatile compounds in RBO and RBOSL were
determined by GC-MS. Melting onset temperatures of RBO and RBOSL were not significantly
different while melting endpoint temperatures and melting enthalpies were significantly
different. This characterization study results will help determine potential food applications of
RBOSL.
KEYWORDS: Caprylic acid; continuous packed-bed bioreactor; enzymatic modification;
Lipozyme RM IM; rice bran oil; structured lipid
61
INTRODUCTION
Lipase-catalyzed modification of triacylglycerols (TAG) results in the changes in
chemical, physical, and nutritional characteristics of the end product different from the starting
triacylglycerols. Characterization of enzymatically modified TAG is necessary to determine
potential nutraceutical and food applications. Structured lipids (SL) are defined as TAGs that
have been modified by incorporation of new fatty acids, restructured to change the positions of
fatty acids or the fatty acid profile, from the natural state, or synthesized to yield novel TAGs (1).
SL components include short chain fatty acids (SCFAs), medium chain fatty acids (MCFAs), and
long chain fatty acids (LCFAs). SCFAs are lower in calories and more rapidly absorbed than
MCFAs or LCFAs. LCFAs such as linoleic acid are essential fatty acids and are therefore
important SL components. MCFAs provide a quick energy source, which can be rapidly
oxidized and utilized and are metabolized through the portal system instead of the lymphatic
system as are LCFAs. MCFAs have been used to treat patients with fat absorption
abnormalities and used by athletes with increased energy requirements (2, 3). Previous animal
and human studies have shown that composition of TAGs containing MCFA result in increased
energy expenditure and decreased weight gain (4, 5). The mobility, solubility and ease of
metabolism of MCFAs provide health benefits when incorporated into SLs. Therefore, the
characteristic component fatty acids of SLs determine the physical properties, digestion,
absorption, and metabolism of SLs. Improved immune function, reduction in LDL cholesterol,
improved nitrogen balance, and reduction in cancer risk are among the health benefits of SLs (1).
Although a previous study determined the conditions for the enzymatic production of a
rice bran oil SL containing caprylic acid (6), additional studies are needed to determine the
chemical and physical properties of a rice bran oil SL containing a MCFA to help determine
62
future food applications. A previous study in which sesame oil was modified to contain caprylic
acid noted that physical and chemical properties such as viscosity, color, saponification value,
iodine value, melting and crystallization behavior, and oxidative stability and volatile
compounds were significantly different from that of unmodified sesame oil (7). Another study in
which a SL was enzymatically produced with Lipozyme RM IM as biocatalyst from corn oil,
capric acid and conjugated linoleic acid found that the iodine value was lower in the SL while
the saponification value was higher in the SL when compared to unmodified corn oil (8).
Specific fatty acids can serve as acyl donors and can be transesterified onto specific
positions of TAG using sn-1,3 lipases such as Lipozyme RM IM. For this study rice bran oil
was transesterified with the MCFA (caprylic acid) targeted at the sn-1 and sn-3 positions with
primarily LCFA oleic and linoleic acids at the sn-2 position. Fatty acids at the sn-1 and sn-3
positions are rapidly hydrolyzed and not stored as fat, whereas fatty acids at the sn-2 position are
more readily absorbed (9).
The chemical and physical properties of SL are often different from the unmodified oils
from which they are produced and characterization of these properties is essential in determining
possible food applications. The objective of this study was to determine how various chemical
and physical properties such as fatty acid profile, sn-2 and sn-1,3 positions of fatty acids , smoke
point, viscosity, saponification value, iodine value, color, volatile compounds and melting
profiles of a rice bran oil-based SL differ from those of unmodified rice bran oil.
63
MATERIALS AND METHODS
Materials. Rice bran oil was purchased from California Rice Oil Company (Novato,
CA). Caprylic acid was purchased from Sigma Chemical Co. (St. Louis, MO). Lipozyme RM
IM (immobilized lipase on a macroporous anion exchange resin) from Rhizomucor miehei was
donated by Novo Nordisk Biochem North America, Inc. (Franklinton, NC).
Synthesis of Rice Bran Oil Structured Lipid. The SL was produced in 1 kg quantities
in a packed-bed reactor with a flow rate of 1ml/min, 1:6 substrate mole ratio (rice bran oil:
caprylic acid) and a temperature of 45 °C (10). A bioreactor with a jacketed stainless steel
column (47 mm x 500 mm) and a FMI Lab pump model QV from fluid metering, Inc. (Oyster
Bay, NY) was used for SL synthesis. The bioreactor set up was as reported by Fomuso and Akoh
(11). A circulating water bath was used to maintain a constant column temperature. The column
was packed with immobilized Lipozyme RM IM and plugged at both ends with approximately 3
cm of glass wool.
Short-path Distillation. The SL reaction products were passed through a short-path
distillation apparatus four times to remove free fatty acids to a level below 0.1 %. A KDL-4
(UIC Inc., Joliet, IL) distillation unit was used. The heating oil temperature was 185 °C; the
coolant temperature was 15 °C; and the vacuum pressure was below 1 Torr (11).
Gas Liquid Chromatography. Gas liquid chromatography (GLC) was used to
determine the fatty acid profiles of rice bran oil SL and the unmodified rice bran oil. The gas
chromatograph was an Agilent 6890N (Wilmington, PA) equipped with an AT-225 fused-silica
capillary column 30 m x 0.25 mm i.d. (Alltech, Deerfield, IL), flame-ionization detector, and
operated in a splitless mode. The injector and detector temperatures were held at 250 and 260
°C, respectively. The column temperature was at 130 °C for 3 min and then programmed to 215
64
°C for 20 min at a rate of 20 °C/min. The carrier gas was helium and the total gas flow rate was
25 ml/min. The relative concentrations of FAMEs as mol% were calculated by computer with
17:0 as internal standard. Retention times of GLC reference standard (17A prime from Nu-Chek
Prep, Inc., Elysian, MN) were used to identify detected FAMEs.
Sn-2 Positional Analysis. Sn-2 positional analysis was conducted on RBO and RBOSL.
RBO and RBOSL were spotted onto separate silica gel 60 TLC plates and developed in
hexane/ethyl ether/acetic acid (80:20:0.5, vol/vol/vol). The bands corresponding to TAG were
scraped from the TLC plate and extracted twice with ethyl ether and passed through a sodium
sulfate column. The ethyl ether was then evaporated under nitrogen. One milliliter of 1 M Tris
buffer (pH 8.0), 0.25 ml of bile salts (0.1%), 0.2 ml of CaCl2 (22.0%), and 8.0 mg of purified
pancreatic lipase was added to the reaction mixture (12). The mixture was then incubated for 3
minutes at 40±0.5 °C, extracted two times with ethyl ether, evaporated under nitrogen, brought to
a final volume of 200 µl, and spotted on a TLC plate. The TLC plate was then developed in
hexane/diethyl ether/acetic acid (50:50:1.0, vol/vol/vol) as the developing solvent (12). The
bands corresponding to sn-2 monoacylglycerol (MAG) standard were scraped from the TLC
plate. The sn-2 MAG was then methylated and analyzed by GLC as previously described.
Differential Scanning Calorimetry. DSC analysis was conducted to compare and
differentiate between the RBO and RBOSL melting properties. A Perkin-Elmer model DSC7
(Norwalk, CT) was used for the analysis which was conducted according to AOCS
recommended procedure Cj 1-94 (13). Indium was used as a reference standard and for
standardization (mp 156.6 °C, ∆H 28.45 J/g); dry ice was used as a coolant. Samples (5-20 mg)
were hermetically sealed in 30 µl capacity aluminum pan and an empty pan was used for
reference. Samples were heated rapidly to 80 °C from room temperature for 10 min (to destroy
65
crystal memory). The sample was then cooled to -40 °C at 10 °C per min, held for 30 min, then
heated to 80 °C at a rate of 5 °C per min to generate melting profiles. The thermograms were
then analyzed by the software provided with the DSC (Pyris software, Perkin-Elmer, Shelton,
CT).
Volatile Compound Analysis. Volatile compound analysis was conducted on rice bran
oil before and after modification to determine the effect of short-path distillation on RBOSL
volatile compound concentration. Volatile compounds were extracted by solid phase
microextraction (SPME). Samples (25g) were weighed into 50 ml reaction vials and sealed with
Teflon rubber septa. The SPME fiber (polymethylsiloxane/divinylbenzene or PDMS/DVB; blue,
Supelco, Inc., Bellefonte, PA) was then inserted into the sample headspace and heated for 1hr at
60 °C to absorb the volatile compounds generated from the samples onto the SPME fiber.
Extracted volatile compounds were desorbed by inserting the SPME fiber into an
injection port of a Hewlett-Packard 5890 Series II GC (formerly Hewlett-Packard, Avondale, PA
now Agilent, Palo Alto, CA) for 10 min. Desorbed volatile compounds were then separated on a
30m x 0.25 mm x 0.25µm EC-WAX capillary column (Alltech, Deerfield, IL). Helium was used
as the carrier gas. The splitless mode was used initially during injection for 5 min; then returned
to split mode (4.9 ml/min). The initial column temperature was 35 °C for 5 min; the temperature
was then increased to 220 °C at the rate of 3 °C /min. The injector temperature was held at 220
°C for 20 min and detector temperature was also at 220 °C.
Volatile compounds were identified by gas chromatography-mass spectrometry (GC-
MS). GC-MS conditions were the same as for GC above. Mass spectra were obtained at a MS
voltage of 70Ev. The mass range was 35 to 300 (m/z). Separated compounds were identified by
66
comparison to mass spectral libraries (National Institute of Standards and Technology,
Manchester, U.K. and Wiley Registry 7th
Edition, New York, NY).
Other Analytical Methods. The following AOCS official methods were used: Cd 1b-87
for iodine value, Tl 1a-64 for saponification value, Ca 5a-40 for free fatty acid content, and Cc
9a-48 for Smoke point (13). Viscosity was determined at 22.8 ⁰C with a RV Brookfield Digital
Viscometer (spindle #2) (Brookfield Engineering Laboratories, Inc., Stoughton, MA). Color
was measured by a Minolta CR-300 Chroma Meter (Osaka, Japan) using la Commission
Internationale de l’Eclairage (CIE) L*a*b* (for lightness, redness and yellowness, respectively)
color system.
Statistical Analysis. Statistical analysis was performed with the SAS software package
(14). A t-test was used to determine the differences between two samples (enzymatically
modified RBOSL and unmodified RBO). Statistical differences with P ≤ 0.05 were considered
significant.
RESULTS AND DISCUSSION
Positional Analysis. Unmodified rice bran oil did not contain caprylic acid (Table 4.1).
After modification the fatty acid profile of RBOSL contained 32.1±0.9 mol% caprylic acid and
the reaction yield was 35.6%. The ratio of saturated to monounsaturated to polyunsaturated fatty
acids was 1.6:1.0:1:0. The predominant fatty acids for both RBO and RBOSL at sn-2 position
were oleic and linoleic acids. The small amount of caprylic acid at the sn-2 position for RBOSL
indicates that acyl migration was minimal. RBOSL had 47.8±0.9 mol% caprylic acid at the sn-
1,3 positions. These results were expected because of the sn-1,3 specific Lipozyme RM IM used
for enzymatic modification. A previous enzymatic modification study involving Lipozyme RM
67
IM catalyzed acidolysis of sesame oil and caprylic acid indicated that a lower temperature,
higher substrate mole ratio reduced acyl migration while having a minimal effect on
incorporation (10).
Chemical Properties. The free fatty acid (FFA) content of RBOSL was reduced to the
level of unmodified RBO after short-path distillation (2. 2). The FFA content of RBOSL after
enzymatic modification in the packed-bed reactor was high and this purification step was
necessary after the acidolysis reaction to remove FFA and to increase oxidative stability.
The smoke point of RBOSL was not significantly different (P >0.05) from that of RBO
possibly because the RBO used in this study was refined, bleached and deodorized (RBD).
Refined oils will often have higher smoke points than unrefined oils because they contain less
unsaponifiable matter.
The saponification value of RBOSL (206.9±0.7) was significantly higher (P ≤ 0.05) than
RBO (178.1±0.0). The saponfication value measures the alkali reactive groups in oils in mg of
KOH that reacts with 1 g of sample and is an indicator of the molecular weight of the oil. The
higher saponification value of RBOSL indicates a lower molecular weight than RBO. The lower
molecular weight of RBOSL is due to the incorporation of the MCFA, caprylic acid. The
saponification value of 178.1±0.0 for RBO was slightly lower than that listed by the Codex
Alimentarius Commission (15) which was in the range of 180-195 possibly because of variations
in fatty acid composition. The mol % fatty acids for oleic (37.6±0.1) and linoleic acids
(33.3±0.2) for the RBO used in this study (2. 1) were slightly lower than or in the lower range
of the values listed by the Codex Alimentarius Commission, which were 38-46 total % fatty
acids for oleic acid and 33-40 total % fatty acids for linoleic acid (15) .
68
The iodine value of a fat or oil is determined by measuring the amount of iodine that is
absorbed per gram of sample and is a measure of the degree of unsaturation. The iodine value
for RBO was significantly higher than for RBOSL. This was because of the incorporation of the
saturated fatty acid, caprylic acid, into RBO which replaced some of the unsaturated fatty acids.
The iodine value obtained for RBO in this study was within the range of 90-105 as listed by the
Codex Alimentarius Commission (15).
Minor Components and Oxidative Stability. Crude rice bran oil can contain up to 5.4
g/100 ml unsaponifiable matter (which includes tocopherols, sterols and γ- oryzanol) and may
decline to 2.7g/100 ml after refining, bleaching and deodorizing (16). A previous study (17) in
which rice bran oil was enzymatically modified to contain caprylic acid has shown that the total
tocopherol and tocotrienol content of refined rice bran oil declined by 43.4% after enzymatic
modification and short-path distillation. This study also found that the concentration of γ-
oryzanol was not significantly different after enzymatic modification and short-path distillation.
The oxidative stability index (OSI) value for RBOSL (11.4±0.0 h) determined in this study was
significantly lower (P ≤ 0.05) than RBO (12.4±0.2 h). Another study that determined the
characteristics of a SL prepared from unrefined sesame oil and caprylic acid found that the
concentrations of the tocopherols, phytosterols, and lignins were not significantly different (P >
0.05) for sesame oil and sesame oil SL while the oxidative stability of the sesame oil SL was
lower (3). The differences in findings may be related to differences in the amount of refining
and in the concentrations and types of minor components and fatty acid compositions of rice
bran and sesame oils.
Physical Properties. Viscosity is a measure of a fluid’s resistance to flow and was
determined for RBO and RBOSL. The viscosity of RBOSL at 22.8 ⁰C (66.8±0.2 cP) was
69
significantly lower than that of RBO (78.6±0.2 cP) (Table 4.2). Caprylic acid which replaced
long chain fatty acids has a lower molecular weight and density than fatty acids present in RBO
and these factors affect viscosity.
Color. The CIE color system with L* (lightness) a* (redness) and b*(yellowness)
showed that the RBO and RBOSL oil samples could be described as dark greenish yellow
(Table 4.3). When L* a* b* values were compared between RBO and RBOSL, RBOSL was
darker, less green and more yellow than RBO. The chroma value (C) also was not significantly
different between the oils. The color difference was detectable by visual observation with
RBOSL appearing cloudy and darker then RBO which had a more transparent appearance. The
darker cloudy color of RBOSL was because of changes that occurred during short-path
distillation possibly due to sample carry over from the short-path distillation apparatus
evaporation assembly.
Volatile Compounds. Table 4.4 shows the volatile compounds analyzed by GC-MS from
SPME at 60 ⁰C. Only 3 volatile compounds were detected in RBO. RBO and RBOSL both
contained 2,4-decadienal and n-hexadecanoic acid. 2,4-Decadienal and 2-decenal (detected in
RBOSL), has been found in the volatile compounds detected in rice in previous studies (18,19)
and the odor of these compounds was described as fatty (19). Octanoic acid (caprylic acid) was
the predominant fatty acid detected in RBOSL. This was expected because of the incorporation
of caprylic acid which is volatile. Possible reasons that so few volatile compounds were detected
include: the use of refined, bleached and deodorized RBO, and the use of short-path distillation
to purify RBOSL which removed more volatile compounds.
Melting Profiles. Table 4.5 lists melting onset and end temperatures as well as ΔH values
(enthalpy) for melting curves of RBO and RBOSL. The difference in melting onset
70
temperatures for RBO and RBOSL were not significant (P > 0.05). The melting endpoint
temperatures, however, were significantly different from RBOSL showing a significantly lower
melting endpoint temperature than RBO. The enthalpy value for RBOSL (81.7±0.1 J/g) was
significantly higher than for RBO (59.6±0.4 J/g) because of the stacked linear structure of the
saturated fatty acid, caprylic acid, incorporated into RBOSL. Saturated fatty acids have close
molecular interactions and stacked linear structures, and require more energy to melt, whereas
unsaturated fatty acids have a bent structure that has weaker molecular interactions and require
less energy to melt (20). Figure 4.1 shows the melting curves of RBO and RBOSL. The more
diverse mixture of fatty acids in the RBO TAG produces several broad melting peaks
overlapping one another. The peak for RBOSL is sharper because it contains predominantly
caprylic acid and has a less diverse TAG mixture.
Chemical and physical characteristics of a SL containing rice bran oil and caprylic acid were
determined in this study. The differences in the chemical and physical properties of RBOSL
were significantly different from those of RBO in most assays performed. RBOSL which is
liquid at room temperature can potentially be used in butter and margarine blends, frying and
baking applications, and in beverages. This characterization study can aid in determining future
food applications of RBOSL.
71
LITERATURE CITED
(1) Akoh, C. C.; Kim B.H. Structured lipids. In Food Lipids-Chemistry, Nutrition, and
Biotechnology, 3rd
ed.; Akoh, C.C. Min, D.B., Eds,; CRC Press.: Boca Raton, FL, 2008; pp
841-872.
(2) Kennedy J.P. Structured Lipids: fats of the future. Food Technol. 1991, 45, 76-83.
(3) Megremis C.J. Medium-chain triglycerides: a nonconventional fat. Food Technol. 1991, 45,
108-114.
(4) St-Onge, M.-P.; Jones, P.J.H. Physiological effects of medium-chain triglycerides: Potential
agents in the prevention of obesity. J. Nutr. 2002. 132, 329-332.
(5) St-Onge, M.-P.; Ross, R.; Pearsons, W.D.; Jones, P.J.H. Medium-chain triglycerides increase
energy expenditure and decrease adiposity in overweight men. Obesity Res. 2003. 11, 395-
402.
(6) Jennings B.H., Akoh C.C. Lipase-catalyzed modification of rice bran oil to incorporate
capric acid. J. Agric. Food Chem. 2000. 48, 4439-4443.(6)
(7) Kim, B.H.; Akoh, C.C. Characteristics of structured lipid prepared by lipase-catalyzed
acidolysis of roasted sesame oil and caprylic acid in a bench-scale continuous packed-bed
reactor. J. Agric. Food Chem. 2006. 54, 5132-5141.
(8) Vu, P.-L.; Shin, J.-A.; Lee, Y.-J; Nam; H.-Y. Lee; J.-H.; Akoh, C.C.; Lee, K.-T.
Development and characterization of structured lipids containing capric acid and conjugated
linoleic acids as functional dietary lipid molecules. Int. J. Food Sci. Nutr. 2008. 59, 95-104.
72
(9) Jandacek, R.J.; Whiteside, J.A.; Holcombe, B.N.; Volpenhein, R.A.; Taulbee, J.D. The rapid
hydrolysis and efficient absorption of triacylglycerides with octanoic acid at the 1 and 3
positions and long-chain fatty acids in the 2 position. Am. J. Clin. Nutr. 1987, 45, 940-945.
(10) Kim, B.H.; Akoh, C.C. Modeling of lipase catalyzed acidolysis of sesame oil and caprylic
acid by response surface methodology: optimization of reaction conditions by considering
both acyl incorporation and migration. J. Agric. Food Chem. 2005, 53, 8033-8037.
(11) Fomuso L.B.; Akoh C.C. Lipase-catalyzed acidolysis of olive oil and caprylic acid in a
bench-scale packed-bed bioreactor. Food Res. Int. 2002, 35, 15-21.
(12) Hendrikse P.W.; Harwood J.L.; Kates M. Analytical Methods. In The Lipid Handbook, 2nd
ed.; Gunstone F.D., Harwook J.L., Padley F.B., Eds.; Chapman and Hall: New York, 1994;
pp 337-338.
(13) AOCS American Oil Chemists’ Society. Official Methods and Recommended Practices of
the American Oil Chemists’ Society. 5th
ed.; American Oil Chemists’ Society: Champaign,
IL, 1998; Cd 1b-87; Tl 1a-64; Ca 5a-40; Cc 9a-48; Cj 1-94.
(14) SAS Institute. SAS Statistics Software, release 8.2; SAS Institute: Cary, NC, 2000.
(15) Codex Alimentarius Commission. Proposed draft amendments to the standard for named
vegetable oils. Joint FAO/WHO Food Standards Programme Codex Committee on Fats and
Oils 19th
Session London, United Kingdom, 21-25 February 2005,
ftp.fao.org/codex/ccfo19/fo19_05e.pdf (accessed October 2008).
(16) Van Hoed, V.; Depaemelaere, G.; Vila Ayala, J.; Santiwattana, P.; Verhè, R.; De Greyt, W.
Influence of chemical refining on the major and minor components of rice bran oil. J. Am.
Oil Chem. Soc. 2006. 63, 315-320.
73
(17) Jennings, B.H.; Akoh, C.C. Effectiveness of natural versus synthetic antioxidants in a rice
bran oil based structured lipid. Food Chem. 2008. doi: 10.1016/j.foodchem.2008.11.031.
(18) Buttery, R.G.; Turnbaugh, J.G.; Louisa, C. L. Contribution of volatiles to rice aroma.
J. Agric. Food Chem. 1988, 36, 1006-1009.
(19) Yang, S.K.; Shewfelt, R.L.; Lee, K.-S.; Kays, S.J. Comparison of odor active compounds
from six distinctly different rice flavor types. J. Agric. Food Chem. 2008, 56, 2780-2787.
(20) Ophardt, C.E. Virtual chembook. Fatty acids. 2003;
http://www.elmhurst.edu/~chm/vchembook/551fattyacids.html (accessed Oct 2008).
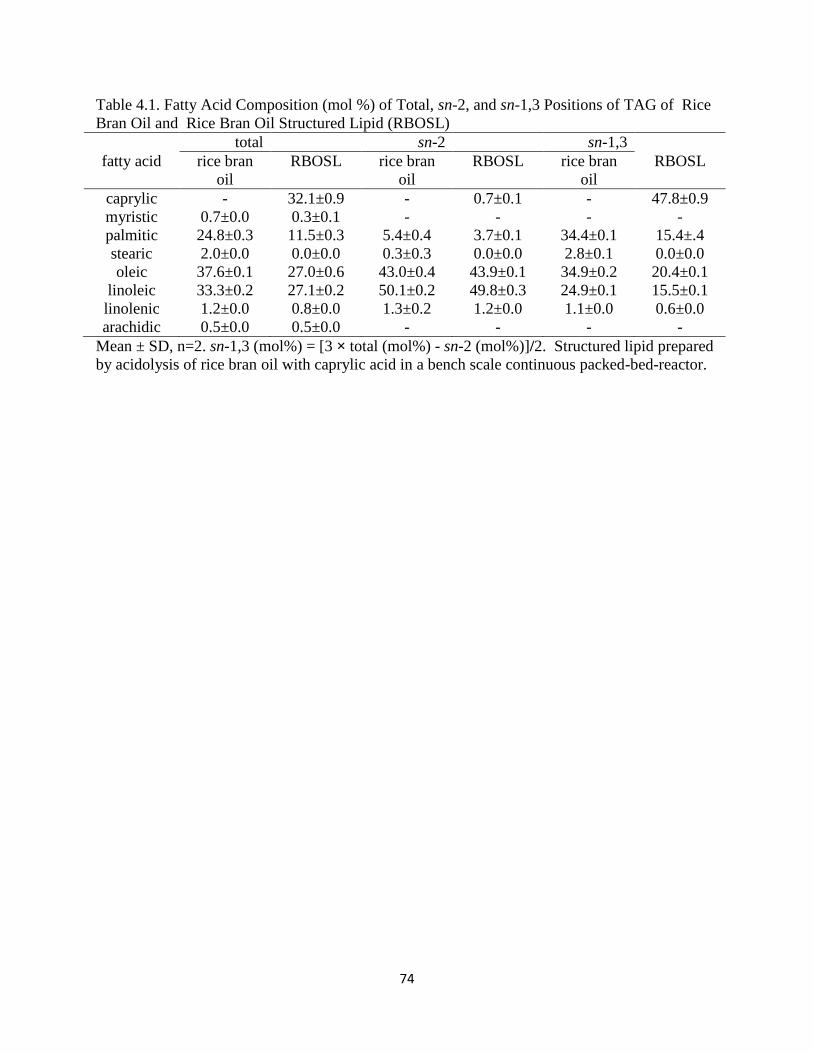
74
Table 4.1. Fatty Acid Composition (mol %) of Total, sn-2, and sn-1,3 Positions of TAG of Rice
Bran Oil and Rice Bran Oil Structured Lipid (RBOSL)
total sn-2 sn-1,3
fatty acid rice bran
oil
RBOSL rice bran
oil
RBOSL rice bran
oil
RBOSL
caprylic - 32.1±0.9 - 0.7±0.1 - 47.8±0.9
myristic 0.7±0.0 0.3±0.1 - - - -
palmitic 24.8±0.3 11.5±0.3 5.4±0.4 3.7±0.1 34.4±0.1 15.4±.4
stearic 2.0±0.0 0.0±0.0 0.3±0.3 0.0±0.0 2.8±0.1 0.0±0.0
oleic 37.6±0.1 27.0±0.6 43.0±0.4 43.9±0.1 34.9±0.2 20.4±0.1
linoleic 33.3±0.2 27.1±0.2 50.1±0.2 49.8±0.3 24.9±0.1 15.5±0.1
linolenic 1.2±0.0 0.8±0.0 1.3±0.2 1.2±0.0 1.1±0.0 0.6±0.0
arachidic 0.5±0.0 0.5±0.0 - - - -
Mean ± SD, n=2. sn-1,3 (mol%) = [3 × total (mol%) - sn-2 (mol%)]/2. Structured lipid prepared
by acidolysis of rice bran oil with caprylic acid in a bench scale continuous packed-bed-reactor.
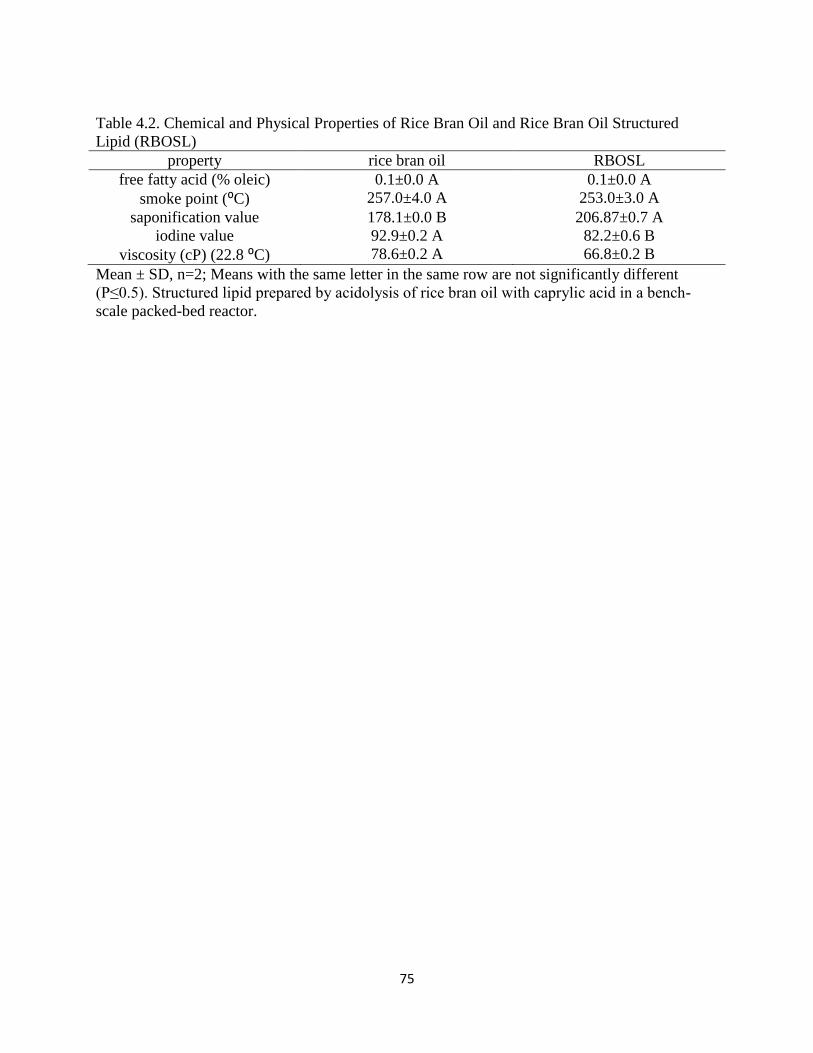
75
Table 4.2. Chemical and Physical Properties of Rice Bran Oil and Rice Bran Oil Structured
Lipid (RBOSL)
property rice bran oil RBOSL
free fatty acid (% oleic) 0.1±0.0 A 0.1±0.0 A
smoke point (⁰C) 257.0±4.0 A 253.0±3.0 A
saponification value 178.1±0.0 B 206.87±0.7 A
iodine value
viscosity (cP) (22.8 ⁰C)
92.9±0.2 A
78.6±0.2 A
82.2±0.6 B
66.8±0.2 B
Mean ± SD, n=2; Means with the same letter in the same row are not significantly different
(P≤0.5). Structured lipid prepared by acidolysis of rice bran oil with caprylic acid in a bench-
scale packed-bed reactor.
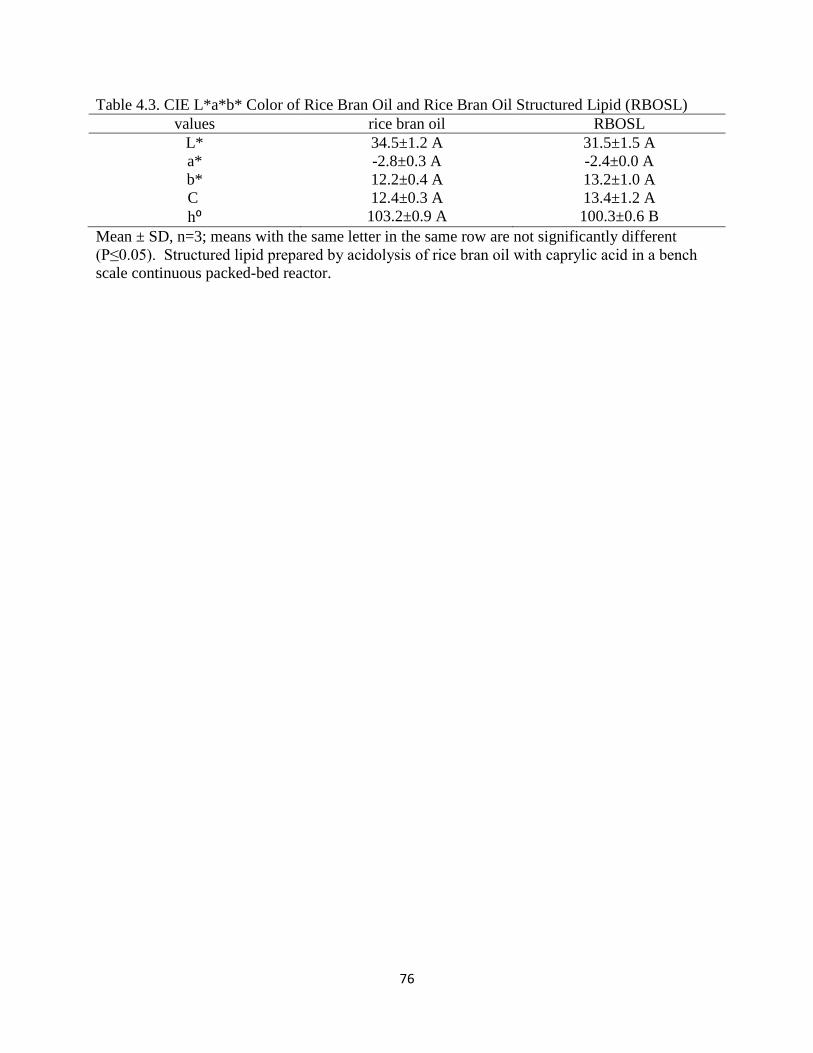
76
Table 4.3. CIE L*a*b* Color of Rice Bran Oil and Rice Bran Oil Structured Lipid (RBOSL)
values rice bran oil RBOSL
L* 34.5±1.2 A 31.5±1.5 A
a* -2.8±0.3 A -2.4±0.0 A
b*
C
h⁰
12.2±0.4 A
12.4±0.3 A
103.2±0.9 A
13.2±1.0 A
13.4±1.2 A
100.3±0.6 B
Mean ± SD, n=3; means with the same letter in the same row are not significantly different
(P≤0.05). Structured lipid prepared by acidolysis of rice bran oil with caprylic acid in a bench
scale continuous packed-bed reactor.
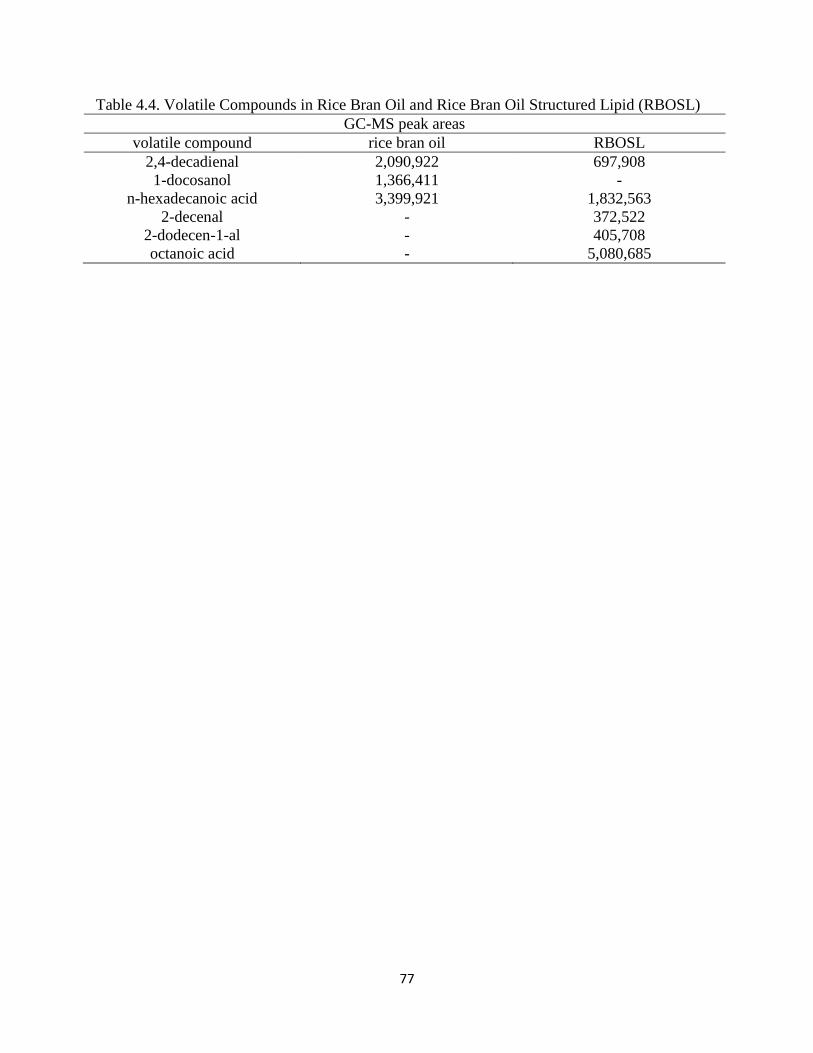
77
Table 4.4. Volatile Compounds in Rice Bran Oil and Rice Bran Oil Structured Lipid (RBOSL)
GC-MS peak areas
volatile compound rice bran oil RBOSL
2,4-decadienal 2,090,922 697,908
1-docosanol 1,366,411 -
n-hexadecanoic acid 3,399,921 1,832,563
2-decenal - 372,522
2-dodecen-1-al - 405,708
octanoic acid - 5,080,685
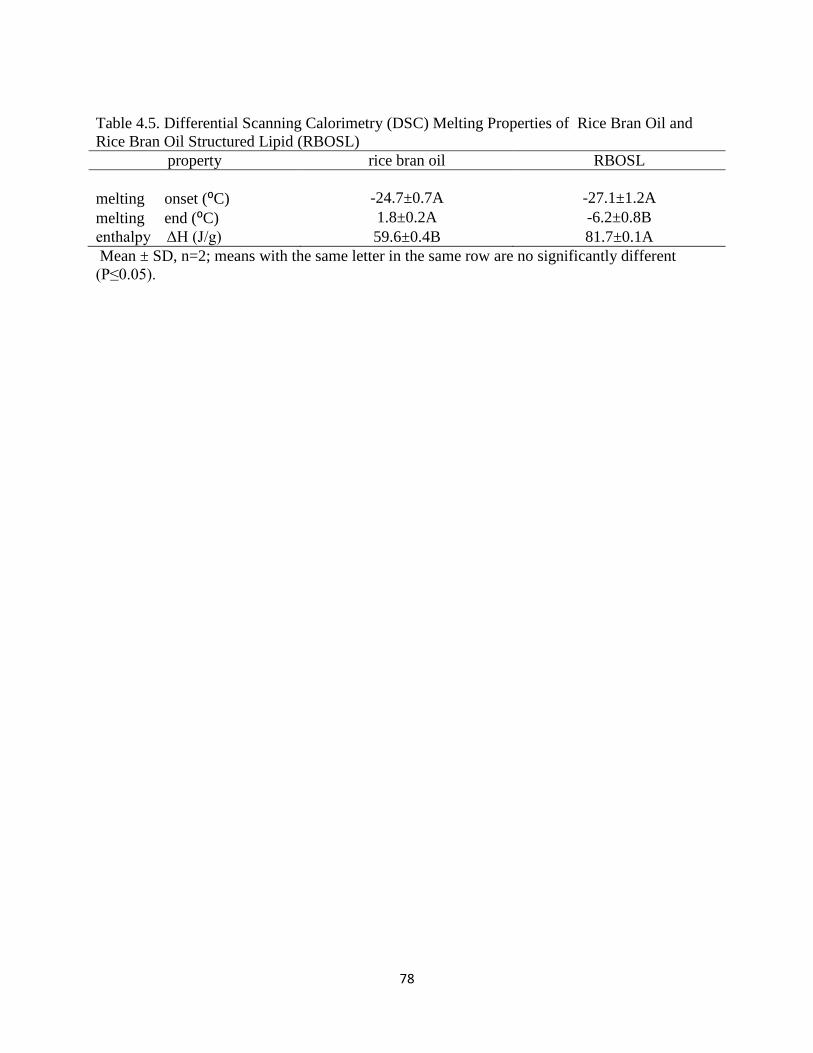
78
Table 4.5. Differential Scanning Calorimetry (DSC) Melting Properties of Rice Bran Oil and
Rice Bran Oil Structured Lipid (RBOSL)
property rice bran oil RBOSL
melting onset (⁰C) -24.7±0.7A -27.1±1.2A
melting end (⁰C) 1.8±0.2A -6.2±0.8B
enthalpy ΔH (J/g) 59.6±0.4B 81.7±0.1A
Mean ± SD, n=2; means with the same letter in the same row are no significantly different
(P≤0.05).
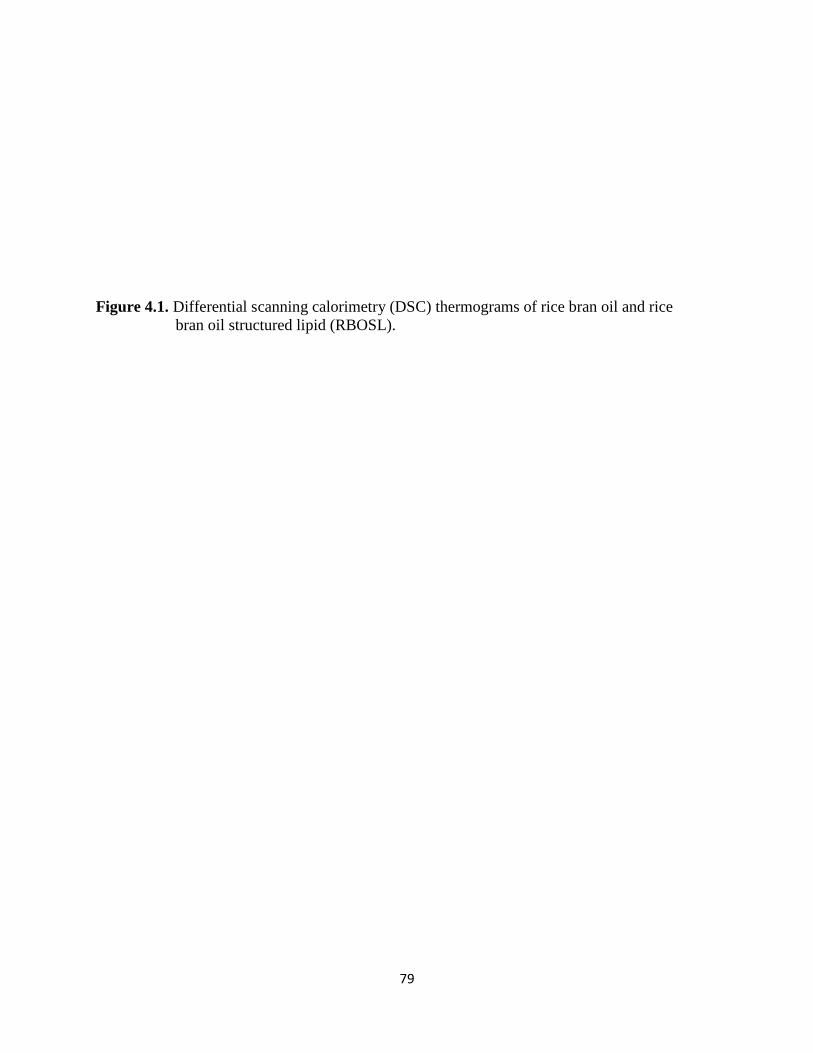
79
Figure 4.1. Differential scanning calorimetry (DSC) thermograms of rice bran oil and rice
bran oil structured lipid (RBOSL).
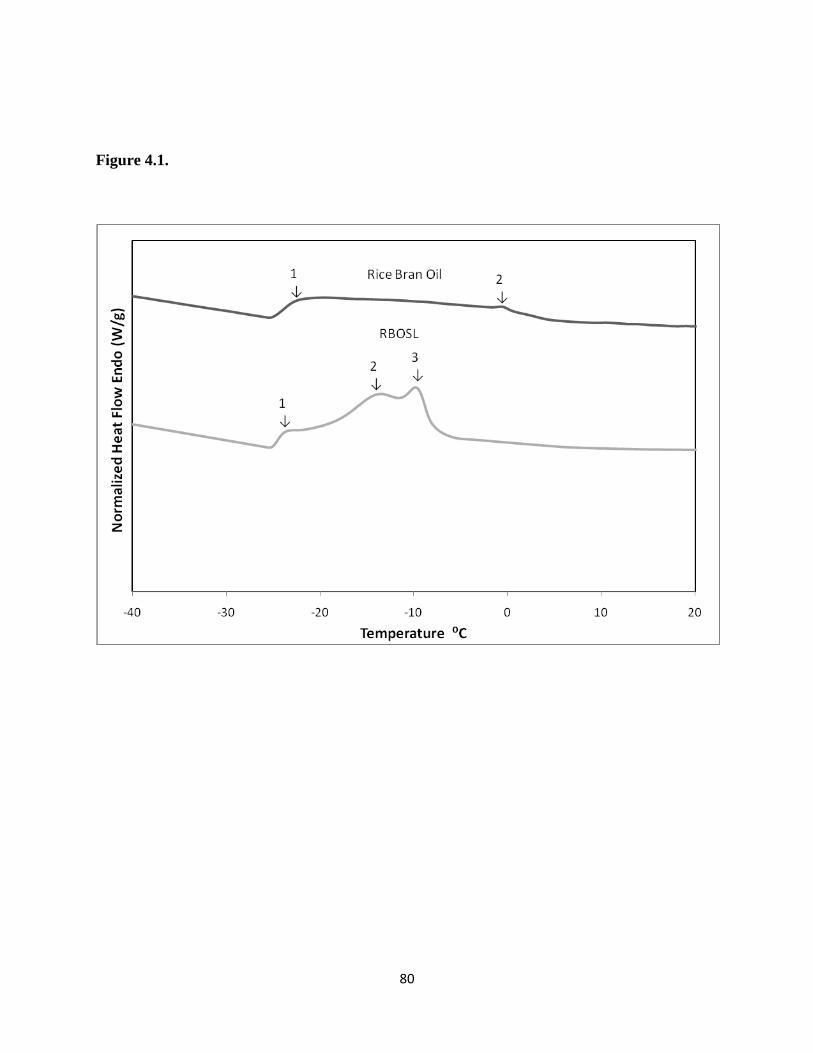
80
Figure 4.1.
81
CHAPTER 5
FOOD APPLICATIONS OF A RICE BRAN OIL STRUCTURED LIPID IN FRIED SWEET
POTATO CHIPS AND AN ENERGY BAR
Jennings B.H., Shewfelt R.L. and Akoh, C.C. submitted to Journal of Food Quality
82
ABSTRACT
A structured lipid (RBOSL) was synthesized from rice bran oil (RBO) and caprylic acid with
Lipozyme RM IM as biocatalyst. Sweet potato chips (SPC) were fried separately in RBOSL and
RBO. Energy bars (EB) were formulated with RBOSL or RBO. Triangle tests (TT) was
conducted for SPC and EB to determine panelists’ ability to differentiate between SPC and EB
prepared with RBO or RBOSL. Willingness to purchase (WTP) sensory analysis was also
conducted. Fatty acid content, γ-oryzanol, viscosity, FFA and p-anisidine values for RBO and
RBOSL were determined before and after frying. SPC color and oil uptake were also determined.
TT results for SPC showed no significant difference in SPC fried in RBO and RBOSL (P>0.05).
TT results for EB indicated a significant difference between RBO and RBOSL formulations
(P≤0.05). WTP (five point scale) sensory analysis of SPC and EB showed the most frequent
response was probably would buy.
PRACTICAL APPLICATIONS
Consumer panels indicated a willingness to purchase both sweet potato chips and energy bars
prepared with RBOSL. Improvements in standardization and preparation procedures and
changes in formulation would probably improve acceptability. These consumer panel results
showed that products prepared with SLs with improved nutritional or health promoting
properties may have viable commercial potential in foods. RBOSL that is liquid at room
temperature can potentially be used in frying and baking applications.
83
INTRODUCTION
Structured lipids (SLs) are produced by modifying triacylglycerols (TAGs) from their
natural state to incorporate new fatty acids or to change the position of fatty acids or the fatty
acid profile (Akoh and Kim 2008). Medium chain fatty acids (MCFAs) are metabolized
through the portal system instead of the lymphatic system and provide quick energy sources that
can be rapidly oxidized and utilized by the body. They are often incorporated into TAGs to
produce SLs. MCFAs have been used by athletes requiring high energy diets and to treat
patients with fat absorption abnormalities (Kennedy 1991; Megremis 1991). TAGs containing
MCFA used in animal and human studies have been shown to increase energy expenditure and
decrease weight gain (St-Onge and Jones 2002; St-Onge et al. 2003). The health promoting
properties of MCFAs incorporated into SLs are related to their mobility, solubility and ease of
metabolism. MCFAs are often targeted at the sn-1,3 positions of SLs because they are easily
hydrolyzed and not stored as fat, whereas those at the sn-2 position are more easily absorbed
and often contain essential long chain fatty acids (LCFAs) (Jandacek et al. 1987). The health
benefits of SLs can include improved immune function, reduction of cholesterol, improved
nitrogen balance and reduction in cancer risk (Akoh and Kim 2008).
Previous studies have examined the conditions for the production of a rice bran oil
structured lipid (RBOSL) (Jennings and Akoh 2000), oxidative stability (Jennings and Akoh
2009a) and characteristics of (Jennings and Akoh 2009b) a rice bran oil structured lipid
(RBOSL) enzymatically modified to contain capric or caprylic acid. There have been no studies
that evaluated the sensory properties and consumer acceptance of a RBOSL used in food
applications. RBOSL that is liquid at room temperature can potentially be used in butter and
84
margarine blends, frying and baking applications, and in beverages. Information on sensory
properties of a RBOSL could possibly lead to increased interest in and use of SL in the food
industry. Few studies on the sensory properties and consumer acceptability of SLs containing
MCFAs have been done. Osborn et al. (2003) conducted sensory analysis of a nutritional
beverage containing a canola oil/caprylic acid SL with a triangle test and qualitative descriptive
analysis (QDA). Kim et al. (2005) conducted sensory analysis of a butterfat-vegetable oil blend
spread prepared with SL containing canola oil and caprylic acid by conducting a triangle test
and QDA to determine the effect of SL on the sensory profile of the spread.
RBO contains γ-oryzanol, which is a ferulic acid ester of sterols and terpene alcohols. γ-
Oryzanol has been found to lower plasma cholesterol (Rukmini and Rughuram 1991), reduce
cholesterol absorption (Seetharamaiah and Chadrasekhara 1990) and inhibit platelet aggregation
(Seetharamaiah et al.. 1990). Jennings and Akoh (2009 a), determined that the γ-oryzanol
concentration of RBOSL containing caprylic acid was not significantly different from
unmodified RBO.
Frying remains a common means of food preparation that produces a very desirable color,
flavor and texture. During deep fat frying food is cooked via heat transfer from the oil to the food
and there is drying due to mass transfer, with both processes occurring simultaneously.
Aeration, oxidation, absorption, vaporization, hydrolysis, and polymerization are among the
physical and chemical changes that occur during frying. These chemical reactions and reaction
products contribute to distinctive fried flavor, brown color and crisp texture of fried foods with
the type of oil, frying conditions and degradation products affecting flavor quality (Warner
2008). The most desirable frying oils give good flavor to fried foods and have greater oxidative
stability and fry life. The low linolenic acid content of rice bran oil allows good storage stability
85
and fry life (McCaskill and Zhang 1999). Valhalla et al. (2004) assessed rice bran oils as a
cooking medium and found it to be generally well accepted. Information on the suitability of
RBOSL as a frying medium compared to RBO would be very useful and would add significantly
to this limited area of knowledge. Medium chain triacylglycerols (MCT) are not generally
suitable for frying because of their low smoke point and high foaming tendencies; however, SLs
enzymatically modified to contain MCFA and long chain fatty acids (LCFA) could decrease
foaming and increase the smoke point (Negishi 2005). There have been few studies that
evaluated SLs containing MCFA and LCFA as frying medium. Negishi et al. (2003) determined
the relationship between the amount of foaming during frying and molecular weight of oils
containing MCFAs. The study found that some canola oil containing MCFAs (either physical
mixtures or esterified) had low foaming properties and were suitable for frying.
Sweet potato chips were chosen as one food application of RBOSL for this frying study
because sweet potatoes are high in nutritional value. They provide 262.2% daily value (DV) of
vitamin A (in the form of beta carotene), 12.6% DV of fiber, 28.4% DV of vitamin C, and 8.1%
DV of iron (www.whfoods.org). Energy bars were chosen as a second food application of
RBOSL because they were originally created as fuel for athletes and body builders and a SL
containing MCFA would possibly be more beneficial than conventional fats usually contained
in these products. Energy bars are also known as nutrition bars, sports nutrition bars, granola
bars and meal replacement bars (Painter and Prisecaru 2002) and although convenient, are not
believed to be a substitute for a healthy diet and proper nutrition. Energy bars offer some
advantages over candy because they are lower in fat and sugars and higher in fiber and may also
be fortified with vitamins and minerals. Bars that provide real food such as whole grains and
dried fruits are recommended over others (Hurley and Leibman 2000). Foods formulated with
86
higher carbohydrate concentrations cause more extreme fluctuations in blood sugar and can lead
to insulin resistance, diabetes and weight gain, whereas foods formulated with added protein
and fat result in more gradual increases in blood sugar (Painter and Prisecaru 2002).
Enzymatically modified RBO containing caprylic acid (C8:0) at the sn-1,3 positions and
with primarily oleic and linoleic acids at the sn-2 position were used in this study. The
positional specific lipase, Lipozyme RM IM, was used to catalyze the enzymatic modification
reaction (Jennings and Akoh 2009b). Our objectives were: 1) to substitute a SL containing rice
bran oil and caprylic acid to provide a healthier alternative to other fats currently used in energy
bars and as a fat source that can be burned quickly for energy, and 2) to conduct sensory
evaluation of sweet potato chips fried in RBOSL and an energy bar formulated with RBOSL.
Both foods were evaluated by a triangle test to determine if panelists could differentiate
between sweet potato chips and energy bars prepared with RBO or RBOSL. A willingness to
purchase five point scale was used to determine consumer acceptance of sweet potato chips and
energy bars prepared with RBOSL in a separate test. In addition, the fatty acid profile of
RBOSL was determined after frying sweet potato chips. Oil uptake, γ-oryzanol concentration,
free fatty acid content, p-anisidine, color and viscosity were also determined for the sweet
potato chip frying study.
MATERIALS AND METHODS
Materials
RBO was purchased from California Rice Oil Company (Novato, CA). Caprylic acid
was purchased from Sigma Chemical Co. (St. Louis, MO). Lipozyme RM IM (immobilized
lipase on a macroporous anion exchange resin) from Rhizomucor miehei was donated by
87
Novozymes North America, Inc. (Franklinton, NC). All ingredients for energy bars except
butter flavor were purchased from a local grocery store. Butter flavor was donated by
(ButterBuds, Racine, WI). Sweet potatoes for the frying study were donated by the Louisiana
Agricultural Experiment Station (Chase, LA).
Synthesis of Rice Bran Oil Structured Lipid
The SL was produced in 1 kg quantities in a packed-bed reactor with substrate flow rate
of 1ml/min, 1:6 substrate mole ratio (rice bran oil:caprylic acid), and a temperature of 45 °C
(Kim & Akoh, 2006). A bioreactor with a jacketed, stainless steel column (47 mm x 500 mm)
and a FMI Lab pump model QV from Fluid Metering, Inc. (Oyster Bay, NY) was used for SL
synthesis. The bioreactor set up was as reported by Fomuso and Akoh (2002). A circulating
water bath was used to maintain a constant column temperature. The column was packed with
immobilized Lipozyme RM IM and plugged at both ends with approximately 3 cm of glass
wool (Jennings and Akoh 2009a).
Short-path Distillation
The SL reaction products were passed through a short-path distillation apparatus 4 times
to remove free fatty acids to a level below 0.1 %. A KDL-4 (UIC Inc., Joliet, IL) distillation
unit was used to purify the reaction products by separating the FFA from the TAG. The heating
oil temperature was 185 °C, the coolant temperature was 15 °C, and the vacuum pressure was
below 1 Torr (Fomuso and Akoh 2002).
88
Energy Bar Formulation
The ingredients in the energy bar were as follows: whole wheat flour 241.2 g, sucralose
13.5g, sugar 57.0 g, brown sugar 30.6 g, skim milk powder 33.0 g, cinnamon 2.0 g, butter
flavor, 14.5 g, egg 53.8 g, RBO or RBOSL, 197.2 g, applesauce 36.2 g, white grape juice, 245.5
g, vanilla extract, 8.3g, dried cranberries, 128.0 g, raisins, 124.0 g, sliced almonds 91.3 g, and
oats 209.5 g. The bars were baked at 176 °C for 30-40 min. This recipe is based on a recipe by
Painter and Prisecaru (2002) for complex carbohydrate bars, which included canola oil, whole
wheat flour, sugar, brown sugar, vanilla extract and egg. Other ingredients and ingredient
amounts added to the energy bars for this study were modifications.
Sweet Potato Chip Frying Study
A frying study was carried out to determine suitability of rice bran oil SL as a frying
medium. Sweet potato chips were evaluated after frying at 165-185 °C separately in RBO and
RBOSL. Sweet potatoes were soaked in an 8% boiling NaOH solution for 4 min and rinsed
thoroughly with water and scraped to remove the skin. The sweet potatoes were then rinsed
again and cut into slices of approximately 1.0-2.0 mm thickness. The chips were washed again
to remove free starch, blotted with a paper towel, and dried at 60 °C for 25-30 min. The sweet
potato chips were fried for 20-60 s at 165-185 °C (Singh et al., 2003). A Dazey model DTC-1
(Airport, KS) fryer was used with an oil volume of 2 L. The total time to complete frying of all
chips for the day’s sensory analysis did not exceed 30 min and was completed with no more
than 10 batches of 30 - 40 chips. RBO and RBOSL were not reused after all batches were
completed for the day. The chips were then placed on a paper towel to drain the oil and placed
89
in an oven at 110 °C for 10 min. Salt (6mg/g chips) was then sprinkled onto the chips, which
were then shaken to distribute the salt.
Free fatty acid content, p-anisidine value, viscosity and oil uptake was measured and
results were compared between modified and unmodified rice bran oil. FFA and p-anisidine
values were determined according to AOCS Official Methods (1997) Ca-5a-40 and Cd-18-90
respectively. Color of sweet potato chips was measured with a Minolta CR-300 Chroma Meter
(Osaka, Japan) with la Commission Internationale de l’Eclairage (CIE) L*a*b* (for lightness,
redness and yellowness, respectively) color system. Sweet potato chip oil uptake was
determined by Soxhlet extraction following AOAC official method 920.39. Viscosity at 22.8
⁰C was determined with a RV Brookfield Digital Viscometer (spindle #2) (Brookfield
Engineering Laboratories, Inc., Stoughton, MA).
Fatty Acid Profile
Gas liquid chromatography (GLC) was used for the fatty acid profile analysis of RBOSL
before and after frying to determine the effect of frying on caprylic acid and other fatty acid
concentrations. Fatty acid methyl esters were prepared as described by Jennings and Akoh
(2000). The gas chromatograph was an Agilent 6890N (Wilmington, PA) equipped with an
AT-225 fused-silica capillary column 30 m x 0.25 mm i.d. (Alltech, Deerfield, IL), flame-
ionization detector, and operated in a splitless mode. The injector and detector temperatures
were held at 250 and 260 ⁰C, respectively. The column temperature was at 130 ⁰C for 3 min
and programmed to 215 ⁰C for 10 min at a rate of 20 ⁰C /min. The carrier gas was helium and
the total gas flow rate was 23 ml/min. The relative concentration of FAME as mol% was
calculated by computer with 17:0 as internal standard.
90
γ-Oryzanol Analysis
HPLC analysis to determine γ-oryzanol content of rice bran oil before and after
modification and frying was performed with an Agilent (Wilmington, PA) model 1100 liquid
chromatograph equipped with a diode array UV-visible detector. γ-Oryzanol standards were
prepared from γ-oryzanol powder purchased from TCI America (Portland, OR). The stationary
phase was a Phenomenex (Torrence, CA), ODS-2, RP C18 column. The initial mobile phase
conditions were 45% acetonitrile, 40% methanol, 5% isopropyl alcohol, and 10% aqueous
acetic acid. After 4 min, the mobile phase was changed linearly to 25% acetonitrile, 70%
methanol, 5% isopropyl alcohol for 10 min and held for 11 min with a total run time of 25 min.
After each run, the solvent gradient was changed linearly to 95% methanol and 5% isopropyl
alcohol and held for 1 min before returning to initial mobile phase conditions. γ-Oryzanol
peaks were detected at 325 nm and quantified from a standard curve (Chen and Bergman
2005).
Sensory Analysis
The panel for the triangle test consisted of 30-36 students and staff from the University of
Georgia Campus. All panelists consented to participate by signing a form approved by the
University of Georgia Institutional Review Board.
The triangle test (Meilgaard et al. 2007) was used to determine if the panelists given 3
samples could detect the sample that was different from the other 2 samples. Samples were
either fried (sweet potato chips) or formulated (energy bar) with RBO or RBOSL. Sensory
analysis of sweet potato chips and energy bars were conducted separately.
91
Panel acceptability of samples containing RBOSL was also evaluated in sensory testing
conducted on a separate day from triangle testing. Separate consumer tests were conducted to
evaluate the RBOSL used in an energy bar and sweet potato chips fried in RBOSL. A total of
100-102 students and staff from the University of Georgia Campus rated the samples on a 5
point willingness to purchase scale (Moskowitz et al. 2005).
Statistical Analysis
Statistical analysis was conducted with the SAS software package (SAS Inst. 2000).
Triangle test data was analyzed by matching the number of correct responses from the number
of trials conducted to a probability table (Meilgaard et al, 2007). A t-test was used to determine
the differences between 2 samples (RBOSL and unmodified RBO as well as before and after
frying). Statistical differences with P ≤ 0.05 were considered significant.
RESULTS AND DISCUSSION
Chemical and Physical Characteristics
Table 5.1 shows the fatty acid profile of RBOSL before and after frying sweet potato
chips. Mol% fatty acids for caprylic, palmitic, stearic, oleic and linoleic acids were not
significantly different after frying (P>0.05). These findings clearly show that the volatile nature
of caprylic acid is not a concern in a triacylglycerol when subjected to frying temperatures.
Table 5.2 shows some chemical characteristics of RBOSL before and after frying. Free fatty
acid content and p-anisidine value are indicators of oxidative stability. Free fatty acids are
formed due to the reaction of air and water, which causes hydrolysis of fatty acids from TAG
during frying. The p-anisidine value measures the amount of aldehydes present in oil.
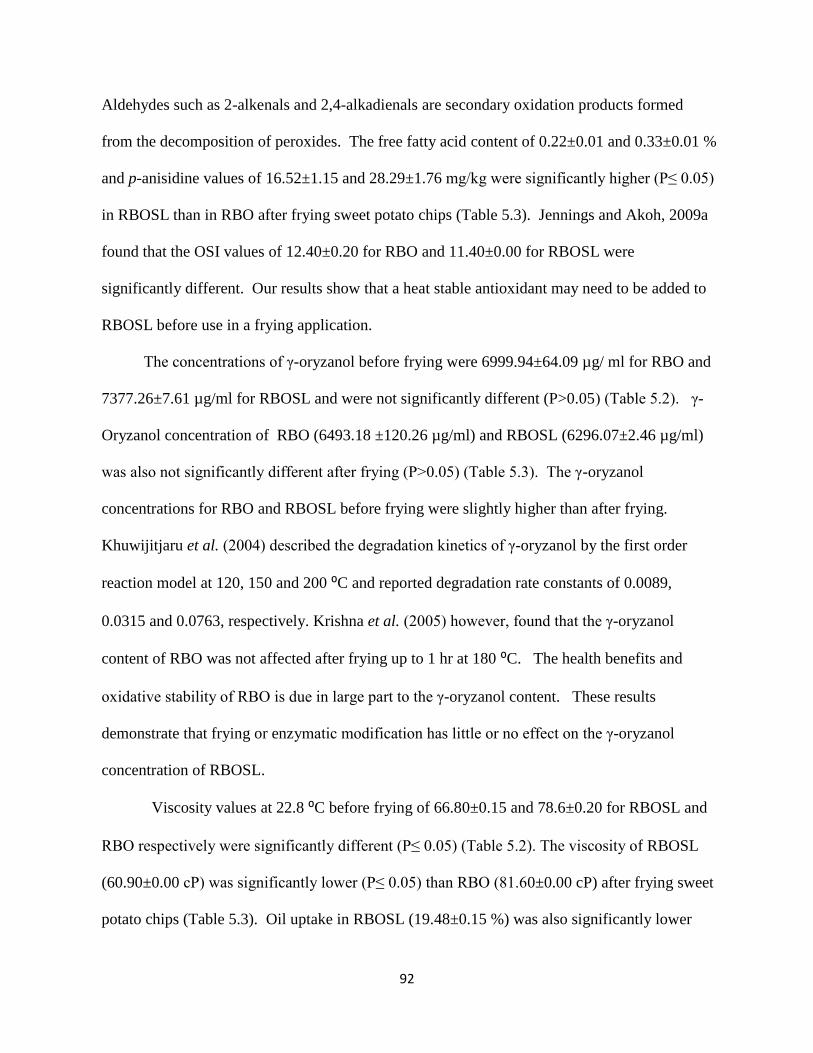
92
Aldehydes such as 2-alkenals and 2,4-alkadienals are secondary oxidation products formed
from the decomposition of peroxides. The free fatty acid content of 0.22±0.01 and 0.33±0.01 %
and p-anisidine values of 16.52±1.15 and 28.29±1.76 mg/kg were significantly higher (P≤ 0.05)
in RBOSL than in RBO after frying sweet potato chips (Table 5.3). Jennings and Akoh, 2009a
found that the OSI values of 12.40±0.20 for RBO and 11.40±0.00 for RBOSL were
significantly different. Our results show that a heat stable antioxidant may need to be added to
RBOSL before use in a frying application.
The concentrations of γ-oryzanol before frying were 6999.94±64.09 µg/ ml for RBO and
7377.26±7.61 µg/ml for RBOSL and were not significantly different (P>0.05) (Table 5.2). γ-
Oryzanol concentration of RBO (6493.18 ±120.26 µg/ml) and RBOSL (6296.07±2.46 µg/ml)
was also not significantly different after frying (P>0.05) (Table 5.3). The γ-oryzanol
concentrations for RBO and RBOSL before frying were slightly higher than after frying.
Khuwijitjaru et al. (2004) described the degradation kinetics of γ-oryzanol by the first order
reaction model at 120, 150 and 200 ⁰C and reported degradation rate constants of 0.0089,
0.0315 and 0.0763, respectively. Krishna et al. (2005) however, found that the γ-oryzanol
content of RBO was not affected after frying up to 1 hr at 180 ⁰C. The health benefits and
oxidative stability of RBO is due in large part to the γ-oryzanol content. These results
demonstrate that frying or enzymatic modification has little or no effect on the γ-oryzanol
concentration of RBOSL.
Viscosity values at 22.8 ⁰C before frying of 66.80±0.15 and 78.6±0.20 for RBOSL and
RBO respectively were significantly different (P≤ 0.05) (Table 5.2). The viscosity of RBOSL
(60.90±0.00 cP) was significantly lower (P≤ 0.05) than RBO (81.60±0.00 cP) after frying sweet
potato chips (Table 5.3). Oil uptake in RBOSL (19.48±0.15 %) was also significantly lower
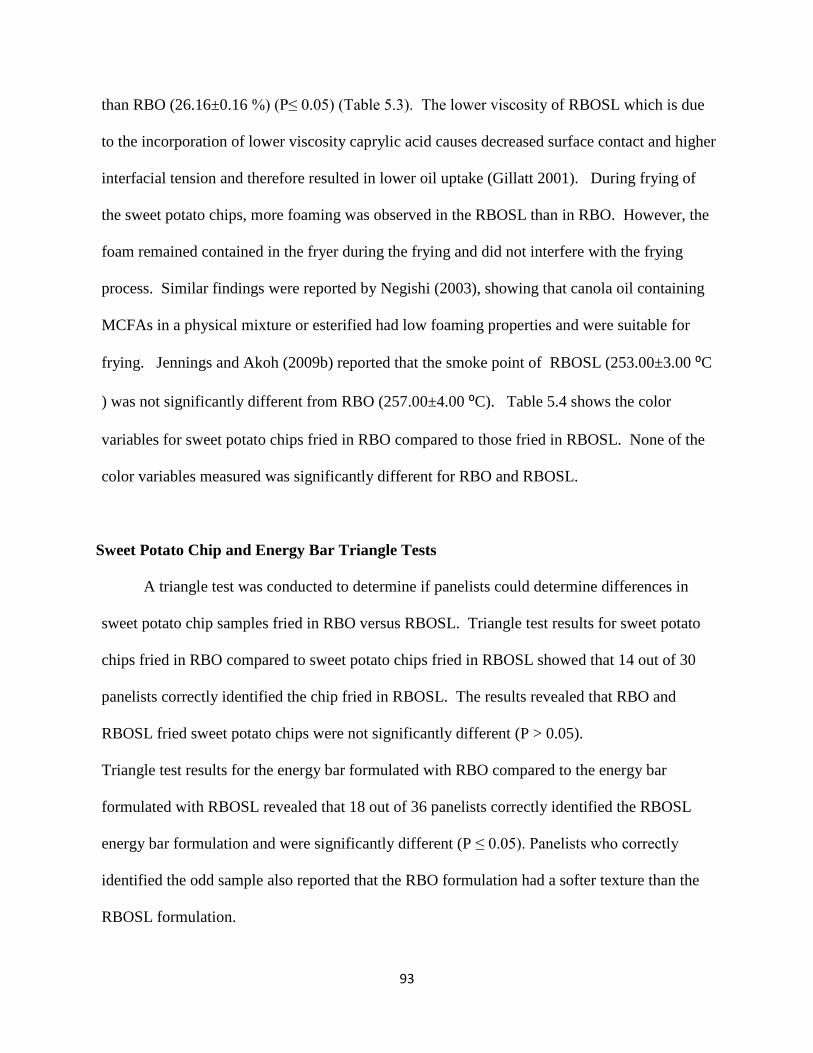
93
than RBO (26.16±0.16 %) (P≤ 0.05) (Table 5.3). The lower viscosity of RBOSL which is due
to the incorporation of lower viscosity caprylic acid causes decreased surface contact and higher
interfacial tension and therefore resulted in lower oil uptake (Gillatt 2001). During frying of
the sweet potato chips, more foaming was observed in the RBOSL than in RBO. However, the
foam remained contained in the fryer during the frying and did not interfere with the frying
process. Similar findings were reported by Negishi (2003), showing that canola oil containing
MCFAs in a physical mixture or esterified had low foaming properties and were suitable for
frying. Jennings and Akoh (2009b) reported that the smoke point of RBOSL (253.00±3.00 ⁰C
) was not significantly different from RBO (257.00±4.00 ⁰C). Table 5.4 shows the color
variables for sweet potato chips fried in RBO compared to those fried in RBOSL. None of the
color variables measured was significantly different for RBO and RBOSL.
Sweet Potato Chip and Energy Bar Triangle Tests
A triangle test was conducted to determine if panelists could determine differences in
sweet potato chip samples fried in RBO versus RBOSL. Triangle test results for sweet potato
chips fried in RBO compared to sweet potato chips fried in RBOSL showed that 14 out of 30
panelists correctly identified the chip fried in RBOSL. The results revealed that RBO and
RBOSL fried sweet potato chips were not significantly different (P > 0.05).
Triangle test results for the energy bar formulated with RBO compared to the energy bar
formulated with RBOSL revealed that 18 out of 36 panelists correctly identified the RBOSL
energy bar formulation and were significantly different (P ≤ 0.05). Panelists who correctly
identified the odd sample also reported that the RBO formulation had a softer texture than the
RBOSL formulation.
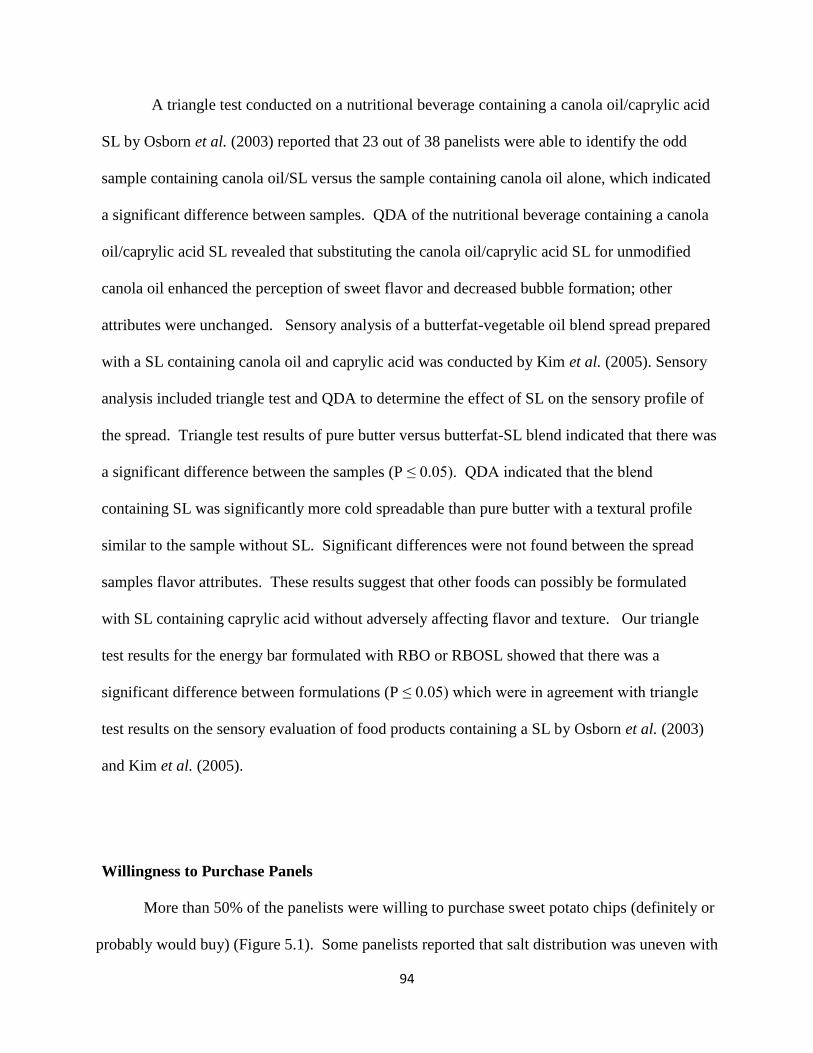
94
A triangle test conducted on a nutritional beverage containing a canola oil/caprylic acid
SL by Osborn et al. (2003) reported that 23 out of 38 panelists were able to identify the odd
sample containing canola oil/SL versus the sample containing canola oil alone, which indicated
a significant difference between samples. QDA of the nutritional beverage containing a canola
oil/caprylic acid SL revealed that substituting the canola oil/caprylic acid SL for unmodified
canola oil enhanced the perception of sweet flavor and decreased bubble formation; other
attributes were unchanged. Sensory analysis of a butterfat-vegetable oil blend spread prepared
with a SL containing canola oil and caprylic acid was conducted by Kim et al. (2005). Sensory
analysis included triangle test and QDA to determine the effect of SL on the sensory profile of
the spread. Triangle test results of pure butter versus butterfat-SL blend indicated that there was
a significant difference between the samples (P ≤ 0.05). QDA indicated that the blend
containing SL was significantly more cold spreadable than pure butter with a textural profile
similar to the sample without SL. Significant differences were not found between the spread
samples flavor attributes. These results suggest that other foods can possibly be formulated
with SL containing caprylic acid without adversely affecting flavor and texture. Our triangle
test results for the energy bar formulated with RBO or RBOSL showed that there was a
significant difference between formulations (P ≤ 0.05) which were in agreement with triangle
test results on the sensory evaluation of food products containing a SL by Osborn et al. (2003)
and Kim et al. (2005).
Willingness to Purchase Panels
More than 50% of the panelists were willing to purchase sweet potato chips (definitely or
probably would buy) (Figure 5.1). Some panelists reported that salt distribution was uneven with
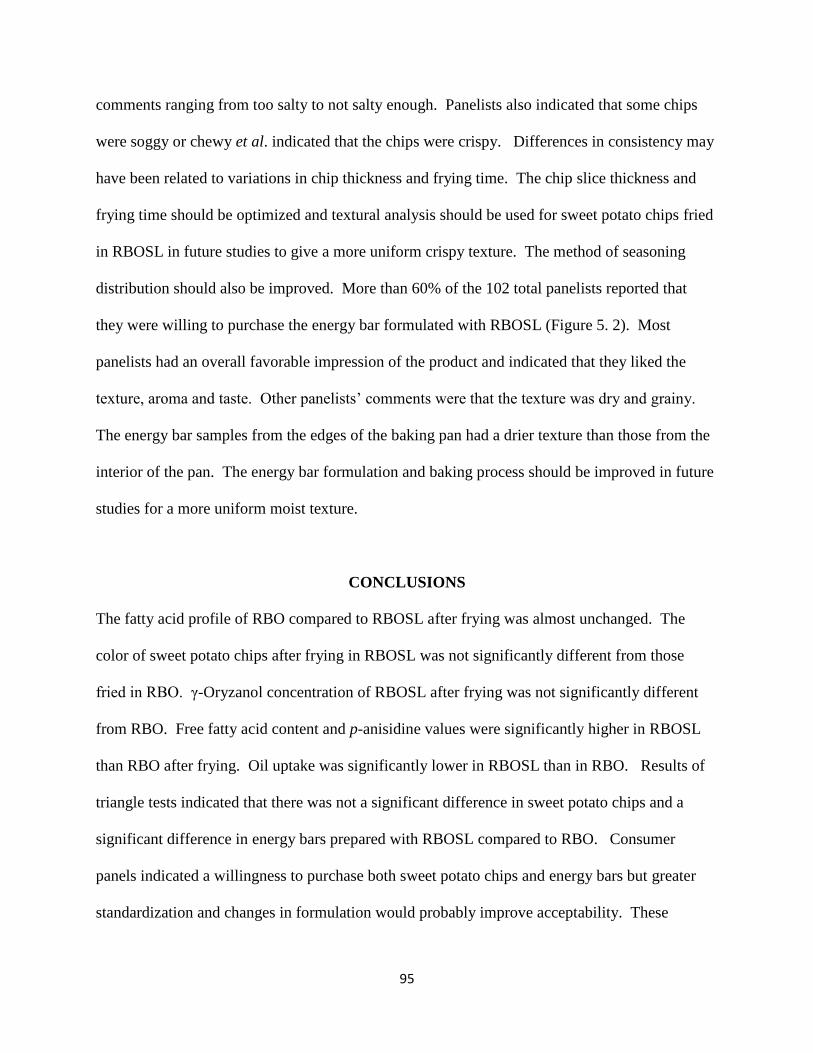
95
comments ranging from too salty to not salty enough. Panelists also indicated that some chips
were soggy or chewy et al. indicated that the chips were crispy. Differences in consistency may
have been related to variations in chip thickness and frying time. The chip slice thickness and
frying time should be optimized and textural analysis should be used for sweet potato chips fried
in RBOSL in future studies to give a more uniform crispy texture. The method of seasoning
distribution should also be improved. More than 60% of the 102 total panelists reported that
they were willing to purchase the energy bar formulated with RBOSL (Figure 5. 2). Most
panelists had an overall favorable impression of the product and indicated that they liked the
texture, aroma and taste. Other panelists’ comments were that the texture was dry and grainy.
The energy bar samples from the edges of the baking pan had a drier texture than those from the
interior of the pan. The energy bar formulation and baking process should be improved in future
studies for a more uniform moist texture.
CONCLUSIONS
The fatty acid profile of RBO compared to RBOSL after frying was almost unchanged. The
color of sweet potato chips after frying in RBOSL was not significantly different from those
fried in RBO. γ-Oryzanol concentration of RBOSL after frying was not significantly different
from RBO. Free fatty acid content and p-anisidine values were significantly higher in RBOSL
than RBO after frying. Oil uptake was significantly lower in RBOSL than in RBO. Results of
triangle tests indicated that there was not a significant difference in sweet potato chips and a
significant difference in energy bars prepared with RBOSL compared to RBO. Consumer
panels indicated a willingness to purchase both sweet potato chips and energy bars but greater
standardization and changes in formulation would probably improve acceptability. These
96
consumer panel results were very encouraging and indicate that products prepared with SLs with
improved nutritional or health promoting properties may have viable commercial potential.
REFERENCES
AKOH, C.C. and KIM, B.H. 2008. Structured lipids. In Food Lipids: Chemistry, Nutrition, and
Biotechnology. 3rd Ed., (C.C. Akoh and D.B. Min ed.) pp. 841-872. CRC Press, New
York.
AOAC 920.39. 1995. Official methods of analysis AOAC international. 16th Ed., Association of
Official Analytical Chemists, Arlington, VA.
AOCS Ca 5a-40 and Cd 18-90. 1998. Official methods and recommended practices of the
American Oil Chemists’ Society. 5th Ed., American Oil Chemists’ Society, Champaign, IL.
CHEN, M.H. and BERGMAN, C.J. 2005. A rapid procedure for analyzing rice bran oil
tocopherol, tocotrienol and γ-oryzanol contents. J. Food Compos. Anal. 18, 319-31.
FOMUSO, L.B. and AKOH, C.C. 2002. Lipase-catalyzed acidolysis of olive oil and caprylic
acid in a bench-scale packed-bed bioreactor. Food Res. Int. 35, 15-21.
GILLATT, P. 2001. Flavor and aroma development in frying and fried food. In Frying:
Improving Quality, (J.B. Rossell, ed.) pp. 266-336, Woodhead Publishing, England.
HURLEY, J. and LIEBMAN, B. 2000. Behind bars. Nutrition Action Health Letter 27,10-13.
JANDACEK, R.J., WHITESIDE, J.A., HOLCOMBE, B.N., VOLPENHEIN, R.A. and
TAULBEE, J.D. 1987. The rapid hydrolysis and efficient absorption of triacylglycerides
with octanoic acid at the 1 and 3 positions and long-chain fatty acids in the 2 position.
Am. J. Clin. Nutr. 45, 940-945.
97
JENNINGS, B.H. and AKOH, C.C. 2000. Lipase-catalyzed modification of rice bran oil to
incorporate capric acid. J. Agric. Food Chem. 48, 4439-4443.
JENNINGS, B.H. and AKOH, C.C. 2009a. Effectiveness of natural versus synthetic antioxidants
in rice bran oil-based structured lipid. Food Chem. 114, 1456-1461.
JENNINGS, B.H. and AKOH, C.C. 2009b. Characterization of a rice bran oil structured lipid. J
Agric. Food Chem. doi: 10.1021/J803825m.
KENNEDY, J.P. 1991. Structured lipids: fats of the future. Food Technol. 45, 76-83.
KHUWIJITJARU, P., TAENGTIENG, N., CHANGPRASIT, S. 2004. Degradation of gamma-
oryzanol in rice bran oil during heating: an analysis using derivative UV-
spectrophotometry. Silpakorn University International Journal 4, 154-165.
KIM, B.H., SHEWFELT, R.L., LEE, H., and AKOH, C.C. 2005. Sensory evaluation of butterfat-
vegetable oil blend spread prepared with structured lipid containing canola oil and caprylic
acid. J. Food Sci. 70, S406-S412.
KIM, B.H, and AKOH, C.C. 2006. Modeling of lipase catalyzed acidolysis of sesame oil and
caprylic acid by response surface methodology: optimization of reaction conditions by
considering both acyl incorporation and migration. J. Agric. Food Chem. 53, 8033-8037.
KRISHNA, A.G.G., KHATOON, S. and BABYLATHA, R. 2005. Frying performance of
processed rice bran oils. J. Food Lipids 12, 1-11.
McCASKILL, D.R. and ZHANG, F. 1999. Use of rice bran oil in foods. Food Technol. 53, 50-
52.
MEGREMIS, C.J.1991. Medium-chain triglycerides: a nonconventional fat. Food Technol. 45,
108-14.
98
MEILGAARD, M., CIVILLE, G.V. and CARR, B.T. 2007. Sensory Evaluation Techniques, 4th
Ed. CRC Press. Boca Raton, FL.
MOSKOWITZ, H.R., Porretta, S., Silcher, M., 2005. Concept Research in Food Product Design
and Development. Blackwell Publishing, Ames IA.
NEGISHI, S., ITAKURA, M., ARIMOTO, S., NAGASAWA, T. and TSUCHIY, A. K. 2003.
Measurement of foaming of frying oil and effect of composition of TG on foaming. J. Am.
Oil Chem. Soc. 80, 471-474.
NEGISHI, S. 2005. The use of nonimmobilized lipase for industrial esterification of food oils. In
Handbook of Industrial Biocatalysts, (C.T. Hou, ed.) pp. 12-1 - 12-14. CRC Press New
York, NY.
OSBORN, H.T., SHEWFELT, R.L. and AKOH, C.C. 2003. Sensory evaluation of a nutritional
beverage containing canola oil/caprylic acid structured lipid. J. Am. Oil Chem. Soc. 80,
357-60.
PAINTER, J. and PRISECARU, V. 2002. The effects of various protein and carbohydrate
ingredients in energy bars on blood glucose levels in humans. Cereal Food World 47, 236-
41.
RUKMINI, C. and RAGHURAM, T.C. 1991. Nutritional biochemical aspects of the
hypolipidemic action of rice bran oil: a review. J. Am .Coll. Nutr. 10, 593-601.
SEETHARAMAIAH, G.S. and CHANDRASEKHARA, N. 1990 Effect of oryzanol on
cholesterol absorption and biliary and fecal bile acids in rats. Ind. J. Med. Res. 92 471-5.
SEETHARAMAIAH, G.S., KRISHNAKANTHA, T.P. and CHANDRASEKHARA, N. 1990
Influence of oryzanol on platelet aggregation in rats. J. Nutri. Sci. Vitaminol. 36, 291-7.
SAS Inst. 2000. SAS statistics software. Release 8.2. SAS Inst. Cary, NC.
99
SINGH, S., RAINA, C.S, BAWA, A.S. and SAXENA, D.C. 2003. Optimisation of processing
variables in the preparation of sweet potato chips using response surface methodology.
Eur. Food Res. Technol. 217, 374-381.
ST-ONGE, M.P. and JONES, P.J.H. 2002. Physiological effects of medium-chain triglycerides:
potential agents in the prevention of obesity. J. Nutr. 132, 329-332.
ST-ONGE, M. P., ROSS, R., PEARSONS, W.D. and JONES, P.J.H. 2003. Medium-chain
triglycerides increase energy expenditure and decrease adiposity in overweight men.
Obesity Res. 11, 395-402.
WORLD’S HEALTHIEST FOODS. www.whfoods.org
VALSALAN, A., SHIDDHU, A. and SUNDARARAJ, P. 2004. Assessment of rice bran oil as a
cooking medium. J. Food Sci. Technol. 41, 248-255
WARNER, K. 2008. Chemistry of frying oils. In Food Lipids: Chemistry, Nutrition, and
Biotechnology, 3rd Ed., (C.C. Akoh and D.B. Min ed.) pp. 189-204, CRC Press, New
York, NY.
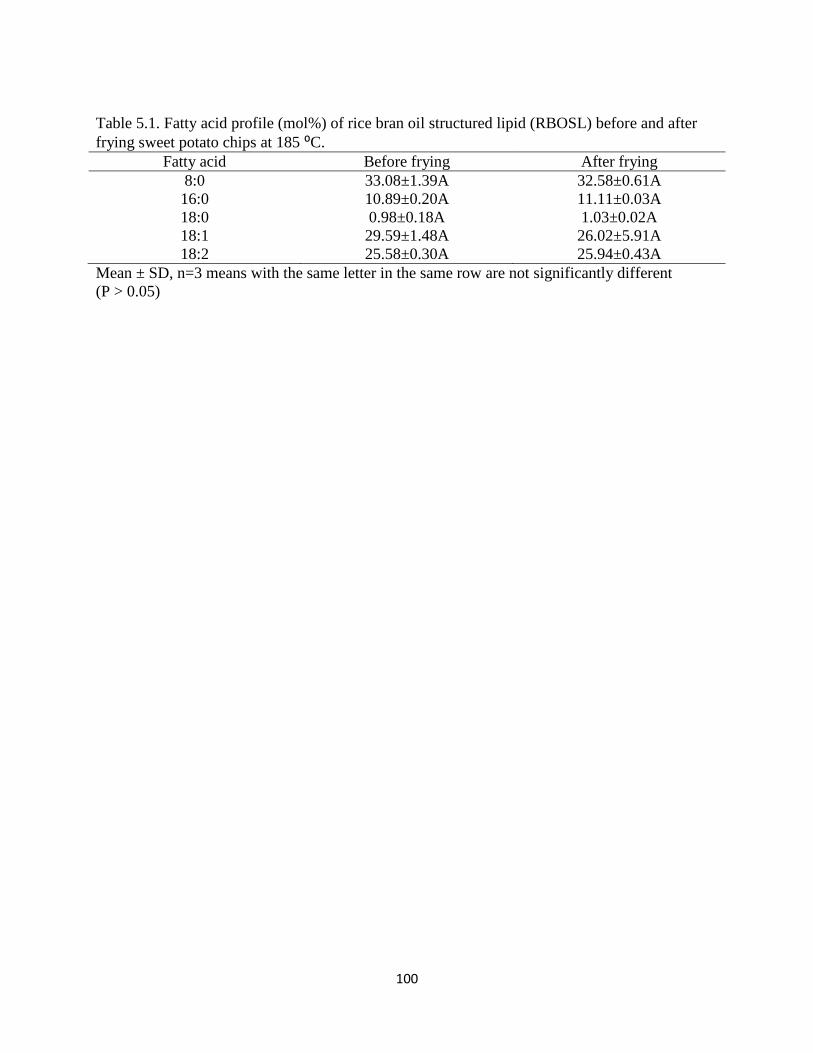
100
Table 5.1. Fatty acid profile (mol%) of rice bran oil structured lipid (RBOSL) before and after
frying sweet potato chips at 185 ⁰C.
Fatty acid Before frying After frying
8:0 33.08±1.39A 32.58±0.61A
16:0 10.89±0.20A 11.11±0.03A
18:0 0.98±0.18A 1.03±0.02A
18:1 29.59±1.48A 26.02±5.91A
18:2 25.58±0.30A 25.94±0.43A
Mean ± SD, n=3 means with the same letter in the same row are not significantly different
(P > 0.05)
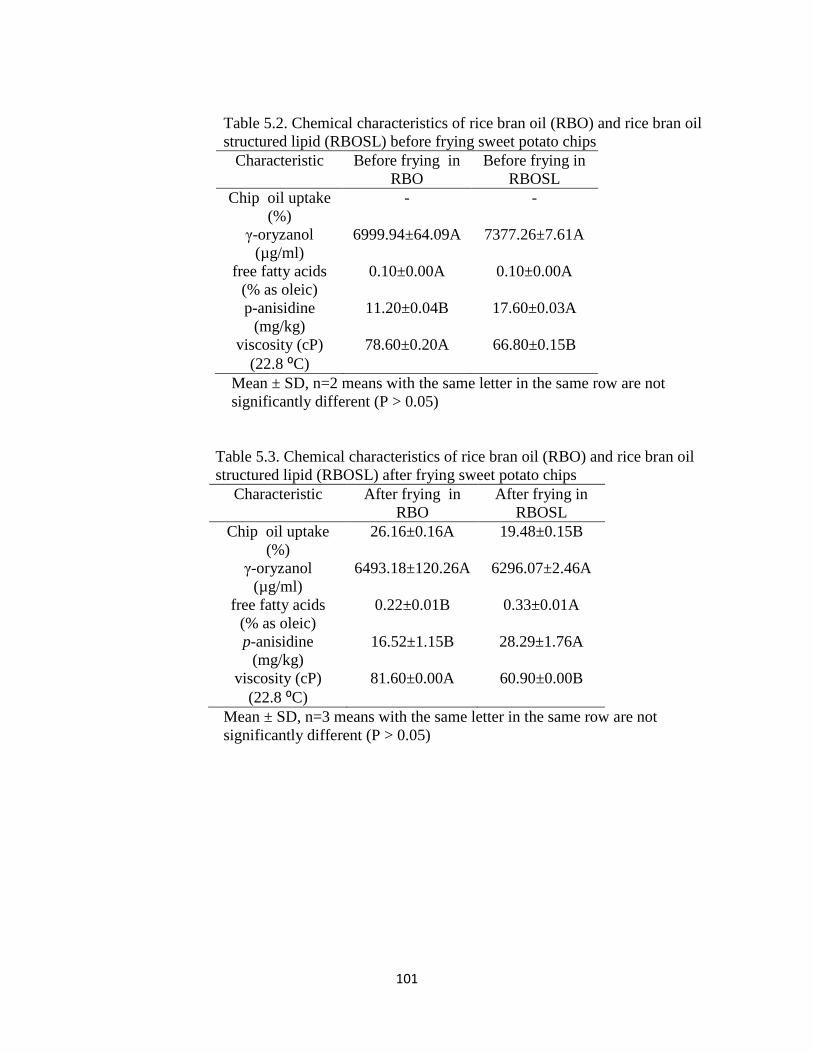
101
Table 5.2. Chemical characteristics of rice bran oil (RBO) and rice bran oil
structured lipid (RBOSL) before frying sweet potato chips
Characteristic Before frying in
RBO
Before frying in
RBOSL
Chip oil uptake
(%)
- -
γ-oryzanol
(µg/ml)
6999.94±64.09A 7377.26±7.61A
free fatty acids
(% as oleic)
0.10±0.00A 0.10±0.00A
p-anisidine
(mg/kg)
11.20±0.04B 17.60±0.03A
viscosity (cP)
(22.8 ⁰C)
78.60±0.20A 66.80±0.15B
Mean ± SD, n=2 means with the same letter in the same row are not
significantly different (P > 0.05)
Table 5.3. Chemical characteristics of rice bran oil (RBO) and rice bran oil
structured lipid (RBOSL) after frying sweet potato chips
Characteristic After frying in
RBO
After frying in
RBOSL
Chip oil uptake
(%)
26.16±0.16A 19.48±0.15B
γ-oryzanol
(µg/ml)
6493.18±120.26A 6296.07±2.46A
free fatty acids
(% as oleic)
0.22±0.01B 0.33±0.01A
p-anisidine
(mg/kg)
16.52±1.15B
28.29±1.76A
viscosity (cP)
(22.8 ⁰C)
81.60±0.00A 60.90±0.00B
Mean ± SD, n=3 means with the same letter in the same row are not
significantly different (P > 0.05)
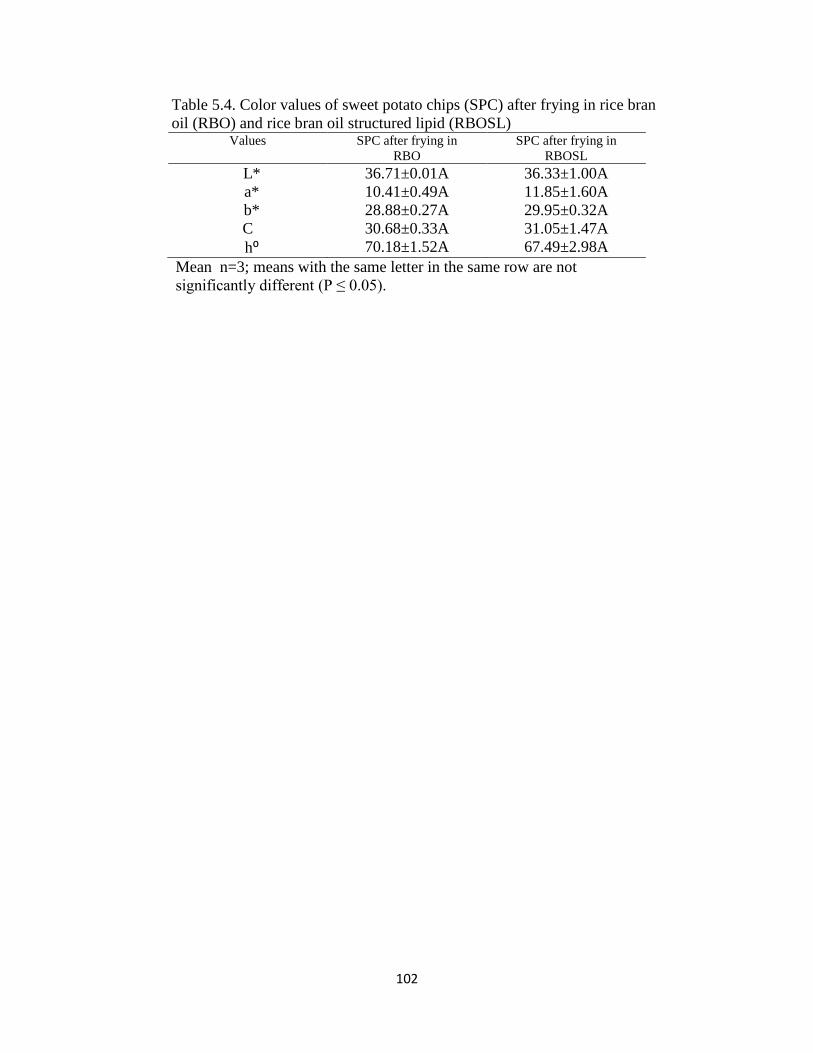
102
Table 5.4. Color values of sweet potato chips (SPC) after frying in rice bran
oil (RBO) and rice bran oil structured lipid (RBOSL) Values SPC after frying in
RBO
SPC after frying in
RBOSL
L* 36.71±0.01A 36.33±1.00A
a* 10.41±0.49A 11.85±1.60A
b* 28.88±0.27A 29.95±0.32A
C 30.68±0.33A 31.05±1.47A
h⁰ 70.18±1.52A 67.49±2.98A
Mean n=3; means with the same letter in the same row are not
significantly different (P ≤ 0.05).
103
FIG. 5.1. PLOT OF WILLINGNESS TO PURCHASE CONSUMER ACCEPTANCE PANEL
FOR SWEET POTATO CHIPS FRIED IN RICE BRAN OIL STRUCTURED LIPID
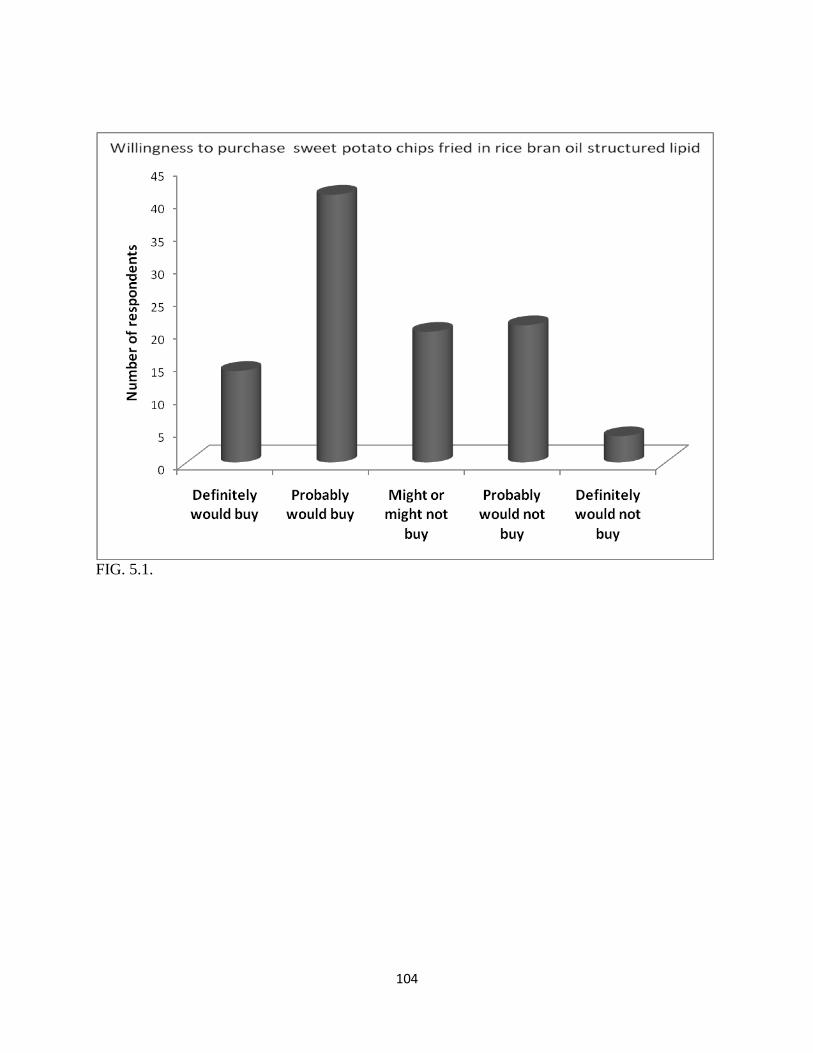
104
FIG. 5.1.
105
FIG. 5.2. PLOT OF WILLINGNESS TO PURCHASE CONSUMER ACCEPTANCE PANEL
FOR ENERGY BAR FORMULATED WITH RICE BRAN OIL STRUCTURED LIPID
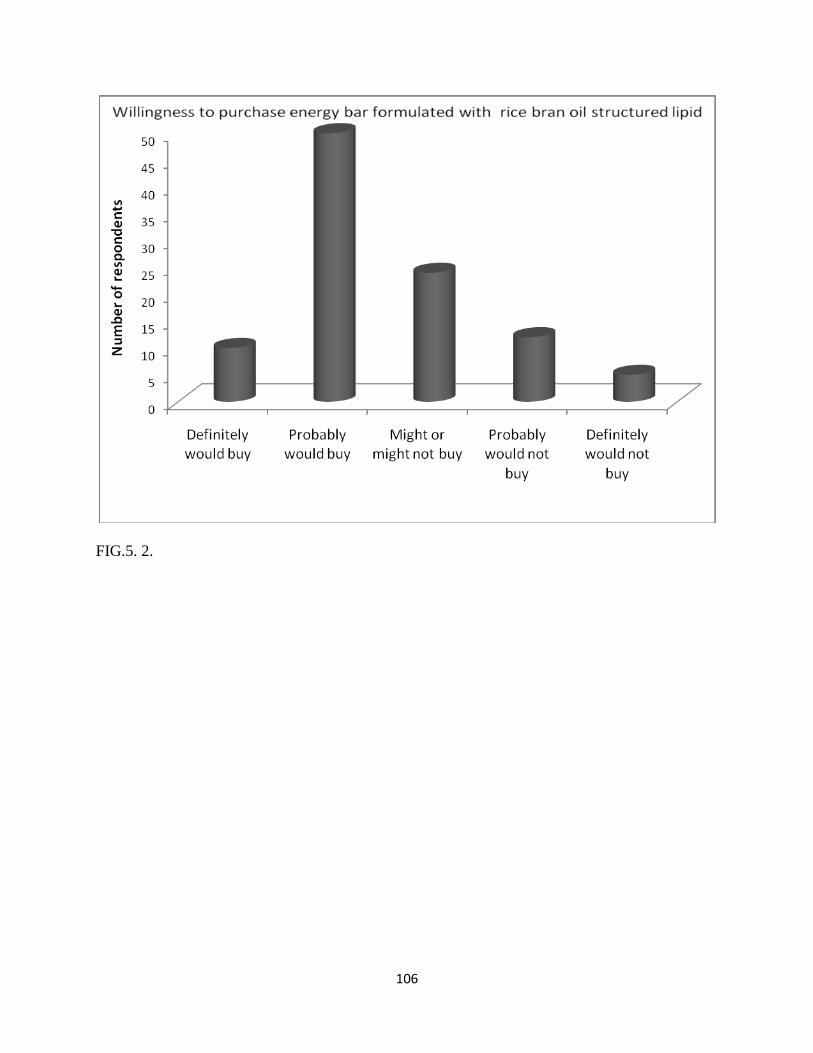
106
FIG.5. 2.
107
CHAPER 6
TRANS-FREE PLASTIC SHORTENINGS PREPARED WITH PALM STEARIN AND RICE
BRAN OIL STRUCTURED LIPID
Jennings BH, Akoh CC submitted to the Journal of the American Oil Chemists’ Society
108
Abstract Rice bran oil structured lipid (RBOSL) was produced from rice bran oil (RBO) and
the medium chain fatty acid (MCFA), caprylic acid, with Lipozyme RM IM as biocatalyst.
RBOSL and RBO were mixed with palm stearin (PS) in ratios of 30:70, 40:60, 50:50, 60:40 and
70:30, v/v (RBOSL to PS) to formulate trans-free shortenings. Fatty acid profiles, solid fat
contents (SFC), melting and crystallization curves, and crystal morphology were determined.
The content of caprylic acid in RBOSL ranged from 9.92 to 22.14 mol%. Shortening blends
containing 30:70 and 60:40 RBOSL or RBO and PS had fatty acid profiles similar to a
commercial shortening (CS). SFCs for most blends were within the desired range for CS of 10-
50% at 10-40 ⁰C. Shortening blends containing higher amounts of RBOSL or RBO had melting
and crystallization curves similar to CS. All shortening blends contained primarily β' crystals.
RBOSL blended with PS was comparable to RBO in producing shortenings with fatty acid
profiles, SFC, melting and crystallization profiles, and crystal morphologies that were similar.
RBOSL blended with PS can possibly provide healthier alternative to some oils currently
blended with PS and commercial shortening to produce trans-free shortening because of the
health benefits of the MCFA in RBOSL.
Keywords Palm stearin ∙ Rice bran oil ∙ Shortening ∙ Solid fat content ∙ Structured lipid
109
Introduction
Shortening provides desirable textural properties by lubricating, weakening, or shortening food
components. Shortening used in frying allows uniform heat transfer and forms a moisture
barrier. Other desirable functions of shortening in food include, imparting tenderness and mouth
feel, providing structural integrity, incorporation of air, and extending shelf life [1].
Shortening is produced from hydrogenated vegetable oils. The hydrogenation process
produces trans fatty acids, which when consumed can increase the risk for coronary heart disease
[2]. Fractionation and blending of palm oil with RBO and mahua oil [3], with palm stearin (PS)
and RBO [4] has resulted in trans-free shortenings. Interesterification of RBO and PS has also
produced trans-free shortenings [5, 6]. Another alternative to blending palm oil fractions with
vegetable oil is to blend palm oil fractions with a structured lipid (SL).
Palm oil is high in palmitic, oleic, and linoleic acids and has a higher polyunsaturated
fatty acid (PUFA) content than coconut and palm kernel oils. Palm oil is extracted from the
mesocarp of the oil palm (Elaeis guineensis) fruit, is economical to produce and can be
fractionated into liquid fraction (palm olein) and solid fraction (PS). The high oxidative stability
of palm oil is due to its high tocopherol content. The carotenoids and tocopherols present in palm
oil protect against certain cancers and lower serum cholesterol, respectively [7]. Palm oil does
not promote atherosclerosis and arterial thrombosis although it contains 50% saturated fatty acids
[7]. The solid fat content (SFC) of palm oil gives consistency without hydrogenation and can be
used in food products with variable plastic ranges [7].
A SL containing RBO and the medium chain fatty acid (MCFA), caprylic acid, would
have several health benefits and would contribute to the desirability of a shortening made by
blending palm stearin with RBOSL. RBO contains γ-oryzanol which can lower plasma
110
cholesterol [8], cholesterol absorption [9], and inhibit platelet aggregation [10]. The γ-oryzanol
concentration in RBO is not significantly affected by enzymatic modification to incorporate
caprylic acid with Lipozyme RM IM as biocatalyst [11]. MCFAs provide a quick energy source
that can be rapidly oxidized and utilized. MCFAs are metabolized through the portal system
instead of the lymphatic system for long chain fatty acids. MCFAs have been used to treat
patients with fat absorption abnormalities and by athletes with increased energy requirements
[12, 13]. Previous animal and human studies have shown that the composition of
triacylglycerols (TAGs) containing MCFA resulted in increased energy expenditure and
decreased weight gain [14, 15]. Blending of RBOSL with PS is an option for producing trans-
free shortening without hydrogenation and with the added health benefit of MCFA contained in
RBOSL.
The objectives of this study were: 1) to blend RBOSL or RBO with PS in various ratios
to produce shortenings, and 2) to determine the fatty acid profile, melting and crystallization
profile, SFC, and crystal morphology of the blended shortening and commercial shortenings
(CS).
Experimental Procedures
Materials
RBO was purchased from California Rice Oil Company (Novato, CA). Caprylic acid was
purchased from Sigma Chemical Co. (St. Louis, MO). Lipozyme RM IM (immobilized lipase on
a macoporous anion exchange resin) from Rhizomucor miehei was purchased from Novo
Nordisk Biochem North America, Inc. (Franklinton, NC). RBD PS was donated by Fuji
Vegetable Oil, Inc. (Savannah, GA). CS #1 (palm oil shortening) was purchased from Loders
111
Croklaan North America, LLC (Channahon, IL). CS #2 (hydrogenated vegetable oil shortening)
was purchased from a local grocery store.
Synthesis of Rice Bran Oil Structured Lipid
The SL was produced in 1 kg quantities in a packed-bed reactor with a flow rate of 1 mL/min,
1:6 substrate mole ratio (RBO: caprylic acid) and a temperature of 45 °C [11, 16]. A bioreactor
with a jacketed stainless steel column (47 mm x 500 mm) and a FMI Lab pump model QV from
Fluid Metering, Inc. (Oyster Bay, NY) was used for SL synthesis. The bioreactor set up was as
reported by Fomuso and Akoh [17]. A circulating water bath was used to maintain a constant
column temperature. The column was packed with immobilized Lipozyme RM IM and plugged
at both ends with approximately 3 cm of glass wool.
Short-Path Distillation
The SL reaction products were passed through a short-path distillation apparatus 4 times to
remove free fatty acids to a level below 0.1 %. A KDL-4 (UIC Inc., Joliet, IL) distillation unit
was used. The heating oil temperature was 185 °C, the coolant temperature was 15 °C, and the
vacuum pressure was below 1 Torr [17].
Determination of Shortening Fatty Acid Profiles
One hundred milligrams of the shortening sample was weighed into a culture tube and 1 mL of
internal standard (17:0 in hexane 20 mg/mL) was added to the culture tube and the mixture was
then flushed with nitrogen. Two milliliters of 0.5N NaOH in methanol solution was then added
and the samples were placed in an oven at 100 °C for 5 min. Two milliliters of 14% BF3 in
methanol was added and the reaction mixture was vortexed for 1 min and again placed in an
112
oven at 100 °C for 5 min. Two milliliters of hexane and 2 mL of saturated NaCl was then added
to extract the fatty acid methyl esters (FAMEs). The samples were then vortexed for 2 min and
centrifuged at 1000 rpm for 5 min at room temperature [18]. The upper layer was then removed
and analyzed by gas chromatography. The gas chromatograph was an Agilent 6890N
(Wilmington, PA) equipped with a Supelco (Bellefonte, PA) SP-2560 100 m x 0.25 mm x 0.20
µm film thickness column and a flame ionization detector operated in the split mode with a split
ratio of 50:1. The injector and detector temperatures were both at 250 °C. The column
temperature was at 140 °C. The carrier gas was helium and the flow rate was 1.1 mL/min. The
relative concentrations of FAMEs were calculated by computer with 17:0 as internal standard.
Retention times of GLC reference standard (Supelco 37, Bellefonte, PA) were used to identify
detected FAMEs.
Shortening Blend Preparation
PS was melted at 65 °C and was blended with RBOSL in ratios of (RBOSL or RBO to PS)
30:70, 40:60, 50:50, 60:40 and 70:30, v/v, to produce shortenings.
Differential Scanning Calorimetry
A Perkin-Elmer model DSC7 (Norwalk, CT) was used for the analysis of melting profiles
according to AOCS recommended procedure Cj 1-94 [19]. Indium was used as a reference
standard and for standardization (mp 156.6 °C, ∆H 28.45 J/g); dry ice was used as a coolant.
The 5-20 mg sample was hermetically sealed in 30 µL capacity aluminum pan (Perkin Elmer);
an empty pan was used for reference. Samples were heated rapidly from room temperature to 80
°C and held for 10 min (to destroy crystal memory). The sample was then cooled to - 40 at 10
°C per min, held for 30 min, and then heated to 80 °C at a rate of 5 °C per min to generate
113
melting profiles. The thermograms were analyzed by the software provided with the DSC (Pyris
software, Perkin-Elmer, Shelton, CT).
Solid Fat Content
SFC was determined for shortening containing unmodified RBO blended with PS, and
shortenings containing RBOSL blended with PS and CS by AOCS Official method Cd 16-81
[19]. NMR measurements were made using a MARAN-20 pulsed NMR spectrometer
(Resonance Instruments Ltd., Oxon, United Kingdom). Samples were tempered at 100 °C for 15
min and placed at 60 °C for 10 min followed by 0 °C for 60 min and finally 30 min at each
chosen measuring temperature. Olive oil was used as the reference oil. The SFC was measured
at 5 °C intervals from 5 to 60 °C.
X-Ray Diffraction Spectroscopy
The polymorphic forms of shortening containing RBOSL blended with PS, shortening containing
unmodified RBO blended with PS, and CS were determined to characterize and differentiate the
crystal structures among the shortenings. Samples were kept at 24 °C and spread over a glass X-
Ray slide. A Rigaku Multiflex (Rigaku Corporation, Tokyo, Japan) automated theta-theta
powder X-Ray diffractometer with a copper X-Ray tube was used for the analysis. The
generation power was 40 kV and 44 mA. The X-Ray analysis was performed at room
temperature from 0.9° to 25° at a scan speed of 1°/min and a step of 0.02. MIDI Jade 6.5
software was used for data analysis.
114
Results and Discussion
Fatty Acid Composition
Table 6.1 shows the fatty acid profiles of shortening blends, CS, PS, RBO and RBOSL. Only
CS #2 contained trans fatty acids (11.42 mol%). The major fatty acids for the shortening blends,
commercial shortening and palm stearin were palmitic acid (14.07-58.75 mol%), oleic (25.52-
38.20 mol%) and linoleic acids (7.10-30.03 mol%). Caprylic acid contents in blends containing
RBOSL and PS ranged from 9.92 to 22.14 mol%. CS#2 and PS contained 0.42 and 1.55 mol%
caprylic acid, respectively.
The saturated fatty acid content for blends containing RBO and PS ranged from 35.31-
53.44 mol% and blends containing RBOSL and PS had saturated fatty acid contents of 48.38-
59.70 mol%. Commercial shortenings had saturated fatty acid contents of 51.44 and 27.61 mol%
for CS#1 and #2, respectively, and PS saturated fatty acid content was 67.01 mol%. RBO and
RBOSL saturated fatty acid contents were 22.80 and 41.00 mol%, respectively. Overall,
palmitic acid content decreased in PS after blending with RBO and RBOSL. Myristic, palmitic
and stearic acid contents for blends containing 30:70 RBO or RBOSL were similar to those of
CS#1. A previous study [4] reported that a 50:50 blend of RBO:PS had a saturated and
unsaturated fatty acid contents of 41.00 and 53.20%, respectively. Our findings showed 44.06
mol% saturated fat and 55.94 mol% unsaturated fat for the 50:50 RBO:PS blend. The 50:50
RBOSL:PS blend contained 53.46 mol% saturated fat and 46.71 mol% unsaturated fat. The
70:30 RBOSL:PS blend had very similar and almost balanced saturated and unsaturated fatty
acid contents of 48.38 and 51.68 mol%, respectively.
PS is highly saturated and provides natural hardness to fats, but this texture does not
provide a suitable plastic range to edible fats such as margarine and shortening. Vegetable oils
115
such as RBO contain polyunsaturated fatty acids that are liquid at room temperature and when
blended with PS helps to improve the fat plastic range.
Solid Fat Content
Determination of SFC allows a description of the amounts of solid fat crystals in relation to the
amount of liquid oil from about 10-40 ⁰C, which gives a measure of plasticity [20] and
influences fat physical and sensory characteristics [21]. The plastic range of fat is the
temperature range over which the fat can be molded and is neither too hard nor too soft. The
70:30 shortening blends containing 70:30 RBO or RBOSL and PS exhibited solid fat contents
most similar to CS #1, which was a palm oil shortening (Fig. 6.1). The sharp decline in solid fat
content for CS #1 shows a more limited plastic range than all other shortening blends; CS # 2
exhibited a less steep decline in solid fat content. The solid fat contents shown at 40 ⁰C for the
shortening blends were very similar to those reported in a previous study [21] with blends of
sunflower oil and PS in nearly the same ratios (Fig. 6.1). A wider plastic range occurs when
there is a more diverse fatty acid content with variable melting points. High stability shortening
with a SFC of 10-50% at 10-40 ⁰C is most desired [22]. The SFC for most shortening blends
used in this study fell within this range, which indicates suitability for use in shortening
applications requiring various consistencies. As the amount of PS increased in the shortening
blends, the SFC also increased because of an increase in the saturated fatty acid content mainly
from the palmitic acid content of palm stearin. The rate at which a fat solidifies can affect some
bakery products such as pastries that must contain fats that become solid as the product cools to
prevent fat loss which results in an oily paste [23].
116
Melting and Crystallization Properties
The melting profiles show that peak 3 for blends containing RBO and PS blends are very similar
and only slightly higher than peak 3 for PS blends containing RBOSL (Fig. 6.2). As the content
of RBO or RBOSL liquid oil increased, the height of peak 3 decreased and melting profiles for
the blends became more similar to the CSs (Fig. 6.2). This change was due to the decrease in
high melting TAG concentration and an increase in low melting TAG concentration. Similar
findings were reported in a previous study of shortening blends containing PS and RBO [3, 4].
Peak 1a in the melting curve of the blends containing RBOSL is caprylic acid, which is distinctly
absent in the melting peaks containing RBO and different from CS and PS (Fig. 6.2). The
depressed area between peaks 1 and 2 (Fig. 6.2) is a recrystallization peak, which probably
occurred when the α polymorph transitioned to the β' form [24]. This recyrstallization peak
decreased as the amount of PS decreased.
Blends with RBOSL crystallized at slightly lower temperatures than blends containing
RBO (Fig. 6.3). The lower crystallization temperature was because of the lower viscosity of
RBOSL, which did not inhibit nucleation as much as the higher viscosity RBO [25]. As the
concentration of palm stearin decreased, the size of the crystallization peak also decreased and
the crystallization profiles became more similar to CS (Fig. 6.3).
Polymorphism
The three major polymorphic forms of fats consist of α, β and β' also referred to as hexagonal,
orthorhombic, and triclinic, respectively. Shortenings are composed of a solid phase consisting
of solid fat crystals and a liquid phase consisting of oil held together by cohesive forces [20]. Fat
crystal size, shape, number and bonding force determine fat characteristics such as hardness and
117
plastic behavior [26]. The β' crystals, which have a smaller thinner structure, can hold more air
and liquid component (an important functional quality of shortening) than larger, more stable,
higher melting point β crystals. By comparison, the α crystal form has the lowest melting point
and is the least stable of the polymorphs. The β' crystals provide a smother mouthfeel and are
more desirable than the β crystal forms providing increased firmness and air incorporation [27].
X-Ray diffraction spectroscopy analysis (XRD) produced d spacings at 4.20 and 3.80 Å
and at 4.15 Å. The peaks at 4.20 and 3.80 Å were much larger than those at 4.15 Å. The data
showed that all shortenings and shortening blends tested in this study contained primarily β'
crystals with β' > > α. These results demonstrate that RBOSL: PS blends form β' crystals as does
the RBO: PS blend. The β' crystal form is more stable in shortenings with higher palmitic acid
contents [28]. The PS used for this study contained 58.75 mol% palmitic acid and 30:70 and
40:60 blends containing RBO or RBOSL contained 39.58 - 47.49 mol% palmitic acid.
RBOSL blended with PS showed properties comparable to RBO:PS blends when the
fatty acid profiles, solid fat contents, melting and crystallization profiles, and crystal forms were
compared. Blending of RBOSL with PS is an option for producing trans-free shortening without
hydrogenation and with the added health benefit of MCFA contained in RBOSL.
Acknowledgements The authors wish to thank and acknowledge Dr. Alejandro Marangoni,
Matt Rietburg, and M. Fernanda Svaikauskas from the Department of Food Science, University
of Guelph, Guelph, Ontario, for conducting the XRD analysis.
118
References
1. Ghorta BS, Dyal SD, Narine SS (2002) Lipid Shortenings: A Review. Food Res Int 35:1015-
1048
2. Willet WC, Stampfer MJ, Manson JE, Cloditz GA, Speizer FE, Rosner BA, Sampson LA,
Hennekens CH (1993) Intake of Trans Fatty Acids and Risks of Coronary Heart Disease
Among Women. Lancet 341:581-583
3. Jeyarani T, Yella Reddy S (2003) Preparation of Plastic Fats with Zero Trans FA from Palm
Oil. J Am Oil Chem Soc 80:1107-1113
4. Mayamol PN, Samuel T, Balachandran C, Sundaresan A, Arumughan C (2004) Zero Trans
Shortening Using Palm Stearin and Rice Bran Oil. J Am Oil Chem Soc 81:407-413
5. Reshma MV, Saritha SS, Balachandran C, Arumughan, C (2008) Lipase Catalyzed
Interesterification of Palm Stearin and Rice Bran Oil Blends for Preparation of Zero Trans
Shortening with Bioactive Phytochemicals. Biores Tech 99:5011-5019
6. Mayamol PN, Balachandran C, Samuel T, Sundaresan A, Arumugham C (2009) Zero Trans
Shortening Using Rice Bran Oil, Palm Oil and Palm Stearin Through Interesterification at
Pilot Scale. Int J Food Sci Tech 44:18-28
7. Edem DO (2002) Palm Oil: Biochemical, Physiological, Nutritional, Hematological, and
Toxicological Aspects: A Review. Plant Food Hum Nutr 57: 319-341
8. Rukmini C, Raghuram TC (1991) Nutritional and Biochemical Aspects of the Hypolipidemic
Action of Rice Bran Oil: A Review. J Am Coll Nutr 10:593-601
9. Seetharamaiah GS, Chandrasekhara N (1990) Effect of Oryzanol on Cholesterol Absorption
& Biliary & Fecal Bile Acids in Rats. Ind J Med Res 92:471-475
119
10. Seetharamaiah GS, Krishnakantha TP, Chandrasekhara N (1990) Influence of Oryzanol on
Platelet Aggregation in Rats. J Nutri Sci Vitaminol 36: 291-297
11. Jennings BH, Akoh CC (2009) Effectiveness of Natural Versus Synthetic Antioxidants in a
Rice Bran Oil-Based Structured Lipid. Food Chem 114:1456-1461
12. Kennedy JP (1991) Structured Lipids: Fats of the Future. Food Technol 45:76-83
13. Megremis CJ (1991) Medium-Chain Triglycerides: A Nonconventional Fat. Food Technol
45:108-114
14. St-Onge MP, Jones PJH (2002) Physiological Effects of Medium-Chain Triglycerides:
Potential Agents in the Prevention of Obesity. J Nutr 132: 329-332
15. St-Onge MP, Ross R, Pearsons WD, Jones PJH (2003) Medium-Chain Triglycerides
Increase Energy Expenditure and Decrease Adiposity in Overweight Men. Obesity Res 11:
395-402
16. Kim BH, Akoh CC (2006) Characteristics of Structured Lipid Prepared by Lipase-Catalyzed
Acidolysis of Roasted Sesame Oil and Caprylic Acid in a Bench-Scale Continuous Packed-
Bed Reactor. J Agric Food Chem 54:5132-5141
17. Fomuso LB, Akoh CC (2002) Lipase-Catalyzed Acidolysis of Olive Oil and Caprylic Acid
in a Bench-Scale Packed-Bed Bioreactor. Food Res Int 35:15-21
18. AOAC (1998) Official Methods of Analysis AOAC International. 16th Ed. Association of
Official Analytical Chemists, Arlington, Method 996.01, Section E
19. AOCS (1998) Official Methods and Recommended Practices of the American Oil
Chemists’ Society. AOCS, Champaign, Method Cj 1-94, Cd 16-81
120
20. Johnson LA (2008) Recovery, Refining, Converting, and Stabilizing Edible Fats and Oils.
In: Akoh CC, Min DB (eds) Food Lipids Chemistry, Nutrition and Biotechnology. 3rd edn.
CRC Press, Boca Raton, pp 205-244
21. Lai OM, Ghazali HM, Let CC (1999) Use of Enzymatic Transesterified Palm Stearin-
Sunflower Oil Blends in Preparation of Table Margerine Formulation. Food Chem 64:83-88
22. Metzroth DJ (1996) Shortening: Science and Technology: In: Hui YH (ed) Bailey’s
Industrial Oil and Fat Products. Interscience Publishers, New York, p 119
23. Podmore J (2002) Bakery Fats. In Rajah KK (ed) Fats in Food Technology. Sheffield
Academic Press, Sheffield pp 30-68
24. Litwinenko JW, Rojas AM, Gerschsenson, LN, Marangoni AG (2002) Relationship
Between Crystallization Behavior, Microstructure, and Mechanical Properties in a Palm Oil-
Based Shortening. J Am Oil Chem Soc 79:647-654
25. Humphrey KL, Moquin PHL, Narine SS (2003) Phase Behavior of a Binary Lipid
Shortening System: From Molecules to Rheology. J Am Oil Chem Soc 80: 1175-1182
26. Shukla VKS (2005) Margerine and Baking Fats. In Akoh CC, Ming OM (eds) Healthful
Lipids. AOCS Press, Champaign
27. Bell A, Gordon MH, Jirasubkunakorn W, Smith KW (2007) Effects of Composition on
Fat Rheology and Crystallization. Food Chem 101:799-805
28. Chawla P, deMan JM (1994) Effect of Temperature Cycling on Crystalline Form, Size and
Textural Properties of Shortening Fats. J Texture Stud 25:151-162
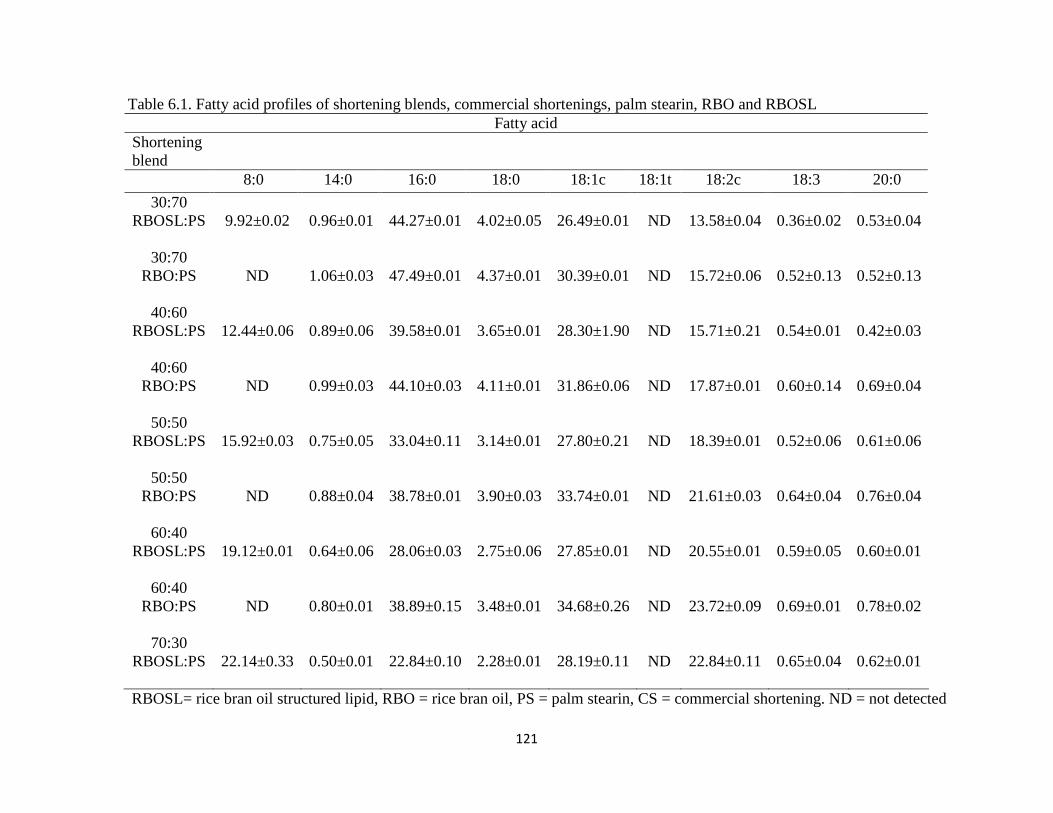
121
Table 6.1. Fatty acid profiles of shortening blends, commercial shortenings, palm stearin, RBO and RBOSL
Fatty acid
Shortening
blend
8:0 14:0 16:0 18:0 18:1c 18:1t 18:2c 18:3 20:0
30:70
RBOSL:PS
9.92±0.02 0.96±0.01 44.27±0.01 4.02±0.05 26.49±0.01 ND 13.58±0.04 0.36±0.02 0.53±0.04
30:70
RBO:PS
ND 1.06±0.03 47.49±0.01 4.37±0.01 30.39±0.01 ND 15.72±0.06 0.52±0.13 0.52±0.13
40:60
RBOSL:PS
12.44±0.06 0.89±0.06 39.58±0.01 3.65±0.01 28.30±1.90 ND 15.71±0.21 0.54±0.01 0.42±0.03
40:60
RBO:PS
ND 0.99±0.03 44.10±0.03 4.11±0.01 31.86±0.06 ND 17.87±0.01 0.60±0.14 0.69±0.04
50:50
RBOSL:PS
15.92±0.03 0.75±0.05 33.04±0.11 3.14±0.01 27.80±0.21 ND 18.39±0.01 0.52±0.06 0.61±0.06
50:50
RBO:PS
ND 0.88±0.04 38.78±0.01 3.90±0.03 33.74±0.01 ND 21.61±0.03 0.64±0.04 0.76±0.04
60:40
RBOSL:PS
19.12±0.01 0.64±0.06 28.06±0.03 2.75±0.06 27.85±0.01 ND 20.55±0.01 0.59±0.05 0.60±0.01
60:40
RBO:PS
ND 0.80±0.01 38.89±0.15 3.48±0.01 34.68±0.26 ND 23.72±0.09 0.69±0.01 0.78±0.02
70:30
RBOSL:PS
22.14±0.33 0.50±0.01 22.84±0.10 2.28±0.01 28.19±0.11 ND 22.84±0.11 0.65±0.04 0.62±0.01
RBOSL= rice bran oil structured lipid, RBO = rice bran oil, PS = palm stearin, CS = commercial shortening. ND = not detected
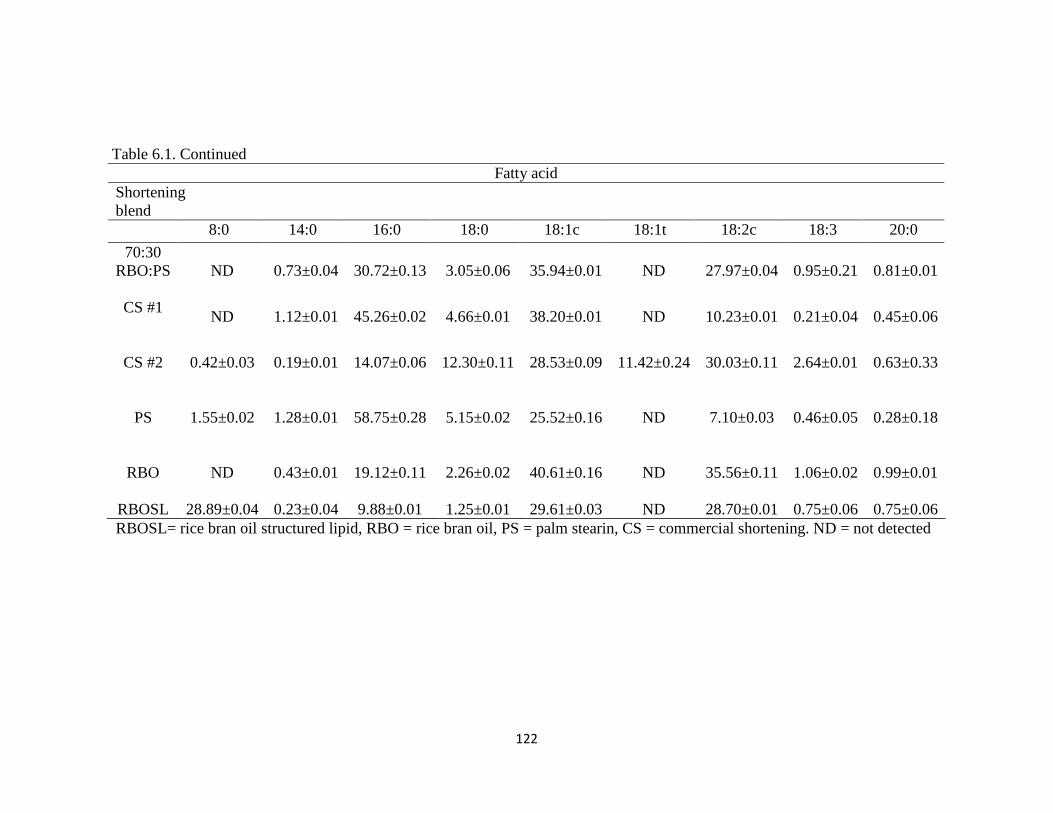
122
Table 6.1. Continued
Fatty acid
Shortening
blend
8:0 14:0 16:0 18:0 18:1c 18:1t 18:2c 18:3 20:0
70:30
RBO:PS
ND 0.73±0.04 30.72±0.13 3.05±0.06 35.94±0.01 ND 27.97±0.04 0.95±0.21 0.81±0.01
CS #1
ND 1.12±0.01 45.26±0.02 4.66±0.01 38.20±0.01 ND 10.23±0.01 0.21±0.04 0.45±0.06
CS #2
0.42±0.03 0.19±0.01 14.07±0.06 12.30±0.11 28.53±0.09 11.42±0.24 30.03±0.11 2.64±0.01 0.63±0.33
PS
1.55±0.02 1.28±0.01 58.75±0.28 5.15±0.02 25.52±0.16 ND 7.10±0.03 0.46±0.05 0.28±0.18
RBO
ND 0.43±0.01 19.12±0.11 2.26±0.02 40.61±0.16 ND 35.56±0.11 1.06±0.02 0.99±0.01
RBOSL 28.89±0.04 0.23±0.04 9.88±0.01 1.25±0.01 29.61±0.03 ND 28.70±0.01 0.75±0.06 0.75±0.06
RBOSL= rice bran oil structured lipid, RBO = rice bran oil, PS = palm stearin, CS = commercial shortening. ND = not detected
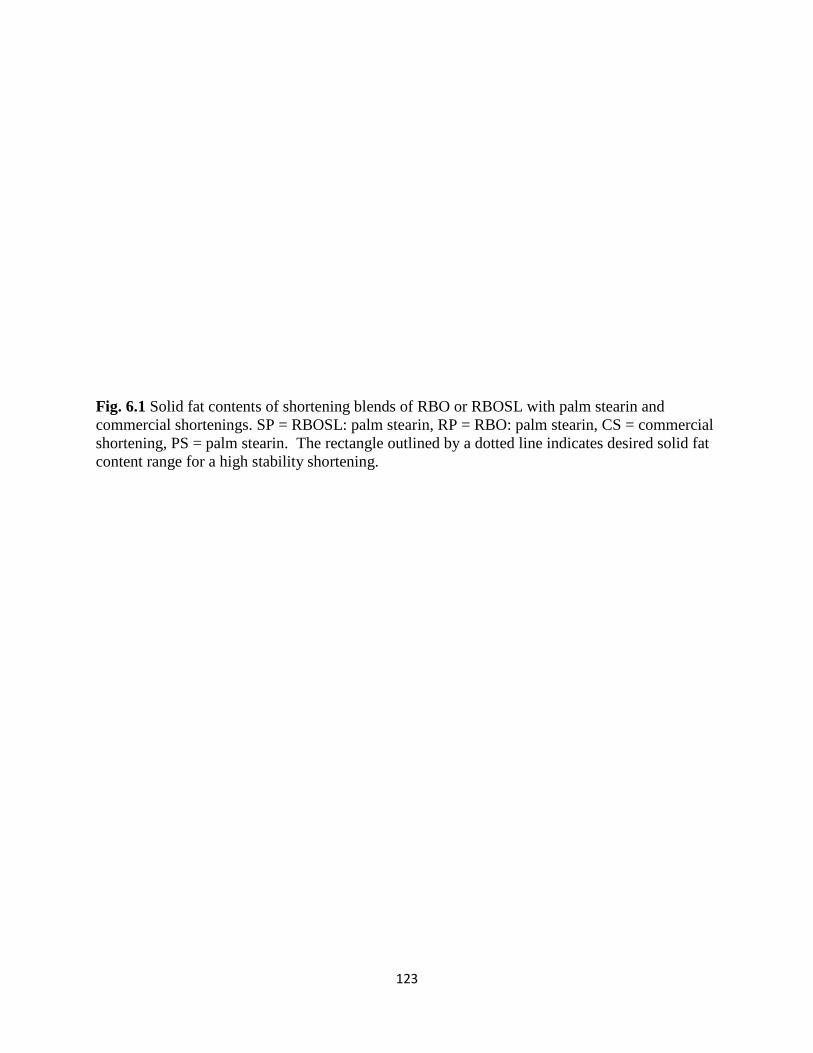
123
Fig. 6.1 Solid fat contents of shortening blends of RBO or RBOSL with palm stearin and
commercial shortenings. SP = RBOSL: palm stearin, RP = RBO: palm stearin, CS = commercial
shortening, PS = palm stearin. The rectangle outlined by a dotted line indicates desired solid fat
content range for a high stability shortening.
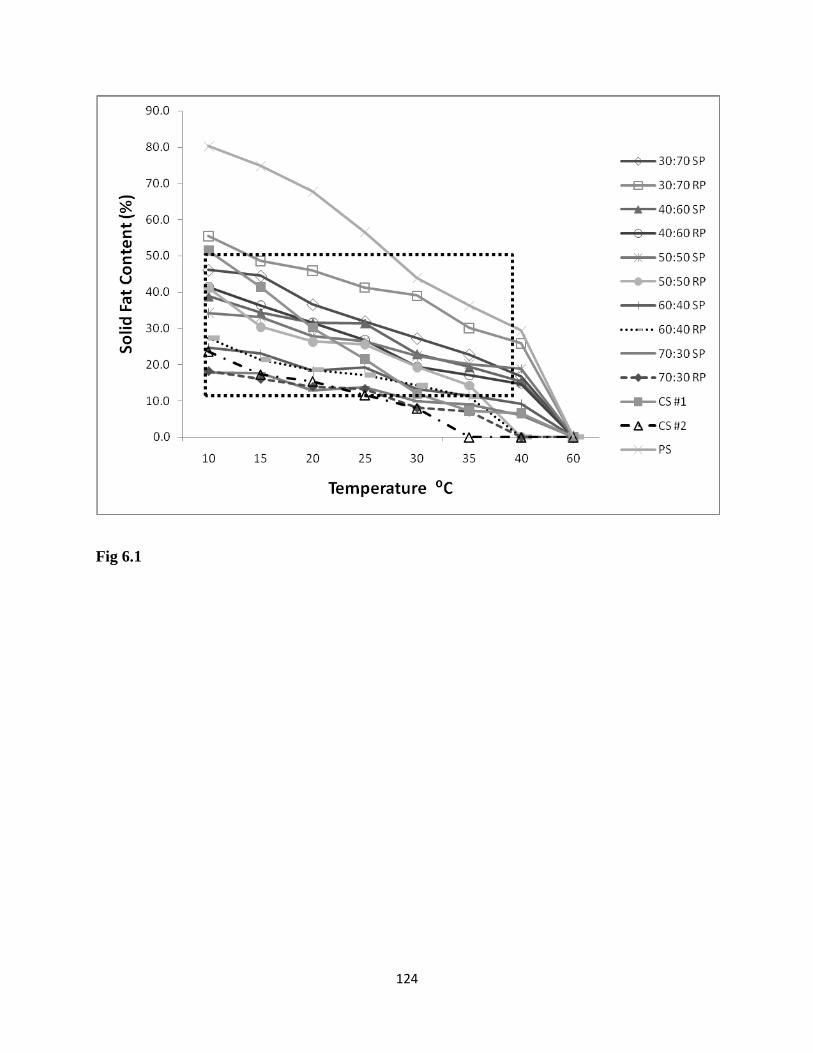
124
Fig 6.1
125
Fig 6.2 Melting profiles of shortening blends of rice bran oil (RBO) or rice bran oil structured
lipid (RBOSL) with palm stearin (PS) and commercial shortenings (CS).
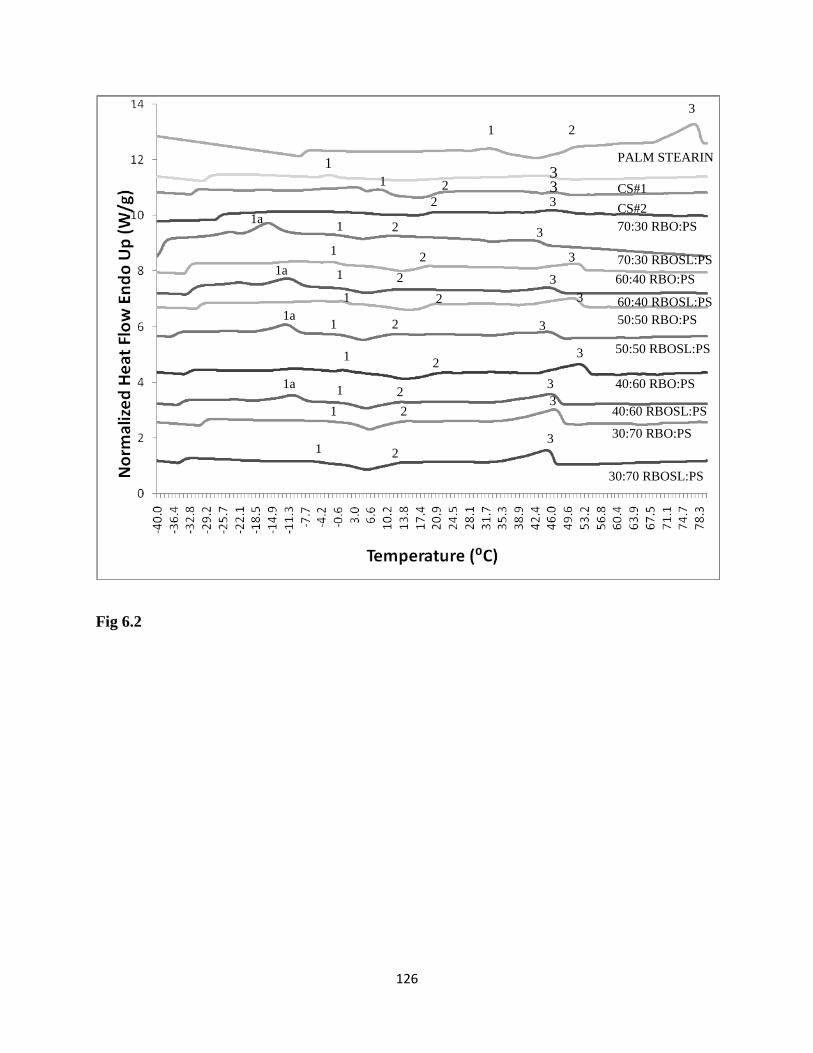
126
Fig 6.2
PALM STEARIN
CS#1
CS#2
70:30 RBOSL:PS
70:30 RBO:PS
60:40 RBO:PS
60:40 RBOSL:PS
50:50 RBO:PS
50:50 RBOSL:PS
40:60 RBO:PS
40:60 RBOSL:PS
30:70 RBO:PS
1a
1
1
1
1
1
1
1
1
1 2
30:70 RBOSL:PS
3
2 3
1a 2
3
2 3
1a 2
3
3
3
2
1a 2
3
2
2 3
2 3 3 2 1 3
1
1 2
3
127
Fig 6.3 Crystallization profiles of shortening blends of rice bran oil (RBO) or rice bran oil
structured lipid (RBOSL) with palm stearin (PS) and commercial shortenings (CS)
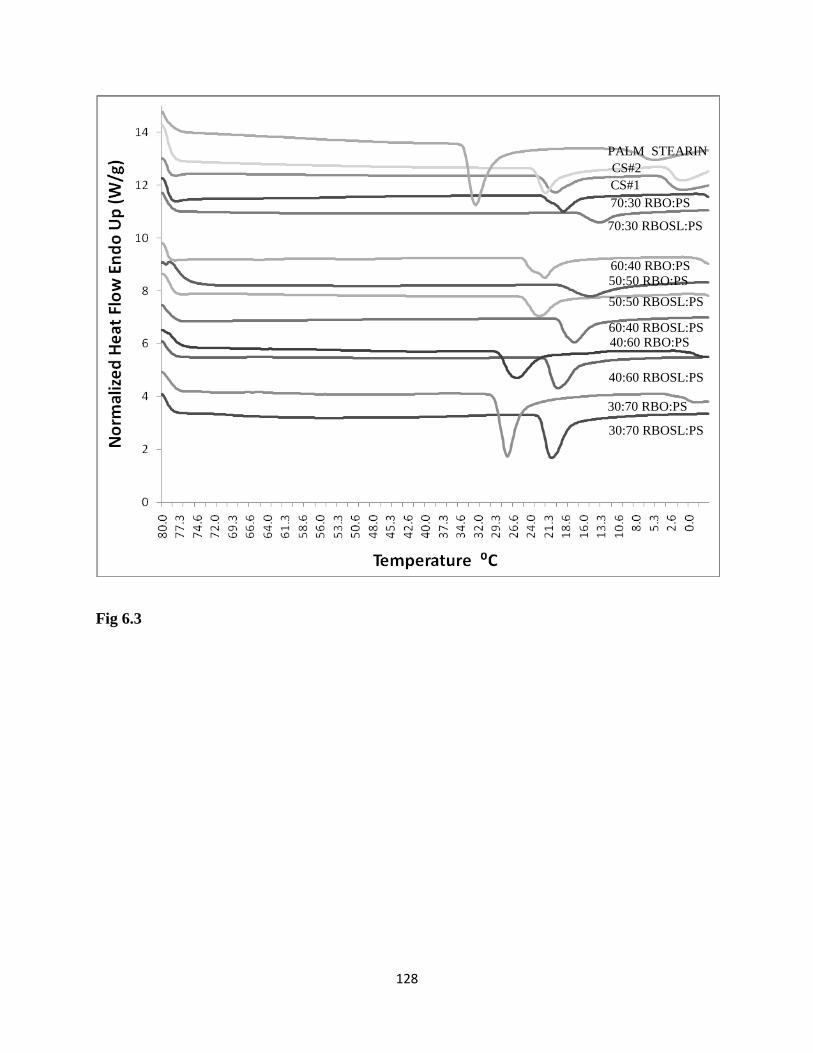
128
Fig 6.3
PALM STEARIN
CS#2
CS#1
70:30 RBO:PS
70:30 RBOSL:PS
60:40 RBO:PS
60:40 RBOSL:PS 40:60 RBO:PS
30:70 RBO:PS
50:50 RBO:PS
50:50 RBOSL:PS
40:60 RBOSL:PS
30:70 RBOSL:PS
129
CHAPTER 7
CONCLUSIONS
Rice bran oil was enzymatically modified to contain caprylic acid. The vitamin E content
was significantly lower in RBOSL than in unmodified RBO because of the removal of
tocopherols during short-path distillation. Differences in γ-oryzanol concentration before and
after enzymatic modification were not significant. OSI values for CA and CA/RE were not
significantly different from TBHQ. Peroxide values for CA and CA/RE were significantly lower
than RBOSL without added antioxidant but not statistically different from TBHQ at days 9, 15,
and 18. Mean p-anisidine values for CA 500 ppm on days 6, 9, 12 and 15 were significantly
lower than RBOSL without added antioxidant and were comparable to TBHQ 500 ppm. The
natural antioxidants, CA and CA/RE, were therefore shown to be as effective as TBHQ in
increasing the oxidative stability of RBOSL. The effectiveness of combinations of natural and
synthetic antioxidants such as CA/TBHQ is also notable and can provide an alternative that will
allow for lower amounts of synthetic antioxidants to be used. The possible carcinogenic effect of
synthetic antioxidant TBHQ and consumer demand for natural healthier products make natural
antioxidants more desirable. Natural antioxidants are more accepted by consumers and health
officials, can be labeled as flavorings, and may have positive effects on sensory properties. Our
results indicate that natural antioxidants are viable alternatives to the synthetic antioxidant
TBHQ for increasing the oxidative stability of a rice bran oil-based structured lipid.
Chemical and physical characteristics of a structured lipid containing rice bran oil and
caprylic acid were determined. The differences in the chemical and physical properties of
RBOSL were significantly different from those of RBO in most assays performed. This
130
characterization study can aid in determining future food applications of RBOSL. RBOSL may
offer health benefits in addition to the health benefits of unmodified RBO.
The fatty acid profile of RBO compared to RBOSL after frying was almost unchanged.
The color of sweet potato chips after frying in RBOSL was not significantly different from those
fried in RBO. γ-Oryzanol concentration of RBOSL after frying was not significantly different
from RBO. Free fatty acid content and p-anisidine values were significantly higher in RBOSL
than RBO after frying. Oil uptake was significantly lower in RBOSL than in RBO. Results of
triangle tests indicated that there was no significant difference in sweet potato chips but a
significant difference in energy bars prepared with RBOSL compared to RBO. Consumer
panels indicated a willingness to purchase both sweet potato chips and energy bars but greater
standardization and changes in formulation may improve acceptability. These consumer panel
results were very encouraging and indicate that products prepared with SLs with improved
nutritional or health promoting properties may have viable commercial potential.
RBOSL blended with PS showed properties comparable to RBO:PS blends when the
fatty acid profiles, solid fat content, melting and crystallization profiles and crystal forms were
compared. Blending of RBOSL with PS is an option for producing trans-free shortening without
hydrogenation and with the added health benefit of MCFA contained in RBOSL.