Overview of Models - NRC: Home Page · 2017-12-06 · Overview of Models Summary & Validation...
24
Overview of Models Summary & Validation Efforts xLPR External Review Board Meeting October 29, 2014
Transcript of Overview of Models - NRC: Home Page · 2017-12-06 · Overview of Models Summary & Validation...
Overview of Models
Summary & Validation Efforts
xLPR External Review Board MeetingOctober 29, 2014
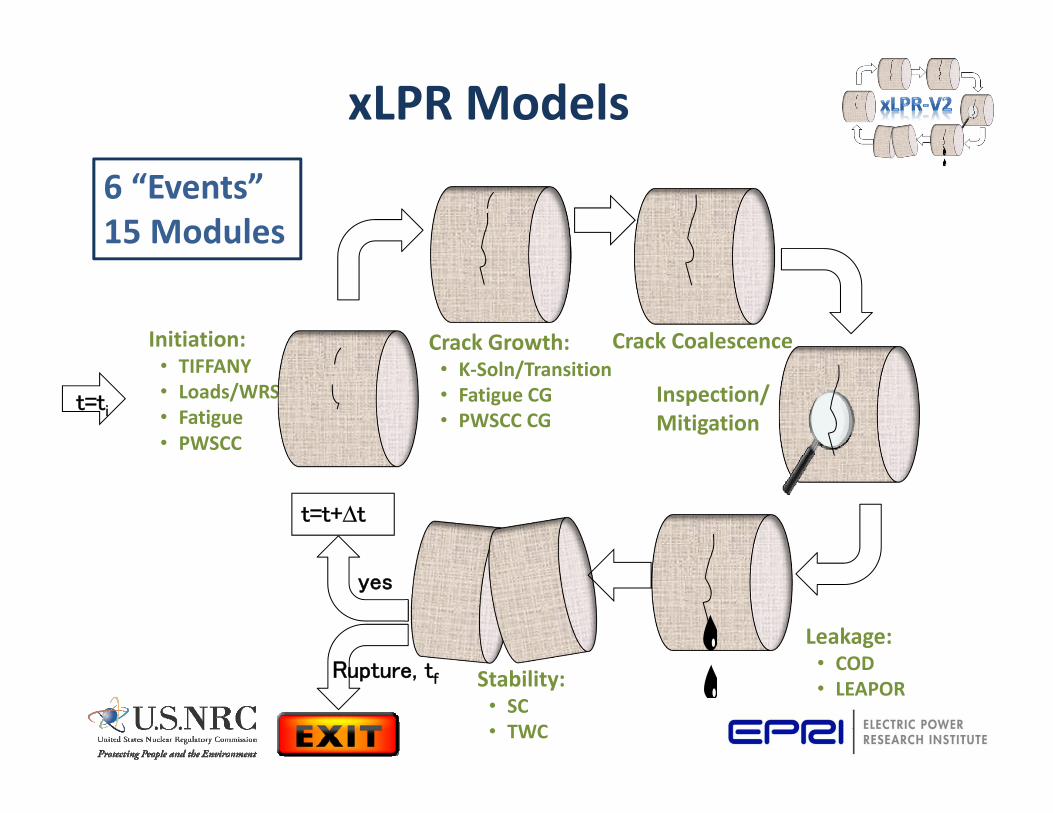
xLPR Models
Initiation:• TIFFANY• Loads/WRS• Fatigue • PWSCC
Crack Coalescence
t=ti
t=t+Δt
yes
Inspection/Mitigation
Crack Growth:• K-Soln/Transition• Fatigue CG• PWSCC CG
Stability:• SC• TWC
Leakage:• COD• LEAPOR
Rupture, tf
6 “Events”15 Modules
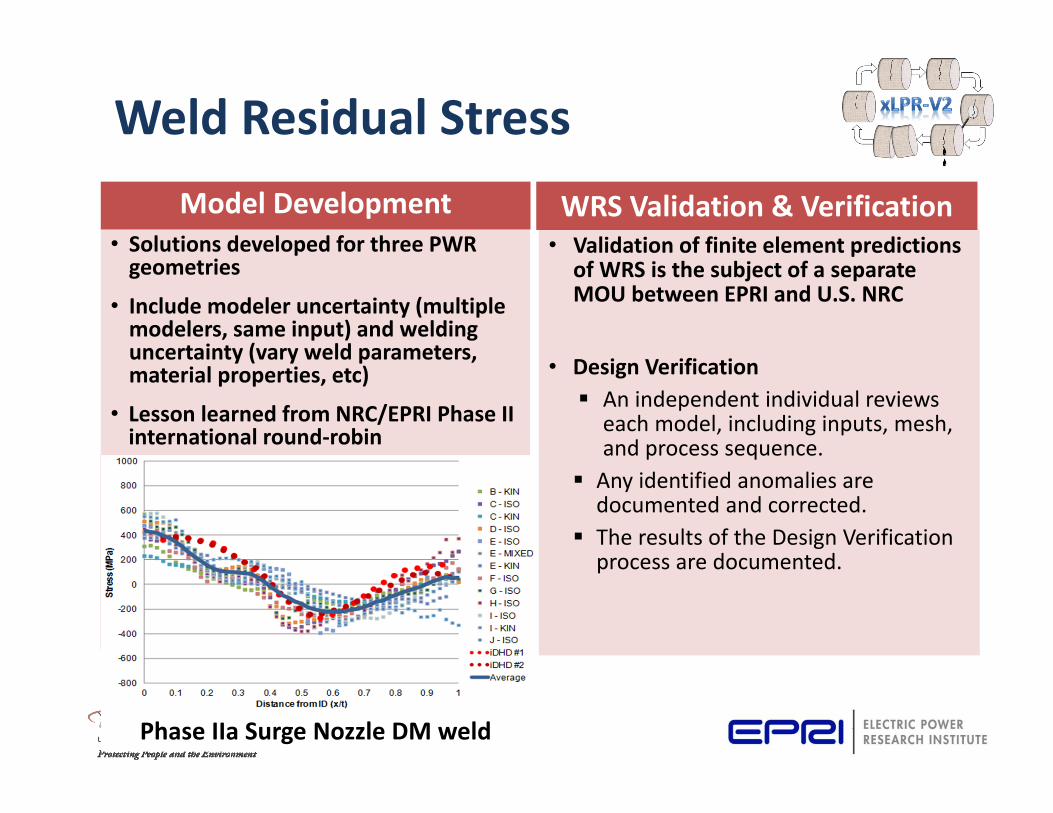
Weld Residual Stress
• Solutions developed for three PWR geometries
• Include modeler uncertainty (multiple modelers, same input) and welding uncertainty (vary weld parameters, material properties, etc)
• Lesson learned from NRC/EPRI Phase II international round-robin
• Validation of finite element predictions of WRS is the subject of a separate MOU between EPRI and U.S. NRC
• Design Verification An independent individual reviews
each model, including inputs, mesh, and process sequence.
Any identified anomalies are documented and corrected.
The results of the Design Verification process are documented.
Phase IIa Surge Nozzle DM weld
Model Development WRS Validation & Verification
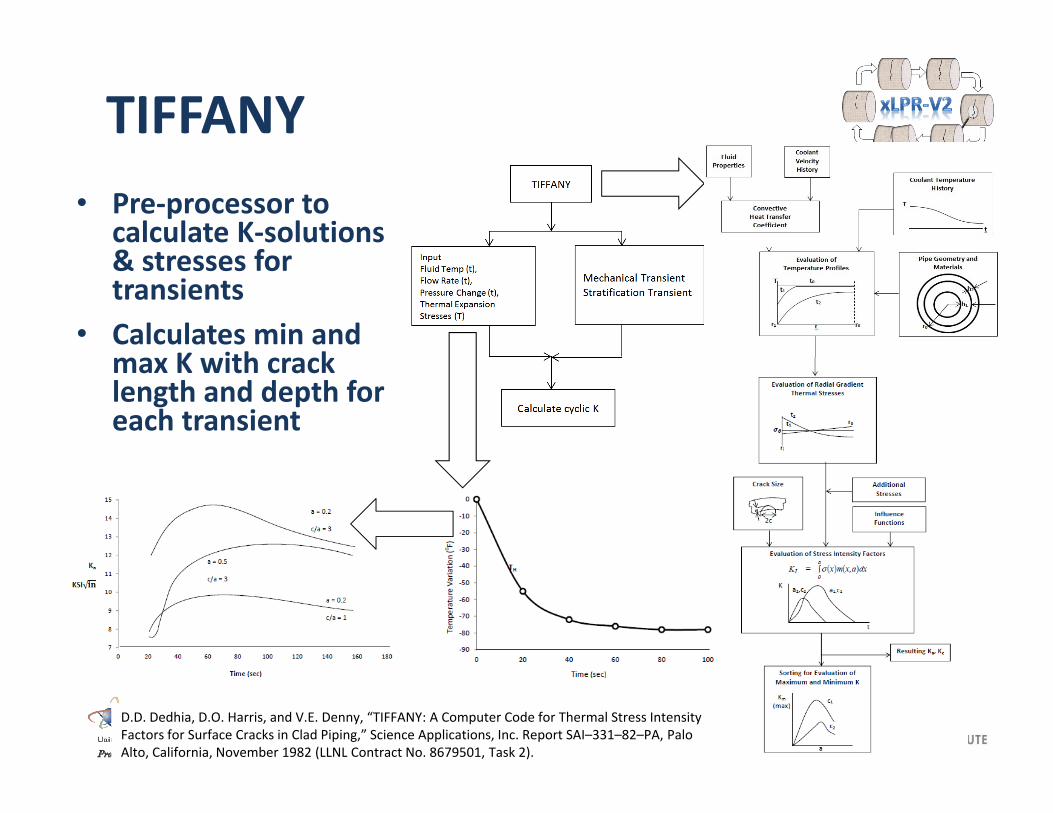
TIFFANY• Pre-processor to
calculate K-solutions & stresses for transients
• Calculates min and max K with crack length and depth for each transient
D.D. Dedhia, D.O. Harris, and V.E. Denny, “TIFFANY: A Computer Code for Thermal Stress Intensity Factors for Surface Cracks in Clad Piping,” Science Applications, Inc. Report SAI–331–82–PA, Palo Alto, California, November 1982 (LLNL Contract No. 8679501, Task 2).
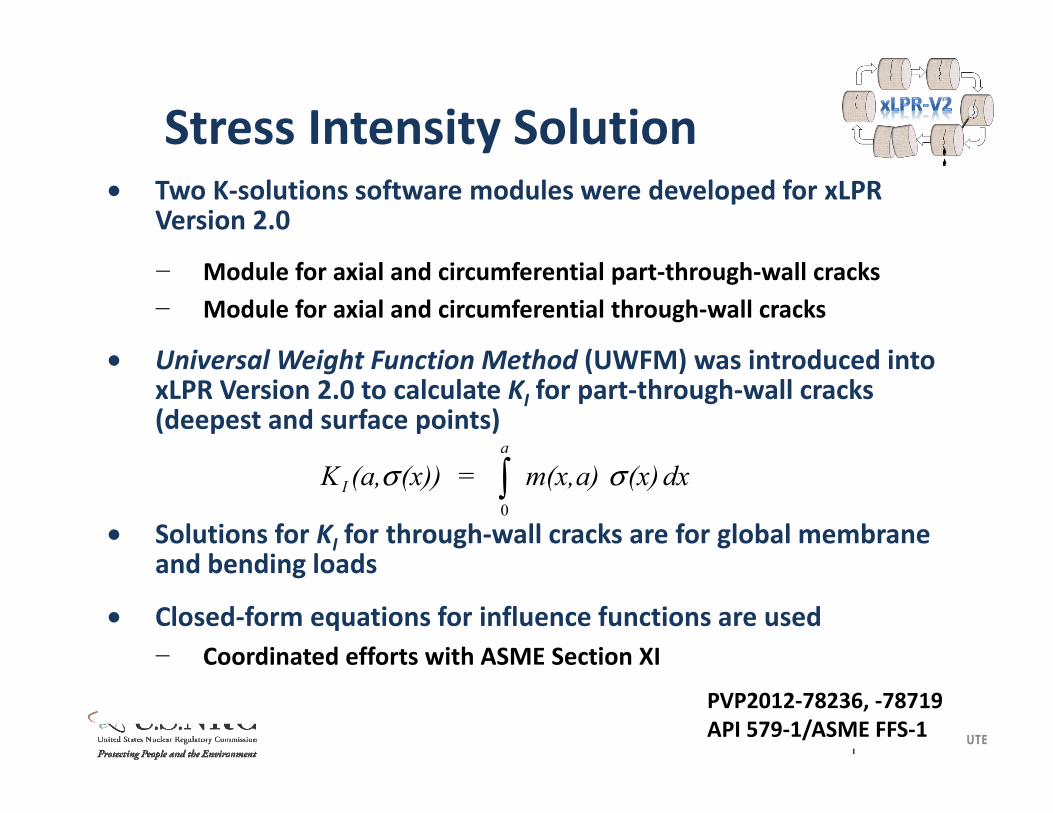
Stress Intensity Solution• Two K-solutions software modules were developed for xLPR
Version 2.0
− Module for axial and circumferential part-through-wall cracks− Module for axial and circumferential through-wall cracks
• Universal Weight Function Method (UWFM) was introduced into xLPR Version 2.0 to calculate KI for part-through-wall cracks (deepest and surface points)
• Solutions for KI for through-wall cracks are for global membrane and bending loads
• Closed-form equations for influence functions are used− Coordinated efforts with ASME Section XI
dx (x)a)m(x, = (x))(a,Ka
I σσ 0
PVP2012-78236, -78719API 579-1/ASME FFS-1
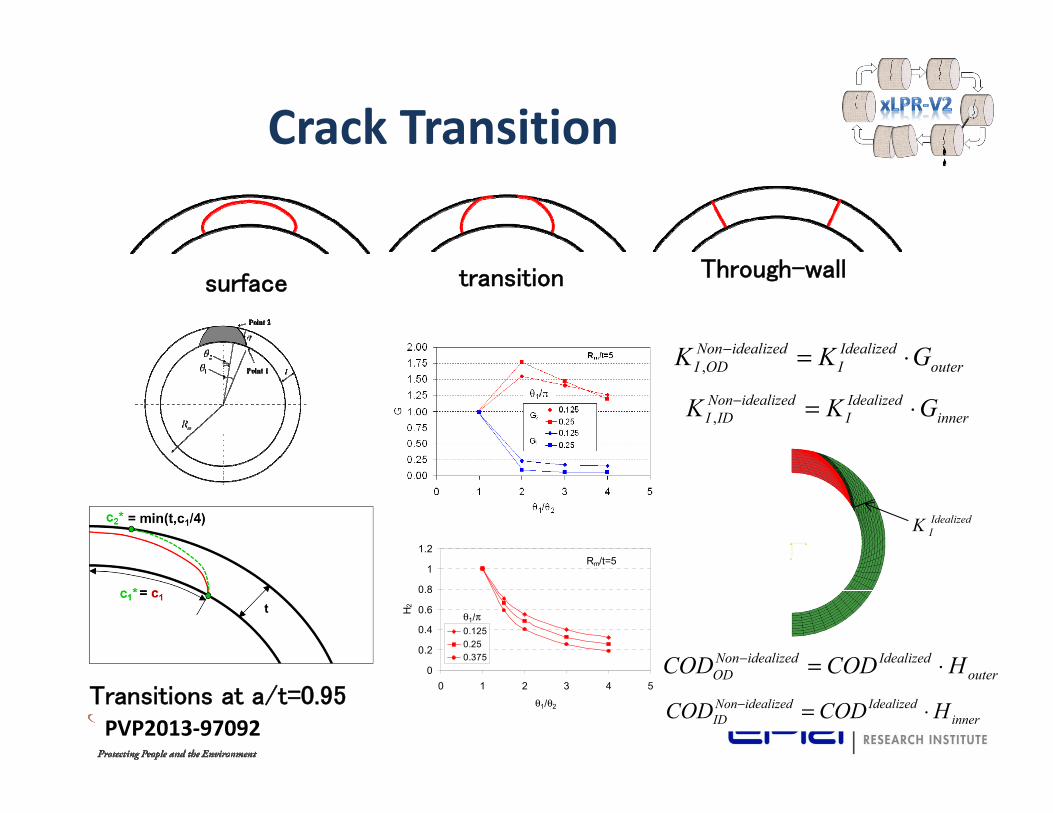
Crack Transition
innerIdealizedI
idealizedNonIDI GKK ⋅=−
,
outerIdealizedI
idealizedNonODI GKK ⋅=−
,
surface transition Through-wall
Transitions at a/t=0.95
IdealizedIK
innerIdealizedidealizedNon
ID HCODCOD ⋅=−
outerIdealizedidealizedNon
OD HCODCOD ⋅=−0
0.2
0.4
0.6
0.8
1
1.2
0 1 2 3 4 5
θ1/θ2
H2
0.1250.250.375
Rm/t=5
θ1/π
PVP2013-97092
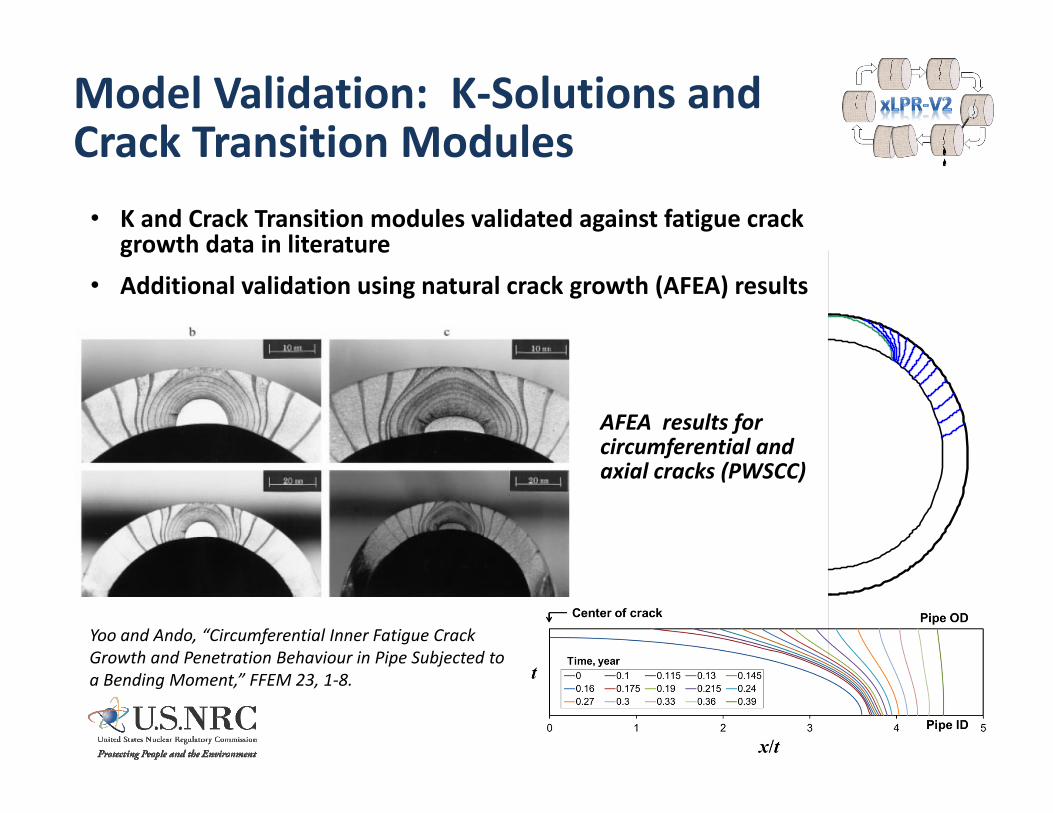
Model Validation: K-Solutions and Crack Transition Modules
• K and Crack Transition modules validated against fatigue crack growth data in literature
• Additional validation using natural crack growth (AFEA) results
Yoo and Ando, “Circumferential Inner Fatigue Crack Growth and Penetration Behaviour in Pipe Subjected to a Bending Moment,” FFEM 23, 1-8.
AFEA results for circumferential and axial cracks (PWSCC)
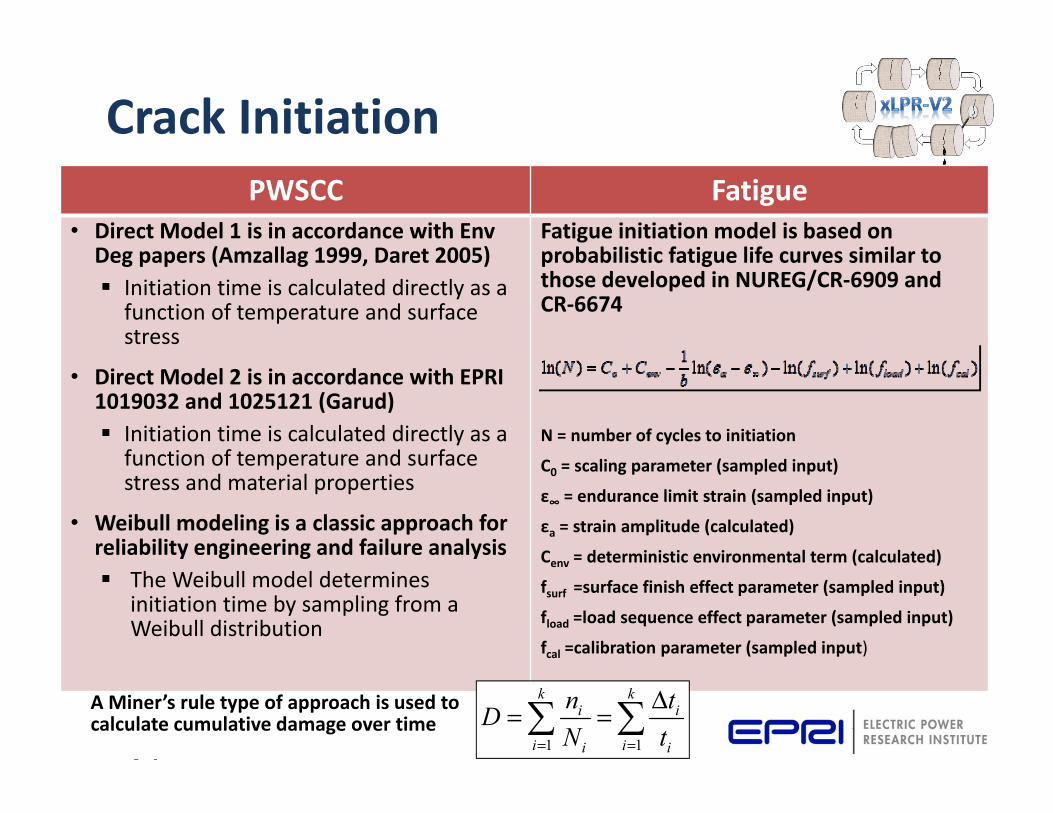
Crack Initiation
A Miner’s rule type of approach is used to calculate cumulative damage over time
PWSCC Fatigue• Direct Model 1 is in accordance with Env
Deg papers (Amzallag 1999, Daret 2005) Initiation time is calculated directly as a
function of temperature and surface stress
• Direct Model 2 is in accordance with EPRI 1019032 and 1025121 (Garud) Initiation time is calculated directly as a
function of temperature and surface stress and material properties
• Weibull modeling is a classic approach for reliability engineering and failure analysis The Weibull model determines
initiation time by sampling from a Weibull distribution
Fatigue initiation model is based on probabilistic fatigue life curves similar to those developed in NUREG/CR-6909 and CR-6674
N = number of cycles to initiation
C0 = scaling parameter (sampled input)
ε∞ = endurance limit strain (sampled input)
εa = strain amplitude (calculated)
Cenv = deterministic environmental term (calculated)
fsurf =surface finish effect parameter (sampled input)
fload =load sequence effect parameter (sampled input)
fcal =calibration parameter (sampled input)
1 1
k ki i
i ii i
n tDN t= =
Δ= =
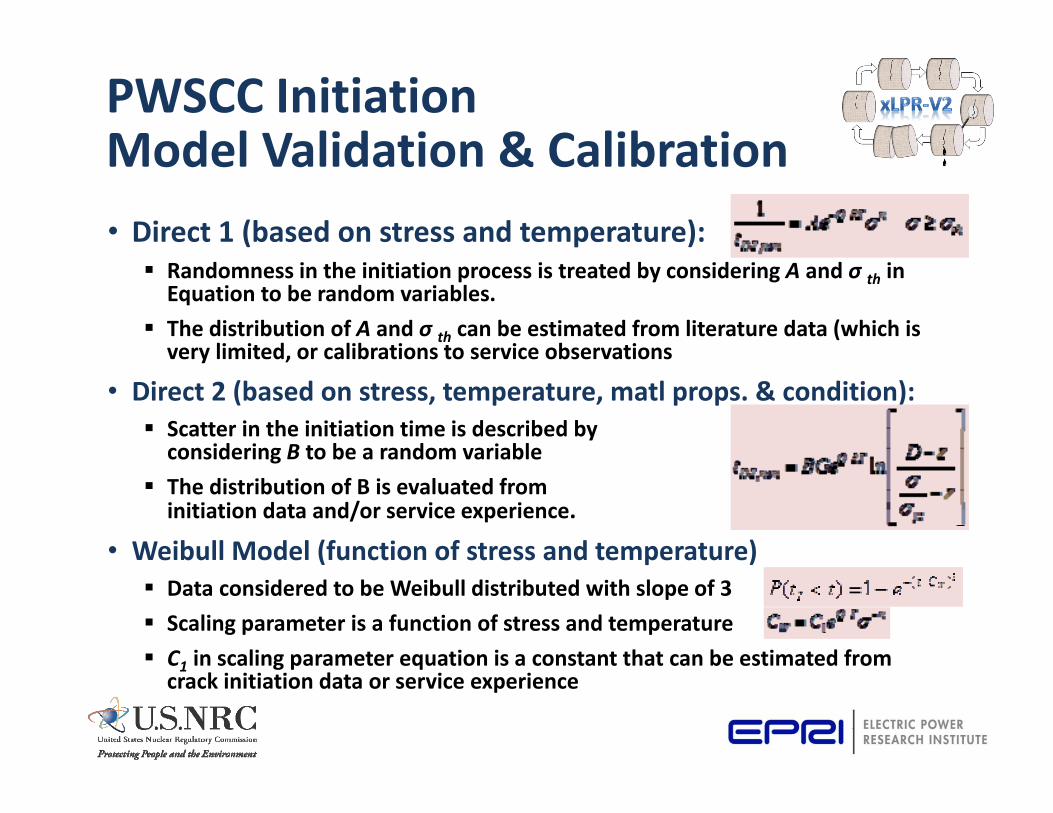
PWSCC Initiation Model Validation & Calibration • Direct 1 (based on stress and temperature): Randomness in the initiation process is treated by considering A and σ th in
Equation to be random variables. The distribution of A and σ th can be estimated from literature data (which is
very limited, or calibrations to service observations
• Direct 2 (based on stress, temperature, matl props. & condition): Scatter in the initiation time is described by
considering B to be a random variable The distribution of B is evaluated from
initiation data and/or service experience.
• Weibull Model (function of stress and temperature) Data considered to be Weibull distributed with slope of 3 Scaling parameter is a function of stress and temperature C1 in scaling parameter equation is a constant that can be estimated from
crack initiation data or service experience

PWSCC InitiationValidation• Method Update existing inventory of PWSCC field data Develop a regression framework for Direct model parameter
optimization Direct and Weibull model parameter estimation based on laboratory
data Validation of Direct and Weibull model parameters by direct
comparison with field data
• Status Updating of field data (including international) complete Development of regression framework for parameter estimation
ongoing On track for scheduled completion in February 2015
Fatigue Crack InitiationValidation• Method Leverage validation of fatigue initiation models as documented in
NUREG-6909 Fatigue models employed in xLPR are taken directly from NUREG-6909
making the corresponding validation applicable for the CIF MVR
• Status Initial draft of MVR for CIF complete and in review by the xLPR CI
Subgroup
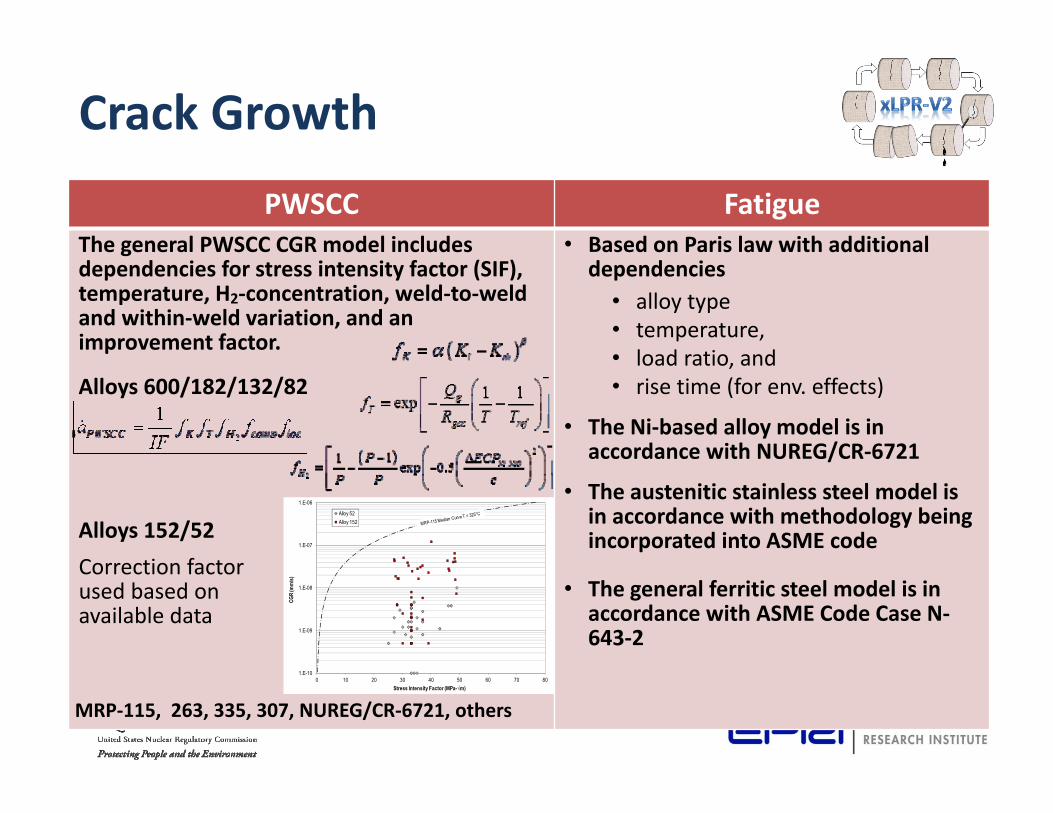
Crack GrowthPWSCC Fatigue
The general PWSCC CGR model includes dependencies for stress intensity factor (SIF), temperature, H2-concentration, weld-to-weldand within-weld variation, and an improvement factor.
Alloys 600/182/132/82
Alloys 152/52
• Based on Paris law with additional dependencies
• alloy type• temperature, • load ratio, and • rise time (for env. effects)
• The Ni-based alloy model is in accordance with NUREG/CR-6721
• The austenitic stainless steel model is in accordance with methodology being incorporated into ASME code
• The general ferritic steel model is in accordance with ASME Code Case N-643-2
1.E-10
1.E-09
1.E-08
1.E-07
1.E-06
0 10 20 30 40 50 60 70 80
CGR
(mm
/s)
Stress Intensity Factor (MPa-√m)
Alloy 52Alloy 152
Correction factor used based on available data
MRP-115, 263, 335, 307, NUREG/CR-6721, others
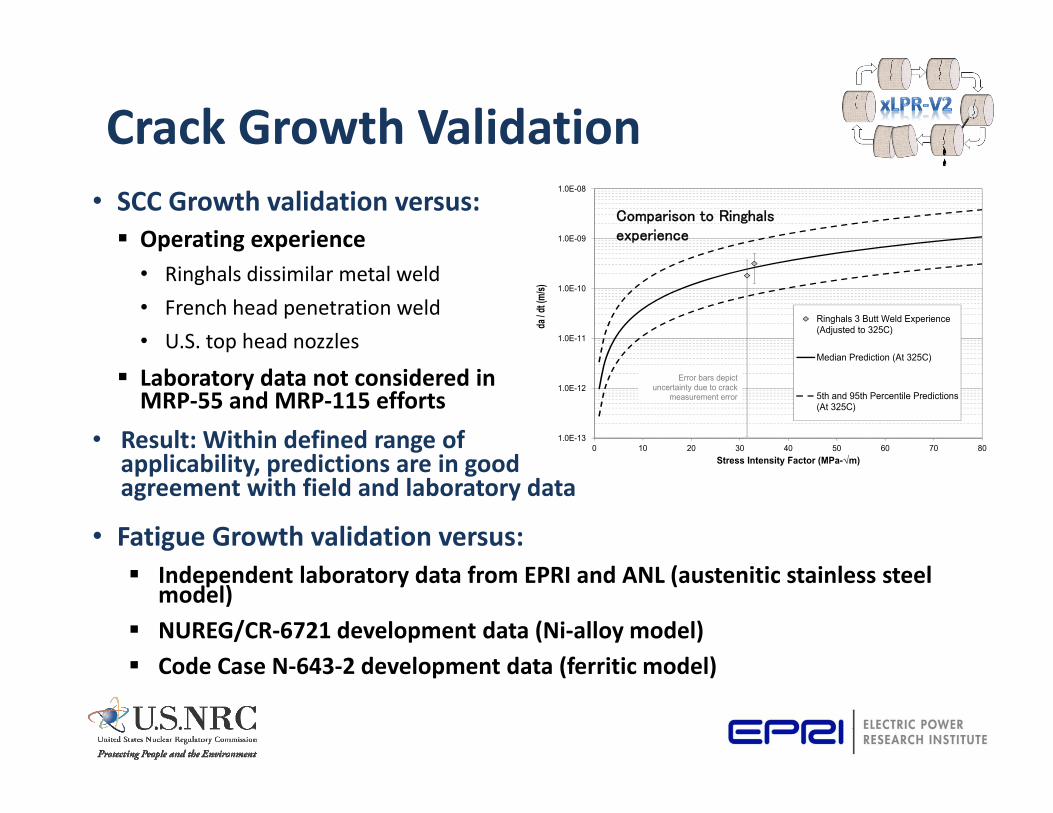
Crack Growth Validation• SCC Growth validation versus: Operating experience
• Ringhals dissimilar metal weld• French head penetration weld• U.S. top head nozzles
Laboratory data not considered in MRP-55 and MRP-115 efforts
• Result: Within defined range of applicability, predictions are in good agreement with field and laboratory data
• Fatigue Growth validation versus: Independent laboratory data from EPRI and ANL (austenitic stainless steel
model) NUREG/CR-6721 development data (Ni-alloy model) Code Case N-643-2 development data (ferritic model)
1.0E-13
1.0E-12
1.0E-11
1.0E-10
1.0E-09
1.0E-08
0 10 20 30 40 50 60 70 80
da / d
t (m/s)
Stress Intensity Factor (MPa-√m)
Ringhals 3 Butt Weld Experience(Adjusted to 325C)
Median Prediction (At 325C)
5th and 95th Percentile Predictions(At 325C)
Error bars depict uncertainty due to crack
measurement error
Comparison to Ringhals experience

Summary of Coalescence Modeling for xLPR Version 2.0• The coalescence model applies a set of
rules to an inventory of cracks to determine whether coalescence occurs The coalescence distance is a
function of the attributes of the cracks involved in coalescence
• Coalescence is simulated by way of “pairwise” coalescence, i.e., two cracks combine to make one “coalesced crack”; the other is “absorbed”
• The attributes of the coalesced crack is a function of the attributes of the original two cracks
• Circumferential cracks are assumed to be coplanar. Axial cracks do not interact with each other or with circumferential cracks
Crack Type Name Image
Inactive Crack
Surface Crack
Transitioning Crack
Idealized Through-Wall Crack
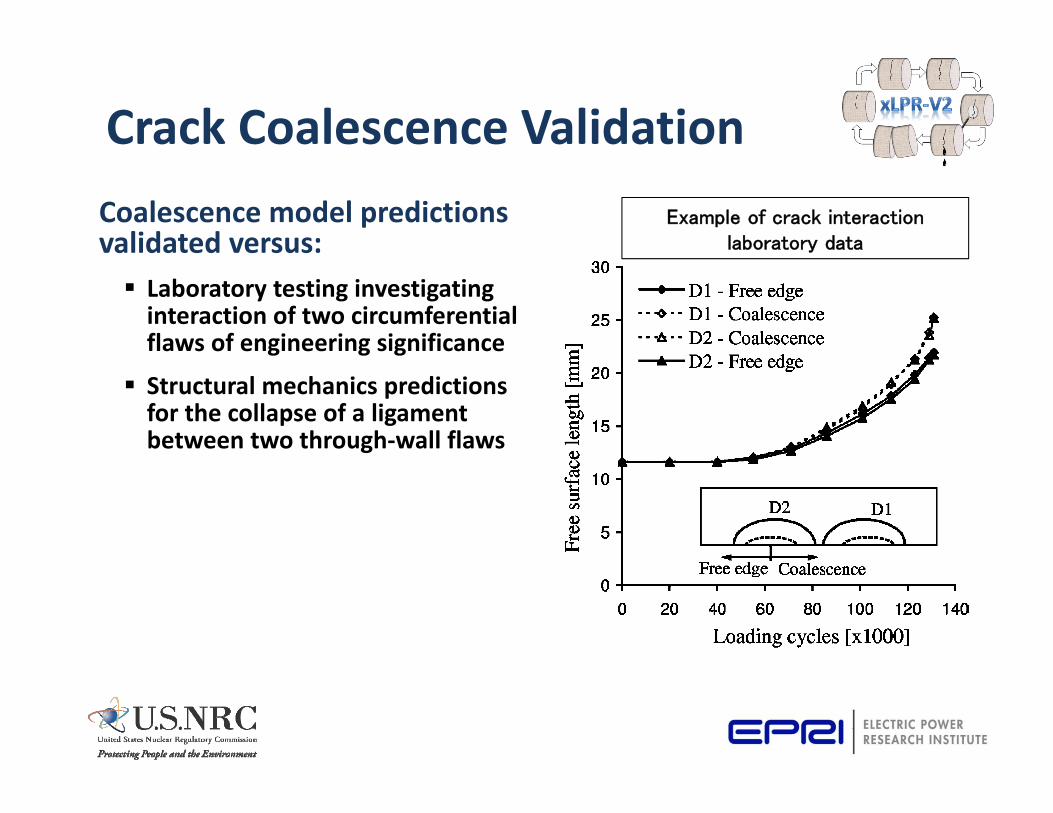
Crack Coalescence ValidationCoalescence model predictions validated versus: Laboratory testing investigating
interaction of two circumferential flaws of engineering significance
Structural mechanics predictions for the collapse of a ligament between two through-wall flaws
Example of crack interaction laboratory data
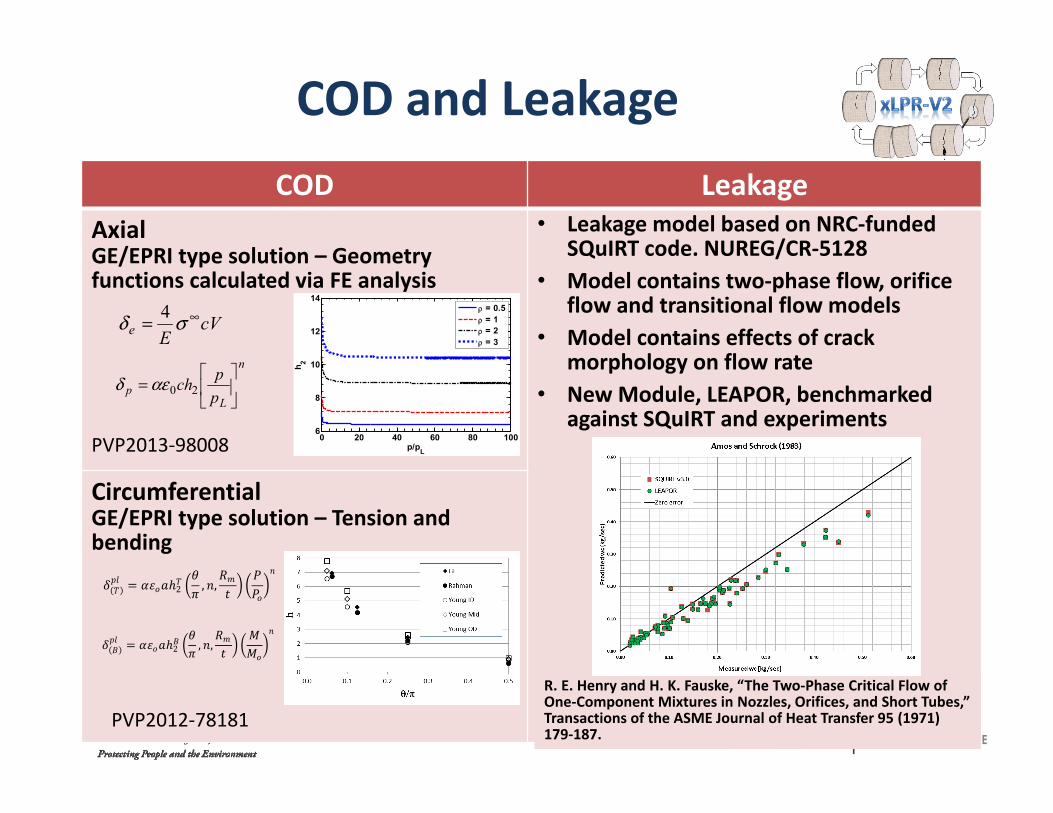
COD and LeakageCOD Leakage
AxialGE/EPRI type solution – Geometry functions calculated via FE analysis
• Leakage model based on NRC-funded SQuIRT code. NUREG/CR-5128
• Model contains two-phase flow, orifice flow and transitional flow models
• Model contains effects of crack morphology on flow rate
• New Module, LEAPOR, benchmarked against SQuIRT and experiments
CircumferentialGE/EPRI type solution – Tension and bending
cVEe
∞= σδ 4
n
Lp p
pch
= 20αεδ
0 20 40 60 80 1006
8
10
12
14h 2
p/pL
ρ = 0.5ρ = 1ρ = 2ρ = 3
PVP2013-98008
PVP2012-78181
= ℎ2 , ,
= ℎ2 , ,
R. E. Henry and H. K. Fauske, “The Two-Phase Critical Flow of One-Component Mixtures in Nozzles, Orifices, and Short Tubes,” Transactions of the ASME Journal of Heat Transfer 95 (1971) 179-187.
COD ValidationAxial Circumferential
• Comparison to similar analytical developments
• Looking for data from steam generator tubes, etc.
• Comparison to 36 TWC Experiments• 21 4-point bend (CS, SS & welds)• 3 pressure & bend (CS & SS)• 5 4-point bend DMW• 7 QS or Dyn cyclic bend (CS, SS & welds)
• Comparison to CALC_COD (xLPR V1.0)• Comparison to GE/EPRI solutions• Results for experiments
• CrCOD overpredicts COD• At initiation (crack is still original
machined size)• predicted/measuredavg=1.23• Std Dev = 0.75• At maximum moment (crack has
grown)• predicted/measuredavg=1.41• Std Dev = 0.80
Leakage Rate Module Validation Efforts
• Model validation efforts include the following:• Comparison to previously validated software codes SQUIRT and PICEP• Comparison to the experimental data currently available for two-phase flow
through cracks and/or slits• Both of the above efforts have been completed and are reported
• Because the experimental data currently available covers flows almost exclusively in the tight crack regime a literature study will be performed to see if additional, applicable data is available to validate LEAPOR
• The literature study is currently underway and if there is additional data available this will be used to further validate LEAPOR
• The main source of uncertainty in the Leak Rate Module is due to the crack morphology parameters.
• Using PROMETHEUS as a test bed, the crack morphology parameters were randomly selected while keeping other inputs the same to determine the effect on the calculated leakage rate.
• This work is currently being finalized and the Vertical Slice will be updated when complete.
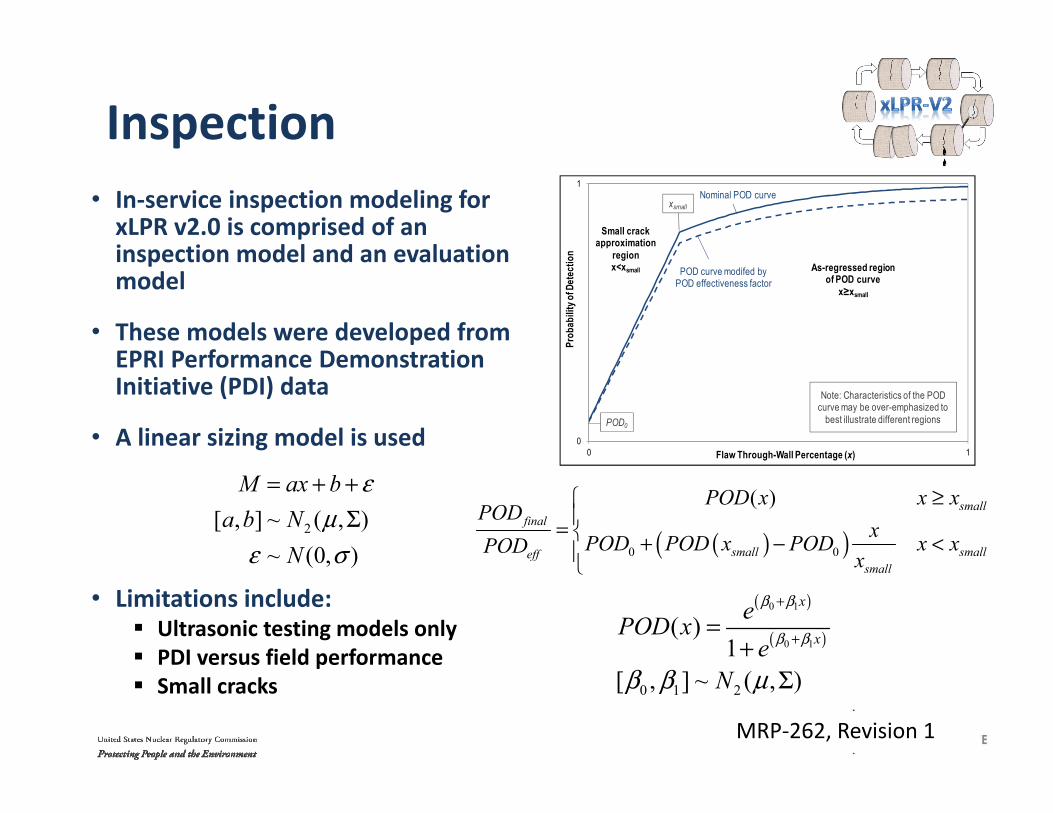
Inspection• In-service inspection modeling for
xLPR v2.0 is comprised of an inspection model and an evaluation model
• These models were developed from EPRI Performance Demonstration Initiative (PDI) data
• A linear sizing model is used
• Limitations include: Ultrasonic testing models only PDI versus field performance Small cracks
0
1
0 1
Prob
abili
ty of
Det
ectio
n
Flaw Through-Wall Percentage (x)
As-regressed region of POD curve
x≥xsmall
Small crack approximation
regionx<xsmall
Note: Characteristics of the POD curve may be over-emphasized to
best illustrate different regionsPOD0
xsmallNominal POD curve
POD curve modifed by POD effectiveness factor
( )
( )
0 1
0 1
0 1 2
( )1
[ , ] ~ ( , )
x
x
ePOD xe
N
β β
β β
β β μ
+
+=+
Σ
( )( )0 0
( ) smallfinal
small smalleffsmall
POD x x xPOD
xPOD POD x POD x xPODx
≥= + − <
2[ , ] ~ ( , )~ (0, )
M ax ba b N
N
εμ
ε σ
= + +Σ
MRP-262, Revision 1
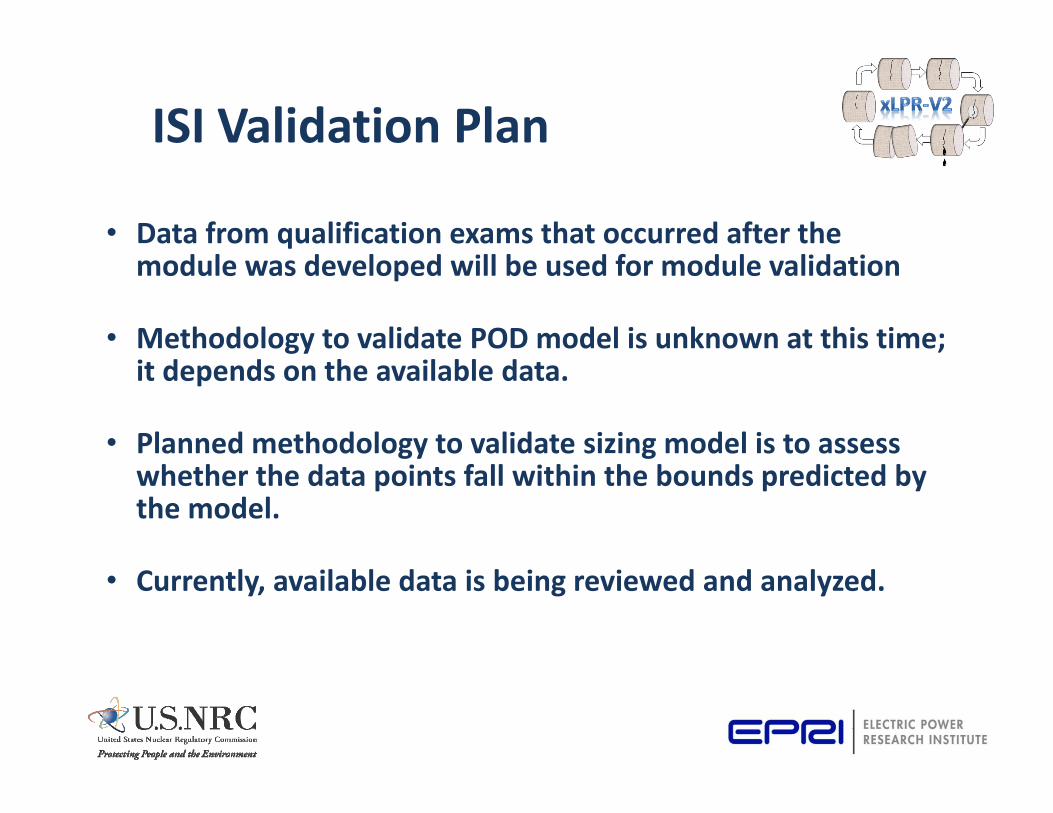
ISI Validation Plan
• Data from qualification exams that occurred after the module was developed will be used for module validation
• Methodology to validate POD model is unknown at this time; it depends on the available data.
• Planned methodology to validate sizing model is to assess whether the data points fall within the bounds predicted by the model.
• Currently, available data is being reviewed and analyzed.

Crack StabilityCircumferential
Surface Through-wallMultiple crack net section collapse Net-section collapse
J-estimation (LBB.ENG2)
= 12 12 2 2 = 2 2 sin cos sin
= 4 2 12
( ) ( ) ( )1
21 ,,12
+
−
+
=n
mBBB
mno
p tRMInLnH
nR
EJ
πθθπ
σα
Li, Y. et al.; “Prediction of Collapse Stress for Pipes With Arbitrarily Multiple Surface Flaws”; Journal of Pressure Vessel Technology, Vol 132; 2010; pp. 061204.
Brust, F.W., and Gilles, P.; “Approximate Methods for Fracture Analysis of Tubular Members Subjected to Combined Tensile and Bending Loads”; Journal of Offshore Mechanics and Arctic Engineering; Vol. 116; Nov 1994; pp. 221-227.
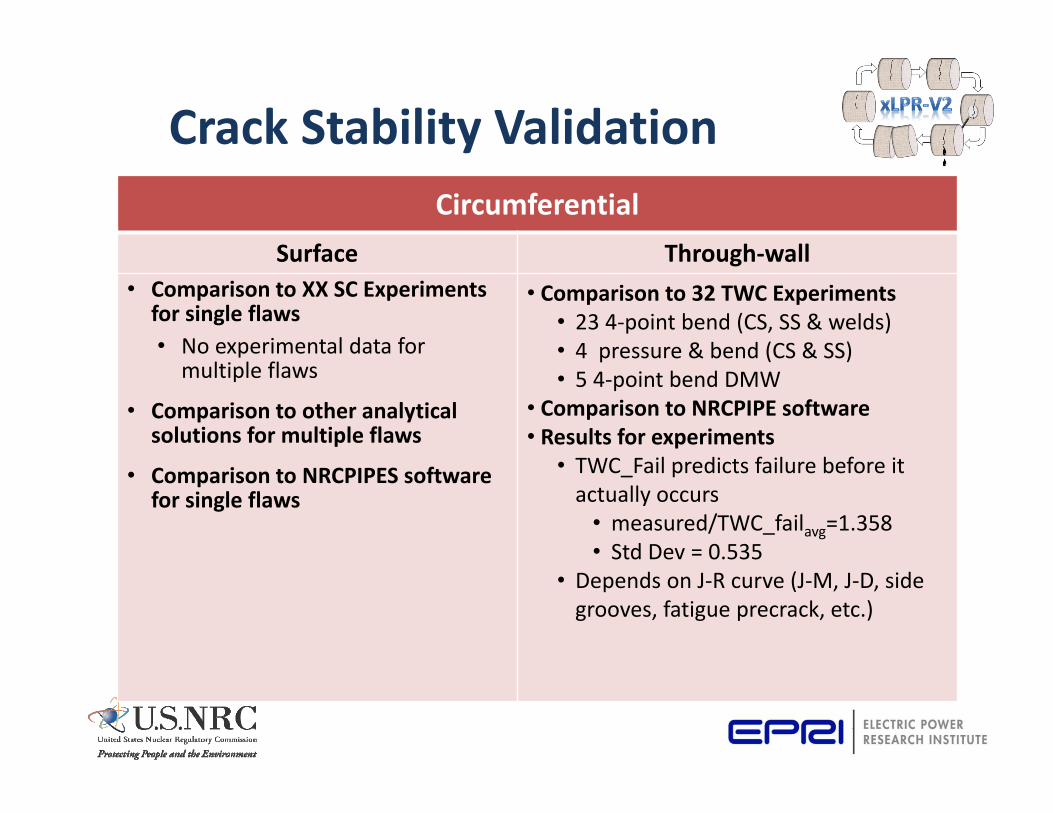
Crack Stability ValidationCircumferential
Surface Through-wall• Comparison to XX SC Experiments
for single flaws• No experimental data for
multiple flaws
• Comparison to other analytical solutions for multiple flaws
• Comparison to NRCPIPES software for single flaws
• Comparison to 32 TWC Experiments• 23 4-point bend (CS, SS & welds)• 4 pressure & bend (CS & SS)• 5 4-point bend DMW
• Comparison to NRCPIPE software• Results for experiments
• TWC_Fail predicts failure before it actually occurs
• measured/TWC_failavg=1.358• Std Dev = 0.535
• Depends on J-R curve (J-M, J-D, side grooves, fatigue precrack, etc.)
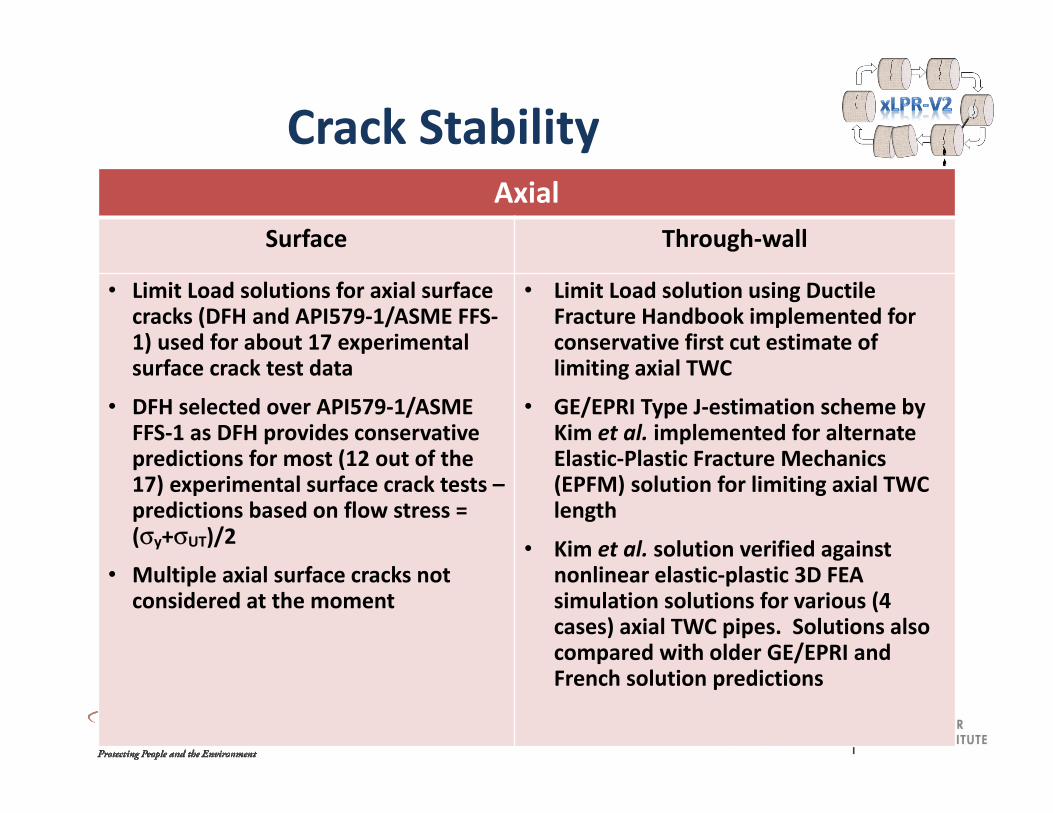
Crack StabilityAxial
Surface Through-wall
• Limit Load solutions for axial surface cracks (DFH and API579-1/ASME FFS-1) used for about 17 experimental surface crack test data
• DFH selected over API579-1/ASME FFS-1 as DFH provides conservative predictions for most (12 out of the 17) experimental surface crack tests –predictions based on flow stress = (σy+σUT)/2
• Multiple axial surface cracks not considered at the moment
• Limit Load solution using Ductile Fracture Handbook implemented for conservative first cut estimate of limiting axial TWC
• GE/EPRI Type J-estimation scheme by Kim et al. implemented for alternate Elastic-Plastic Fracture Mechanics (EPFM) solution for limiting axial TWC length
• Kim et al. solution verified against nonlinear elastic-plastic 3D FEA simulation solutions for various (4 cases) axial TWC pipes. Solutions also compared with older GE/EPRI and French solution predictions
Models Status Summary
• Module development has been completed for most models Single configuration item defined at the completion of verification
testing Configuration items to receive one more quality check
• Validation testing of all modules is underway with plans to complete all early in 2015 Crack Growth, Fatigue Crack Initiation, Coalescence validation testing
completed and documents in review Validation plans developed for all other modules with data collection
and assessment being performed Data will be used to characterize model uncertainties and make
recommendations to the Computational Group on module implementation to account for uncertainties