ORR performance Test. electrode system on an electrochemical ... · electrode system on an...
9
ORR performance Test. The ORR electrocatalytic activity of the samples was examined by using in a three- electrode system on an electrochemical workstation (CHI 660D) in 0.1 M KOH electrolyte. Then 8 μL of the homogeneous ink containing 5 mg of catalyst、30μL Nafion solution and 1 ml of 3:1 v/v water/isopropanol mixed solvent was loaded onto a polished glass carbon (GC) disk electrode (5 mm in diameter, 0.196 cm 2 ). The final loading for all catalysts on working electrode is 0.2 mg/cm 2 . While the counter electrode and reference electrode were a Pt wire and an Ag/AgCl (filled with 3 M KCl solution) electrode, respectively. The cyclic voltammetry (CV) measurements for all catalysts in both N 2 - and O 2 -saturated KOH solutions were performed in the potential range of 0 to 1.2 V with a scan rate of 5 mV s -1 . For comparison of the effect of methanol crossover, the CV curves in O 2 -saturated mixture solution containing KOH and methanol (KOH, 0.1 M; methanol, 3.0 M) were conducted. The polarization curves for ORR were scanned cathodically at a rate of 5 mVs -1 with varying rotating speed from 400 rpm to 2500 rpm. On the basis of the RDE data, the number of electron transfer (n) was calculated by the slopes of their Koutecky–Levich (K-L) plots' (J -1 vs. ω -1/2 ) linear fit lines from the K-L equation 1 : 1/J = 1/J K + 1/J L = 1/J K + 1/B 1/2 B = 0.62nFC o (D o ) 2/3 ν -1/6 J K = nFKC o where J is the measured current density, J K and J L are the kinetic- and diffusion- limiting current densities, ω is the angular velocity, n is transferred electron number, F Electronic Supplementary Material (ESI) for Journal of Materials Chemistry A. This journal is © The Royal Society of Chemistry 2016
Transcript of ORR performance Test. electrode system on an electrochemical ... · electrode system on an...
ORR performance Test.
The ORR electrocatalytic activity of the samples was examined by using in a three-
electrode system on an electrochemical workstation (CHI 660D) in 0.1 M KOH
electrolyte. Then 8 μL of the homogeneous ink containing 5 mg of catalyst、30μL
Nafion solution and 1 ml of 3:1 v/v water/isopropanol mixed solvent was loaded onto
a polished glass carbon (GC) disk electrode (5 mm in diameter, 0.196 cm2). The final
loading for all catalysts on working electrode is 0.2 mg/cm2. While the counter
electrode and reference electrode were a Pt wire and an Ag/AgCl (filled with 3 M KCl
solution) electrode, respectively. The cyclic voltammetry (CV) measurements for all
catalysts in both N2- and O2-saturated KOH solutions were performed in the potential
range of 0 to 1.2 V with a scan rate of 5 mV s-1. For comparison of the effect of
methanol crossover, the CV curves in O2-saturated mixture solution containing KOH
and methanol (KOH, 0.1 M; methanol, 3.0 M) were conducted. The polarization
curves for ORR were scanned cathodically at a rate of 5 mVs-1 with varying rotating
speed from 400 rpm to 2500 rpm.
On the basis of the RDE data, the number of electron transfer (n) was calculated by
the slopes of their Koutecky–Levich (K-L) plots' (J-1 vs. ω-1/2) linear fit lines from the
K-L equation1:
1/J = 1/JK + 1/JL = 1/JK + 1/B1/2
B = 0.62nFCo(Do)2/3ν-1/6 JK = nFKCo
where J is the measured current density, JK and JL are the kinetic- and diffusion-
limiting current densities, ω is the angular velocity, n is transferred electron number, F
Electronic Supplementary Material (ESI) for Journal of Materials Chemistry A.This journal is © The Royal Society of Chemistry 2016
is the Faraday constant (96485 C mol-1), Do is the diffusion coefficient of O2 (1.9×10⁻⁵
cm2 s-1), Co is the bulk concentration of O2 (1.2×10⁻⁶ mol cm-3), ν is the kinematic
viscosity of the electrolyte (0.01 cm2 s-1), and k is the electron-transfer rate constant.
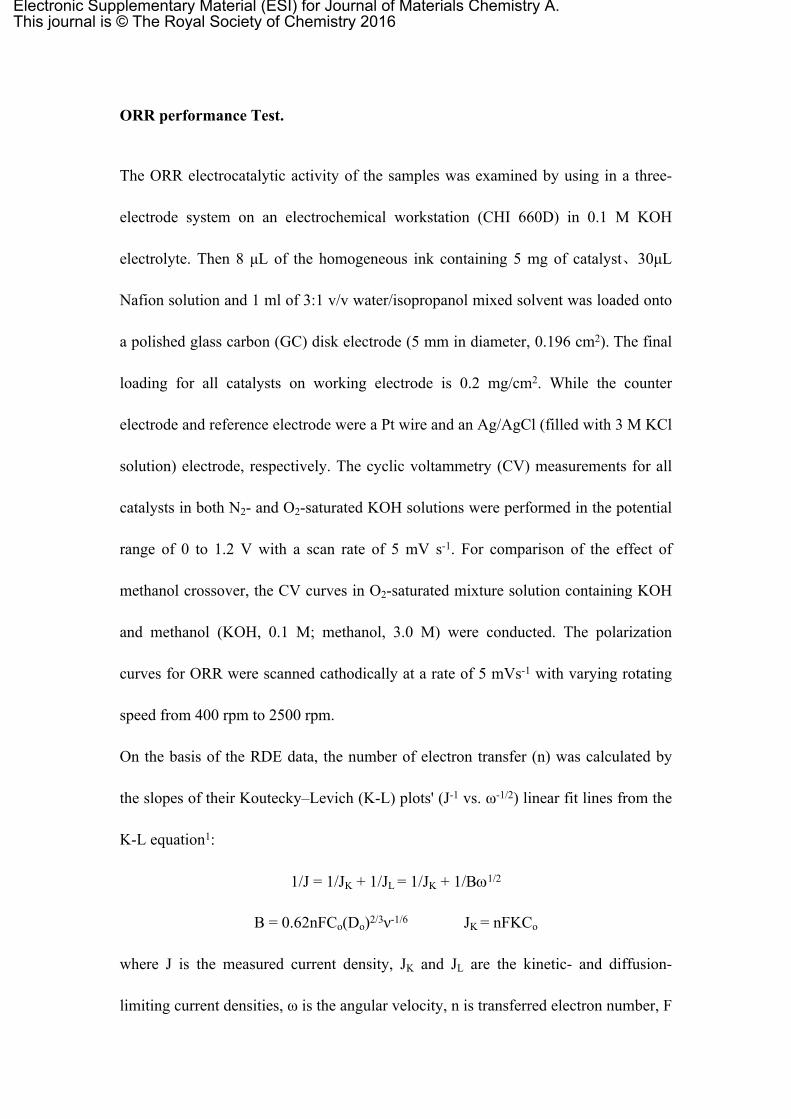
Figure S1 (a, b, c) SEM images of S-600, S-700 and S-800, (d, e, f) TEM images of S-600, S-700 and S-800.
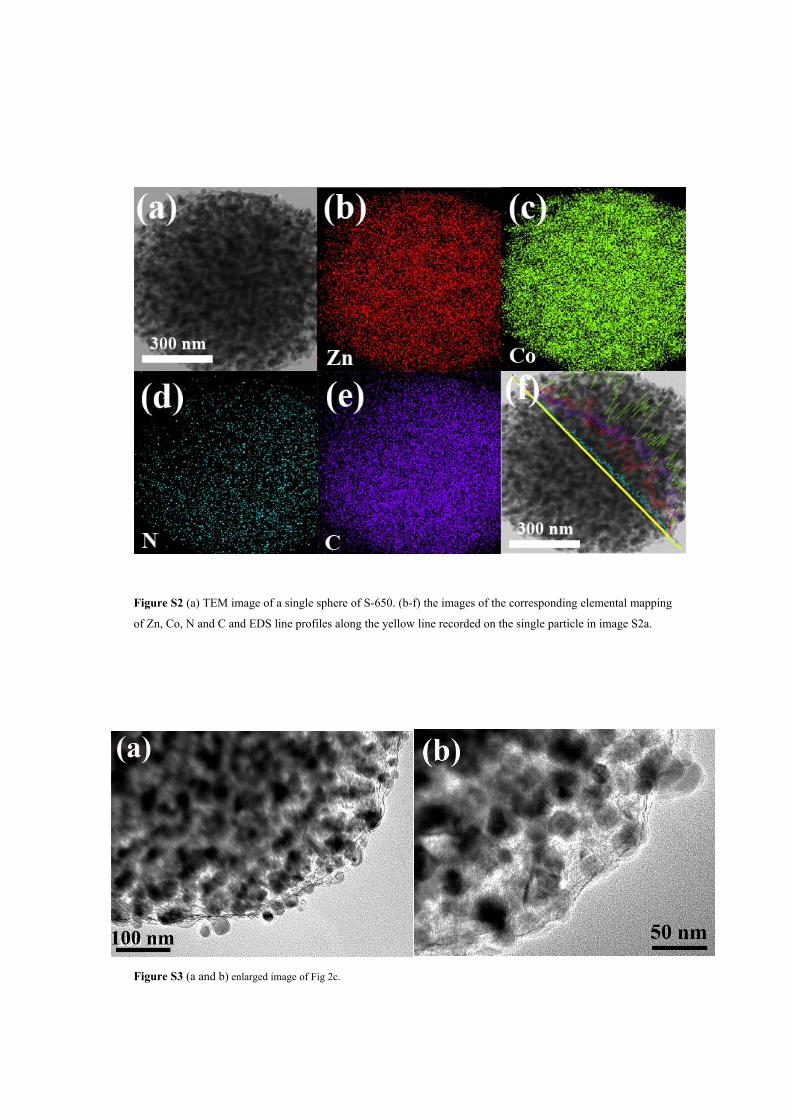
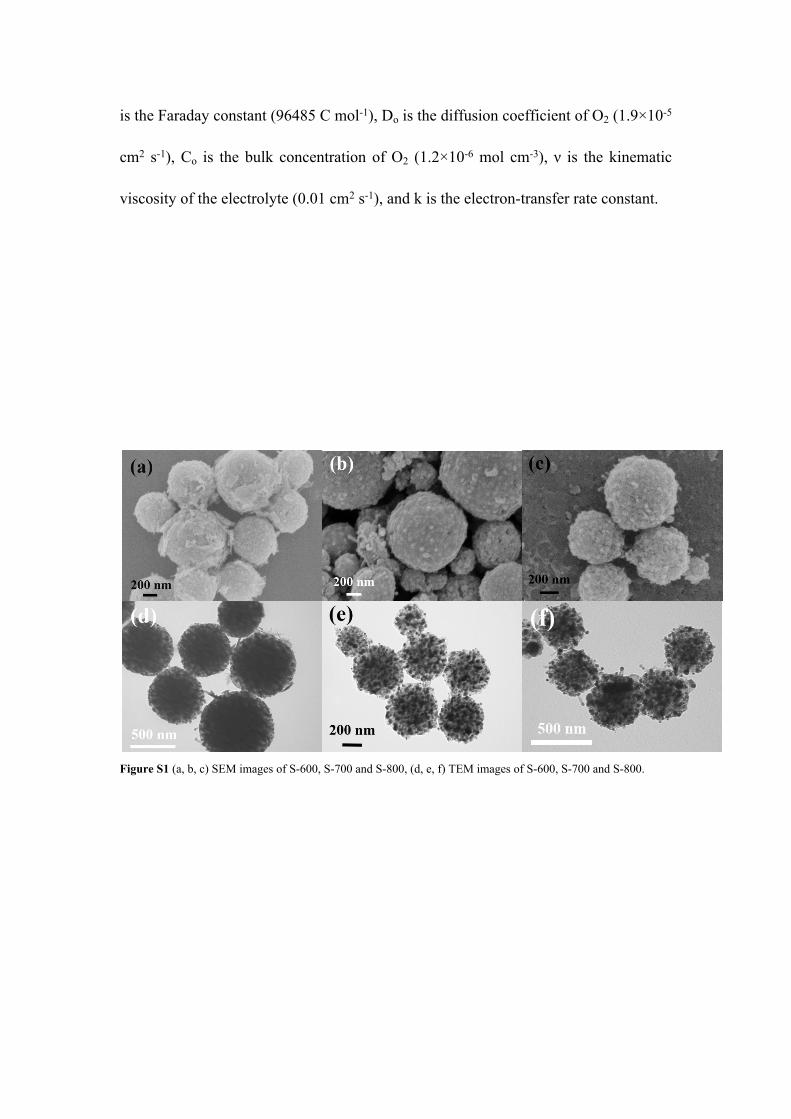
Figure S2 (a) TEM image of a single sphere of S-650. (b-f) the images of the corresponding elemental mapping
of Zn, Co, N and C and EDS line profiles along the yellow line recorded on the single particle in image S2a.
Figure S3 (a and b) enlarged image of Fig 2c.
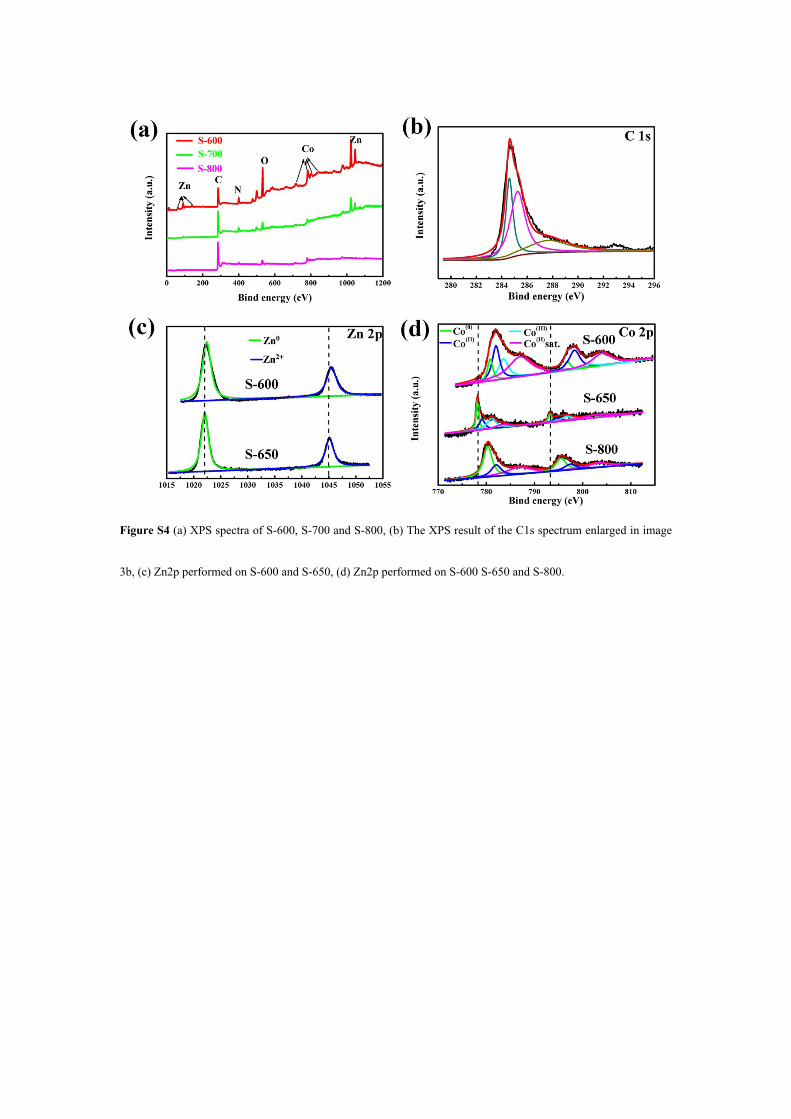
Figure S4 (a) XPS spectra of S-600, S-700 and S-800, (b) The XPS result of the C1s spectrum enlarged in image
3b, (c) Zn2p performed on S-600 and S-650, (d) Zn2p performed on S-600 S-650 and S-800.
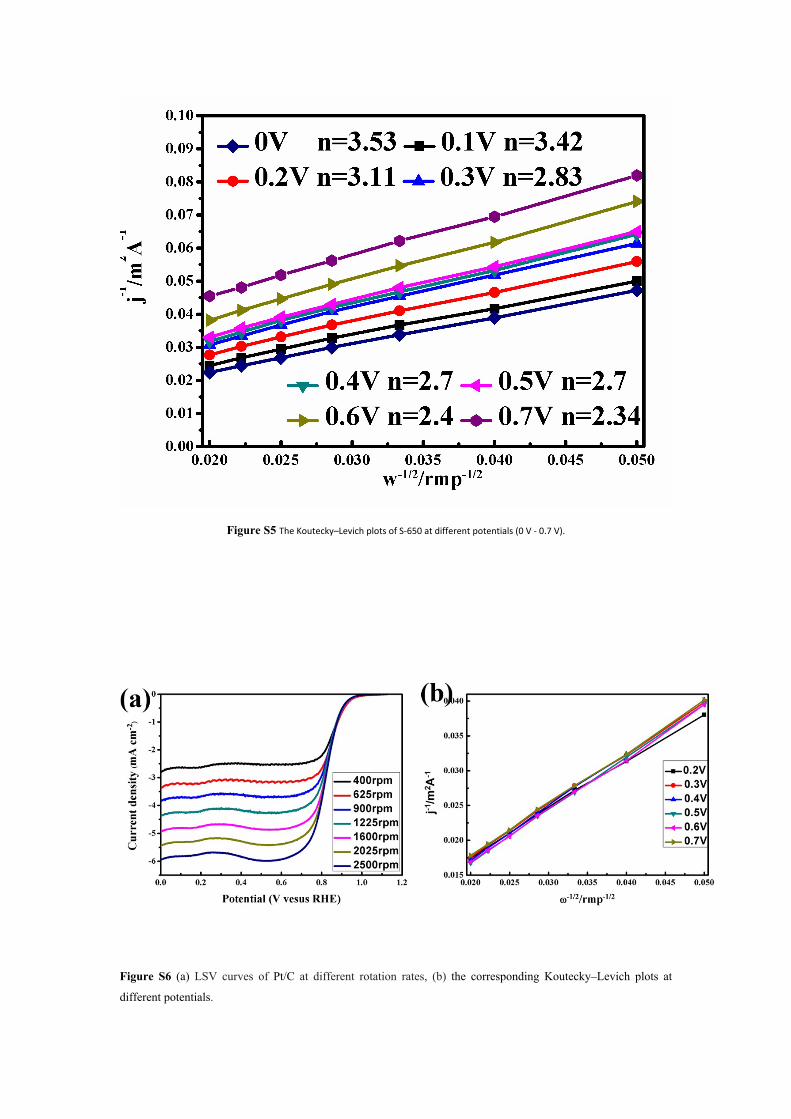
Figure S5 The Koutecky–Levich plots of S-650 at different potentials (0 V - 0.7 V).
Figure S6 (a) LSV curves of Pt/C at different rotation rates, (b) the corresponding Koutecky–Levich plots at
different potentials.
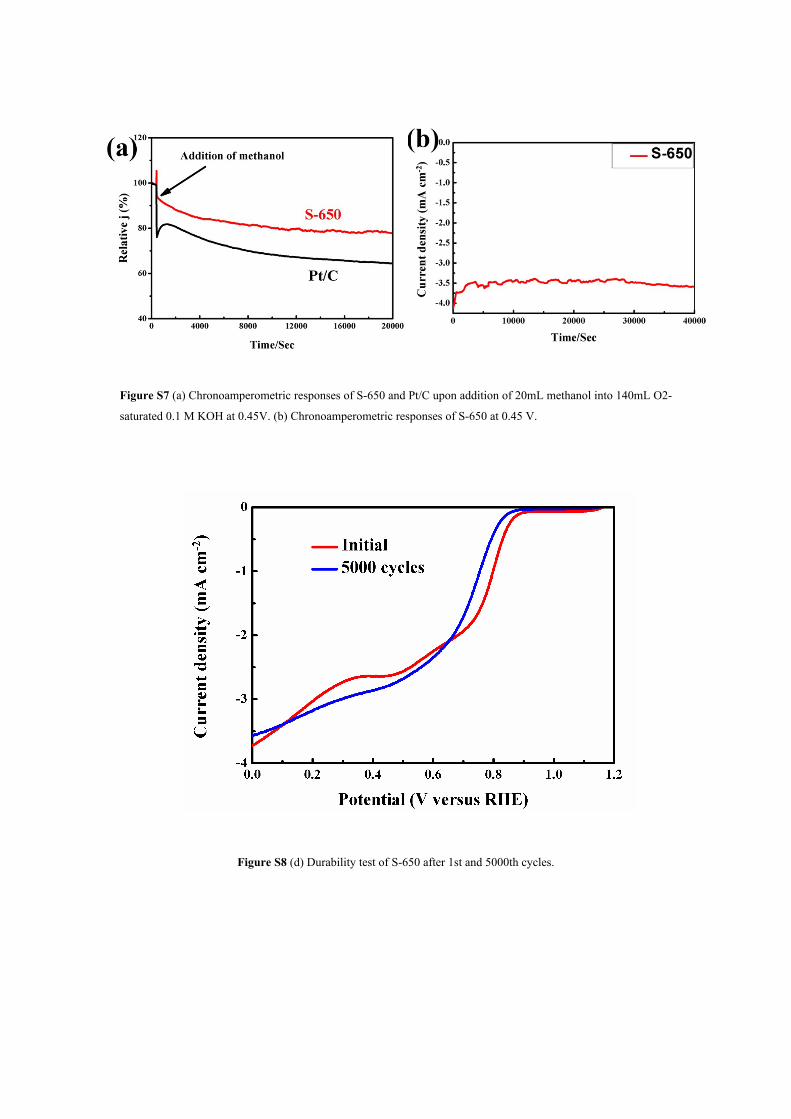
Figure S7 (a) Chronoamperometric responses of S-650 and Pt/C upon addition of 20mL methanol into 140mL O2-
saturated 0.1 M KOH at 0.45V. (b) Chronoamperometric responses of S-650 at 0.45 V.
Figure S8 (d) Durability test of S-650 after 1st and 5000th cycles.
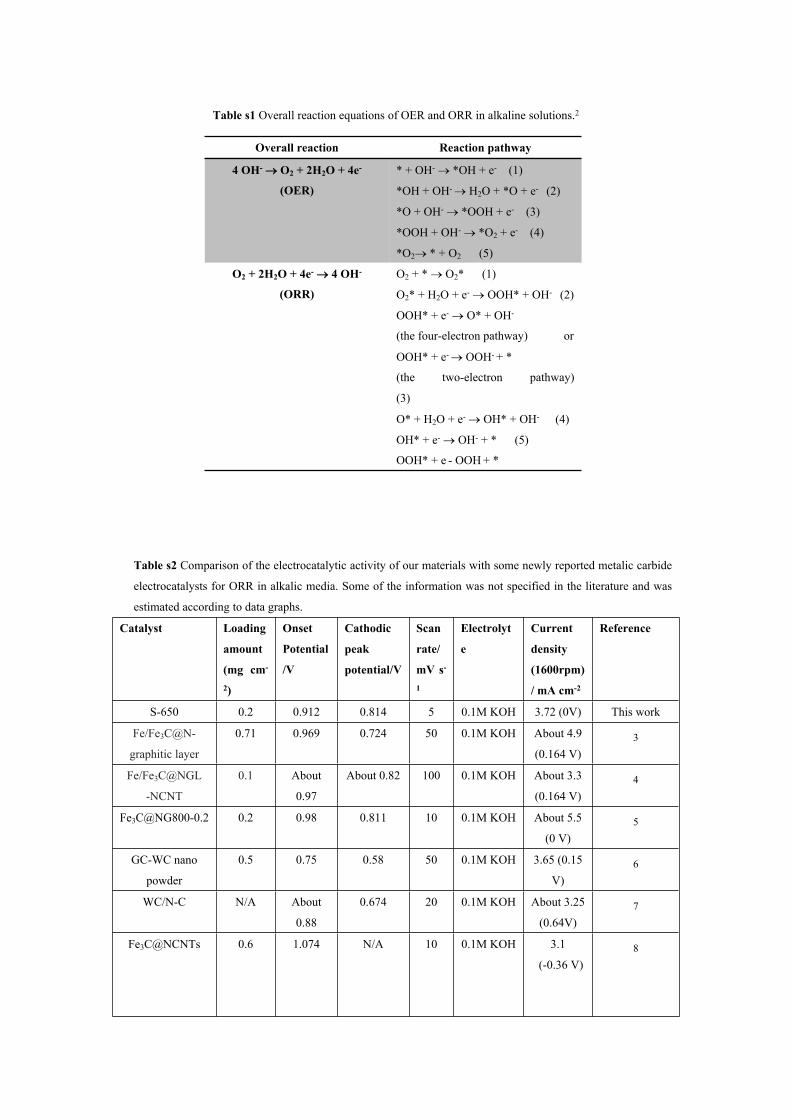
Table s1 Overall reaction equations of OER and ORR in alkaline solutions.2
Overall reaction Reaction pathway
4 OH- O2 + 2H2O + 4e-
(OER)
* + OH- *OH + e- (1)
*OH + OH- H2O + *O + e- (2)
*O + OH- *OOH + e- (3)
*OOH + OH- *O2 + e- (4)
*O2 * + O2 (5)
O2 + 2H2O + 4e- 4 OH-
(ORR)
O2 + * O2* (1)
O2* + H2O + e- OOH* + OH- (2)
OOH* + e- O* + OH-
(the four-electron pathway) or
OOH* + e- OOH- + *
(the two-electron pathway)
(3)
O* + H2O + e- OH* + OH- (4)
OH* + e- OH- + * (5)
OOH* + e - OOH + *
Table s2 Comparison of the electrocatalytic activity of our materials with some newly reported metalic carbide
electrocatalysts for ORR in alkalic media. Some of the information was not specified in the literature and was
estimated according to data graphs.
Catalyst Loading
amount
(mg cm-
2)
Onset
Potential
/V
Cathodic
peak
potential/V
Scan
rate/
mV s-
1
Electrolyt
e
Current
density
(1600rpm)
/ mA cm-2
Reference
S-650 0.2 0.912 0.814 5 0.1M KOH 3.72 (0V) This work
Fe/Fe3C@N-
graphitic layer
0.71 0.969 0.724 50 0.1M KOH About 4.9
(0.164 V)3
Fe/Fe3C@NGL
-NCNT
0.1 About
0.97
About 0.82 100 0.1M KOH About 3.3
(0.164 V)4
[email protected] 0.2 0.98 0.811 10 0.1M KOH About 5.5
(0 V)5
GC-WC nano
powder
0.5 0.75 0.58 50 0.1M KOH 3.65 (0.15
V)6
WC/N-C N/A About
0.88
0.674 20 0.1M KOH About 3.25
(0.64V)7
Fe3C@NCNTs 0.6 1.074 N/A 10 0.1M KOH 3.1
(-0.36 V)8
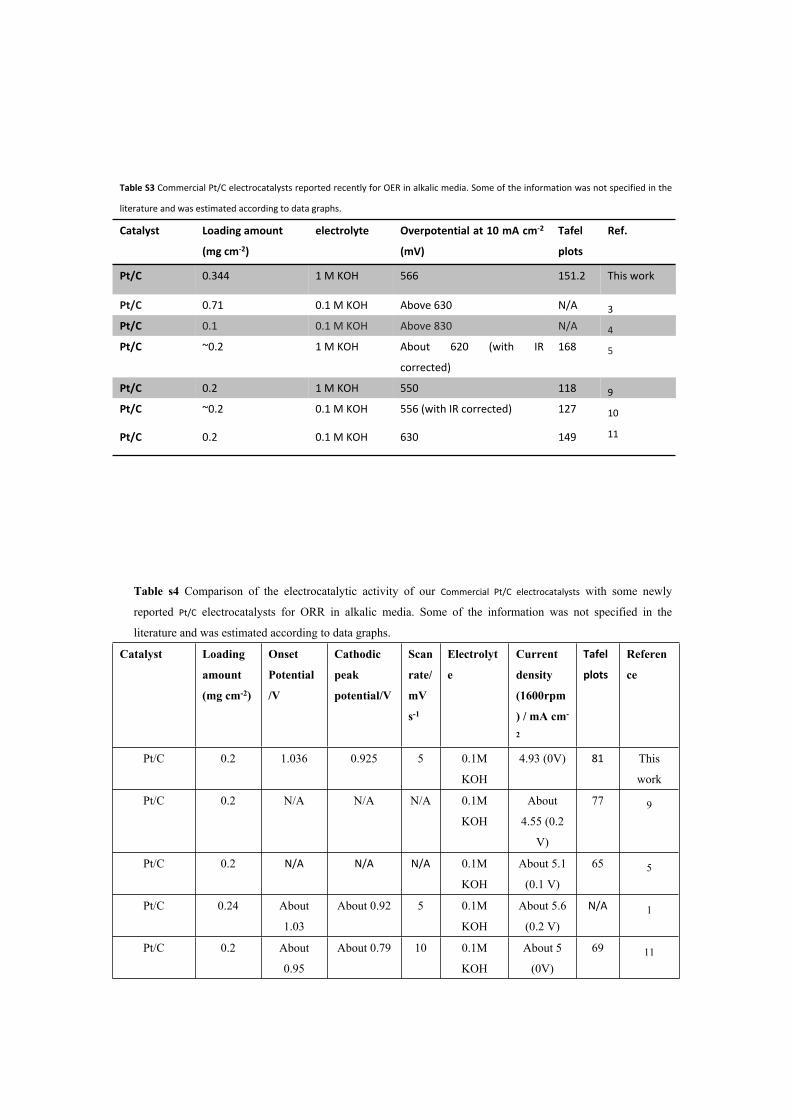
Table S3 Commercial Pt/C electrocatalysts reported recently for OER in alkalic media. Some of the information was not specified in the
literature and was estimated according to data graphs.
Catalyst Loading amount
(mg cm-2)
electrolyte Overpotential at 10 mA cm-2
(mV)
Tafel
plots
Ref.
Pt/C 0.344 1 M KOH 566 151.2 This work
Pt/C 0.71 0.1 M KOH Above 630 N/A 3
Pt/C 0.1 0.1 M KOH Above 830 N/A 4
Pt/C ~0.2 1 M KOH About 620 (with IR
corrected)
168 5
Pt/C 0.2 1 M KOH 550 118 9
Pt/C ~0.2 0.1 M KOH 556 (with IR corrected) 127 10
Pt/C 0.2 0.1 M KOH 630 149 11
Table s4 Comparison of the electrocatalytic activity of our Commercial Pt/C electrocatalysts with some newly
reported Pt/C electrocatalysts for ORR in alkalic media. Some of the information was not specified in the
literature and was estimated according to data graphs.
Catalyst Loading
amount
(mg cm-2)
Onset
Potential
/V
Cathodic
peak
potential/V
Scan
rate/
mV
s-1
Electrolyt
e
Current
density
(1600rpm
) / mA cm-
2
Tafel
plots
Referen
ce
Pt/C 0.2 1.036 0.925 5 0.1M
KOH
4.93 (0V) 81 This
work
Pt/C 0.2 N/A N/A N/A 0.1M
KOH
About
4.55 (0.2
V)
77 9
Pt/C 0.2 N/A N/A N/A 0.1M
KOH
About 5.1
(0.1 V)
65 5
Pt/C 0.24 About
1.03
About 0.92 5 0.1M
KOH
About 5.6
(0.2 V)
N/A 1
Pt/C 0.2 About
0.95
About 0.79 10 0.1M
KOH
About 5
(0V)
69 11
Reference:
1. Y. Liang, Y. Li, H. Wang, J. Zhou, J. Wang, T. Regier and H. Dai, Nat. Mater., 2011, 10, 780-786.2. Y. Jiao, Y. Zheng, M. Jaroniec and S. Z. Qiao, Chem. Soc. Rev., 2015, 44, 2060-2086.3. B. K. Barman and K. K. Nanda, Green Chem., 2016, 18, 427-432.4. J. S. Li, S. L. Li, Y. J. Tang, M. Han, Z. H. Dai, J. C. Bao and Y. Q. Lan, Chem. Commun., 2015, 51,
2710-2713.5. H. Jiang, Y. Yao, Y. Zhu, Y. Liu, Y. Su, X. Yang and C. Li, ACS Appl. Mater. Interfaces, 2015, 7,
21511-21520.6. K. Huang, K. Bi, J. C. Xu, C. Liang, S. Lin, W. J. Wang, T. Z. Yang, Y. X. Du, R. Zhang, H. J. Yang, D.
Y. Fan, Y. G. Wang and M. Lei, Electrochim Acta, 2015, 174, 172-177.7. D. W. Kim, O. L. Li, P. Pootawang and N. Saito, Rsc Adv, 2014, 4, 16813-16819.8. G. Y. Zhong, H. J. Wang, H. Yu and F. Peng, J Power Sources, 2015, 286, 495-503.9. Y. Y. Bao Yu Xia, Nan Li, Hao BinWu, XiongWen (David) Lou and XinWang, Nat. Energy, 2016,
DOI: 10.1038/nenergy.2015.610. M. R. Gao, X. Cao, Q. Gao, Y. F. Xu, Y. R. Zheng, J. Jiang and S. H. Yu, ACS Nano, 2014, 8, 3970-
3978.11. Y. Liu, H. Jiang, Y. Zhu, X. Yang and C. Li, J Mater Chem A, 2016, 4, 1694-1701.