OR03: UN NOUVEL ESTIMATEUR BAYÉSIEN DE TAUX DE …
6
21 e Congrès de Maîtrise des Risques et Sûreté de Fonctionnement λµ21 Reims 16-18 octobre 2018 OR03: UN NOUVEL ESTIMATEUR BAYÉSIEN DE TAUX DE DÉFAILLANCE POUR TRAITER L’HÉTÉROGÉNÉITÉ DES DONNÉES EXTRAITES D’OREDA OR03: A NEW BAYESIAN ESTIMATOR OF FAILURE RATES TO DEAL WITH HETEROGENEOUS DATA FROM THE OREDA DATABASE Sophie MERCIER and Laurent BORDES Nicolas CLAVÉ and CNRS / UNIV PAU & PAYS ADOUR Pierre-Joseph CACHEUX E2S UPPA, IPRA / LMAP Total S.A., CSTJF Pau, France Avenue Larribau Tel.: +33 (0)5 59 40 75 37 64018 Pau Cedex, France Tel.: +33 (0)5 59 40 75 38 Tel.: +33 (0)5 33 43 32 72 E-mail: [email protected] E-mail: [email protected] E-mail: [email protected] E-mail: [email protected] Résumé Afin de pouvoir réaliser des estimations de taux de défaillance à partir de leur base de données de fiabilité, les membres du JIP OREDA ont élaboré successivement dans les années 1980 puis 1990 deux estimateurs: OR01 (estimateur du Maximum de vraisemblance, très basique) et OR02 (développé par SINTEF en 1997, plus complexe). Entre 2012 et 2016, les représentants de Total à OREDA et l'Université française de Pau et Pays d'Adour ont élaboré un nouvel estimateur : OR03. Les premiers tests comparatifs réalisés début 2017 ont démontré que ce nouvel estimateur semble être plus efficace/robuste que les deux autres estimateurs, particulièrement pour les petits échantillons. En conséquence, le JIP OREDA a décidé de l’implémenter le plus rapidement possible dans son outil d'analyse de données. Summary In order to calculate failure rate estimates from their reliability databank, the OREDA JIP Company members developed successively in the 1980s and in the 1990s two statistical methods: OR01 (Maximum Likelihood estimator i.e. very basic) and OR02 (developed by SINTEF in 1997 and so far more elaborated). From 2012 to 2016, Total’s Rep. to OREDA and the French University of Pau and Pays of Adour worked together on a new estimator: OR03. The innovative aspect of this method is the introduction of maintenance expert judgement in parallel with a strong mathematical background. The first tests performed in early 2017 demonstrated that OR03 seems to be more efficient/robust than the two other estimators, especially for small samples. As a consequence, the OREDA JIP decided to implement it as soon as possible in its data analysis software. Introduction In parallel with data collection activities, the OREDA (Offshore and onshore REliability DAta) JIP (Joint Industry Project) develops a specific software in order to allow the Company members to collect, check and analyse their data. In 2012, the French University of Pau and Pays of Adour (UPPA) performed a study for Total and for the OREDA JIP with regard to failure rate estimation methods in the context of heterogeneous data (ref. to [Bordes and al., 2012]), the main objectives being to: 1. Understand the mathematical background of the two presently used estimators (OR01 and OR02); 2. Propose a new estimator based on all the available information, which might be more efficient than the existing ones; 3. Compare the robustness of the different estimation procedures by testing them on simulated data sets. For each data set extracted from the database, the use of the new failure rate estimator (OR03) requires, as a preliminary step, the correct aggregation of the data into mostly homogeneous classes. In 2016, Total finalized the strategy necessary to their generation, thus allowing for the practical use of OR03. The new estimator has been presented during an OREDA Steering Committee meeting and validated by the Company members. OR03 could now be readily implemented within the data analysis module of the software. The objectives of this article are to present both the statistical estimator developed by the UPPA team and the strategy to generate the classes elaborated by Total. Context OREDA was established in 1981 in cooperation with the Norwegian Petroleum Directorate (now Petroleum Safety Authority Norway). In 1983, the different Oil & Gas companies involved in this project decided to transform OREDA into a JIP, the initial objective being to build a database made up of data on safety equipment only. Then, the perimeter was expended to all offshore and onshore oil & gas production facilities. Nowadays, the current version of the database consists of almost 110,000 failure and maintenance events reported on about 18,200 topside units and more than 2,700 subsea units. The JIP runs in data collection phases normally lasting for 2 to 3 years. The current member list is as follows (member list of Data Collection Phase XII that lasted from 2015 to 2017): BP Exploration Operating Company Ltd., Engie E&P Norge AS, Eni S.p.A Exploration & Production Division, Gassco, Petrobras S.A., Shell Global Solutions UK, Statoil ASA, Total S.A. Communication 7D /1 page 1/6
Transcript of OR03: UN NOUVEL ESTIMATEUR BAYÉSIEN DE TAUX DE …
21e Congrès de Maîtrise des Risques et Sûreté de Fonctionnement λµ21 Reims 16-18 octobre 2018
OR03: UN NOUVEL ESTIMATEUR BAYÉSIEN DE TAUX DE DÉFAILLANCE POUR TRAITER L’HÉTÉROGÉNÉITÉ DES
DONNÉES EXTRAITES D’OREDA
OR03: A NEW BAYESIAN ESTIMATOR OF FAILURE RATES TO DEAL WITH HETEROGENEOUS DATA FROM THE OREDA DATABASE
Sophie MERCIER and Laurent BORDES Nicolas CLAVÉ and CNRS / UNIV PAU & PAYS ADOUR Pierre-Joseph CACHEUX E2S UPPA, IPRA / LMAP Total S.A., CSTJF Pau, France Avenue Larribau Tel.: +33 (0)5 59 40 75 37 64018 Pau Cedex, France Tel.: +33 (0)5 59 40 75 38 Tel.: +33 (0)5 33 43 32 72 E-mail: [email protected] E-mail: [email protected]: [email protected] E-mail: [email protected]
Résumé
Afin de pouvoir réaliser des estimations de taux dedéfaillance à partir de leur base de données de fiabilité, lesmembres du JIP OREDA ont élaboré successivement dans les années 1980 puis 1990 deux estimateurs: OR01 (estimateur du Maximum de vraisemblance, très basique) et OR02 (développé par SINTEF en 1997, plus complexe). Entre 2012 et 2016, les représentants de Total à OREDAet l'Université française de Pau et Pays d'Adour ont élaboré un nouvel estimateur : OR03. Les premiers tests comparatifs réalisés début 2017 ont démontré que ce nouvel estimateur semble être plus efficace/robuste queles deux autres estimateurs, particulièrement pour lespetits échantillons. En conséquence, le JIP OREDA a décidé de l’implémenter le plus rapidement possible dansson outil d'analyse de données.
Summary
In order to calculate failure rate estimates from their reliability databank, the OREDA JIP Company members developed successively in the 1980s and in the 1990s two statistical methods: OR01 (Maximum Likelihood estimator i.e. very basic) and OR02 (developed by SINTEF in 1997 and so far more elaborated). From 2012 to 2016, Total’s Rep. to OREDA and the French University of Pau and Pays of Adour worked together on a new estimator: OR03. The innovative aspect of this method is the introduction of maintenance expert judgement in parallel with a strong mathematical background. The first tests performed in early 2017 demonstrated that OR03 seems to be more efficient/robust than the two other estimators, especially for small samples. As a consequence, the OREDA JIP decided to implement it as soon as possible in its data analysis software.
Introduction
In parallel with data collection activities, the OREDA(Offshore and onshore REliability DAta) JIP (Joint IndustryProject) develops a specific software in order to allow the Company members to collect, check and analyse their data.
In 2012, the French University of Pau and Pays of Adour (UPPA) performed a study for Total and for the OREDA JIP with regard to failure rate estimation methods in the context of heterogeneous data (ref. to [Bordes and al., 2012]), the main objectives being to: 1. Understand the mathematical background of the two
presently used estimators (OR01 and OR02);2. Propose a new estimator based on all the available
information, which might be more efficient than theexisting ones;
3. Compare the robustness of the different estimationprocedures by testing them on simulated data sets.
For each data set extracted from the database, the use of the new failure rate estimator (OR03) requires, as a preliminary step, the correct aggregation of the data into mostly homogeneous classes. In 2016, Total finalized the strategy necessary to their generation, thus allowing for the practical use of OR03. The new estimator has been presented during an OREDA Steering Committee meeting and validated by the Company members. OR03 could now be readily implemented within the data analysis module of the software.
The objectives of this article are to present both the statistical estimator developed by the UPPA team and the strategy to generate the classes elaborated by Total.
Context
OREDA was established in 1981 in cooperation with the Norwegian Petroleum Directorate (now Petroleum Safety Authority Norway). In 1983, the different Oil & Gas companies involved in this project decided to transform OREDA into a JIP, the initial objective being to build a database made up of data on safety equipment only. Then, the perimeter was expended to all offshore and onshore oil & gas production facilities.
Nowadays, the current version of the database consists of almost 110,000 failure and maintenance events reported on about 18,200 topside units and more than 2,700 subsea units. The JIP runs in data collection phases normally lasting for 2 to 3 years. The current member list is as follows (member list of Data Collection Phase XII that lasted from 2015 to 2017): BP Exploration Operating Company Ltd., Engie E&P Norge AS, Eni S.p.A Exploration & Production Division, Gassco, Petrobras S.A., Shell Global Solutions UK, Statoil ASA, Total S.A.
Communication 7D /1 page 1/6
21e Congrès de Maîtrise des Risques et Sûreté de Fonctionnement λµ21 Reims 16-18 octobre 2018
In addition to data collection activities, an IT solution (OREDA software) has been developed in order to, among other things, perform data analyses on the entire database through a dedicated module. The main purpose of this module is to extract samples of observed equipment, according to definite criteria such as geographic area, operational environments, type, manufacturer, etc., and estimate different RAMS (Reliability, Availability, Maintenance and Safety) indicators like failure rates and mean repair times. At present, starting from extracted data clustered into classes, two statistical methods have been developed to estimate failure rates: The first one (OR01) is very basic and does not take into
account any heterogeneity between classes. The second one (OR02), developed by SINTEF in 1997,
is so far more elaborated and takes into account some heterogeneity (ref. to [OREDA Guidelines, 1997]). It is based on both the number of failures and cumulated operational time in each class. However, it does not take into account the size of the different classes.
The majority of the database/software users and of the JIP participants being not completely confident about the performance level of the two existing estimators, Total, as a member of OREDA and leader of the Method Workgroup of the JIP, requested the French University of Pau to analyse the two existing methods and to try to elaborate a new estimator for failure rates.
Method As explained before, the data extracted from the database are aggregated into a certain number of classes (k) , which are considered to be composed of identical equipment items (homogeneous classes). In the following, each class is represented by an index i with
. For the i -th class, the following data are available in the OREDA database: The class size im , which stands for the number of
equipment items in the i -th class; The total number in of failures among all the equipment
items of the i -th class; The cumulated operational time it for all the equipment
items of the i -th class. On that basis, a brief description of the two existing estimators, OR01 and OR02, is proposed below and the new estimator elaborated by UPPA, OR03, is presented. 1 OR01 estimator
The first estimation procedure (OR01) is detailed in Section 2.6.3.1 of [OREDA Guidelines, 1997]. Starting from data n,t( ) = (n
i,t
i)1£i£k
, the estimated failure rate of an equipment item belonging to class i is:
li=
ni
ti
for each i =1,…,k. {1}
This estimate corresponds to the classical Maximum Likelihood (ML) estimator of i , assuming that within the i -th class, the cumulated operational time it is the sum of
in independent and identically distributed (i.i.d.) exponential random times with a common failure rate i . With this method, independent estimates are obtained (one per class) and there is no link between them. Accordingly, if there is only few failure data available in a class, the method can only provide a very rough estimate, which is unsatisfactory. In the extreme case where there is no failure
at all in a class, no estimation result is provided by the method. 2 OR02 estimator
A way to overcome the previously noticed drawback of OR01 method in case of few failure data is to consider a Bayesian estimation procedure, where the rate estimate i for class i is based on the whole data set composed of all classes kiii tn 1, (and not only ii tn , ). The basic idea behind this method is to consider that the failure rates k ,...,1 are some i.i.d. observations of a common random variable (say). The probability density function (p.d.f.) of is called the prior p.d.f.. Lots of different choices are possible for the prior p.d.f., which are sometimes based on some expert advice. The choice made in [OREDA Guidelines, 1997] is to consider that is gamma , distributed, with p.d.f.:
xexxf
1
, {2}
for all 0x , and the following mean and variance, respectively:
{3}
This choice is consistent with the well-known good property of gamma distributions for Bayesian estimation (conjugate distribution). Under the previous assumptions, it can be shown that the conditional distribution of given n
i failures on 0,t
iéë
ùû is a
gamma distribution ii tn , , with meani
i
t
n
.
This distribution is called the posterior distribution: The prior distribution , has been up-dated according to the observed data ii tn , in class i to provide the corresponding posterior distribution. Parameters , next have to be estimated. The method relies on the computation of some moments estimates for (mean: E and variance: V ), for which we refer to Section 2.6.4.1 of [OREDA Guidelines, 1997]. Estimates for , are next derived through:
EV
E ˆˆˆ;ˆ
ˆˆ {4}
based on {3}. A global estimate for on all classes is provided by:
ˆ
ˆˆˆ E {5}
and estimate for i is given by:
,ˆ
ˆˆ
i
ii
t
n
{6}
by plugging ˆ,ˆ into the mean i
i
t
n
of the a posteriori
distribution ii tn , . Credible intervals can be
derived for and the li's , we refer to [OREDA Guidelines,
1997] for more details.
Communication 7D /1 page 2/6
21e Congrès de Maîtrise des Risques et Sûreté de Fonctionnement λµ21 Reims 16-18 octobre 2018
Contrary to OR01, the estimates obtained through OR02 allow to deal with the case of few failure data in a class and even with the case of no failure data at all (simply put 0inin {6}). However, the estimates obtained through OR02 do not take the class sizes m
i for i =1,…,k into account.
Hence all the available information is not taken into account in this estimation procedure. Also, from an intuitive point of view, one could expect that the larger a class size is, the more precise the estimates should be. From this point of view, the estimates provided by OR02 are not completely convincing either. 3 OR03 estimator
Based on the previous remarks on OR02, the idea of OR03 hence is to take into account the class sizes m
i for i =1,…,k in the estimating procedure. For that, a new
Bayesian method is proposed, where, for each ki ,,1 , the common failure rate i of the items in class i is assumed to be an observation of a random variable i , whose prior distribution depends on im . More specifically, the random variable i is assumed to be gamma distributed ii , , with ii m and b
i= bm
i.. The i
's are assumed to be independent random variables. Under the previous assumptions, we have:
. {7}
Then, may be interpreted as a mean (global) failure
rate among all classes. We also have:
. {8}
This shows that, as expected, the larger the class size im is, the smaller the variance of i is. This means that the estimate of ii E will be more precise for a larger class, which is coherent with intuition. Using similar arguments as for OR02, we can show that the posterior distribution of i given ( im , it , in ) is the gamma distribution iiii tmnm , . This provides:
{9}
{10}
and the following estimate for l
i:
.ˆ
i
i
i
i
m
t
m
n
i
{11}
The quantity n
im
i represents the mean number of failures
per equipment unit among class i , whereas ti
mi
represents the mean accumulated operational time per equipment unit in the same class. Here again, this interpretation sounds conform to intuition. The next point is to see how to estimate , . A similar moment method as in OR02 can be used. We here prefer use a Maximum Likelihood method, which can be expected to be a little more robust. (Both have been tested, however). The parameter , hence is estimated through maximizing:
L a,b | t,m( ) =
i=1
k
ÕfN
i
ni| t
i,a,b ,m
i( )
=
i=1
k
ÕG n
i+am
i( )n
i!G am
i( )b
b +ti
mi
æ
è
çç
ö
ø
÷÷
ami t
i
mi
b +ti
mi
æ
è
çç
ö
ø
÷÷
ni {12}
Once and have been estimated, we derive:
i
i
i
i
m
t
m
n
i
ˆ
ˆˆ {13}
by plugin. This entails that an approximate distribution of i is:
iiii tmnm ˆ,ˆ . Taking 𝜀 in [0,1/2] , this allows to derive the following approximated credible interval with level 1 for i :
qam
i+n
i,bm
i+t
i
G(e / 2);q
ami+n
i,bm
i+t
i
G(1-e / 2)é
ëùû {14}
where )(,
q stands for the -quantile of the ,distribution. Just as for OR02 method, the estimates obtained through OR03 allow to deal with the case of few failure data in a class and even with the case of no failure data at all (simply put 0in in {11}). Also, it allows to take into account the class sizes in a consistent way. 4 Generation of classes in the OR03 method
In the OR02 estimating method, the only parameter considered to generate the classes is the Installation ID (IDentification number). This criterion, even if it is the only one, allows to take into account implicitly several parameters (geographic location, plant type, product handled/processed, etc.). The idea for OR03 is to use maintenance expert judgement to select the best homogeneity criteria and define a specific generation policy of the classes for each equipment type. For each type, 2 to 5 criteria are to be selected and then prioritized. For example, for a given sample of fire and gas detectors, the classes shall be generated by sorting the items: First, by Design class (Smoke/Combustion, Heat,
Flame, Manual pushbutton...); Secondly, by System (Gas detection system or Fire
detection system); Thirdly, by External environmental criticality (Low,
Medium or High); Etc. The main rules of the generation policy of the classes are as follows: The algorithm is stopped as soon as the generated
classes are not enough populated (conditions can be defined);
If a criteria gives classes that are not enough populated, the next criteria is tested, if any;
If all the defined criteria give classes that are not enough populated, the Installation ID is used (as per OR02);
The mathematical formulae of the OR03 estimator is applied to the final partition of the data.
In parallel with the specification and the prioritization of the homogeneity criteria, a set (or combination) of conditions to determine whether or not a given sample is enough populated can be defined, though this is not mandatory.
Communication 7D /1 page 3/6
21e Congrès de Maîtrise des Risques et Sûreté de Fonctionnement λµ21 Reims 16-18 octobre 2018
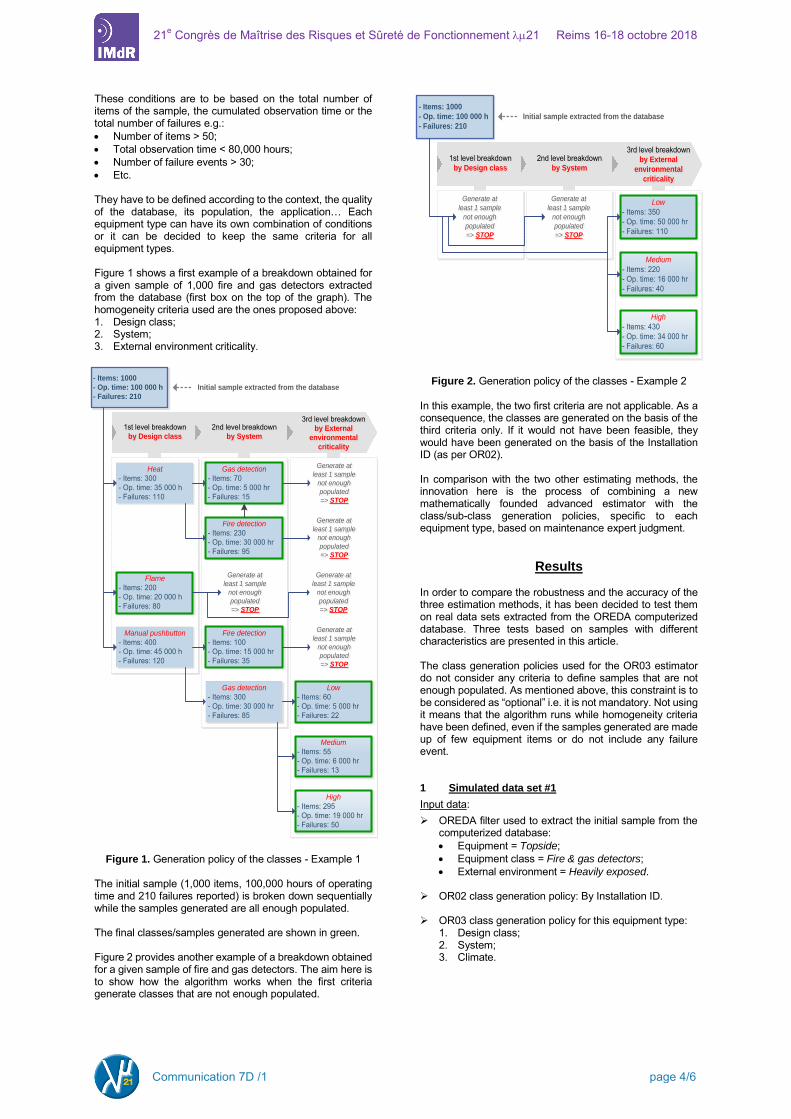
These conditions are to be based on the total number of items of the sample, the cumulated observation time or the total number of failures e.g.: Number of items > 50; Total observation time < 80,000 hours; Number of failure events > 30; Etc. They have to be defined according to the context, the quality of the database, its population, the application… Each equipment type can have its own combination of conditions or it can be decided to keep the same criteria for all equipment types. Figure 1 shows a first example of a breakdown obtained for a given sample of 1,000 fire and gas detectors extracted from the database (first box on the top of the graph). The homogeneity criteria used are the ones proposed above: 1. Design class; 2. System; 3. External environment criticality.
- Items: 1000
- Op. time: 100 000 h
- Failures: 210
1st level breakdown by Design class
1st level breakdown by Design class
2nd level breakdown by System
2nd level breakdown by System
3rd level breakdown by External
environmental
criticality
3rd level breakdown by External
environmental
criticality
Heat
- Items: 300- Op. time: 35 000 h- Failures: 110
Flame
- Items: 200- Op. time: 20 000 h- Failures: 80
Manual pushbutton
- Items: 400- Op. time: 45 000 h- Failures: 120
Gas detection
- Items: 70- Op. time: 5 000 hr- Failures: 15
Fire detection
- Items: 230- Op. time: 30 000 hr- Failures: 95
Low
- Items: 60- Op. time: 5 000 hr- Failures: 22
Medium
- Items: 55- Op. time: 6 000 hr- Failures: 13
High
- Items: 295- Op. time: 19 000 hr- Failures: 50
Gas detection
- Items: 300- Op. time: 30 000 hr- Failures: 85
Fire detection
- Items: 100- Op. time: 15 000 hr- Failures: 35
Generate at
least 1 sample
not enough
populated
=> STOP
Generate at
least 1 sample
not enough
populated
=> STOP
Generate at
least 1 sample
not enough
populated
=> STOP
Generate at
least 1 sample
not enough
populated
=> STOP
Generate at
least 1 sample
not enough
populated
=> STOP
Generate at
least 1 sample
not enough
populated
=> STOP
Generate at
least 1 sample
not enough
populated
=> STOP
Generate at
least 1 sample
not enough
populated
=> STOP
Initial sample extracted from the database
Generate at
least 1 sample
not enough
populated
=> STOP
Generate at
least 1 sample
not enough
populated
=> STOP
Figure 1. Generation policy of the classes - Example 1
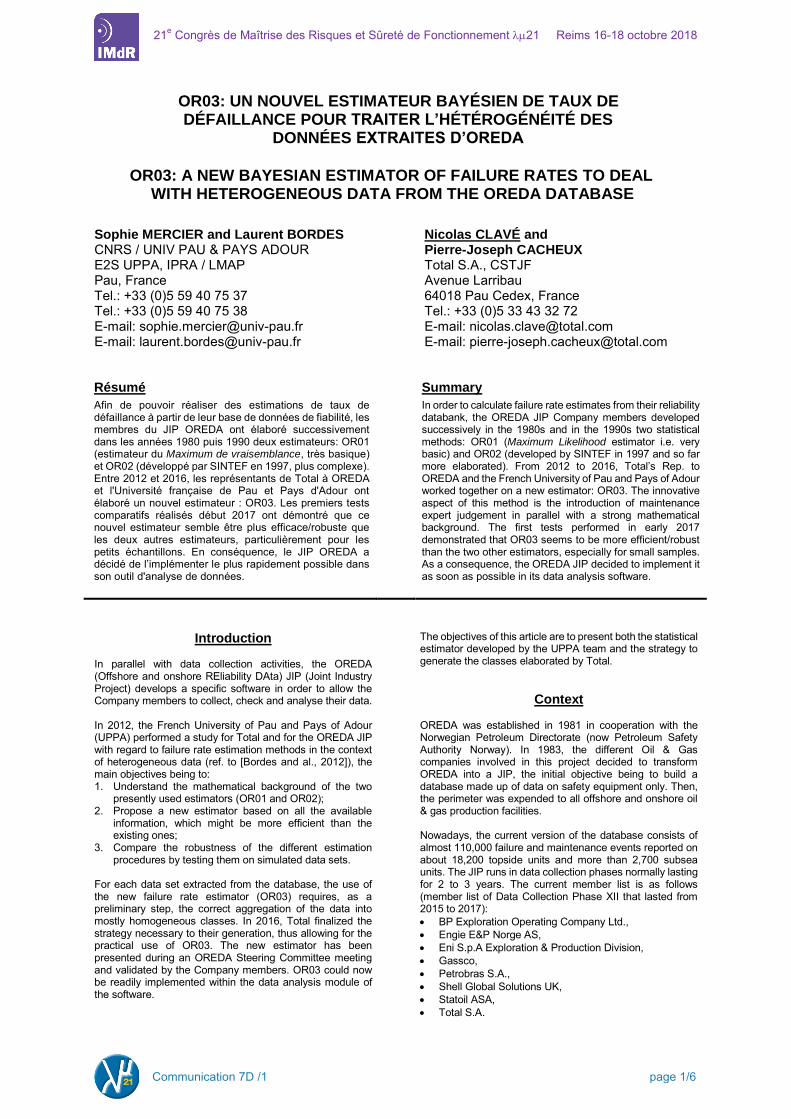
The initial sample (1,000 items, 100,000 hours of operating time and 210 failures reported) is broken down sequentially while the samples generated are all enough populated. The final classes/samples generated are shown in green. Figure 2 provides another example of a breakdown obtained for a given sample of fire and gas detectors. The aim here is to show how the algorithm works when the first criteria generate classes that are not enough populated.
- Items: 1000
- Op. time: 100 000 h
- Failures: 210
1st level breakdown by Design class
1st level breakdown by Design class
2nd level breakdown by System
2nd level breakdown by System
3rd level breakdown by External
environmental
criticality
3rd level breakdown by External
environmental
criticality
Low
- Items: 350- Op. time: 50 000 hr- Failures: 110
Medium
- Items: 220- Op. time: 16 000 hr- Failures: 40
High
- Items: 430- Op. time: 34 000 hr- Failures: 60
Generate at
least 1 sample
not enough
populated
=> STOP
Generate at
least 1 sample
not enough
populated
=> STOP
Initial sample extracted from the database
Generate at
least 1 sample
not enough
populated
=> STOP
Generate at
least 1 sample
not enough
populated
=> STOP
Figure 2. Generation policy of the classes - Example 2
In this example, the two first criteria are not applicable. As a consequence, the classes are generated on the basis of the third criteria only. If it would not have been feasible, they would have been generated on the basis of the Installation ID (as per OR02). In comparison with the two other estimating methods, the innovation here is the process of combining a new mathematically founded advanced estimator with the class/sub-class generation policies, specific to each equipment type, based on maintenance expert judgment.
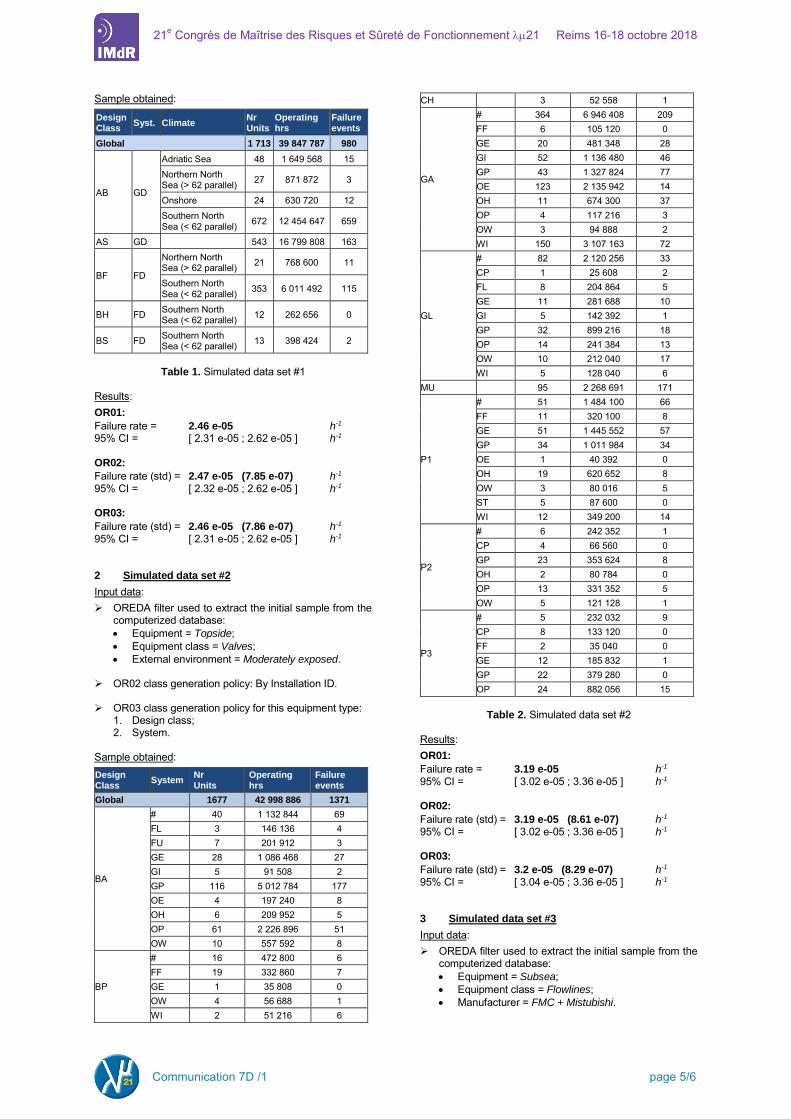
Results In order to compare the robustness and the accuracy of the three estimation methods, it has been decided to test them on real data sets extracted from the OREDA computerized database. Three tests based on samples with different characteristics are presented in this article. The class generation policies used for the OR03 estimator do not consider any criteria to define samples that are not enough populated. As mentioned above, this constraint is to be considered as “optional” i.e. it is not mandatory. Not using it means that the algorithm runs while homogeneity criteria have been defined, even if the samples generated are made up of few equipment items or do not include any failure event. 1 Simulated data set #1
Input data: OREDA filter used to extract the initial sample from the
computerized database: Equipment = Topside; Equipment class = Fire & gas detectors; External environment = Heavily exposed.
OR02 class generation policy: By Installation ID.
OR03 class generation policy for this equipment type:
1. Design class; 2. System; 3. Climate.
Communication 7D /1 page 4/6
21e Congrès de Maîtrise des Risques et Sûreté de Fonctionnement λµ21 Reims 16-18 octobre 2018
Sample obtained: Design Class Syst. Climate Nr
Units Operating hrs
Failure events
Global 1 713 39 847 787 980
AB GD
Adriatic Sea 48 1 649 568 15 Northern North Sea (> 62 parallel) 27 871 872 3
Onshore 24 630 720 12 Southern North Sea (< 62 parallel) 672 12 454 647 659
AS GD 543 16 799 808 163
BF FD
Northern North Sea (> 62 parallel) 21 768 600 11
Southern North Sea (< 62 parallel) 353 6 011 492 115
BH FD Southern North Sea (< 62 parallel) 12 262 656 0
BS FD Southern North Sea (< 62 parallel) 13 398 424 2
Table 1. Simulated data set #1
Results: OR01:
Failure rate = 2.46 e-05 h-1
95% CI = [ 2.31 e-05 ; 2.62 e-05 ] h-1 OR02:
Failure rate (std) = 2.47 e-05 (7.85 e-07) h-1 95% CI = [ 2.32 e-05 ; 2.62 e-05 ] h-1 OR03:
Failure rate (std) = 2.46 e-05 (7.86 e-07) h-1 95% CI = [ 2.31 e-05 ; 2.62 e-05 ] h-1 2 Simulated data set #2
Input data: OREDA filter used to extract the initial sample from the
computerized database: Equipment = Topside; Equipment class = Valves; External environment = Moderately exposed.
OR02 class generation policy: By Installation ID. OR03 class generation policy for this equipment type:
1. Design class; 2. System.
Sample obtained: Design Class System Nr
Units Operating hrs
Failure events
Global 1677 42 998 886 1371
BA
# 40 1 132 844 69 FL 3 146 136 4 FU 7 201 912 3 GE 28 1 086 468 27 GI 5 91 508 2 GP 116 5 012 784 177 OE 4 197 240 8 OH 6 209 952 5 OP 61 2 226 896 51 OW 10 557 592 8
BP
# 16 472 800 6 FF 19 332 860 7 GE 1 35 808 0 OW 4 56 688 1 WI 2 51 216 6
CH 3 52 558 1
GA
# 364 6 946 408 209 FF 6 105 120 0 GE 20 481 348 28 GI 52 1 136 480 46 GP 43 1 327 824 77 OE 123 2 135 942 14 OH 11 674 300 37 OP 4 117 216 3 OW 3 94 888 2 WI 150 3 107 163 72
GL
# 82 2 120 256 33 CP 1 25 608 2 FL 8 204 864 5 GE 11 281 688 10 GI 5 142 392 1 GP 32 899 216 18 OP 14 241 384 13 OW 10 212 040 17 WI 5 128 040 6
MU 95 2 268 691 171
P1
# 51 1 484 100 66 FF 11 320 100 8 GE 51 1 445 552 57 GP 34 1 011 984 34 OE 1 40 392 0 OH 19 620 652 8 OW 3 80 016 5 ST 5 87 600 0 WI 12 349 200 14
P2
# 6 242 352 1 CP 4 66 560 0 GP 23 353 624 8 OH 2 80 784 0 OP 13 331 352 5 OW 5 121 128 1
P3
# 5 232 032 9 CP 8 133 120 0 FF 2 35 040 0 GE 12 185 832 1 GP 22 379 280 0 OP 24 882 056 15
Table 2. Simulated data set #2
Results: OR01:
Failure rate = 3.19 e-05 h-1
95% CI = [ 3.02 e-05 ; 3.36 e-05 ] h-1 OR02:
Failure rate (std) = 3.19 e-05 (8.61 e-07) h-1 95% CI = [ 3.02 e-05 ; 3.36 e-05 ] h-1 OR03:
Failure rate (std) = 3.2 e-05 (8.29 e-07) h-1 95% CI = [ 3.04 e-05 ; 3.36 e-05 ] h-1 3 Simulated data set #3
Input data: OREDA filter used to extract the initial sample from the
computerized database: Equipment = Subsea; Equipment class = Flowlines; Manufacturer = FMC + Mistubishi.
Communication 7D /1 page 5/6
21e Congrès de Maîtrise des Risques et Sûreté de Fonctionnement λµ21 Reims 16-18 octobre 2018
OR02 class generation policy: By Installation ID.
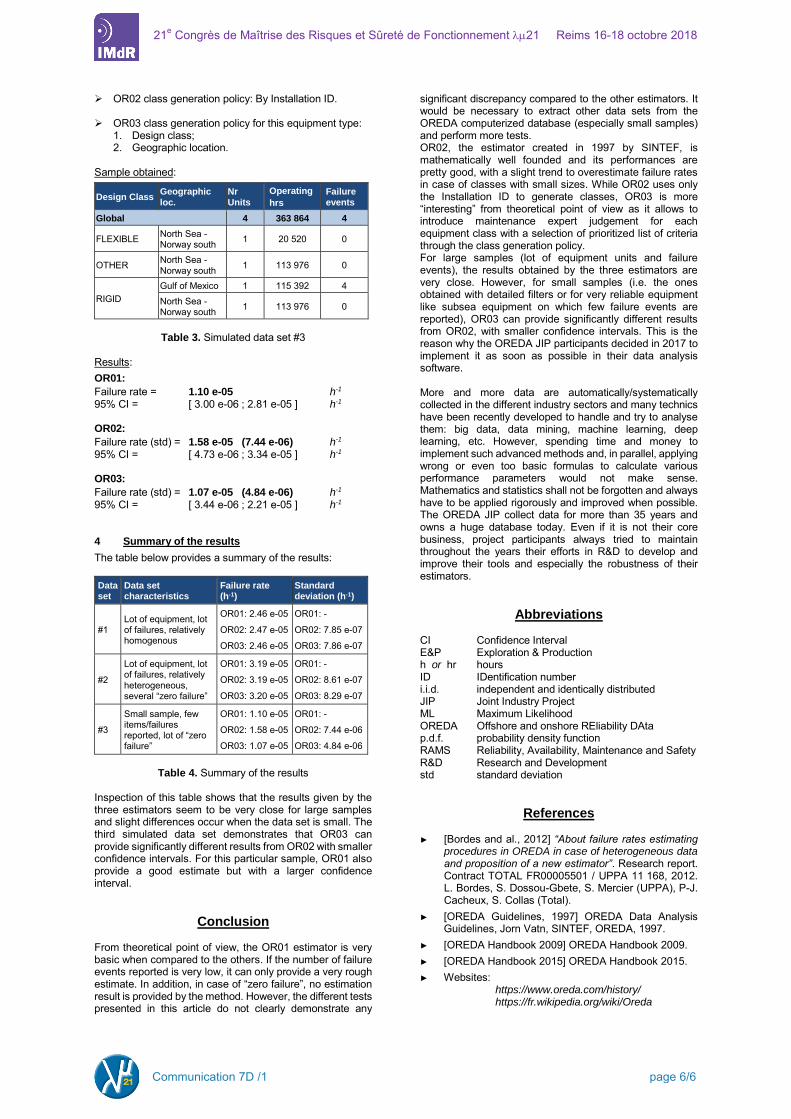
OR03 class generation policy for this equipment type: 1. Design class; 2. Geographic location.
Sample obtained:
Design Class Geographic loc.
Nr Units
Operating
hrs Failure events
Global 4 363 864 4
FLEXIBLE North Sea - Norway south 1 20 520 0
OTHER North Sea - Norway south 1 113 976 0
RIGID Gulf of Mexico 1 115 392 4 North Sea - Norway south 1 113 976 0
Table 3. Simulated data set #3
Results: OR01:
Failure rate = 1.10 e-05 h-1 95% CI = [ 3.00 e-06 ; 2.81 e-05 ] h-1 OR02:
Failure rate (std) = 1.58 e-05 (7.44 e-06) h-1 95% CI = [ 4.73 e-06 ; 3.34 e-05 ] h-1 OR03:
Failure rate (std) = 1.07 e-05 (4.84 e-06) h-1 95% CI = [ 3.44 e-06 ; 2.21 e-05 ] h-1 4 Summary of the results
The table below provides a summary of the results: Data set
Data set characteristics
Failure rate (h-1)
Standard deviation (h-1)
#1 Lot of equipment, lot of failures, relatively homogenous
OR01: 2.46 e-05
OR02: 2.47 e-05
OR03: 2.46 e-05
OR01: -
OR02: 7.85 e-07
OR03: 7.86 e-07
#2
Lot of equipment, lot of failures, relatively heterogeneous, several “zero failure”
OR01: 3.19 e-05
OR02: 3.19 e-05
OR03: 3.20 e-05
OR01: -
OR02: 8.61 e-07
OR03: 8.29 e-07
#3
Small sample, few items/failures reported, lot of “zero failure”
OR01: 1.10 e-05
OR02: 1.58 e-05
OR03: 1.07 e-05
OR01: -
OR02: 7.44 e-06
OR03: 4.84 e-06
Table 4. Summary of the results Inspection of this table shows that the results given by the three estimators seem to be very close for large samples and slight differences occur when the data set is small. The third simulated data set demonstrates that OR03 can provide significantly different results from OR02 with smaller confidence intervals. For this particular sample, OR01 also provide a good estimate but with a larger confidence interval.
Conclusion From theoretical point of view, the OR01 estimator is very basic when compared to the others. If the number of failure events reported is very low, it can only provide a very rough estimate. In addition, in case of “zero failure”, no estimation result is provided by the method. However, the different tests presented in this article do not clearly demonstrate any
significant discrepancy compared to the other estimators. It would be necessary to extract other data sets from the OREDA computerized database (especially small samples) and perform more tests. OR02, the estimator created in 1997 by SINTEF, is mathematically well founded and its performances are pretty good, with a slight trend to overestimate failure rates in case of classes with small sizes. While OR02 uses only the Installation ID to generate classes, OR03 is more “interesting” from theoretical point of view as it allows to introduce maintenance expert judgement for each equipment class with a selection of prioritized list of criteria through the class generation policy. For large samples (lot of equipment units and failure events), the results obtained by the three estimators are very close. However, for small samples (i.e. the ones obtained with detailed filters or for very reliable equipment like subsea equipment on which few failure events are reported), OR03 can provide significantly different results from OR02, with smaller confidence intervals. This is the reason why the OREDA JIP participants decided in 2017 to implement it as soon as possible in their data analysis software. More and more data are automatically/systematically collected in the different industry sectors and many technics have been recently developed to handle and try to analyse them: big data, data mining, machine learning, deep learning, etc. However, spending time and money to implement such advanced methods and, in parallel, applying wrong or even too basic formulas to calculate various performance parameters would not make sense. Mathematics and statistics shall not be forgotten and always have to be applied rigorously and improved when possible. The OREDA JIP collect data for more than 35 years and owns a huge database today. Even if it is not their core business, project participants always tried to maintain throughout the years their efforts in R&D to develop and improve their tools and especially the robustness of their estimators.
Abbreviations CI Confidence Interval E&P Exploration & Production h or hr hours ID IDentification number i.i.d. independent and identically distributed JIP Joint Industry Project ML Maximum Likelihood OREDA Offshore and onshore REliability DAta p.d.f. probability density function RAMS Reliability, Availability, Maintenance and Safety R&D Research and Development std standard deviation
References ► [Bordes and al., 2012] “About failure rates estimating
procedures in OREDA in case of heterogeneous data and proposition of a new estimator”. Research report. Contract TOTAL FR00005501 / UPPA 11 168, 2012. L. Bordes, S. Dossou-Gbete, S. Mercier (UPPA), P-J. Cacheux, S. Collas (Total).
► [OREDA Guidelines, 1997] OREDA Data Analysis Guidelines, Jorn Vatn, SINTEF, OREDA, 1997.
► [OREDA Handbook 2009] OREDA Handbook 2009. ► [OREDA Handbook 2015] OREDA Handbook 2015. ► Websites:
https://www.oreda.com/history/ https://fr.wikipedia.org/wiki/Oreda
Communication 7D /1 page 6/6