Optimization of Wool and Silk Blend Dyeing Using Α ... · 1/13 itation: Deoyoti , Chanchal , sim K...
13
1/13 Citation: Debojyoti G, Chanchal M, Asim K RC. Optimization of Wool and Silk Blend Dyeing Using Α-Bromoacrylamido Reactive Dyes by Response Surface Methodology. Trends in Textile & Fash Design 1(4)-2018. LTTFD MS.ID.000120. UPINE PUBLISHERS Open Access L Latest Trends in Textile and Fashion Designing Research Article Optimization of Wool and Silk Blend Dyeing Using α-Bromoacrylamido Reactive Dyes by Response Surface Methodology Debojyoti Ganguly 1 , Chanchal Mondal 2 and Asim Kumar Roy Choudhury 3 * 1 Department of Textile Design, National Institute of Fashion Technology, India 2 Department of Chemical Engineering. Jadavpur University, India 3 KPS Institute of Polytechnic Belmuri, India Received: February 02, 2018; Published: February 16, 2018 *Corresponding author: Asim Kumar Roy Choudhury, Principal, KPS Institute of Polytechnic, Belmuri, Ex-professor, Govt. College of Engineering and Textile Technology, Serampore, Dt. Hooghly (W.B.) India, Tel: ; Email: Introduction Wool and silk fibre are dyed together in a single bath dyeing process using three different types of α Bromoacrylamido reactive dye. To improve the solid dyeing effect of wool and silk fibre, the blend fibres are dyed together with different pH and sodium sulphate concentration and percentage of dyestuff. It is observed that there is lot of difference between the wool and silk fibres colour strength after the dyeing completed. Wool fibres are looking darker and the silk fibres are lighter when they are dyed together in a single bath dyeing process. To reduce the colour difference between the blend components, wool fibres were pre-treated with a commercial syntan Mesitol HWS at different pH and concentrations. After that, the syntan-treated fibres were dyed with silk in presence of sodium sulphate to achieve the solid dyeing effect. Here in this paper the optimization of the dyeing process is done by using Response Surface Methodology. It was developed by Box and Wilson in the 1950. In this process a graphical perspective is generated after fitting the mathematical model. For multifactor experimental design, where “one-factor-at-a time” method traditionally used at the time of doing experimenters has lots of limitations because it generates large quantities of data, time requirement is very high, as well as doing no of experiments are lots of time consuming and expensive, and especially because it will not give any idea about the interactions among factors which have a great influence on the responses. In contrast, the response surface methodology (RSM) is a powerful technique for testing multiple process variables because fewer experimental trials are needed when compared with the “one-factor-at-a-time” method. In addition, significant interactions between the variables can be easily identified and quantified with this technique. The optimization of optimum conditions or process parameters is therefore possible and widely performed by using a central composite design (CCD) or a Box–Wilson design [1]. This paper concerns the optimization of syntan and sodium sulphate concentration as well as pH of the dye bath using response surface methodology. To explore the influence of syntan and sodium sulphate concentration on the dyeing of wool and silk blend as well as to study one experimental conditions, i.e. pH of the dye bath at the time of dyeing process and on dyed fibres colour value, a Central Composite Design (CCD) of three factors and three levels is selected in this experiment [2]. In this way, a CCD is used to estimate the main synergistic effects of syntan and sodium sulphate concentration and pH of the dye bath. Response surfaces are drawn from the empirical Abstract Dyeing of wool and silk fibre blend in a single bath dyeing process is very difficult process due different absorption of dyestuff by these fibres. Wool is become darker than the silk fibre. Here wool fibre is first pretreated with a commercial syntan and then dyed with silk fibre using α bromoacrylamido reactive dyes. The process of dyeing is optimized my Central composite design using response surface methodology. Keywords: Syntan; Response surface methodology; Silk; Wool; Reactive dyes
Transcript of Optimization of Wool and Silk Blend Dyeing Using Α ... · 1/13 itation: Deoyoti , Chanchal , sim K...
1/13Citation: Debojyoti G, Chanchal M, Asim K RC. Optimization of Wool and Silk Blend Dyeing Using Α-Bromoacrylamido Reactive Dyes by
Response Surface Methodology. Trends in Textile & Fash Design 1(4)-2018. LTTFD MS.ID.000120.
UPINE PUBLISHERS Open Access
L Latest Trends in Textile and Fashion Designing
Research Article
Optimization of Wool and Silk Blend Dyeing Using α-Bromoacrylamido Reactive Dyes by Response Surface
MethodologyDebojyoti Ganguly1, Chanchal Mondal2 and Asim Kumar Roy Choudhury3*1Department of Textile Design, National Institute of Fashion Technology, India
2Department of Chemical Engineering. Jadavpur University, India
3KPS Institute of Polytechnic Belmuri, India
Received: February 02, 2018; Published: February 16, 2018
*Corresponding author: Asim Kumar Roy Choudhury, Principal, KPS Institute of Polytechnic, Belmuri, Ex-professor, Govt. College of Engineering and Textile Technology, Serampore, Dt. Hooghly (W.B.) India, Tel: ; Email:
Introduction Wool and silk fibre are dyed together in a single bath dyeing
process using three different types of α Bromoacrylamido reactive dye. To improve the solid dyeing effect of wool and silk fibre, the blend fibres are dyed together with different pH and sodium sulphate concentration and percentage of dyestuff. It is observed that there is lot of difference between the wool and silk fibres colour strength after the dyeing completed. Wool fibres are looking darker and the silk fibres are lighter when they are dyed together in a single bath dyeing process. To reduce the colour difference between the blend components, wool fibres were pre-treated with a commercial syntan Mesitol HWS at different pH and concentrations. After that, the syntan-treated fibres were dyed with silk in presence of sodium sulphate to achieve the solid dyeing effect.
Here in this paper the optimization of the dyeing process is done by using Response Surface Methodology. It was developed by Box and Wilson in the 1950. In this process a graphical perspective is generated after fitting the mathematical model. For multifactor experimental design, where “one-factor-at-a time” method traditionally used at the time of doing experimenters has lots of limitations because it generates large quantities of data, time requirement is very high, as well as doing no of experiments are
lots of time consuming and expensive, and especially because it will not give any idea about the interactions among factors which have a great influence on the responses.
In contrast, the response surface methodology (RSM) is a powerful technique for testing multiple process variables because fewer experimental trials are needed when compared with the “one-factor-at-a-time” method. In addition, significant interactions between the variables can be easily identified and quantified with this technique. The optimization of optimum conditions or process parameters is therefore possible and widely performed by using a central composite design (CCD) or a Box–Wilson design [1].
This paper concerns the optimization of syntan and sodium sulphate concentration as well as pH of the dye bath using response surface methodology. To explore the influence of syntan and sodium sulphate concentration on the dyeing of wool and silk blend as well as to study one experimental conditions, i.e. pH of the dye bath at the time of dyeing process and on dyed fibres colour value, a Central Composite Design (CCD) of three factors and three levels is selected in this experiment [2]. In this way, a CCD is used to estimate the main synergistic effects of syntan and sodium sulphate concentration and pH of the dye bath. Response surfaces are drawn from the empirical
Abstract
Dyeing of wool and silk fibre blend in a single bath dyeing process is very difficult process due different absorption of dyestuff by these fibres. Wool is become darker than the silk fibre. Here wool fibre is first pretreated with a commercial syntan and then dyed with silk fibre using α bromoacrylamido reactive dyes. The process of dyeing is optimized my Central composite design using response surface methodology.
Keywords: Syntan; Response surface methodology; Silk; Wool; Reactive dyes
Trends in Textile & Fash Design
2/13Citation: Debojyoti G, Chanchal M, Asim K RC. Optimization of Wool and Silk Blend Dyeing Using Α-Bromoacrylamido Reactive Dyes by Response Surface Methodology. Trends in Textile & Fash Design 1(4)-2018. LTTFD MS.ID.000120.
Copyrights@ Asim Kumar Roy Choudhury, et al.
models and this enabled us to determine the optimal conditions by graphic optimization performed in the “Statistica” software, and to visualize the method robustness.
Materials and MethodsMaterials
19.5µ fineness super wash wool with Hercosett processed [3] in the industry to impart anti felt properties and shrink proof behaviour and degummed & bleached mulberry silk with 11 denier fineness is used in these experiments. Both the wool and silk fibres are washed with non-ionic detergent and sodium bicarbonate (pH 7.5) at 50oC for 15 min which are followed by a cold wash to make it ready for dyeing. For every trial 5 gm sample of both the fibre blend which consists of 4 gm wool and 1 gm silk to maintain 80:20 blend composition are dyed. Both the fibres are kept separately in a polyester pouch (mesh size 120) through which the dye solution could pass very easily and kept in dye bath at the time of dyeing. So that at the time of dyeing, they should not be mixed together and after the dyeing process, analysis of the sample can be carried out without any error.
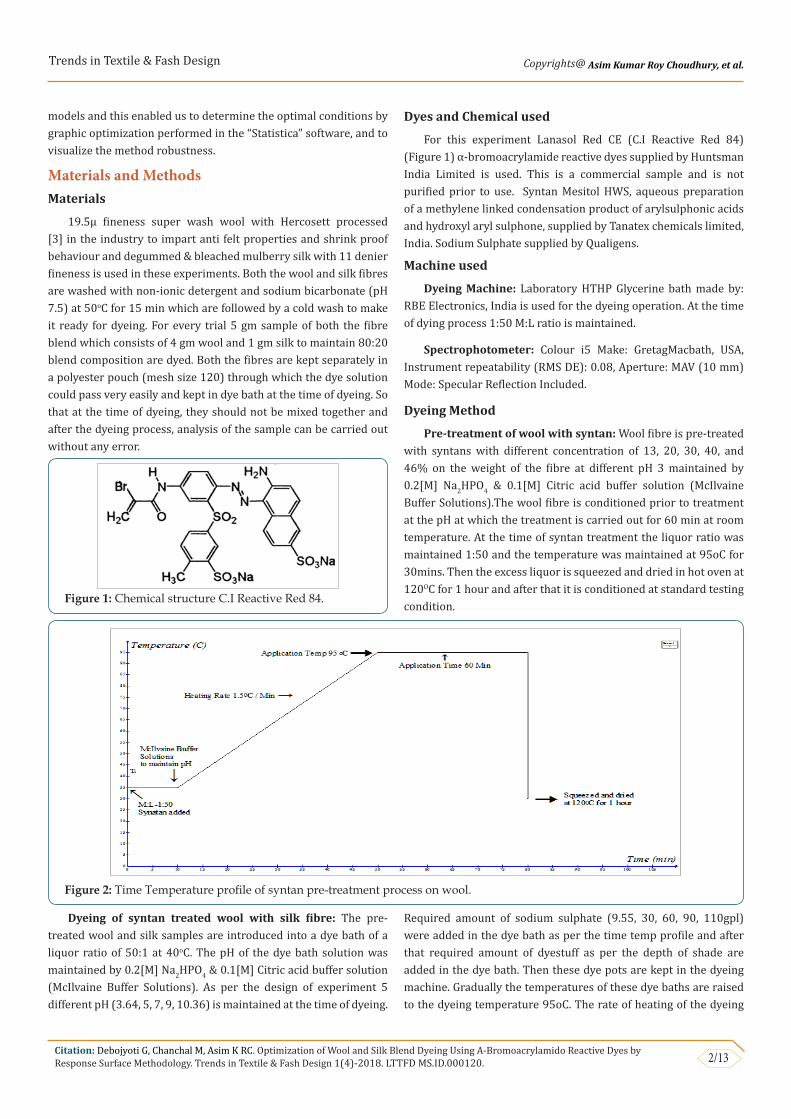
Figure 1: Chemical structure C.I Reactive Red 84.
Dyes and Chemical used
For this experiment Lanasol Red CE (C.I Reactive Red 84) (Figure 1) α-bromoacrylamide reactive dyes supplied by Huntsman India Limited is used. This is a commercial sample and is not purified prior to use. Syntan Mesitol HWS, aqueous preparation of a methylene linked condensation product of arylsulphonic acids and hydroxyl aryl sulphone, supplied by Tanatex chemicals limited, India. Sodium Sulphate supplied by Qualigens.
Machine used
Dyeing Machine: Laboratory HTHP Glycerine bath made by: RBE Electronics, India is used for the dyeing operation. At the time of dying process 1:50 M:L ratio is maintained.
Spectrophotometer: Colour i5 Make: GretagMacbath, USA, Instrument repeatability (RMS DE): 0.08, Aperture: MAV (10 mm) Mode: Specular Reflection Included.
Dyeing Method
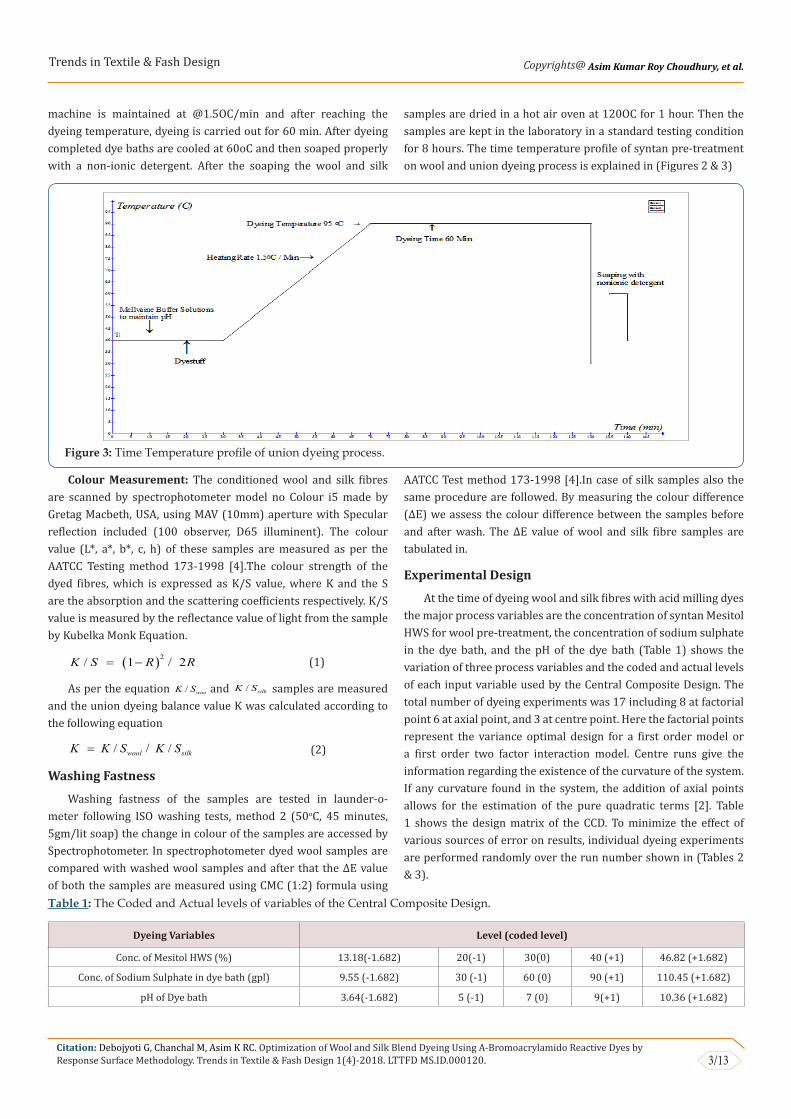
Pre-treatment of wool with syntan: Wool fibre is pre-treated with syntans with different concentration of 13, 20, 30, 40, and 46% on the weight of the fibre at different pH 3 maintained by 0.2[M] Na2HPO4 & 0.1[M] Citric acid buffer solution (McIlvaine Buffer Solutions).The wool fibre is conditioned prior to treatment at the pH at which the treatment is carried out for 60 min at room temperature. At the time of syntan treatment the liquor ratio was maintained 1:50 and the temperature was maintained at 95oC for 30mins. Then the excess liquor is squeezed and dried in hot oven at 120OC for 1 hour and after that it is conditioned at standard testing condition.
Figure 2: Time Temperature profile of syntan pre-treatment process on wool.
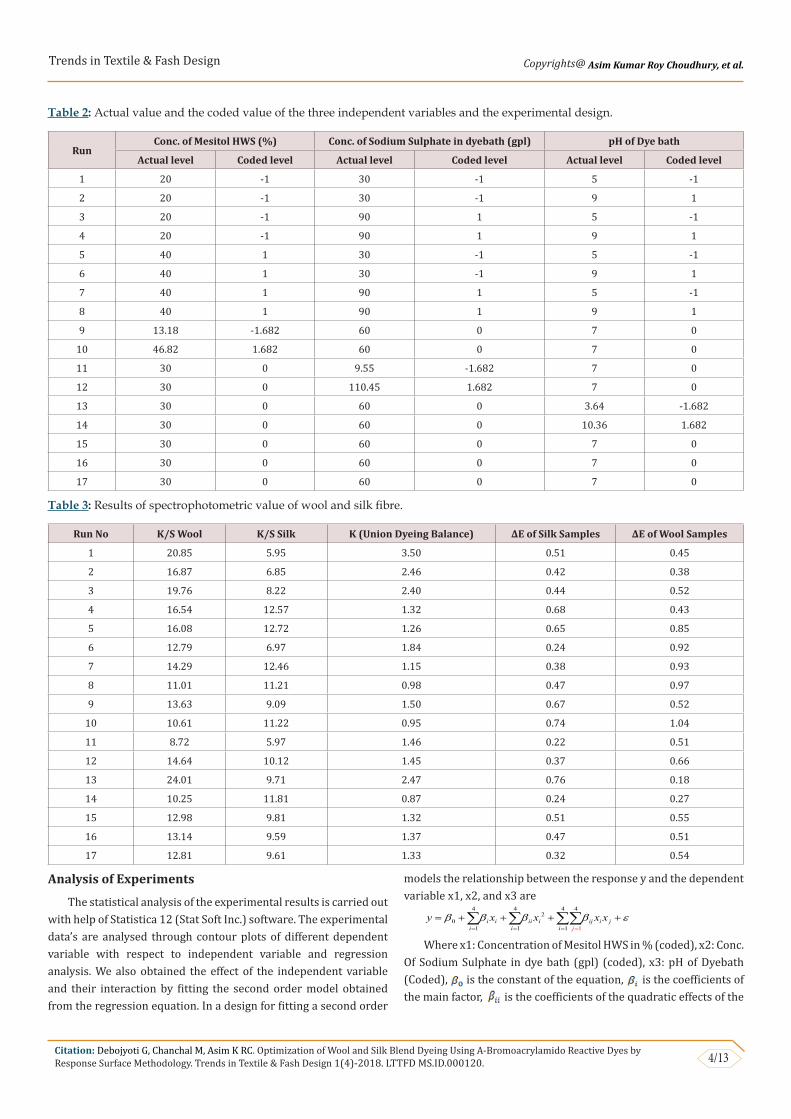
Dyeing of syntan treated wool with silk fibre: The pre-treated wool and silk samples are introduced into a dye bath of a liquor ratio of 50:1 at 40oC. The pH of the dye bath solution was maintained by 0.2[M] Na2HPO4 & 0.1[M] Citric acid buffer solution (McIlvaine Buffer Solutions). As per the design of experiment 5 different pH (3.64, 5, 7, 9, 10.36) is maintained at the time of dyeing.
Required amount of sodium sulphate (9.55, 30, 60, 90, 110gpl) were added in the dye bath as per the time temp profile and after that required amount of dyestuff as per the depth of shade are added in the dye bath. Then these dye pots are kept in the dyeing machine. Gradually the temperatures of these dye baths are raised to the dyeing temperature 95oC. The rate of heating of the dyeing
Trends in Textile & Fash Design
3/13Citation: Debojyoti G, Chanchal M, Asim K RC. Optimization of Wool and Silk Blend Dyeing Using Α-Bromoacrylamido Reactive Dyes by
Response Surface Methodology. Trends in Textile & Fash Design 1(4)-2018. LTTFD MS.ID.000120.
Copyrights@ Asim Kumar Roy Choudhury, et al.
machine is maintained at @1.5OC/min and after reaching the dyeing temperature, dyeing is carried out for 60 min. After dyeing completed dye baths are cooled at 60oC and then soaped properly with a non-ionic detergent. After the soaping the wool and silk
samples are dried in a hot air oven at 120OC for 1 hour. Then the samples are kept in the laboratory in a standard testing condition for 8 hours. The time temperature profile of syntan pre-treatment on wool and union dyeing process is explained in (Figures 2 & 3)
Figure 3: Time Temperature profile of union dyeing process.
Colour Measurement: The conditioned wool and silk fibres are scanned by spectrophotometer model no Colour i5 made by Gretag Macbeth, USA, using MAV (10mm) aperture with Specular reflection included (100 observer, D65 illuminent). The colour value (L*, a*, b*, c, h) of these samples are measured as per the AATCC Testing method 173-1998 [4].The colour strength of the dyed fibres, which is expressed as K/S value, where K and the S are the absorption and the scattering coefficients respectively. K/S value is measured by the reflectance value of light from the sample by Kubelka Monk Equation.
( )2/ 1 / 2K S R R= − (1)
As per the equation / woolK S and / silkK S samples are measured and the union dyeing balance value K was calculated according to the following equation
/ / /wool silkK K S K S= (2)
Washing Fastness
Washing fastness of the samples are tested in launder-o-meter following ISO washing tests, method 2 (50oC, 45 minutes, 5gm/lit soap) the change in colour of the samples are accessed by Spectrophotometer. In spectrophotometer dyed wool samples are compared with washed wool samples and after that the ΔE value of both the samples are measured using CMC (1:2) formula using
AATCC Test method 173-1998 [4].In case of silk samples also the same procedure are followed. By measuring the colour difference (ΔE) we assess the colour difference between the samples before and after wash. The ΔE value of wool and silk fibre samples are tabulated in.
Experimental Design
At the time of dyeing wool and silk fibres with acid milling dyes the major process variables are the concentration of syntan Mesitol HWS for wool pre-treatment, the concentration of sodium sulphate in the dye bath, and the pH of the dye bath (Table 1) shows the variation of three process variables and the coded and actual levels of each input variable used by the Central Composite Design. The total number of dyeing experiments was 17 including 8 at factorial point 6 at axial point, and 3 at centre point. Here the factorial points represent the variance optimal design for a first order model or a first order two factor interaction model. Centre runs give the information regarding the existence of the curvature of the system. If any curvature found in the system, the addition of axial points allows for the estimation of the pure quadratic terms [2]. Table 1 shows the design matrix of the CCD. To minimize the effect of various sources of error on results, individual dyeing experiments are performed randomly over the run number shown in (Tables 2 & 3).
Table 1: The Coded and Actual levels of variables of the Central Composite Design.
Dyeing Variables Level (coded level)
Conc. of Mesitol HWS (%) 13.18(-1.682) 20(-1) 30(0) 40 (+1) 46.82 (+1.682)
Conc. of Sodium Sulphate in dye bath (gpl) 9.55 (-1.682) 30 (-1) 60 (0) 90 (+1) 110.45 (+1.682)
pH of Dye bath 3.64(-1.682) 5 (-1) 7 (0) 9(+1) 10.36 (+1.682)
Trends in Textile & Fash Design
4/13Citation: Debojyoti G, Chanchal M, Asim K RC. Optimization of Wool and Silk Blend Dyeing Using Α-Bromoacrylamido Reactive Dyes by Response Surface Methodology. Trends in Textile & Fash Design 1(4)-2018. LTTFD MS.ID.000120.
Copyrights@ Asim Kumar Roy Choudhury, et al.
Table 2: Actual value and the coded value of the three independent variables and the experimental design.
RunConc. of Mesitol HWS (%) Conc. of Sodium Sulphate in dyebath (gpl) pH of Dye bath
Actual level Coded level Actual level Coded level Actual level Coded level
1 20 -1 30 -1 5 -1
2 20 -1 30 -1 9 1
3 20 -1 90 1 5 -1
4 20 -1 90 1 9 1
5 40 1 30 -1 5 -1
6 40 1 30 -1 9 1
7 40 1 90 1 5 -1
8 40 1 90 1 9 1
9 13.18 -1.682 60 0 7 0
10 46.82 1.682 60 0 7 0
11 30 0 9.55 -1.682 7 0
12 30 0 110.45 1.682 7 0
13 30 0 60 0 3.64 -1.682
14 30 0 60 0 10.36 1.682
15 30 0 60 0 7 0
16 30 0 60 0 7 0
17 30 0 60 0 7 0
Table 3: Results of spectrophotometric value of wool and silk fibre.
Run No K/S Wool K/S Silk K (Union Dyeing Balance) ΔE of Silk Samples ΔE of Wool Samples
1 20.85 5.95 3.50 0.51 0.45
2 16.87 6.85 2.46 0.42 0.38
3 19.76 8.22 2.40 0.44 0.52
4 16.54 12.57 1.32 0.68 0.43
5 16.08 12.72 1.26 0.65 0.85
6 12.79 6.97 1.84 0.24 0.92
7 14.29 12.46 1.15 0.38 0.93
8 11.01 11.21 0.98 0.47 0.97
9 13.63 9.09 1.50 0.67 0.52
10 10.61 11.22 0.95 0.74 1.04
11 8.72 5.97 1.46 0.22 0.51
12 14.64 10.12 1.45 0.37 0.66
13 24.01 9.71 2.47 0.76 0.18
14 10.25 11.81 0.87 0.24 0.27
15 12.98 9.81 1.32 0.51 0.55
16 13.14 9.59 1.37 0.47 0.51
17 12.81 9.61 1.33 0.32 0.54
Analysis of Experiments
The statistical analysis of the experimental results is carried out with help of Statistica 12 (Stat Soft Inc.) software. The experimental data’s are analysed through contour plots of different dependent variable with respect to independent variable and regression analysis. We also obtained the effect of the independent variable and their interaction by fitting the second order model obtained from the regression equation. In a design for fitting a second order
models the relationship between the response y and the dependent variable x1, x2, and x3 are
4 4 4 42
11 1 10
ji i ii i ij i j
i i i
y x x x xβ β β β ε== = =
= + + + +∑ ∑ ∑∑
Where x1: Concentration of Mesitol HWS in % (coded), x2: Conc. Of Sodium Sulphate in dye bath (gpl) (coded), x3: pH of Dyebath (Coded), is the constant of the equation, is the coefficients of the main factor, is the coefficients of the quadratic effects of the
Trends in Textile & Fash Design
5/13Citation: Debojyoti G, Chanchal M, Asim K RC. Optimization of Wool and Silk Blend Dyeing Using Α-Bromoacrylamido Reactive Dyes by
Response Surface Methodology. Trends in Textile & Fash Design 1(4)-2018. LTTFD MS.ID.000120.
Copyrights@ Asim Kumar Roy Choudhury, et al.
main factors and is the coefficients of the interaction effects and ε indicates the error in the equation. The coefficients of the factors were projected with the ANOVA table for the selected factorial model (Table 3).
Results & DiscussionThe colour strength of both wool and silk dyed samples are
measured by spectrophotometer using Kubelka Monk Equation. From K/S or the colour strength of wool and silk fibre union dyeing balance or the K was calculated. The above mentioned data’s are analysed by using statistical software (Statistica 12). By the help of the software the polynomial equations were developed considering
the interaction of the factors at 95% confidence level. Equations for colour strength of both the wool and silk fibre (K/S Wool & K/S Silk), union dyeing balance value (K), ΔE of Silk Samples (difference of colour between the dyed silk samples and the washed silk samples) and ΔE of wool Samples (difference of colour between the dyed wool samples and the washed wool samples) are developed considering the independent variable x1: Concentration of Mesitol HWS in % (coded), x2: Conc. Of Sodium Sulphate in dye bath (gpl) (coded), x3: pH of Dyebath (Coded), at the time of considering the equations the coded levels are considered. The regression equations are given in (Table 4).
Table 4: Regression equations of the responses.
Property Regression Equation R2
K/S Silk K/S Silk= 9.67+1.95x1+0.32 x12+ 2.77x2 – 1.16x22 + 0.26x3+0.75x32- 1x1x2–3.06x1x3 +1.99x2x3 0.951
K/S wool K/S wool = 12.83 –3.64x1+0.43 x12+ 0.73x2 + 0.12x22 -5.4x3 + 3.97x32 – 0.54x1x2 + 0.16x1x3 +0.19x2x3 0.756
K K = 1.31 – 0.8x1 – 0.98x2 + 0.445x22 – .21x3 - 0.15x32 + 0.47x4 + 0.1x42+ 0.03x1x4 - 0.07x3x4 0.762
ΔE Silk ΔE Silk = 0.44 – 0.03x1 + 0.18 x12 + 0.06x2 - 0.11x22- 0.15x3 + 0.03x32 - 0.06x1x2 - 0.12x1x3 + 0.2x2x3 0.796
ΔE Wool ΔE Wool = 0.52 – 0.4x1 + 0.24 x12 + 0.07x2 + 0.1x22 - 0.1x3 - 0.15x32 - 0.06x1x3 - 0.012x2x3 0.902
Response K/S Wool
The analysis of variance for the K/S of wool fibre is placed in Table 5. After analysing the results for the responses K/S wool, the ANOVA (Table 5) shows that the model is highly significant (p < 0.05)
on Mesitol HWS concentration (x1), sodium sulphate concentration (x2), and pH of the dye bath the residuals distributed randomly along a straight line and the R2 value, indicates that 75.6% of the total variation is explained by the model having a good correlation.
Table 5: Analysis of variance for the CCD model of the response K/S Wool.
FactorANOVA; Var.:K/S Wool; R2=0.756; Adj R2- 0.542
SS df MS F P
(1)Syntan Concentration(L) 45.4622 1 45.46224 1668.217 0.000599
Syntan Concentration(Q) 0.5227 1 0.52270 19.180 0.048385
(2)Sodium Sulphate Concentration(L) 1.8030 1 1.80299 66.160 0.014781
Sodium Sulphate Concentration(Q) 0.0424 1 0.04244 1.557 0.338369
(3)pH of Dyebath(L) 99.7149 1 99.71493 3658.995 0.000273
pH of Dyebath(Q) 44.5244 1 44.52439 1633.803 0.000612
1L by 2L 0.5794 1 0.57943 21.262 0.043955
1L by 3L 0.0491 1 0.04914 1.803 0.311430
2L by 3L 0.0728 1 0.07277 2.670 0.243850
Lack of Fit 63.2683 5 12.65366 464.320 0.002150
Pure Error 0.0545 2 0.02725
Total SS 259.7690 16
The regression equation for K/S of wool is indicated in Table 4. With the help of this model the behaviour of Lanasol Red CE dyes on the colour strength of wool fibre is predicted, when the wool fibre is dyed with silk fibre in single bath dyeing process. It is also noted that with the help of this model the optimum condition of dyeing is estimated. The effect of each factor on the K/S of wool fibre is better explained by the contour plots. After the generation of the regression equations, the contour plot of the dependent variables are drawn to get a visual estimate on the effects of independent variable over the different properties in the equations. Contour
diagram is a graphical way for representing a 3-dimensional surface by plotting constant z axis slices, called contours, on a 2-dimensional format. That is, given a value for z, lines are drawn for connecting the (x, y) coordinates where that z value occurs.
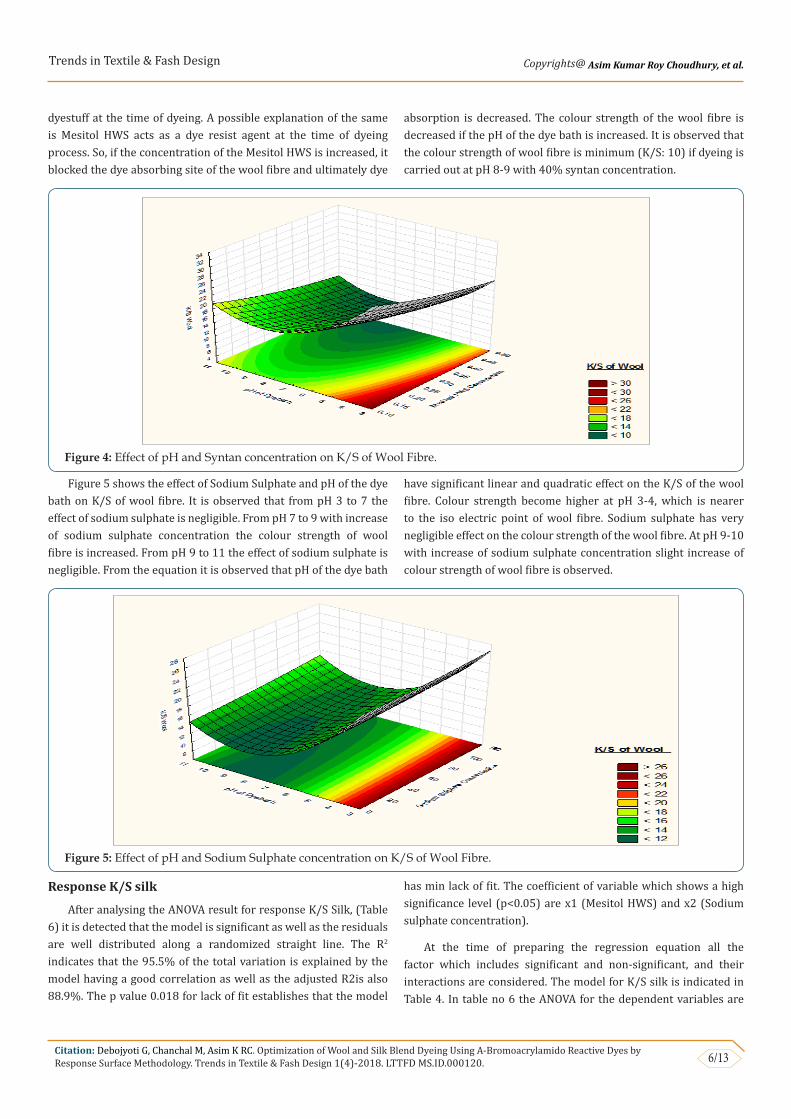
From Figure 4, the effects of Mesitol HWS concentration and pH of dye bath on K/S of wool fibre at zero coded level of Sodium Sulphate concentration is observed. From the contour diagram it is observed that Mesitol HWS has a negative effect on the dye uptake of the wool fibre. With increase in concentration of Mesitol HWS the K/S of wool fibre is decreased this is due to less absorption of
Trends in Textile & Fash Design
6/13Citation: Debojyoti G, Chanchal M, Asim K RC. Optimization of Wool and Silk Blend Dyeing Using Α-Bromoacrylamido Reactive Dyes by Response Surface Methodology. Trends in Textile & Fash Design 1(4)-2018. LTTFD MS.ID.000120.
Copyrights@ Asim Kumar Roy Choudhury, et al.
dyestuff at the time of dyeing. A possible explanation of the same is Mesitol HWS acts as a dye resist agent at the time of dyeing process. So, if the concentration of the Mesitol HWS is increased, it blocked the dye absorbing site of the wool fibre and ultimately dye
absorption is decreased. The colour strength of the wool fibre is decreased if the pH of the dye bath is increased. It is observed that the colour strength of wool fibre is minimum (K/S: 10) if dyeing is carried out at pH 8-9 with 40% syntan concentration.
Figure 4: Effect of pH and Syntan concentration on K/S of Wool Fibre.
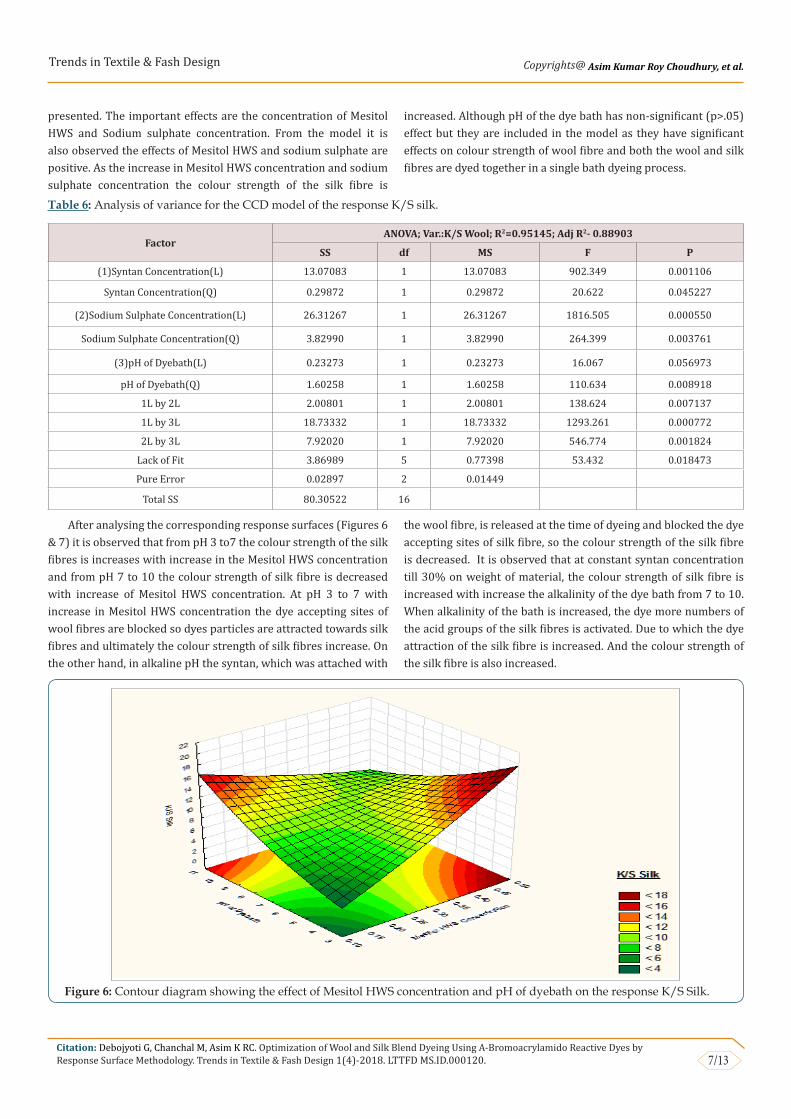
Figure 5 shows the effect of Sodium Sulphate and pH of the dye bath on K/S of wool fibre. It is observed that from pH 3 to 7 the effect of sodium sulphate is negligible. From pH 7 to 9 with increase of sodium sulphate concentration the colour strength of wool fibre is increased. From pH 9 to 11 the effect of sodium sulphate is negligible. From the equation it is observed that pH of the dye bath
have significant linear and quadratic effect on the K/S of the wool fibre. Colour strength become higher at pH 3-4, which is nearer to the iso electric point of wool fibre. Sodium sulphate has very negligible effect on the colour strength of the wool fibre. At pH 9-10 with increase of sodium sulphate concentration slight increase of colour strength of wool fibre is observed.
Figure 5: Effect of pH and Sodium Sulphate concentration on K/S of Wool Fibre.
Response K/S silk
After analysing the ANOVA result for response K/S Silk, (Table 6) it is detected that the model is significant as well as the residuals are well distributed along a randomized straight line. The R2 indicates that the 95.5% of the total variation is explained by the model having a good correlation as well as the adjusted R2is also 88.9%. The p value 0.018 for lack of fit establishes that the model
has min lack of fit. The coefficient of variable which shows a high significance level (p<0.05) are x1 (Mesitol HWS) and x2 (Sodium sulphate concentration).
At the time of preparing the regression equation all the factor which includes significant and non-significant, and their interactions are considered. The model for K/S silk is indicated in Table 4. In table no 6 the ANOVA for the dependent variables are
Trends in Textile & Fash Design
7/13Citation: Debojyoti G, Chanchal M, Asim K RC. Optimization of Wool and Silk Blend Dyeing Using Α-Bromoacrylamido Reactive Dyes by
Response Surface Methodology. Trends in Textile & Fash Design 1(4)-2018. LTTFD MS.ID.000120.
Copyrights@ Asim Kumar Roy Choudhury, et al.
presented. The important effects are the concentration of Mesitol HWS and Sodium sulphate concentration. From the model it is also observed the effects of Mesitol HWS and sodium sulphate are positive. As the increase in Mesitol HWS concentration and sodium sulphate concentration the colour strength of the silk fibre is
increased. Although pH of the dye bath has non-significant (p>.05) effect but they are included in the model as they have significant effects on colour strength of wool fibre and both the wool and silk fibres are dyed together in a single bath dyeing process.
Table 6: Analysis of variance for the CCD model of the response K/S silk.
FactorANOVA; Var.:K/S Wool; R2=0.95145; Adj R2- 0.88903
SS df MS F P
(1)Syntan Concentration(L) 13.07083 1 13.07083 902.349 0.001106
Syntan Concentration(Q) 0.29872 1 0.29872 20.622 0.045227
(2)Sodium Sulphate Concentration(L) 26.31267 1 26.31267 1816.505 0.000550
Sodium Sulphate Concentration(Q) 3.82990 1 3.82990 264.399 0.003761
(3)pH of Dyebath(L) 0.23273 1 0.23273 16.067 0.056973
pH of Dyebath(Q) 1.60258 1 1.60258 110.634 0.008918
1L by 2L 2.00801 1 2.00801 138.624 0.007137
1L by 3L 18.73332 1 18.73332 1293.261 0.000772
2L by 3L 7.92020 1 7.92020 546.774 0.001824
Lack of Fit 3.86989 5 0.77398 53.432 0.018473
Pure Error 0.02897 2 0.01449
Total SS 80.30522 16
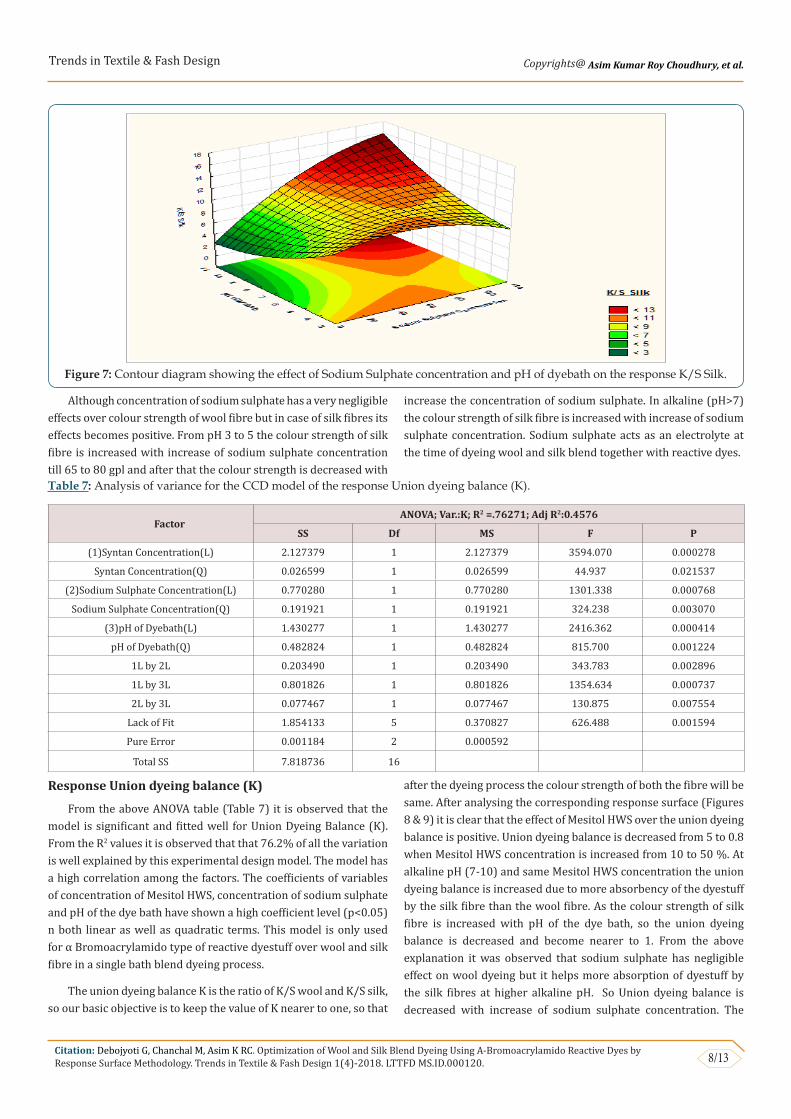
After analysing the corresponding response surfaces (Figures 6 & 7) it is observed that from pH 3 to7 the colour strength of the silk fibres is increases with increase in the Mesitol HWS concentration and from pH 7 to 10 the colour strength of silk fibre is decreased with increase of Mesitol HWS concentration. At pH 3 to 7 with increase in Mesitol HWS concentration the dye accepting sites of wool fibres are blocked so dyes particles are attracted towards silk fibres and ultimately the colour strength of silk fibres increase. On the other hand, in alkaline pH the syntan, which was attached with
the wool fibre, is released at the time of dyeing and blocked the dye accepting sites of silk fibre, so the colour strength of the silk fibre is decreased. It is observed that at constant syntan concentration till 30% on weight of material, the colour strength of silk fibre is increased with increase the alkalinity of the dye bath from 7 to 10. When alkalinity of the bath is increased, the dye more numbers of the acid groups of the silk fibres is activated. Due to which the dye attraction of the silk fibre is increased. And the colour strength of the silk fibre is also increased.
Figure 6: Contour diagram showing the effect of Mesitol HWS concentration and pH of dyebath on the response K/S Silk.
Trends in Textile & Fash Design
8/13Citation: Debojyoti G, Chanchal M, Asim K RC. Optimization of Wool and Silk Blend Dyeing Using Α-Bromoacrylamido Reactive Dyes by Response Surface Methodology. Trends in Textile & Fash Design 1(4)-2018. LTTFD MS.ID.000120.
Copyrights@ Asim Kumar Roy Choudhury, et al.
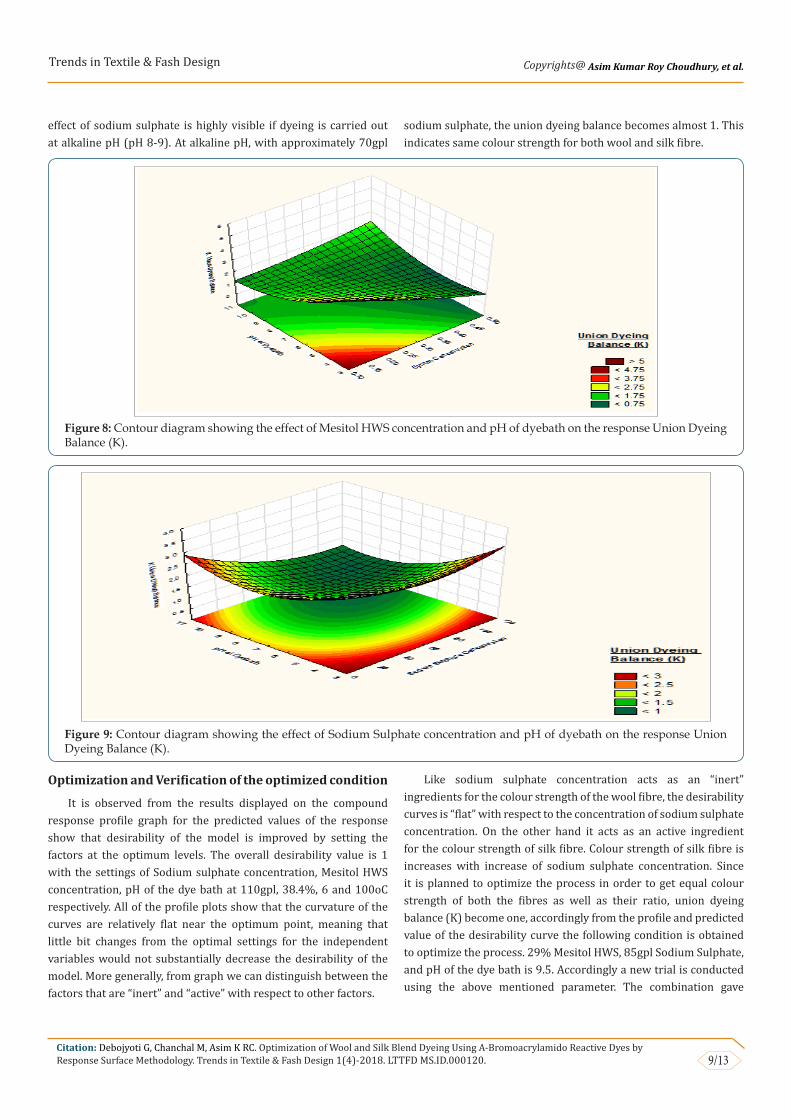
Figure 7: Contour diagram showing the effect of Sodium Sulphate concentration and pH of dyebath on the response K/S Silk.
Although concentration of sodium sulphate has a very negligible effects over colour strength of wool fibre but in case of silk fibres its effects becomes positive. From pH 3 to 5 the colour strength of silk fibre is increased with increase of sodium sulphate concentration till 65 to 80 gpl and after that the colour strength is decreased with
increase the concentration of sodium sulphate. In alkaline (pH>7) the colour strength of silk fibre is increased with increase of sodium sulphate concentration. Sodium sulphate acts as an electrolyte at the time of dyeing wool and silk blend together with reactive dyes.
Table 7: Analysis of variance for the CCD model of the response Union dyeing balance (K).
FactorANOVA; Var.:K; R2 =.76271; Adj R2:0.4576
SS Df MS F P
(1)Syntan Concentration(L) 2.127379 1 2.127379 3594.070 0.000278
Syntan Concentration(Q) 0.026599 1 0.026599 44.937 0.021537
(2)Sodium Sulphate Concentration(L) 0.770280 1 0.770280 1301.338 0.000768
Sodium Sulphate Concentration(Q) 0.191921 1 0.191921 324.238 0.003070
(3)pH of Dyebath(L) 1.430277 1 1.430277 2416.362 0.000414
pH of Dyebath(Q) 0.482824 1 0.482824 815.700 0.001224
1L by 2L 0.203490 1 0.203490 343.783 0.002896
1L by 3L 0.801826 1 0.801826 1354.634 0.000737
2L by 3L 0.077467 1 0.077467 130.875 0.007554
Lack of Fit 1.854133 5 0.370827 626.488 0.001594
Pure Error 0.001184 2 0.000592
Total SS 7.818736 16
Response Union dyeing balance (K)
From the above ANOVA table (Table 7) it is observed that the model is significant and fitted well for Union Dyeing Balance (K). From the R2 values it is observed that that 76.2% of all the variation is well explained by this experimental design model. The model has a high correlation among the factors. The coefficients of variables of concentration of Mesitol HWS, concentration of sodium sulphate and pH of the dye bath have shown a high coefficient level (p<0.05) n both linear as well as quadratic terms. This model is only used for α Bromoacrylamido type of reactive dyestuff over wool and silk fibre in a single bath blend dyeing process.
The union dyeing balance K is the ratio of K/S wool and K/S silk, so our basic objective is to keep the value of K nearer to one, so that
after the dyeing process the colour strength of both the fibre will be same. After analysing the corresponding response surface (Figures 8 & 9) it is clear that the effect of Mesitol HWS over the union dyeing balance is positive. Union dyeing balance is decreased from 5 to 0.8 when Mesitol HWS concentration is increased from 10 to 50 %. At alkaline pH (7-10) and same Mesitol HWS concentration the union dyeing balance is increased due to more absorbency of the dyestuff by the silk fibre than the wool fibre. As the colour strength of silk fibre is increased with pH of the dye bath, so the union dyeing balance is decreased and become nearer to 1. From the above explanation it was observed that sodium sulphate has negligible effect on wool dyeing but it helps more absorption of dyestuff by the silk fibres at higher alkaline pH. So Union dyeing balance is decreased with increase of sodium sulphate concentration. The
Trends in Textile & Fash Design
9/13Citation: Debojyoti G, Chanchal M, Asim K RC. Optimization of Wool and Silk Blend Dyeing Using Α-Bromoacrylamido Reactive Dyes by
Response Surface Methodology. Trends in Textile & Fash Design 1(4)-2018. LTTFD MS.ID.000120.
Copyrights@ Asim Kumar Roy Choudhury, et al.
effect of sodium sulphate is highly visible if dyeing is carried out at alkaline pH (pH 8-9). At alkaline pH, with approximately 70gpl
sodium sulphate, the union dyeing balance becomes almost 1. This indicates same colour strength for both wool and silk fibre.
Figure 8: Contour diagram showing the effect of Mesitol HWS concentration and pH of dyebath on the response Union Dyeing Balance (K).
Figure 9: Contour diagram showing the effect of Sodium Sulphate concentration and pH of dyebath on the response Union Dyeing Balance (K).
Optimization and Verification of the optimized condition
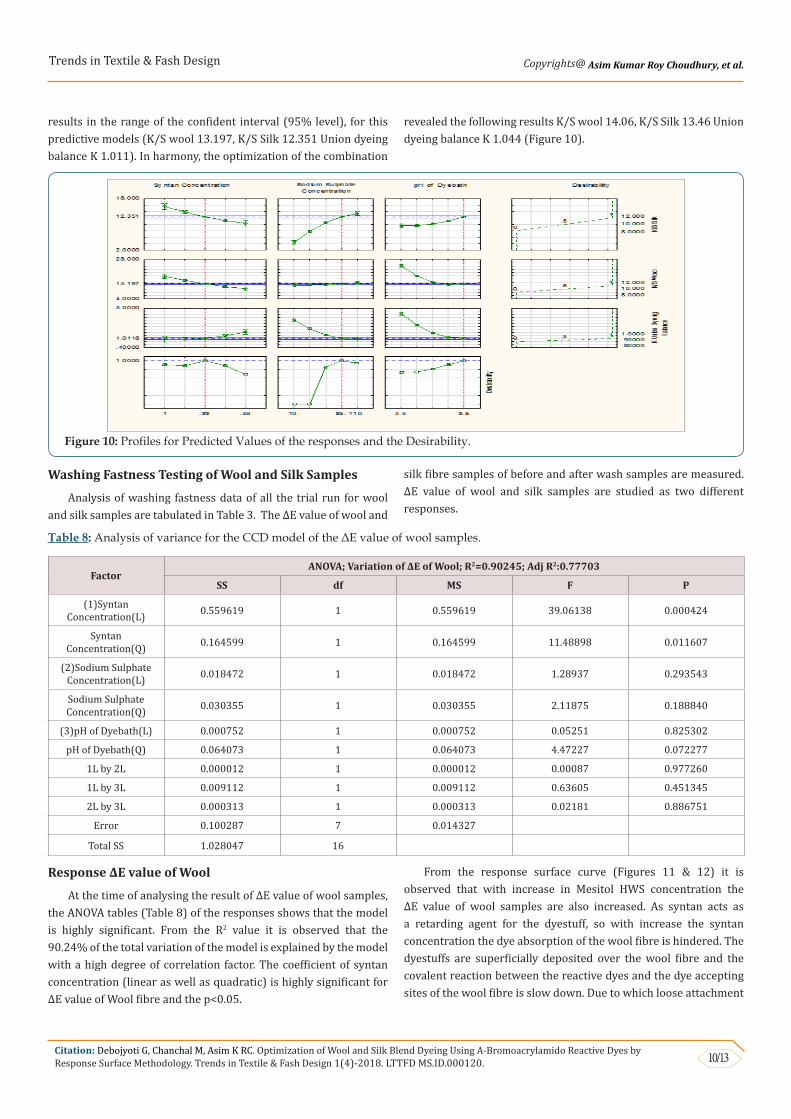
It is observed from the results displayed on the compound response profile graph for the predicted values of the response show that desirability of the model is improved by setting the factors at the optimum levels. The overall desirability value is 1 with the settings of Sodium sulphate concentration, Mesitol HWS concentration, pH of the dye bath at 110gpl, 38.4%, 6 and 100oC respectively. All of the profile plots show that the curvature of the curves are relatively flat near the optimum point, meaning that little bit changes from the optimal settings for the independent variables would not substantially decrease the desirability of the model. More generally, from graph we can distinguish between the factors that are “inert” and “active” with respect to other factors.
Like sodium sulphate concentration acts as an “inert” ingredients for the colour strength of the wool fibre, the desirability curves is “flat” with respect to the concentration of sodium sulphate concentration. On the other hand it acts as an active ingredient for the colour strength of silk fibre. Colour strength of silk fibre is increases with increase of sodium sulphate concentration. Since it is planned to optimize the process in order to get equal colour strength of both the fibres as well as their ratio, union dyeing balance (K) become one, accordingly from the profile and predicted value of the desirability curve the following condition is obtained to optimize the process. 29% Mesitol HWS, 85gpl Sodium Sulphate, and pH of the dye bath is 9.5. Accordingly a new trial is conducted using the above mentioned parameter. The combination gave
Trends in Textile & Fash Design
10/13Citation: Debojyoti G, Chanchal M, Asim K RC. Optimization of Wool and Silk Blend Dyeing Using Α-Bromoacrylamido Reactive Dyes by Response Surface Methodology. Trends in Textile & Fash Design 1(4)-2018. LTTFD MS.ID.000120.
Copyrights@ Asim Kumar Roy Choudhury, et al.
results in the range of the confident interval (95% level), for this predictive models (K/S wool 13.197, K/S Silk 12.351 Union dyeing balance K 1.011). In harmony, the optimization of the combination
revealed the following results K/S wool 14.06, K/S Silk 13.46 Union dyeing balance K 1.044 (Figure 10).
Figure 10: Profiles for Predicted Values of the responses and the Desirability.
Washing Fastness Testing of Wool and Silk Samples
Analysis of washing fastness data of all the trial run for wool and silk samples are tabulated in Table 3. The ΔE value of wool and
silk fibre samples of before and after wash samples are measured. ΔE value of wool and silk samples are studied as two different responses.
Table 8: Analysis of variance for the CCD model of the ΔE value of wool samples.
FactorANOVA; Variation of ΔE of Wool; R2=0.90245; Adj R2:0.77703
SS df MS F P
(1)Syntan Concentration(L) 0.559619 1 0.559619 39.06138 0.000424
Syntan Concentration(Q) 0.164599 1 0.164599 11.48898 0.011607
(2)Sodium Sulphate Concentration(L) 0.018472 1 0.018472 1.28937 0.293543
Sodium Sulphate Concentration(Q) 0.030355 1 0.030355 2.11875 0.188840
(3)pH of Dyebath(L) 0.000752 1 0.000752 0.05251 0.825302
pH of Dyebath(Q) 0.064073 1 0.064073 4.47227 0.072277
1L by 2L 0.000012 1 0.000012 0.00087 0.977260
1L by 3L 0.009112 1 0.009112 0.63605 0.451345
2L by 3L 0.000313 1 0.000313 0.02181 0.886751
Error 0.100287 7 0.014327
Total SS 1.028047 16
Response ΔE value of Wool
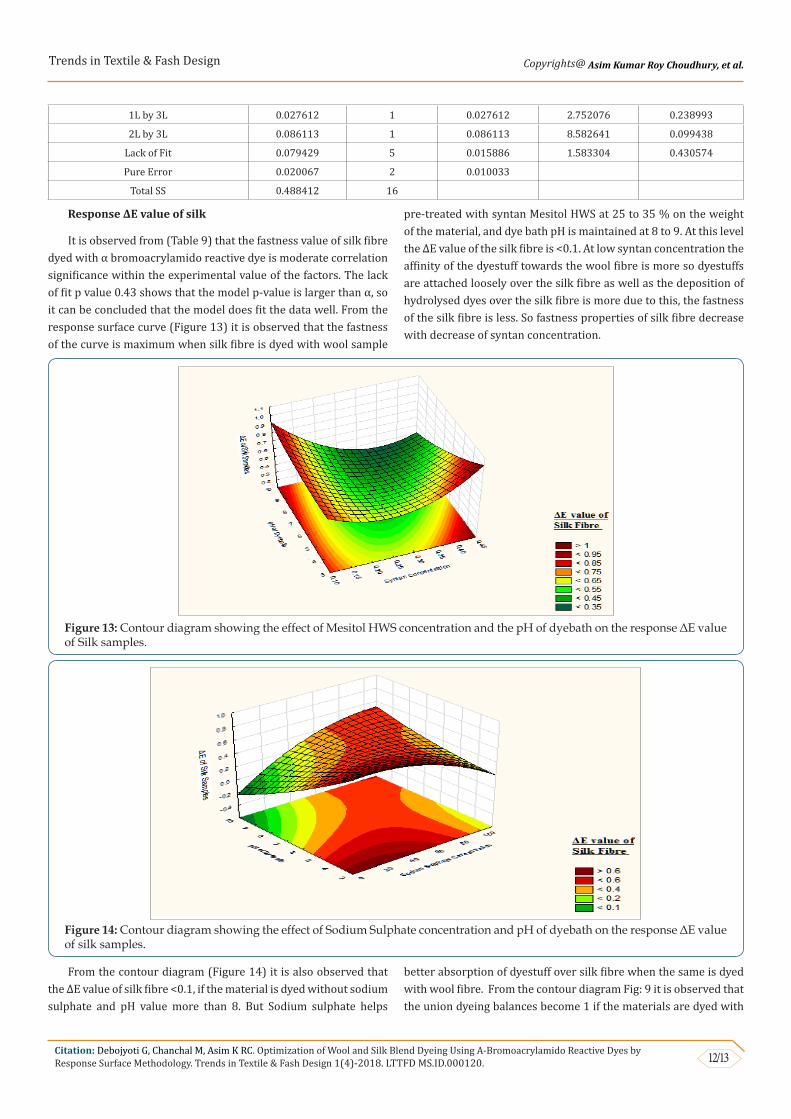
At the time of analysing the result of ΔE value of wool samples, the ANOVA tables (Table 8) of the responses shows that the model is highly significant. From the R2 value it is observed that the 90.24% of the total variation of the model is explained by the model with a high degree of correlation factor. The coefficient of syntan concentration (linear as well as quadratic) is highly significant for ΔE value of Wool fibre and the p<0.05.
From the response surface curve (Figures 11 & 12) it is observed that with increase in Mesitol HWS concentration the ΔE value of wool samples are also increased. As syntan acts as a retarding agent for the dyestuff, so with increase the syntan concentration the dye absorption of the wool fibre is hindered. The dyestuffs are superficially deposited over the wool fibre and the covalent reaction between the reactive dyes and the dye accepting sites of the wool fibre is slow down. Due to which loose attachment
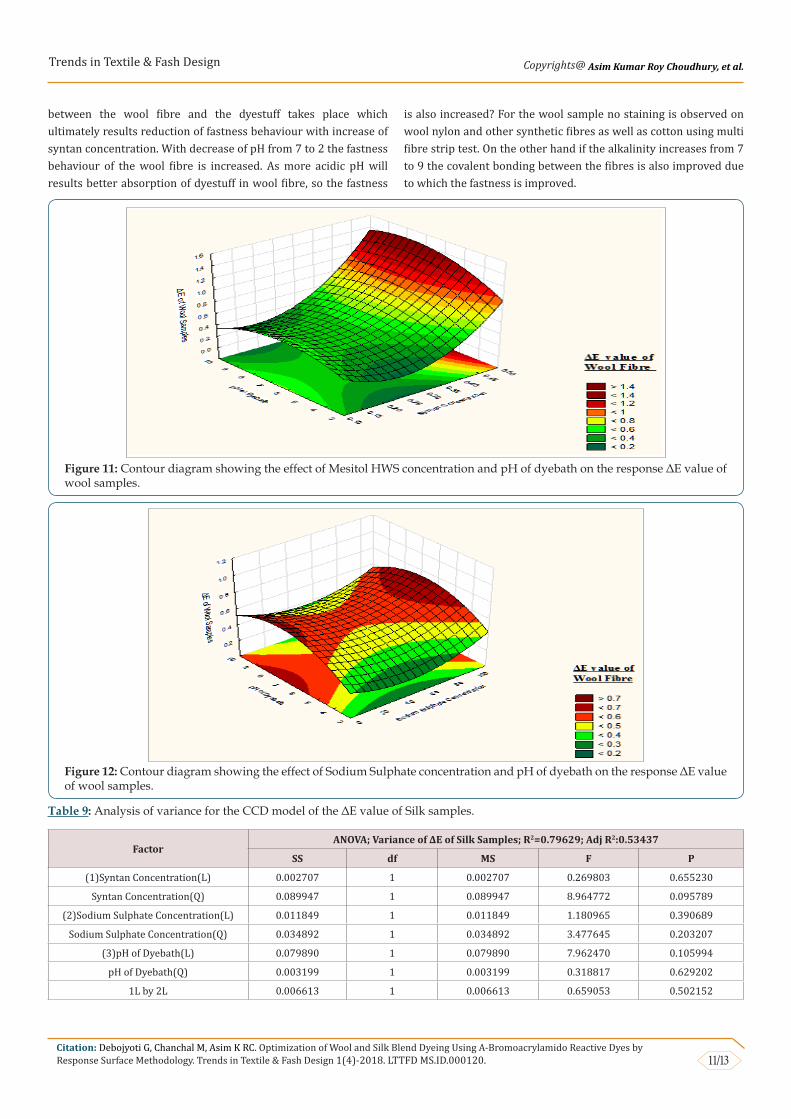
Trends in Textile & Fash Design
11/13Citation: Debojyoti G, Chanchal M, Asim K RC. Optimization of Wool and Silk Blend Dyeing Using Α-Bromoacrylamido Reactive Dyes by
Response Surface Methodology. Trends in Textile & Fash Design 1(4)-2018. LTTFD MS.ID.000120.
Copyrights@ Asim Kumar Roy Choudhury, et al.
between the wool fibre and the dyestuff takes place which ultimately results reduction of fastness behaviour with increase of syntan concentration. With decrease of pH from 7 to 2 the fastness behaviour of the wool fibre is increased. As more acidic pH will results better absorption of dyestuff in wool fibre, so the fastness
is also increased? For the wool sample no staining is observed on wool nylon and other synthetic fibres as well as cotton using multi fibre strip test. On the other hand if the alkalinity increases from 7 to 9 the covalent bonding between the fibres is also improved due to which the fastness is improved.
Figure 11: Contour diagram showing the effect of Mesitol HWS concentration and pH of dyebath on the response ΔE value of wool samples.
Figure 12: Contour diagram showing the effect of Sodium Sulphate concentration and pH of dyebath on the response ΔE value of wool samples.
Table 9: Analysis of variance for the CCD model of the ΔE value of Silk samples.
FactorANOVA; Variance of ΔE of Silk Samples; R2=0.79629; Adj R2:0.53437
SS df MS F P
(1)Syntan Concentration(L) 0.002707 1 0.002707 0.269803 0.655230
Syntan Concentration(Q) 0.089947 1 0.089947 8.964772 0.095789
(2)Sodium Sulphate Concentration(L) 0.011849 1 0.011849 1.180965 0.390689
Sodium Sulphate Concentration(Q) 0.034892 1 0.034892 3.477645 0.203207
(3)pH of Dyebath(L) 0.079890 1 0.079890 7.962470 0.105994
pH of Dyebath(Q) 0.003199 1 0.003199 0.318817 0.629202
1L by 2L 0.006613 1 0.006613 0.659053 0.502152
Trends in Textile & Fash Design
12/13Citation: Debojyoti G, Chanchal M, Asim K RC. Optimization of Wool and Silk Blend Dyeing Using Α-Bromoacrylamido Reactive Dyes by Response Surface Methodology. Trends in Textile & Fash Design 1(4)-2018. LTTFD MS.ID.000120.
Copyrights@ Asim Kumar Roy Choudhury, et al.
1L by 3L 0.027612 1 0.027612 2.752076 0.238993
2L by 3L 0.086113 1 0.086113 8.582641 0.099438
Lack of Fit 0.079429 5 0.015886 1.583304 0.430574
Pure Error 0.020067 2 0.010033
Total SS 0.488412 16
Response ΔE value of silk
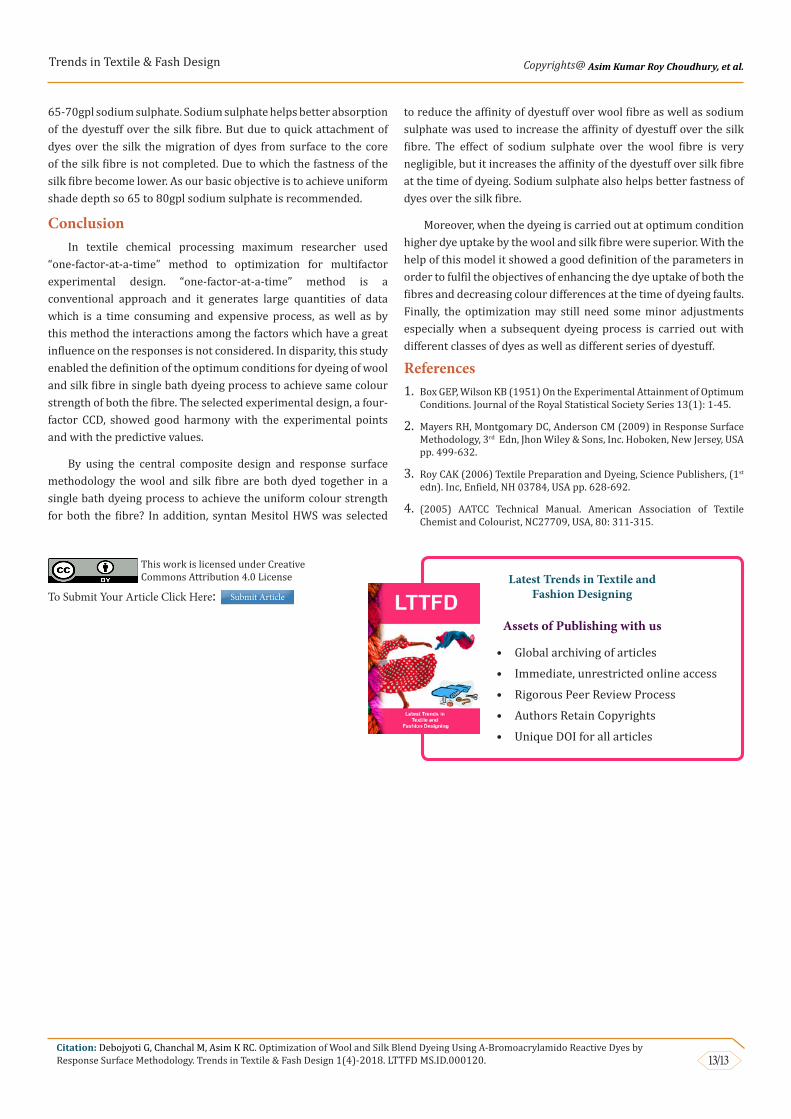
It is observed from (Table 9) that the fastness value of silk fibre dyed with α bromoacrylamido reactive dye is moderate correlation significance within the experimental value of the factors. The lack of fit p value 0.43 shows that the model p-value is larger than α, so it can be concluded that the model does fit the data well. From the response surface curve (Figure 13) it is observed that the fastness of the curve is maximum when silk fibre is dyed with wool sample
pre-treated with syntan Mesitol HWS at 25 to 35 % on the weight of the material, and dye bath pH is maintained at 8 to 9. At this level the ΔE value of the silk fibre is <0.1. At low syntan concentration the affinity of the dyestuff towards the wool fibre is more so dyestuffs are attached loosely over the silk fibre as well as the deposition of hydrolysed dyes over the silk fibre is more due to this, the fastness of the silk fibre is less. So fastness properties of silk fibre decrease with decrease of syntan concentration.
Figure 13: Contour diagram showing the effect of Mesitol HWS concentration and the pH of dyebath on the response ΔE value of Silk samples.
Figure 14: Contour diagram showing the effect of Sodium Sulphate concentration and pH of dyebath on the response ΔE value of silk samples.
From the contour diagram (Figure 14) it is also observed that the ΔE value of silk fibre <0.1, if the material is dyed without sodium sulphate and pH value more than 8. But Sodium sulphate helps
better absorption of dyestuff over silk fibre when the same is dyed with wool fibre. From the contour diagram Fig: 9 it is observed that the union dyeing balances become 1 if the materials are dyed with
Trends in Textile & Fash Design
13/13Citation: Debojyoti G, Chanchal M, Asim K RC. Optimization of Wool and Silk Blend Dyeing Using Α-Bromoacrylamido Reactive Dyes by
Response Surface Methodology. Trends in Textile & Fash Design 1(4)-2018. LTTFD MS.ID.000120.
Copyrights@ Asim Kumar Roy Choudhury, et al.
Latest Trends in Textile and Fashion Designing
Assets of Publishing with us
• Global archiving of articles
• Immediate, unrestricted online access
• Rigorous Peer Review Process
• Authors Retain Copyrights
• Unique DOI for all articles
This work is licensed under CreativeCommons Attribution 4.0 License
To Submit Your Article Click Here: Submit Article
65-70gpl sodium sulphate. Sodium sulphate helps better absorption of the dyestuff over the silk fibre. But due to quick attachment of dyes over the silk the migration of dyes from surface to the core of the silk fibre is not completed. Due to which the fastness of the silk fibre become lower. As our basic objective is to achieve uniform shade depth so 65 to 80gpl sodium sulphate is recommended.
ConclusionIn textile chemical processing maximum researcher used
“one-factor-at-a-time” method to optimization for multifactor experimental design. “one-factor-at-a-time” method is a conventional approach and it generates large quantities of data which is a time consuming and expensive process, as well as by this method the interactions among the factors which have a great influence on the responses is not considered. In disparity, this study enabled the definition of the optimum conditions for dyeing of wool and silk fibre in single bath dyeing process to achieve same colour strength of both the fibre. The selected experimental design, a four-factor CCD, showed good harmony with the experimental points and with the predictive values.
By using the central composite design and response surface methodology the wool and silk fibre are both dyed together in a single bath dyeing process to achieve the uniform colour strength for both the fibre? In addition, syntan Mesitol HWS was selected
to reduce the affinity of dyestuff over wool fibre as well as sodium sulphate was used to increase the affinity of dyestuff over the silk fibre. The effect of sodium sulphate over the wool fibre is very negligible, but it increases the affinity of the dyestuff over silk fibre at the time of dyeing. Sodium sulphate also helps better fastness of dyes over the silk fibre.
Moreover, when the dyeing is carried out at optimum condition higher dye uptake by the wool and silk fibre were superior. With the help of this model it showed a good definition of the parameters in order to fulfil the objectives of enhancing the dye uptake of both the fibres and decreasing colour differences at the time of dyeing faults. Finally, the optimization may still need some minor adjustments especially when a subsequent dyeing process is carried out with different classes of dyes as well as different series of dyestuff.
References1. Box GEP, Wilson KB (1951) On the Experimental Attainment of Optimum
Conditions. Journal of the Royal Statistical Society Series 13(1): 1-45.
2. Mayers RH, Montgomary DC, Anderson CM (2009) in Response Surface Methodology, 3rd Edn, Jhon Wiley & Sons, Inc. Hoboken, New Jersey, USA pp. 499-632.
3. Roy CAK (2006) Textile Preparation and Dyeing, Science Publishers, (1st edn). Inc, Enfield, NH 03784, USA pp. 628-692.
4. (2005) AATCC Technical Manual. American Association of Textile Chemist and Colourist, NC27709, USA, 80: 311-315.