Relating hygroscopicity and optical properties to chemical ...
Optical properties of fat emulsions
René Michels, Florian Foschum, and Alwin KienleInstitut für Lasertechnologien in der Medizin und Meßtechnik, Helmholtzstr. 12,
D-89081 Ulm, Germany
Abstract: We present measurements of the optical properties of sixdifferent fat emulsions from three different brands, Clinoleic, Lipovenoesand Intralipid, with fat concentrations from 10 % to 30 %. The scatteringcoefficient, the reduced scattering coefficent, and the phase function ofeach sample are measured for wavelengths between 350 nm and 900 nm.A method for the calculation of the particle size distribution of these fatemulsions is introduced. With the particle size distribution the opticalproperties of the fat emulsions are obtained with Mie theory. Simpleequations for the calculation of the absorption coefficient, the scatteringcoefficient, the reduced scattering coefficient, the g factor, and the phasefunction of all measured samples are presented.
© 2008 Optical Society of America
OCIS codes: (290.3030 index measurements; 290.7050 turbid media)
References1. A. Kienle, F. Forster, and R. Hibst, “Influence of the phase function on determination of the optical properties of
biological tissue by spatially resolved reflectance,” Opt. Lett. 26, 1571–1573 (2001).2. F. Martelli and G. Zaccanti, “Calibration of scattering and absorption properties of a liquid diffusive medium at
NIR wavelengths. CW method,” Opt. Express 15, 486–500 (2007).3. J. Allardice, A. M. Abulafi, D. Webb, and N. Willimas, “Standardization of intralipid for light scattering in
clinical photodynamic therapy,” Lasers Med. Sci. 7, 461–465 (1992).4. S. Flock, S. Jacques, B. Wilson, W. Star, and M. vanGemert, “The optical properties of Intralipid: a phantom
medium for light propagation studies,” Lasers Surg. Med. 12, 510–9 (1992).5. H. van Staveren, C. Moes, J. van Marle, S. Prahl, and M. Gemert, “Light scattering in Intralipid-10 in the wave-
length range of 400-1100 nm,” Appl. Opt. 30, 4507–4514 (1991).6. J. Choukeife and J. L’Huillier, “Measurements of scattering effects within tissue-like media at two wavelengths
of 632.8 nm and 680 nm,” Lasers Med. Sci. 14, 286–296 (1999).7. E. Drakaki, S. Psycharakis, M. Makropoulou, and A. Serafetinides, “Optical properties and chromophore con-
centration measurements in tissue-like phantoms,” Opt. Commun. 254, 40–51 (2005).8. I. Driver, J. Feather, P. King, and J. Dawson, “The optical properties of aqueous suspensions of Intralipid, a fat
emulsion,” Phys. Med. Biol. 34, 1927–1930 (1989).9. S. Flock and B. W. M. Patterson, “Total attenuation coefficients and scattering phase functions of tissues and
phantom materials at 633 nm,” Med. Phys. 14, 835–841 (1987).10. A. Giusto, R. Saija, M. A. Iati, P. Denti, F. Borghese, and O. Sindoni, “Optical properties of high-density disper-
sions of particles: application to intralipid solutions,” Appl. Opt. 42, 4375–4380 (2003).11. T. Pham, F. Bevilacqua, T. Spott, J. Dam, and B. T. S. Andersson-Engels, “Quantifying the absorption and
reduced scattering coefficients of tissuelike turbid media over a broad spectral range with noncontact fourier-transform hyperspectral imaging,” Appl. Opt. 39, 6487–6497 (2000).
12. G. Zaccanti, S. Bianco, and F. Martelli, “Measurements of optical properties of high-density media,” Appl. Opt.42, 4023–4030 (2003).
13. A. Kienle and M. Patterson, “Improved solutions of the steady-state and the time-resolved diffusion equationsfor reflectance from a semi-infinite turbid medium.” J. Opt. Soc. Am. 14, 246–254 (1997).
14. A. Kienle, L. Lilge, M. Patterson, R. Hibst, R. Steiner, and B. Wilson, “Spatially-resolved absolute diffuse re-flectance measurements for non-invasive determination of the optical scattering and absorption coefficients ofbiological tissue,” Appl. Opt. 35, 2304–2314 (1996).
#92339 - $15.00 USD Received 1 Feb 2008; revised 18 Mar 2008; accepted 4 Apr 2008; published 11 Apr 2008
(C) 2008 OSA 14 April 2008 / Vol. 16, No. 8 / OPTICS EXPRESS 5907
15. M. Pilz and A. Kienle, “Determination of the optical properties of turbid media by measurement of the spatiallyresolved reflectance,” in Proc. SPIE Int. Soc. Opt. Eng. (2007).
16. F. Forster, A. Kienle, R. Michels, and R. Hibst, “Phase function measurements on nonspherical scatterers usinga two-axis goniometer,” J. Biomed. Opt. 11, 024,018 (2006).
17. R. Michels, S. Boll, and A. Kienle, “Measurement of the phase function of phantom medias with a two axisgoniometer,” in Photon Migration and Diffuse-Light Imaging (SPIE, 2007).
18. D. Lide, Handbook of chemistry and physics (CRC, 2008).19. C. Wabel, “Influence of lecithin on structure and stability of parental fat emulsions,” Ph.D. thesis, University
Erlangen, Germany (1998).20. The International Association for the Properties of Water and Steam, “Release on the refractive index of ordinary
water substance as a function of wavelength, temperature and pressure,” (1997).21. G. Mie, “Beitrage zur Optik trüber Medien, speziell kolloidaler Metallösungen,” Ann. Physik 330, 377–445
(1908).22. R. Graaff, J. Aarnoudse, J. Zijp, P. Sloot, F. de Mul, J.Greve, and M. Koelink, “Reduced light-scattering properties
for mixtures of spherical particles: a simple approximation derived from Mie calculations,” Appl. Opt. 31, 1370–1376 (1992).
23. R. Pope and E. Fry, “Absorption spectrum (380-700 nm) of pure water. II Integrating cavity measurements,”Appl. Opt. 36, 8710–8723 (1997).
1. Introduction
In recent years great effort has been made to improve the understanding of light propagation inturbid media. Better accuracy in diffuse optical tomography and spectroscopy can be achievedwith enhanced measurement devices but likewise it will be achieved by improvements in themodeling of the light propagation in turbid media. Besides the modeling of the macroscopicstructure of biological tissue also the consideration of the microscopic light interaction providesfurther advancement. For example, the use of the real phase function leads to a more preciseprediction of the light propagation even in semi-infinite media [1]. In contrast to this demand,there is a lack of exact experimental data for the phase function and optical properties of theexamined turbid media. Even for well examined calibration media like fat emulsions there arestill exact measurements of the phase function missing.
Fat emulsions like Intralipid are frequently used in the research of light propagation in turbidmedia. These fat emulsions are similar to milk, consist of fat droplets suspended in water andare originally designated for parenteral nutrition of patients. In the field of diffuse imaging andspectroscopy, they are frequently used as calibration standards [2] for systems in clinical use[3] or as tissue models for the development of new methods. These fat emulsions offer somestriking advantages over other calibration standards. They offer low absorption, have an easyadjustable scattering coefficient, are cheap and highly accessible in the clinical environment,they are sterile, homogeneous, non-toxic and they are available in big quantities. Due to theirrelevance they have been topic of many studies [4, 5, 6, 7, 8, 9, 10, 11, 12]. Besides the opticalproperties, the scattering coefficient μs, the reduced scattering coefficient μ ′
s, the absorptioncoefficient μa and the anisotropy factor g, also the particle size distribution of Intralipid [5, 6]has been reported in literature. In addition, there have been comparative studies of different fatemulsions with different fat concentrations [6].
Despite of all these studies, the direct measurements of the phase function was only topic ofa few publications [6, 9]. The g factor was measured mostly indirectly by calculating it fromthe measurement of μs and μ ′
s. In addition, the recipe and the manufacturing of Intralipid10%have changed since the study of van Staveren et al. [5] which is the most cited work concerningthe optical properties of Intralipid10%. Consequently, the optical properties of Intralipid10%have changed. Furthermore, there are various different fat emulsions on the market today andeach brand is also available in different fat concentrations. It shall be noted beforehand thatgreat differences of the optical properties of fat emulsions of different brands and even of fatemulsions of the same brand with different fat concentrations were found.
#92339 - $15.00 USD Received 1 Feb 2008; revised 18 Mar 2008; accepted 4 Apr 2008; published 11 Apr 2008
(C) 2008 OSA 14 April 2008 / Vol. 16, No. 8 / OPTICS EXPRESS 5908
In this paper we present measurement of the optical properties, μ s, μ ′s, g, and the phase
function p(θ ), of Intralipid, Lipovenoes and ClinOleic, with fat concentrations from 10% to30% for wavelengths between 350nm and 900nm. The size distribution of each fat emulsionwas calculated and is presented here. With the given size distribution the optical propertiescan be computed with Mie theory. Due to the complexity of the Mie theory simple analyticequations are presented to calculate the optical properties, μ a, μs, μ ′
s, g, as well as the phasefunction p(θ ), for wavelengths from 400nm to 1000nm for each sample.
The paper is structured as follows. All experimental methods and all information needed forthe calculation of the scattering properties of the fat emulsions with Mie theory are given in themethods and materials section. The measurement of μ s and μa is explained in section 2.1, themeasurement of μ ′
s is stated in section 2.2 and the measurement of the phase function and theanisotropy factor is introduced in section 2.3. A brief introduction to the correction of the phasefunction measurement is given in section 2.4. The consistence and physical properties of thefat emulsions are explained in section 2.5. Mie theory is briefly introduced in section 2.6. Thecalculation of the size distribution is explained in section 2.7. In the result section we finallypresent the comparison of our measurement results with Mie theory. In section 3.1 two exam-ples of the phase function measurements are discussed. The measurements of the anisotropyfactor (section 3.2), of the scattering coefficient (section 3.3), of the reduced scattering coeffi-cient (section 3.4) and of the absorption coefficient (section 3.5) follow. In section 3.6 analyticalformulations for the calculation of μa, μs, μ ′
s, g and p(θ ) are given.
2. Methods and materials
2.1. Collimated transmission setup
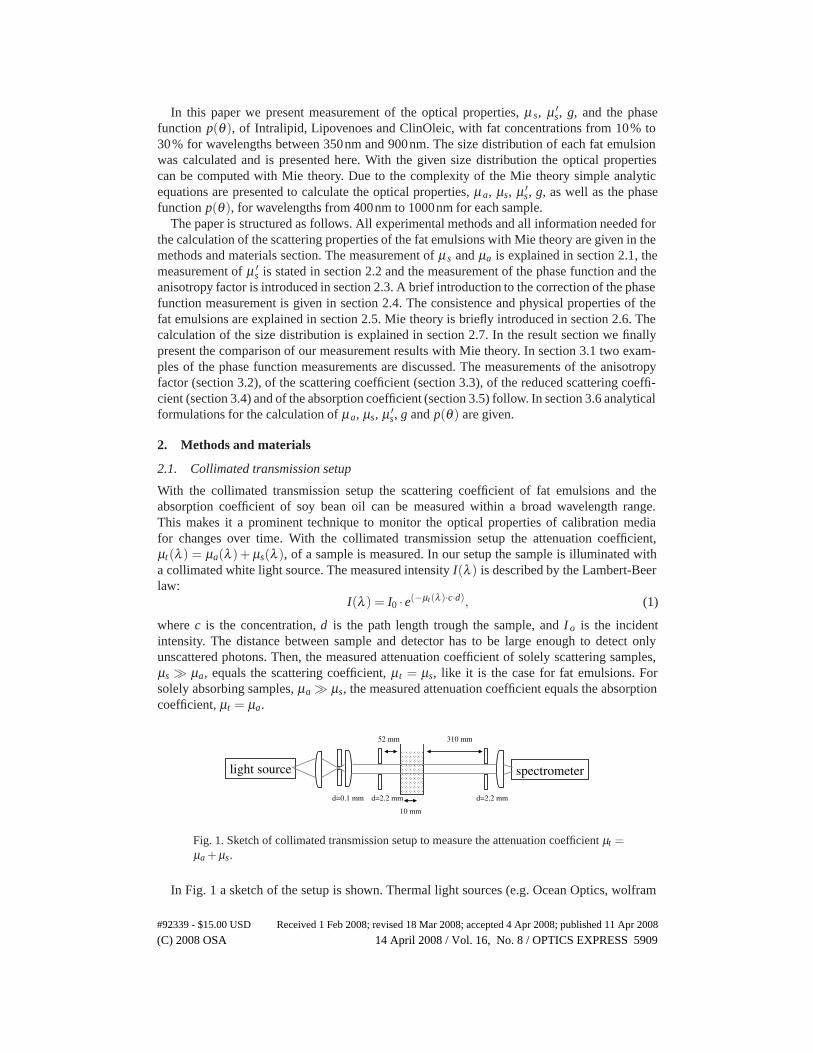
With the collimated transmission setup the scattering coefficient of fat emulsions and theabsorption coefficient of soy bean oil can be measured within a broad wavelength range.This makes it a prominent technique to monitor the optical properties of calibration mediafor changes over time. With the collimated transmission setup the attenuation coefficient,μt(λ ) = μa(λ )+ μs(λ ), of a sample is measured. In our setup the sample is illuminated witha collimated white light source. The measured intensity I(λ ) is described by the Lambert-Beerlaw:
I(λ ) = I0 · e(−μt(λ )·c·d), (1)
where c is the concentration, d is the path length trough the sample, and I o is the incidentintensity. The distance between sample and detector has to be large enough to detect onlyunscattered photons. Then, the measured attenuation coefficient of solely scattering samples,μs � μa, equals the scattering coefficient, μt = μs, like it is the case for fat emulsions. Forsolely absorbing samples, μa � μs, the measured attenuation coefficient equals the absorptioncoefficient, μt = μa.
Fig. 1. Sketch of collimated transmission setup to measure the attenuation coefficient μt =μa + μs.
In Fig. 1 a sketch of the setup is shown. Thermal light sources (e.g. Ocean Optics, wolfram
#92339 - $15.00 USD Received 1 Feb 2008; revised 18 Mar 2008; accepted 4 Apr 2008; published 11 Apr 2008
(C) 2008 OSA 14 April 2008 / Vol. 16, No. 8 / OPTICS EXPRESS 5909
halogen light source HL-2000) as well as laser sources (e.g. He-Ne laser and diode lasers)were employed. The collimation optics (lenses 1 and 2 and the first pinhole) are not necessaryfor laser sources. Two different spectrometers, an Ocean Optics PC 2000 and a J&M TIDASspectrometer, were used. In case of a monochromatic source a photo diode was employed asdetector. The given sample-detector separation does not detect light scattered with an anglegreater than 0.4°. The small amount of unwanted scattered light measured within the cone of0.4° is negligible.
To avoid the influence of multiple scattered light on the measurement either the sample canbe diluted or the thickness of the cuvette can be decreased. In this study the fat emulsion arediluted with distilled water to a fat concentration of less than 0.05% which is low enough toavoid the influence of multiple scattered light.
2.2. Spatially resolved reflectance setup
A spatially resolved reflectance setup is applied to measure the light intensity R(r) emitted bya semi-infinite sample which is illuminated perpendicular with a collimated point source. Inthis work it was employed to measure the reduced scattering coefficient of diluted fat emulsionsamples. The spatial resolved reflectance R(r) of homogeneous, semi infinite media can becalculated with the diffusion Eqs. [13, 14]. The diffusion equation is a simplification of the moreprecise transport theory. The diffusion equation supplies a good correlation to measurementswith the following constraints. The distance to the source has to be large, r > > 1/μ ′
s, and themedium has to be highly scattering, μ ′
s> > μa. For unknown absorption and scattering propertiesof the media, an inverse calculation of the diffusion equation was employed to calculate theabsorption and scattering coefficients of the sample. In general, the diffusion equation is fittedto the measured spatially resolved reflectance R(r) with variable μa, μ ′
s and a multiplicativeadjustment variable.
The absorption of the diluted samples is mainly given trough water absorption for wavelengthlonger than 550nm, see section 3.5. The fat emulsions were diluted to roughly 0.5 Vol-% fatconcentration for the measurement of the spatially resolved reflectance. With the known absorp-tion coefficient, the inverse calculation has only 2 fitting parameters, μ ′
s and the multiplicativefactor, thus the reduced scattering coefficient can be calculated with high accuracy.
A CCD-camera based setup was employed, as can be seen in Fig. 2(a). Either a tuneable5 color He-Ne laser or a xenon-lamp monochromator source was used to illuminate the sam-ple. In comparison to the diffusion equation which computes the spatially resolved reflectancefor perpendicular illumination with an infinitesimal small point source our measurement setupexhibits some differences. As can be seen in Fig. 2(a), the sample was not illuminated per-pendicular and the Xe-monochromator light source has a small numerical aperture (NA) and aspot diameter of roughly one mm on the sample. As calibration measurements and simulationsshow, the angle of incidence of the light source as well as the spot diameter and divergence ofthe light sources are negligible for samples with optical properties like we used in this study.
The accuracy of the inverse calculation of μ ′s was analyzed with Monte Carlo simulations.
The inverse calculation with known μa produced errors of less than 1% for Monte Carlo simula-tions using Henyey Greenstein phase function with μa, μs and g similar to the optical propertiesof the measurements. Monte Carlo simulations which were performed with the measured phasefunction of Lipovenoes10% instead of the Henyey-Greenstein phase function produced highererrors which are still below 3%. An illustration to the difference of Henyey Greenstein andLipovenoes phase functions with the same g factor is given in Fig. 3(b).
As reported previously [15], a CCD camera based spatially resolved reflectance setup is af-fected by errors due to scattered and reflected light inside the objective. The measurementscan be corrected by deconvoluting the objective point spread function. This point spread func-
#92339 - $15.00 USD Received 1 Feb 2008; revised 18 Mar 2008; accepted 4 Apr 2008; published 11 Apr 2008
(C) 2008 OSA 14 April 2008 / Vol. 16, No. 8 / OPTICS EXPRESS 5910

tion has to be measured for each wavelength and camera setup individually. This is very timeconsuming and was not feasible for this study but the error of the camera objective is small foroptical properties like those measured here. The error will raise for higher values of μ a or μ ′
s be-cause the dynamic range of the spatially resolved reflectance function R(r) will raise. The errorsthat are expected for a CCD based measurement setup were investigated with convoluted MonteCarlo simulations. The previous Monte Carlo simulation which utilizes the phase function ofLipovenoes10% was convoluted with the point spread function of the camera objective whichwas measured at 633nm. The inverse calculation of the convoluted simulation showed a devi-ation of up to 8%. Thus the inverse calculation of the measured spatially resolved reflectanceis expected to have an uncertainty of about 8% for samples with similar optical properties.
(a) (b)
Fig. 2. a) Scheme of the CCD based spatially resolved reflectance setup to measure thereduced scattering coefficient. The sample is illuminated either with a laser or a collimatedxenon-lamp monochromator source. b) Sketch of the goniometric setup to measure thephase function in the whole solid angle and thus the g factor.
2.3. Goniometer setup
According to the transport theory turbid media are sufficiently defined through their absorptionand scattering coefficients and their phase function. The phase function p(�s,�s ′) describes theprobability that a photon having an incident direction�s is scattered in direction�s ′, see Fig. 3(a).The phase functions of different scattering samples can vary strongly. Also phase functionswith the same anisotropy factor can have big differences, see Fig. 3(b).
The goniometric setup is used to measure the phase function of a scattering media. As canbe seen in Fig. 2(b), the scattering sample is illuminated in z direction with a collimated lightsource and the angle dependent scattering intensity p(θ ,φ) is measured for nearly the wholesolid angle [16, 17]. By tilting the sample it is possible to measure the phase function p(�s,�s ′) formany incident directions�s. However, for spherical scatterers like fat droplets the phase functionis independent of the incident direction�s and can be noted as p(θ ,φ). Furthermore the phasefunction is rotationally symmetric for unpolarized light. That means, the phase function p(θ )is constant for different φ . With our setup the phase function p(θ ) of spherical scatterers isalways measured in the z-y plane. The polarization direction of an incident linear polarizedlight source is rotated using special optics. The phase function of the whole solid angle p(θ ,φ)can be calculated by the superposition of the phase function for perpendicular (in respect to
#92339 - $15.00 USD Received 1 Feb 2008; revised 18 Mar 2008; accepted 4 Apr 2008; published 11 Apr 2008
(C) 2008 OSA 14 April 2008 / Vol. 16, No. 8 / OPTICS EXPRESS 5911

the measurement plane) (p per) and parallel (ppar) polarized light p(θ ,φ) = p per(θ ) · cos(φ)+ppar(θ ) · sin(φ).
The employed goniometric setup holds some special features. The scattering sample washeld inside an index matching tank, filled with distilled water. This minimizes the total internalreflection and also the refraction of scattered light exiting the sample. A collimated J & M Xe-lamp monochromator was used as light source. The numerical aperture (NA) of the incidentlight was adapted to the NA of the detection fiber. The Xe-monochromator emits light from280nm to 650nm with a spectral bandwidth of roughly 10nm. The scattered light was collectedby a 600µm multimode glass fiber with a fiber-sample distance of 8 cm.
0 50 100 150
10−2
10−1
100
angle [°]in
tens
ity [a
.u.]
Lipovenoes 512 nm g=0.8Henyey−Greenstein g=0.8Henyey−Greenstein g=0Henyey−Greenstein g=0.5
(a) (b)
Fig. 3. a) Scheme of the coordinate system which is used for the phase function measure-ments. The scattering particle or the sample is illuminated from direction�s. The scatteringoccurs in direction�s′. The incident direction of our measurements�s was in z direction. Forrotational symmetric scatterers the scattering of unpolarized light is independent of φ . b)Plot of different phase functions. The commonly used Henyey Greenstein phase functioncan be adjusted with the g parameter to isotropic scattering (g=0) forward scattering (g>0)and backward scattering (g<0). The g parameter of the Henyey Greenstein phase function isidentical to the anisotropy factor g, the averaged cosine over all angles. As comparison thephase function of Lipovenoes 10% (λ = 512nm, unpolarized), which has an anisotropy fac-tor of g =0.8 is plotted (green). Please note the large difference between the Lipovenoes-,and the Henyey Greenstein phase function despite their identical anisotropy factor.
The NA of the detection fiber was reduced with a pinhole in front of the fiber (�= 1mm,distance to the fiber = 5mm). This minimizes the detection of multiple scattered light whichexits the sample far from the incident beam. A computer controlled 2 axes step motor driven armmoved the fiber. The minimum possible step width was 0.25°. The light which was collectedby the fiber was directed with a multiplexer either to a photodiode or to a photomultiplier. Thisresults in a measurement range of about 12 orders of magnitude of light intensity.
2.4. Phase function correction
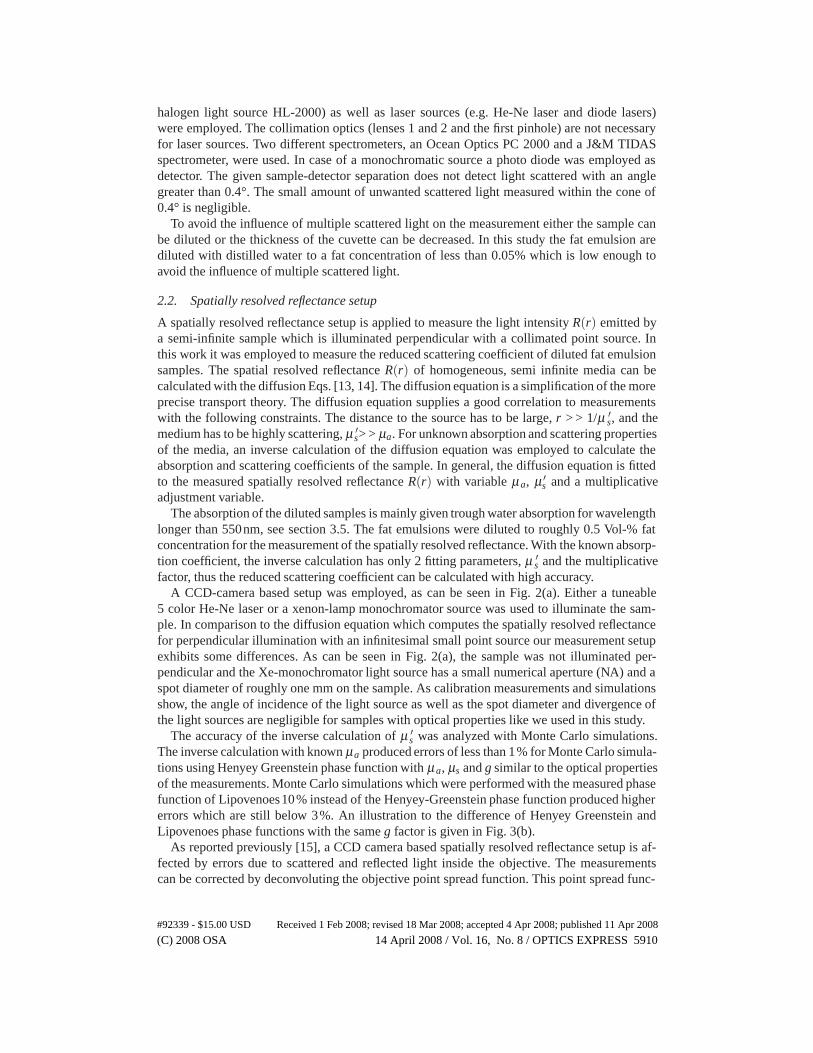
Many groups have used cylindrical cuvettes [6] for the goniometric measurement of liquid sam-ples like Intralipid. Cylindrical cuvettes admit the measurement of the phase function p(θ ) forall θ−angles. Slab geometry cuvettes, like the ones used in this work, prohibit the measure-ment of the phase function in slab direction (usually the x-y plane). Since this goniometer isoriginally built to measure thin slices of biological samples, correction algorithms for sam-ples in slab geometry have been developed. Hence, a slab geometry cuvette was used for themeasurement of the fat emulsions as is shown in Fig. 4(a). We note that the distortion of the
#92339 - $15.00 USD Received 1 Feb 2008; revised 18 Mar 2008; accepted 4 Apr 2008; published 11 Apr 2008
(C) 2008 OSA 14 April 2008 / Vol. 16, No. 8 / OPTICS EXPRESS 5912
phase function measurement caused by a cylindrical cuvette is not that obvious, but it has to becorrected similar as it is done for slab geometry cuvettes. Furthermore, cylindrical cuvettes pro-duce a strong distortion of the incident beam, thus they appeared unsuitable for phase functionmeasurement with high angle resolution in our opinion.
The most obvious distortion caused by the slab geometry cuvette to the phase function isthe increasing Fresnel reflection of scattered light for angles of θ toward 90°. As can be seenin Fig. 4(b), no light is exiting the cuvette at θ =90° (dashed line). Furthermore, the incidentbeam is reflected at the rear glass which causes the phase function to be superposed by itself inbackward direction. Also, the scattered light itself is reflected at the glass/fluid boundary whenexiting the cuvette. An analytical solution for the correction of these distortions was developed.The forward calculation of the distortion and the backward correction are shown in Fig. 4(b) fora theoretical phase function of Intralipid. The geometrical errors can be corrected completely ifsingle scattering is assumed.
0 50 100 15010
−4
10−3
10−2
10−1
100
angle [°]
inte
nsity
[a.u
.]
mie theorymie theory in slab cuvetteslab cuvette correction
(a) (b)
Fig. 4. a) Sketch of the cuvette geometry. The scattering sample is held inside two glassslides. Usually the cuvette is parallel to the x-y plane. The principal distortions that influ-ence the measured phase function are shown. The incident laser beam I0 is reflected at theback of the cuvette. The reflected intensity R causes scattering in the opposite direction.Also the scattered light itself (red) is reflected at the glass boundaries (blue). Both effectsproduce the distortion of the phase function which can be seen in the plot on the right. Inx-y plane, p(θ ) = 90, the light cannot exit the cuvette. b) The theoretical phase function ofIntralipid was calculated according to van Staveren [5] (solid line). The distortion due tothe cuvette was calculated for this phase function (dashed line). The characteristic distor-tion at 90° and in backward direction can be seen. The backward correction (dotted line)shows no deviation to the theory.
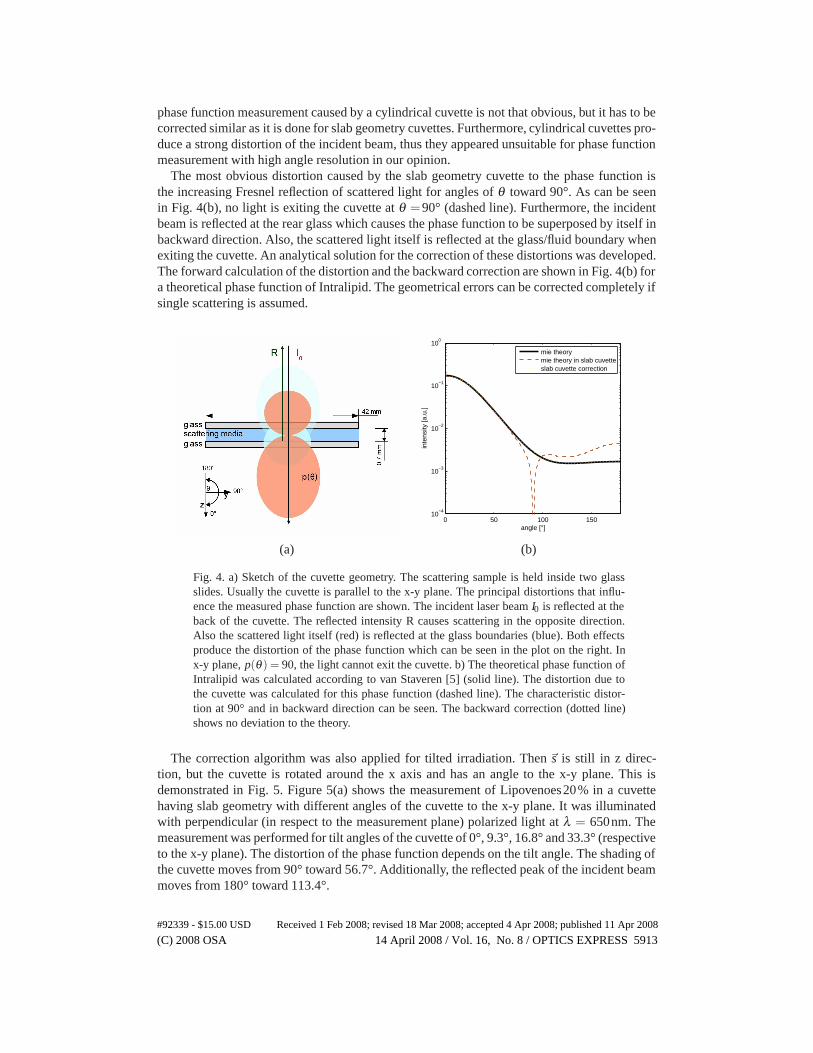
The correction algorithm was also applied for tilted irradiation. Then �s is still in z direc-tion, but the cuvette is rotated around the x axis and has an angle to the x-y plane. This isdemonstrated in Fig. 5. Figure 5(a) shows the measurement of Lipovenoes20% in a cuvettehaving slab geometry with different angles of the cuvette to the x-y plane. It was illuminatedwith perpendicular (in respect to the measurement plane) polarized light at λ = 650nm. Themeasurement was performed for tilt angles of the cuvette of 0°, 9.3°, 16.8° and 33.3° (respectiveto the x-y plane). The distortion of the phase function depends on the tilt angle. The shading ofthe cuvette moves from 90° toward 56.7°. Additionally, the reflected peak of the incident beammoves from 180° toward 113.4°.
#92339 - $15.00 USD Received 1 Feb 2008; revised 18 Mar 2008; accepted 4 Apr 2008; published 11 Apr 2008
(C) 2008 OSA 14 April 2008 / Vol. 16, No. 8 / OPTICS EXPRESS 5913
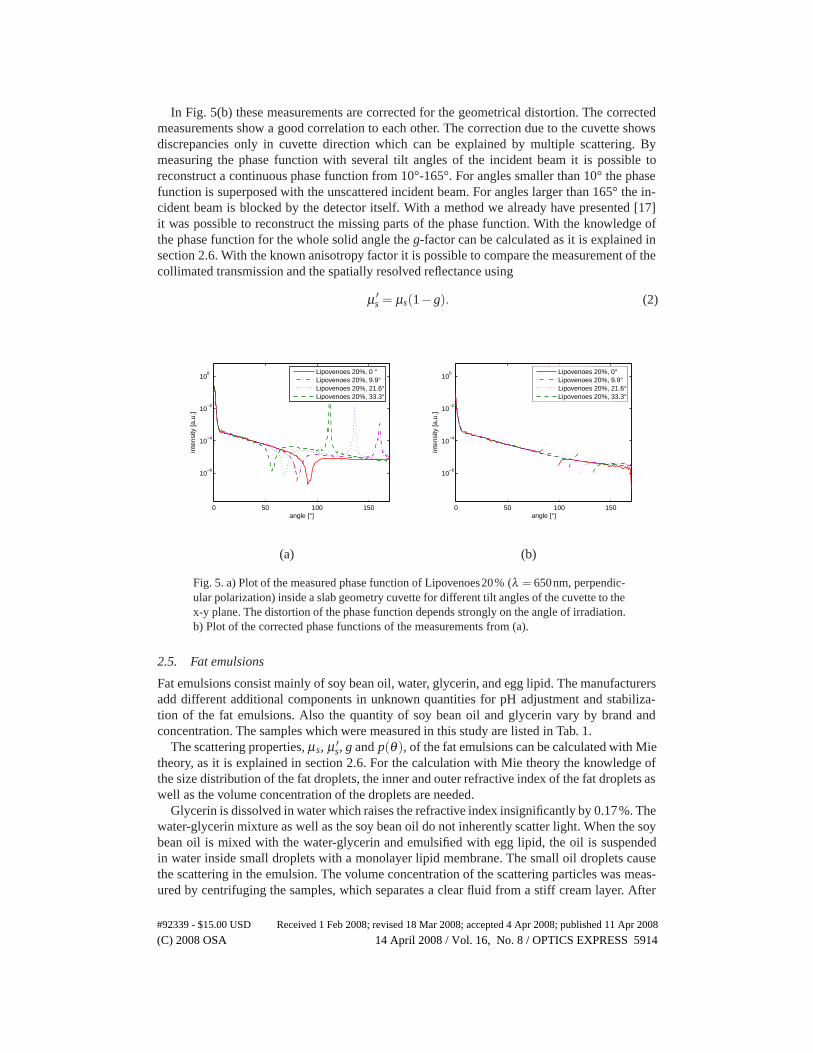
In Fig. 5(b) these measurements are corrected for the geometrical distortion. The correctedmeasurements show a good correlation to each other. The correction due to the cuvette showsdiscrepancies only in cuvette direction which can be explained by multiple scattering. Bymeasuring the phase function with several tilt angles of the incident beam it is possible toreconstruct a continuous phase function from 10°-165°. For angles smaller than 10° the phasefunction is superposed with the unscattered incident beam. For angles larger than 165° the in-cident beam is blocked by the detector itself. With a method we already have presented [17]it was possible to reconstruct the missing parts of the phase function. With the knowledge ofthe phase function for the whole solid angle the g-factor can be calculated as it is explained insection 2.6. With the known anisotropy factor it is possible to compare the measurement of thecollimated transmission and the spatially resolved reflectance using
μ ′s = μs(1−g). (2)
0 50 100 150
10−6
10−4
10−2
100
angle [°]
inte
nsity
[a.u
.]
Lipovenoes 20%, 0 °Lipovenoes 20%, 9.9°Lipovenoes 20%, 21.6°Lipovenoes 20%, 33.3°
0 50 100 150
10−6
10−4
10−2
100
angle [°]
inte
nsity
[a.u
.]
Lipovenoes 20%, 0°Lipovenoes 20%, 9.9°Lipovenoes 20%, 21.6°Lipovenoes 20%, 33.3°
(a) (b)
Fig. 5. a) Plot of the measured phase function of Lipovenoes20% (λ = 650nm, perpendic-ular polarization) inside a slab geometry cuvette for different tilt angles of the cuvette to thex-y plane. The distortion of the phase function depends strongly on the angle of irradiation.b) Plot of the corrected phase functions of the measurements from (a).
2.5. Fat emulsions
Fat emulsions consist mainly of soy bean oil, water, glycerin, and egg lipid. The manufacturersadd different additional components in unknown quantities for pH adjustment and stabiliza-tion of the fat emulsions. Also the quantity of soy bean oil and glycerin vary by brand andconcentration. The samples which were measured in this study are listed in Tab. 1.
The scattering properties, μs, μ ′s, g and p(θ ), of the fat emulsions can be calculated with Mie
theory, as it is explained in section 2.6. For the calculation with Mie theory the knowledge ofthe size distribution of the fat droplets, the inner and outer refractive index of the fat droplets aswell as the volume concentration of the droplets are needed.
Glycerin is dissolved in water which raises the refractive index insignificantly by 0.17%. Thewater-glycerin mixture as well as the soy bean oil do not inherently scatter light. When the soybean oil is mixed with the water-glycerin and emulsified with egg lipid, the oil is suspendedin water inside small droplets with a monolayer lipid membrane. The small oil droplets causethe scattering in the emulsion. The volume concentration of the scattering particles was meas-ured by centrifuging the samples, which separates a clear fluid from a stiff cream layer. After
#92339 - $15.00 USD Received 1 Feb 2008; revised 18 Mar 2008; accepted 4 Apr 2008; published 11 Apr 2008
(C) 2008 OSA 14 April 2008 / Vol. 16, No. 8 / OPTICS EXPRESS 5914
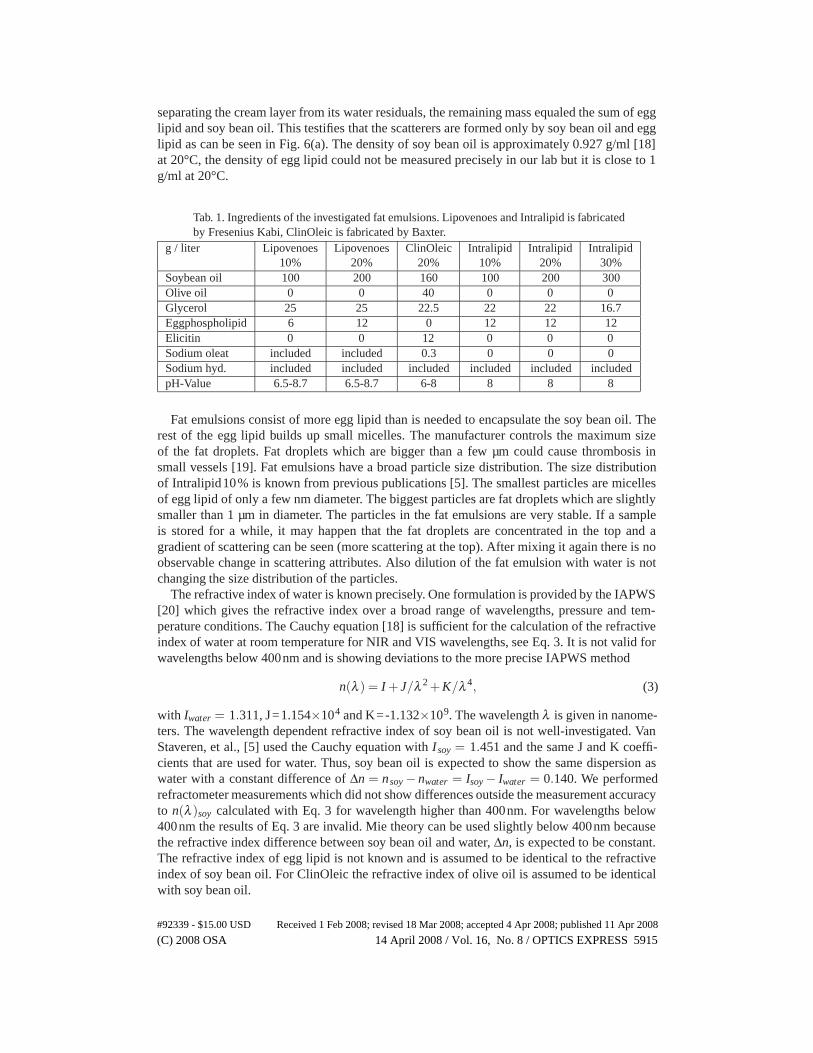
separating the cream layer from its water residuals, the remaining mass equaled the sum of egglipid and soy bean oil. This testifies that the scatterers are formed only by soy bean oil and egglipid as can be seen in Fig. 6(a). The density of soy bean oil is approximately 0.927 g/ml [18]at 20°C, the density of egg lipid could not be measured precisely in our lab but it is close to 1g/ml at 20°C.
Tab. 1. Ingredients of the investigated fat emulsions. Lipovenoes and Intralipid is fabricatedby Fresenius Kabi, ClinOleic is fabricated by Baxter.
g / liter Lipovenoes Lipovenoes ClinOleic Intralipid Intralipid Intralipid10% 20% 20% 10% 20% 30%
Soybean oil 100 200 160 100 200 300Olive oil 0 0 40 0 0 0Glycerol 25 25 22.5 22 22 16.7Eggphospholipid 6 12 0 12 12 12Elicitin 0 0 12 0 0 0Sodium oleat included included 0.3 0 0 0Sodium hyd. included included included included included includedpH-Value 6.5-8.7 6.5-8.7 6-8 8 8 8
Fat emulsions consist of more egg lipid than is needed to encapsulate the soy bean oil. Therest of the egg lipid builds up small micelles. The manufacturer controls the maximum sizeof the fat droplets. Fat droplets which are bigger than a few µm could cause thrombosis insmall vessels [19]. Fat emulsions have a broad particle size distribution. The size distributionof Intralipid10% is known from previous publications [5]. The smallest particles are micellesof egg lipid of only a few nm diameter. The biggest particles are fat droplets which are slightlysmaller than 1 µm in diameter. The particles in the fat emulsions are very stable. If a sampleis stored for a while, it may happen that the fat droplets are concentrated in the top and agradient of scattering can be seen (more scattering at the top). After mixing it again there is noobservable change in scattering attributes. Also dilution of the fat emulsion with water is notchanging the size distribution of the particles.
The refractive index of water is known precisely. One formulation is provided by the IAPWS[20] which gives the refractive index over a broad range of wavelengths, pressure and tem-perature conditions. The Cauchy equation [18] is sufficient for the calculation of the refractiveindex of water at room temperature for NIR and VIS wavelengths, see Eq. 3. It is not valid forwavelengths below 400nm and is showing deviations to the more precise IAPWS method
n(λ ) = I + J/λ 2 + K/λ 4, (3)
with Iwater = 1.311, J=1.154×10⁴ and K=-1.132×10⁹. The wavelength λ is given in nanome-ters. The wavelength dependent refractive index of soy bean oil is not well-investigated. VanStaveren, et al., [5] used the Cauchy equation with Isoy = 1.451 and the same J and K coeffi-cients that are used for water. Thus, soy bean oil is expected to show the same dispersion aswater with a constant difference of Δn = nsoy − nwater = Isoy − Iwater = 0.140. We performedrefractometer measurements which did not show differences outside the measurement accuracyto n(λ )soy calculated with Eq. 3 for wavelength higher than 400nm. For wavelengths below400nm the results of Eq. 3 are invalid. Mie theory can be used slightly below 400nm becausethe refractive index difference between soy bean oil and water, Δn, is expected to be constant.The refractive index of egg lipid is not known and is assumed to be identical to the refractiveindex of soy bean oil. For ClinOleic the refractive index of olive oil is assumed to be identicalwith soy bean oil.
#92339 - $15.00 USD Received 1 Feb 2008; revised 18 Mar 2008; accepted 4 Apr 2008; published 11 Apr 2008
(C) 2008 OSA 14 April 2008 / Vol. 16, No. 8 / OPTICS EXPRESS 5915
2.6. Mie theory
With the known particle size distribution and the refractive index of the particles and the volumeconcentration, it is possible to calculate the optical properties, μ s, μ ′
s, g and the phase functionp(θ ), of the fat emulsions using Mie theory. The Mie theory is the analytical solution of theMaxwell’s equations for the scattering of electromagnetic wave by a single spherical particle[21]. To calculate the optical properties of a suspension of different particle sizes it is importantthat the particles are independently scattering. The independent scattering approximation isvalid for interparticle distances which are longer than the wavelength. This condition is validfor fat emulsions with scatterer concentration less than 4 Vol-% [12, 10].
On that condition separate Mie theory calculations can be employed for the different particlediameters d found in the solution. The scattering coefficient of the solution can be calculatedwith
μs = ∑d
Csca(d) ·σsca(d)V (d)
. (4)
μs equals the sum of the scattering cross sections Csca, which is calculated with Mie theory, forevery particle diameter weighted by the volume concentration σ sca (volume of fat and egg lipiddivided by the total volume) and particle volume V (d) = 4
3 π(d/2)3.The phase function of the whole solution is calculated analogous to Eq. 4. For every particle
diameter d a single phase function pi(θ ) can be calculated using Mie theory. The phase functionof the whole solution ptot(θ ) is the sum of all, unnormalized, pi(θ ) weighted by the number ofparticles Ni with the corresponding diameter
ptot(θ ) = ∑i
Ni · pi(θ )Ntot
, (5)
with the total number of particles, Ntot = ∑Ni. With the knowledge of the phase function theanisotropy factor g is determined by
g =∫
4π p(Ω)cosθdΩ∫
4π p(Ω)dΩ. (6)
2.7. Size distribution calculation
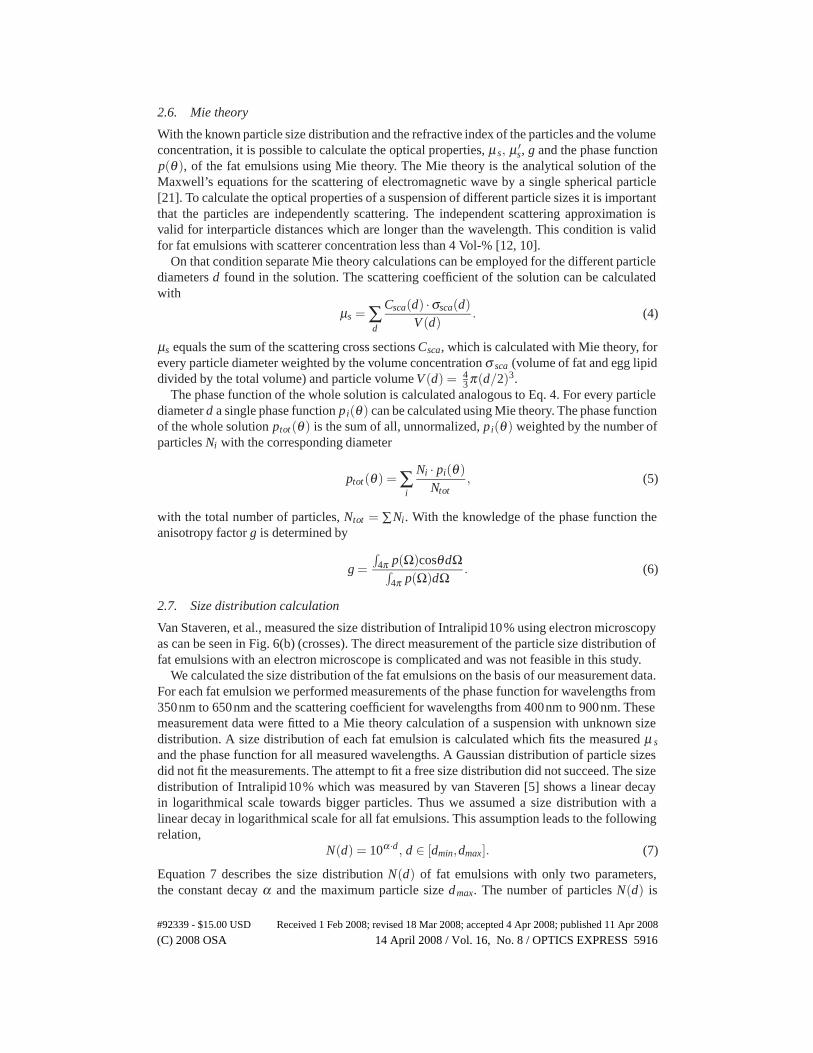
Van Staveren, et al., measured the size distribution of Intralipid10% using electron microscopyas can be seen in Fig. 6(b) (crosses). The direct measurement of the particle size distribution offat emulsions with an electron microscope is complicated and was not feasible in this study.
We calculated the size distribution of the fat emulsions on the basis of our measurement data.For each fat emulsion we performed measurements of the phase function for wavelengths from350nm to 650nm and the scattering coefficient for wavelengths from 400nm to 900nm. Thesemeasurement data were fitted to a Mie theory calculation of a suspension with unknown sizedistribution. A size distribution of each fat emulsion is calculated which fits the measured μ s
and the phase function for all measured wavelengths. A Gaussian distribution of particle sizesdid not fit the measurements. The attempt to fit a free size distribution did not succeed. The sizedistribution of Intralipid10% which was measured by van Staveren [5] shows a linear decayin logarithmical scale towards bigger particles. Thus we assumed a size distribution with alinear decay in logarithmical scale for all fat emulsions. This assumption leads to the followingrelation,
N(d) = 10α ·d, d ∈ [dmin,dmax]. (7)
Equation 7 describes the size distribution N(d) of fat emulsions with only two parameters,the constant decay α and the maximum particle size dmax. The number of particles N(d) is
#92339 - $15.00 USD Received 1 Feb 2008; revised 18 Mar 2008; accepted 4 Apr 2008; published 11 Apr 2008
(C) 2008 OSA 14 April 2008 / Vol. 16, No. 8 / OPTICS EXPRESS 5916
calculated for every particle diameter d from the minimum diameter d min to the maximumdiameter dmax. The smallest particles in fat emulsions are lipid micelles. A minimum micellesdiameter of dmin =25nm is assumed. The maximum diameter dmax can differ in dependence ofthe manufacturing process, thus it was a free fitting parameter. For the Mie theory calculation21 discrete values of d between dmin and dmax are used.
0 0.05 0.1 0.15 0.2 0.25 0.3 0.3510
−4
10−3
10−2
10−1
100
particle radius [µm]
num
ber o
f par
ticle
s [%
]
Intralipid 10%Intralipid 20%Intralipid 30%Lipovenös 10%Lipovenös 20%Clinoleic 20%Van Staveren
(a) (b)
Fig. 6. a) Plot of the measured scatterer concentration in different fat emulsions (greendots). The measurements match the Vol-% concentration of scatterers (red triangles) whichwas calculated from the contained soybean oil and egg lipid. b) Plot of the particle sizedistribution of the different fat emulsions which are used for the Mie theory calculations.
With Eq. 7 it is possible to fit the size distribution to the measurement results. Therefor thesize distribution was fitted with Mie theory to the whole phase function for 650nm (except inac-cessible parts) and the measured scattering coefficient for 650nm. The calculated size distribu-tions of all fat emulsions can be seen in the Fig. 6(b), the values of the two fitting parameters,α and dmax, are listed in Tab. 2.
Tab. 2. Coefficients for the calculation of the particle size distribution with Eq. 7 for differ-ent fat emulsions.
Lipovenoes10%
Lipovenoes20%
ClinOleic20%
Intralipid10%
Intralipid20%
Intralipid30%
α[m−1] -4.4086e6 -3.429e6 -5.074e6 -7.884e6 -4.151e6 -2.679e6dmax[m] 0.5477e-6 0.5133e-6 0.5494e-6 0.3497e-6 0.4739e-6 0.6607e-6
We note that the optical parameters calculated with Mie theory for the size distribution origi-nally measured by van Staveren [5] show no significant difference to the calculation with a sizedistribution which was approximated to his measurement results and obeys to Eq. 7.
3. Results
The direct measurements of μs, μ ′s, g and p(θ ) of six different fat emulsions within a wave-
length range from 400nm to 900nm are presented. Additionally, the optical properties are cal-culated with the Mie theory method which was explained in section 2.6 and the calculated sizedistribution of section 2.7. Finally simple equations are provided for the calculation of the op-tical properties of each measured fat emulsion for wavelengths from 400nm to 1000nm forunpolarized light.
#92339 - $15.00 USD Received 1 Feb 2008; revised 18 Mar 2008; accepted 4 Apr 2008; published 11 Apr 2008
(C) 2008 OSA 14 April 2008 / Vol. 16, No. 8 / OPTICS EXPRESS 5917
3.1. Phase function
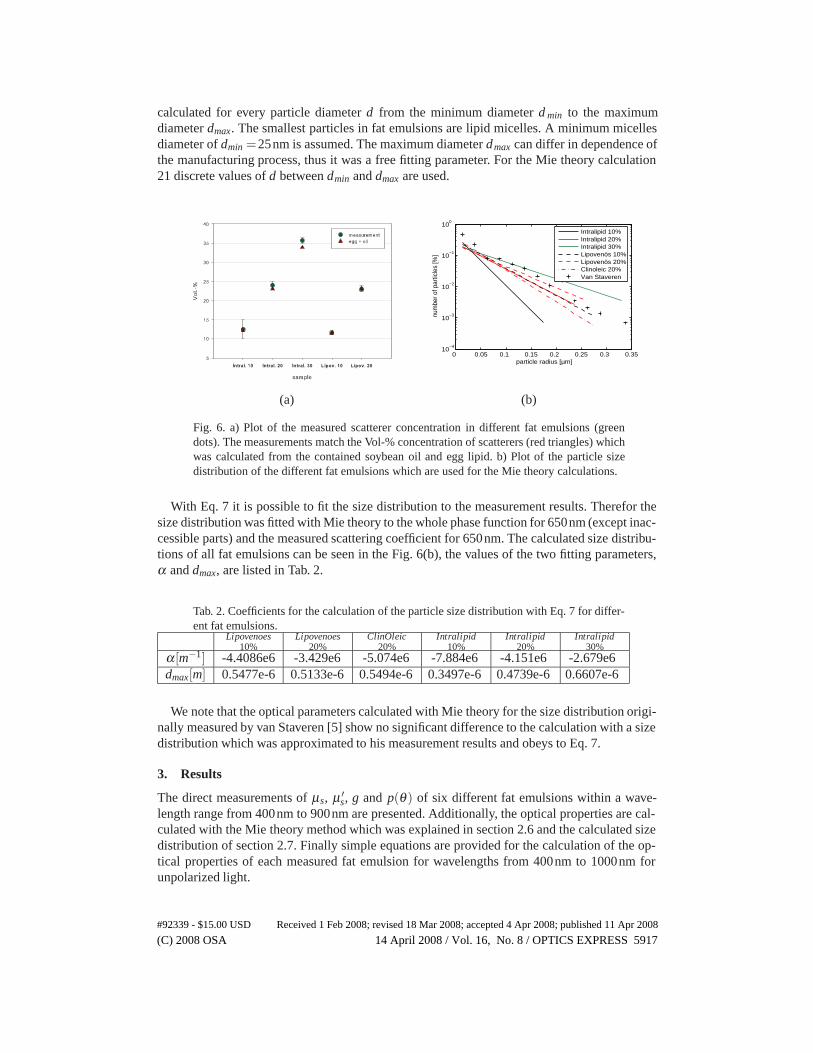
Since it would exceed the scope of this paper we cannot plot phase functions for 6 differentsamples, for parallel and perpendicular polarized light and for wavelenghts from 350 to 650nm.We concentrate on the discussion of the phase functions of 2 samples for 350 to 650nm. In Fig.7 the phase function of Lipovenoes10% and Intralipid20% was calculated with Mie theoryusing the derived particle distribution. The calculated phase functions are plotted against thecorresponding measurements. The calculations are forward corrected for the slab geometrycuvette. The calculations show a good correlation with the measured phase function apart fromregions which could not be measured. For shorter wavelengths deviations around 120° can beseen.
20 40 60 80 100 120 140 160
10−2
10−1
100
angle [°]
inte
nsity
[a.u
.]
λ=650 nm, measurementλ=550 nm, measurementλ=450 nm, measurementλ=350 nm, measurementλ=650 nm, Mie theoryλ=550 nm, Mie theoryλ=450 nm, Mie theoryλ=350 nm, Mie theory
0 50 100 150
10−2
10−1
100
angle [°]
inte
nsity
[a.u
.]
λ=650 nm, measurementλ=550 nm, measurementλ=450 nm, measurementλ=350 nm, measurementλ=650 nm, Mie theoryλ=550 nm, Mie theoryλ=450 nm, Mie theoryλ=350 nm, Mie theory
(a) (b)
Fig. 7. Comparison of the phase function calculated with Mie theory to the phase func-tion measurement for 2 different samples and 4 different wavelengths. The goniometricmeasurement is not corrected for distortions of the glass cuvette, but the Mie Theory cal-culation is forward corrected for a phase function measurement inside a glass cuvette. a)Comparison for Intralipid20%, b) Comparison for Lipovenoes10%.
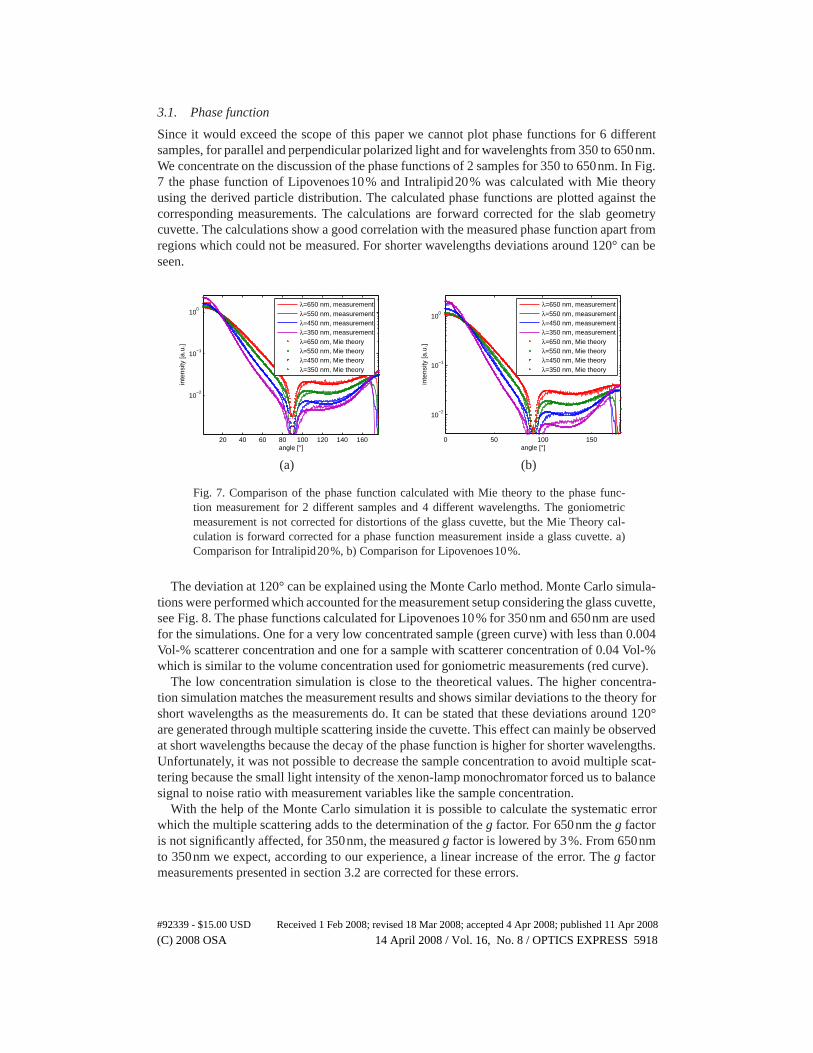
The deviation at 120° can be explained using the Monte Carlo method. Monte Carlo simula-tions were performed which accounted for the measurement setup considering the glass cuvette,see Fig. 8. The phase functions calculated for Lipovenoes10% for 350nm and 650nm are usedfor the simulations. One for a very low concentrated sample (green curve) with less than 0.004Vol-% scatterer concentration and one for a sample with scatterer concentration of 0.04 Vol-%which is similar to the volume concentration used for goniometric measurements (red curve).
The low concentration simulation is close to the theoretical values. The higher concentra-tion simulation matches the measurement results and shows similar deviations to the theory forshort wavelengths as the measurements do. It can be stated that these deviations around 120°are generated through multiple scattering inside the cuvette. This effect can mainly be observedat short wavelengths because the decay of the phase function is higher for shorter wavelengths.Unfortunately, it was not possible to decrease the sample concentration to avoid multiple scat-tering because the small light intensity of the xenon-lamp monochromator forced us to balancesignal to noise ratio with measurement variables like the sample concentration.
With the help of the Monte Carlo simulation it is possible to calculate the systematic errorwhich the multiple scattering adds to the determination of the g factor. For 650nm the g factoris not significantly affected, for 350nm, the measured g factor is lowered by 3%. From 650nmto 350nm we expect, according to our experience, a linear increase of the error. The g factormeasurements presented in section 3.2 are corrected for these errors.
#92339 - $15.00 USD Received 1 Feb 2008; revised 18 Mar 2008; accepted 4 Apr 2008; published 11 Apr 2008
(C) 2008 OSA 14 April 2008 / Vol. 16, No. 8 / OPTICS EXPRESS 5918
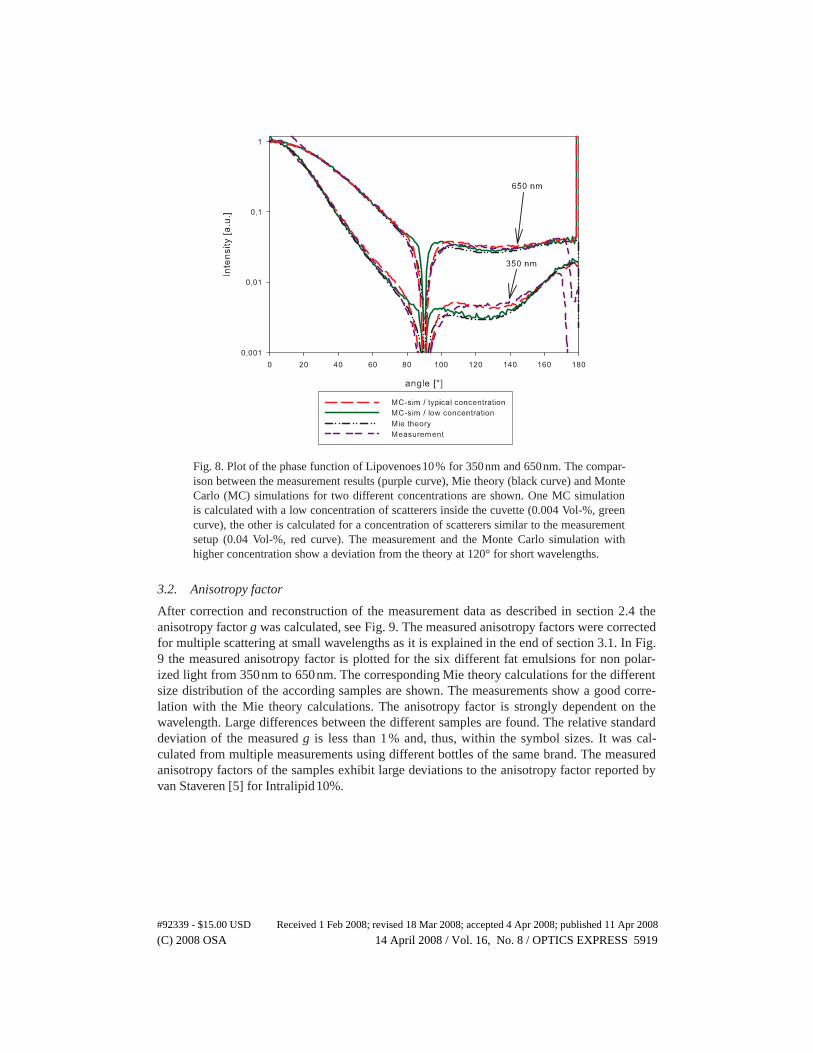
Fig. 8. Plot of the phase function of Lipovenoes10% for 350nm and 650nm. The compar-ison between the measurement results (purple curve), Mie theory (black curve) and MonteCarlo (MC) simulations for two different concentrations are shown. One MC simulationis calculated with a low concentration of scatterers inside the cuvette (0.004 Vol-%, greencurve), the other is calculated for a concentration of scatterers similar to the measurementsetup (0.04 Vol-%, red curve). The measurement and the Monte Carlo simulation withhigher concentration show a deviation from the theory at 120° for short wavelengths.
3.2. Anisotropy factor
After correction and reconstruction of the measurement data as described in section 2.4 theanisotropy factor g was calculated, see Fig. 9. The measured anisotropy factors were correctedfor multiple scattering at small wavelengths as it is explained in the end of section 3.1. In Fig.9 the measured anisotropy factor is plotted for the six different fat emulsions for non polar-ized light from 350nm to 650nm. The corresponding Mie theory calculations for the differentsize distribution of the according samples are shown. The measurements show a good corre-lation with the Mie theory calculations. The anisotropy factor is strongly dependent on thewavelength. Large differences between the different samples are found. The relative standarddeviation of the measured g is less than 1% and, thus, within the symbol sizes. It was cal-culated from multiple measurements using different bottles of the same brand. The measuredanisotropy factors of the samples exhibit large deviations to the anisotropy factor reported byvan Staveren [5] for Intralipid10%.
#92339 - $15.00 USD Received 1 Feb 2008; revised 18 Mar 2008; accepted 4 Apr 2008; published 11 Apr 2008
(C) 2008 OSA 14 April 2008 / Vol. 16, No. 8 / OPTICS EXPRESS 5919
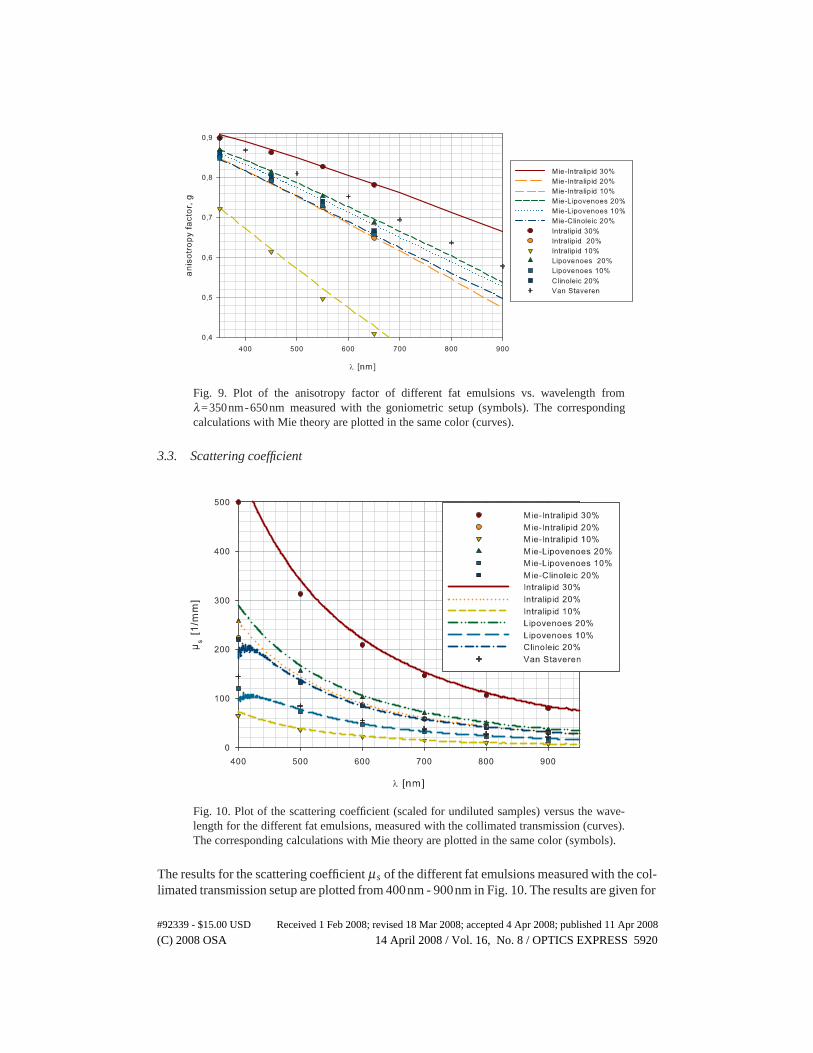
Fig. 9. Plot of the anisotropy factor of different fat emulsions vs. wavelength fromλ=350nm-650nm measured with the goniometric setup (symbols). The correspondingcalculations with Mie theory are plotted in the same color (curves).
3.3. Scattering coefficient
Fig. 10. Plot of the scattering coefficient (scaled for undiluted samples) versus the wave-length for the different fat emulsions, measured with the collimated transmission (curves).The corresponding calculations with Mie theory are plotted in the same color (symbols).
The results for the scattering coefficient μs of the different fat emulsions measured with the col-limated transmission setup are plotted from 400nm - 900nm in Fig. 10. The results are given for
#92339 - $15.00 USD Received 1 Feb 2008; revised 18 Mar 2008; accepted 4 Apr 2008; published 11 Apr 2008
(C) 2008 OSA 14 April 2008 / Vol. 16, No. 8 / OPTICS EXPRESS 5920
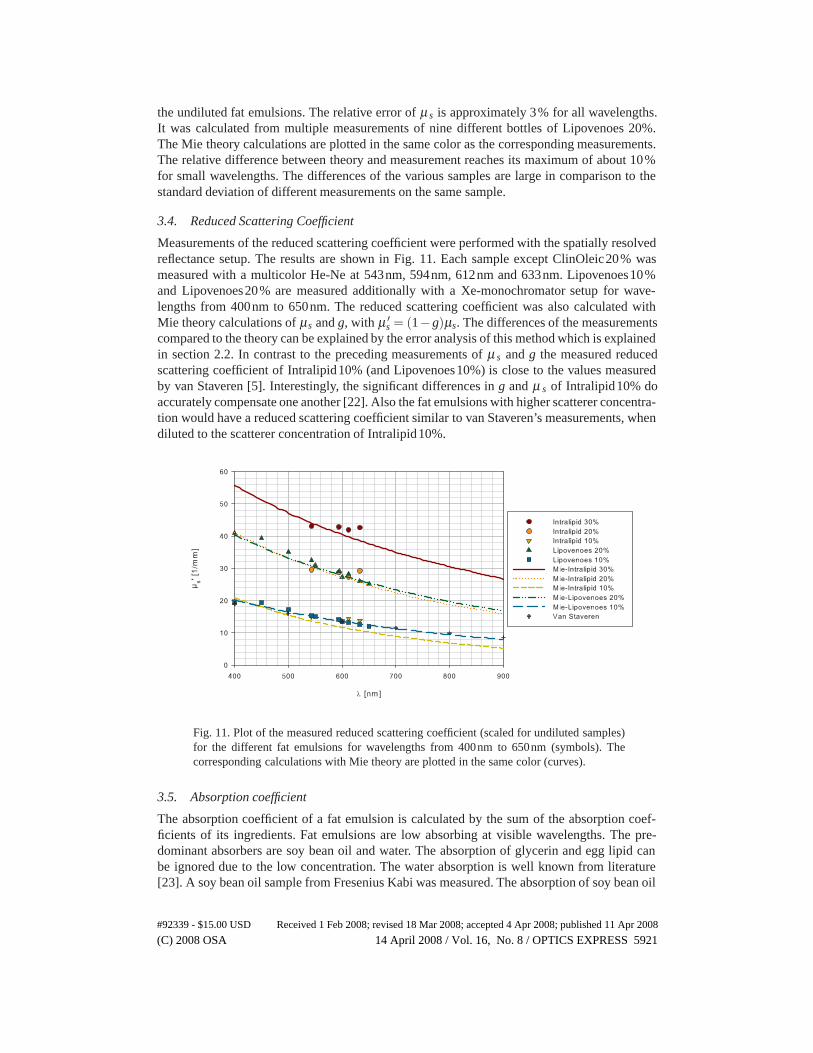
the undiluted fat emulsions. The relative error of μ s is approximately 3% for all wavelengths.It was calculated from multiple measurements of nine different bottles of Lipovenoes 20%.The Mie theory calculations are plotted in the same color as the corresponding measurements.The relative difference between theory and measurement reaches its maximum of about 10%for small wavelengths. The differences of the various samples are large in comparison to thestandard deviation of different measurements on the same sample.
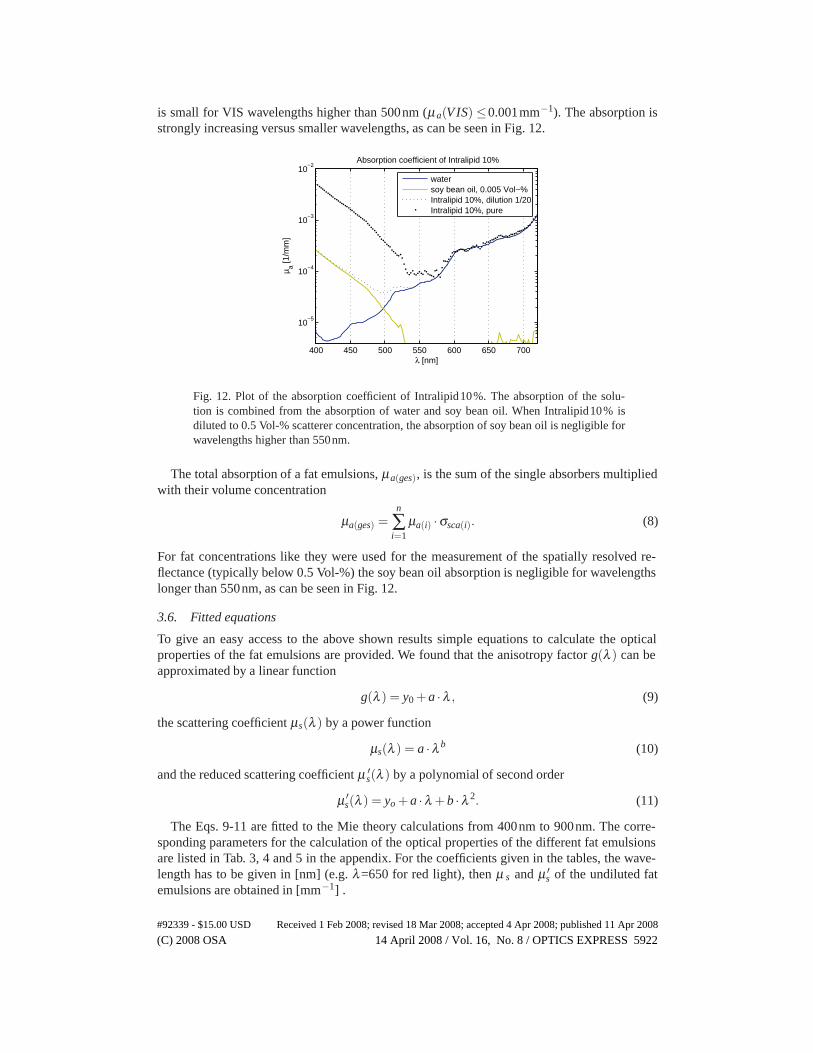
3.4. Reduced Scattering Coefficient
Measurements of the reduced scattering coefficient were performed with the spatially resolvedreflectance setup. The results are shown in Fig. 11. Each sample except ClinOleic20% wasmeasured with a multicolor He-Ne at 543nm, 594nm, 612nm and 633nm. Lipovenoes10%and Lipovenoes20% are measured additionally with a Xe-monochromator setup for wave-lengths from 400nm to 650nm. The reduced scattering coefficient was also calculated withMie theory calculations of μs and g, with μ ′
s = (1−g)μs. The differences of the measurementscompared to the theory can be explained by the error analysis of this method which is explainedin section 2.2. In contrast to the preceding measurements of μ s and g the measured reducedscattering coefficient of Intralipid10% (and Lipovenoes10%) is close to the values measuredby van Staveren [5]. Interestingly, the significant differences in g and μ s of Intralipid10% doaccurately compensate one another [22]. Also the fat emulsions with higher scatterer concentra-tion would have a reduced scattering coefficient similar to van Staveren’s measurements, whendiluted to the scatterer concentration of Intralipid10%.
Fig. 11. Plot of the measured reduced scattering coefficient (scaled for undiluted samples)for the different fat emulsions for wavelengths from 400nm to 650nm (symbols). Thecorresponding calculations with Mie theory are plotted in the same color (curves).
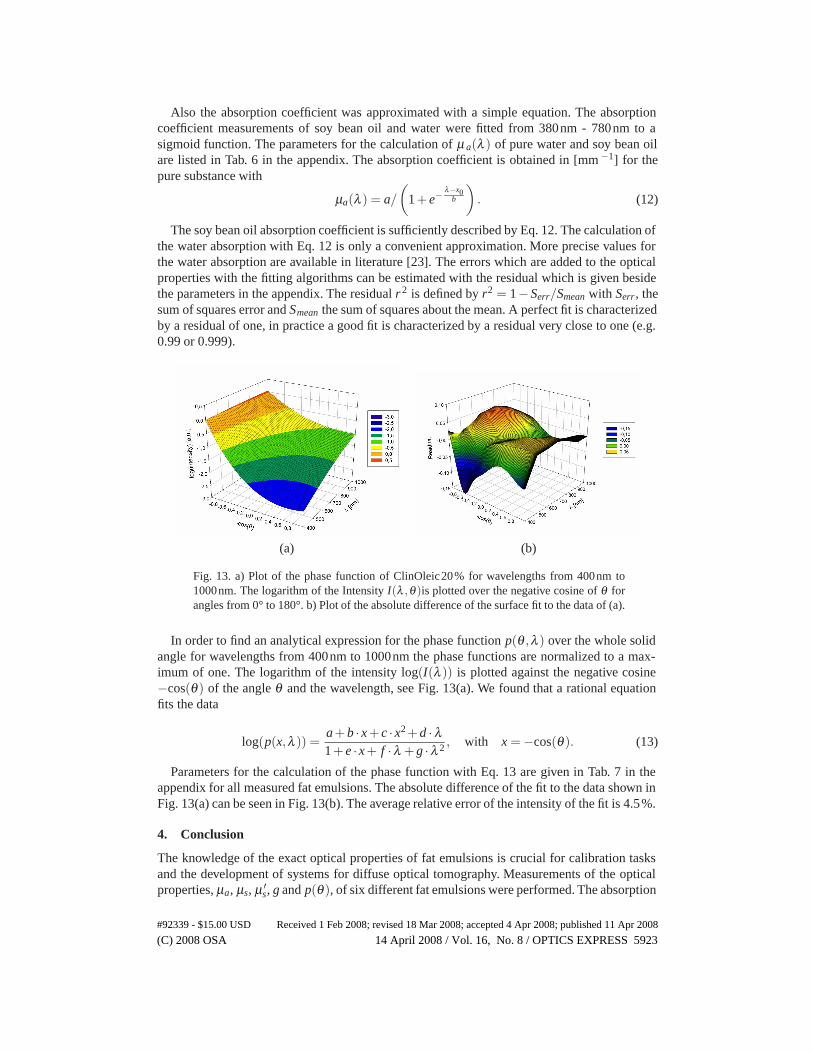
3.5. Absorption coefficient
The absorption coefficient of a fat emulsion is calculated by the sum of the absorption coef-ficients of its ingredients. Fat emulsions are low absorbing at visible wavelengths. The pre-dominant absorbers are soy bean oil and water. The absorption of glycerin and egg lipid canbe ignored due to the low concentration. The water absorption is well known from literature[23]. A soy bean oil sample from Fresenius Kabi was measured. The absorption of soy bean oil
#92339 - $15.00 USD Received 1 Feb 2008; revised 18 Mar 2008; accepted 4 Apr 2008; published 11 Apr 2008
(C) 2008 OSA 14 April 2008 / Vol. 16, No. 8 / OPTICS EXPRESS 5921
is small for VIS wavelengths higher than 500nm (μa(VIS) ≤0.001mm−1). The absorption isstrongly increasing versus smaller wavelengths, as can be seen in Fig. 12.
400 450 500 550 600 650 700
10−5
10−4
10−3
10−2
λ [nm]
µ a [1/m
m]
Absorption coefficient of Intralipid 10%
watersoy bean oil, 0.005 Vol−%Intralipid 10%, dilution 1/20Intralipid 10%, pure
Fig. 12. Plot of the absorption coefficient of Intralipid10%. The absorption of the solu-tion is combined from the absorption of water and soy bean oil. When Intralipid10% isdiluted to 0.5 Vol-% scatterer concentration, the absorption of soy bean oil is negligible forwavelengths higher than 550nm.
The total absorption of a fat emulsions, μa(ges), is the sum of the single absorbers multipliedwith their volume concentration
μa(ges) =n
∑i=1
μa(i) ·σsca(i). (8)
For fat concentrations like they were used for the measurement of the spatially resolved re-flectance (typically below 0.5 Vol-%) the soy bean oil absorption is negligible for wavelengthslonger than 550nm, as can be seen in Fig. 12.
3.6. Fitted equations
To give an easy access to the above shown results simple equations to calculate the opticalproperties of the fat emulsions are provided. We found that the anisotropy factor g(λ ) can beapproximated by a linear function
g(λ ) = y0 + a ·λ , (9)
the scattering coefficient μs(λ ) by a power function
μs(λ ) = a ·λ b (10)
and the reduced scattering coefficient μ ′s(λ ) by a polynomial of second order
μ ′s(λ ) = yo + a ·λ + b ·λ 2. (11)
The Eqs. 9-11 are fitted to the Mie theory calculations from 400nm to 900nm. The corre-sponding parameters for the calculation of the optical properties of the different fat emulsionsare listed in Tab. 3, 4 and 5 in the appendix. For the coefficients given in the tables, the wave-length has to be given in [nm] (e.g. λ=650 for red light), then μ s and μ ′
s of the undiluted fatemulsions are obtained in [mm−1] .
#92339 - $15.00 USD Received 1 Feb 2008; revised 18 Mar 2008; accepted 4 Apr 2008; published 11 Apr 2008
(C) 2008 OSA 14 April 2008 / Vol. 16, No. 8 / OPTICS EXPRESS 5922
Also the absorption coefficient was approximated with a simple equation. The absorptioncoefficient measurements of soy bean oil and water were fitted from 380nm - 780nm to asigmoid function. The parameters for the calculation of μ a(λ ) of pure water and soy bean oilare listed in Tab. 6 in the appendix. The absorption coefficient is obtained in [mm −1] for thepure substance with
μa(λ ) = a/
(
1+ e−λ−x0
b
)
. (12)
The soy bean oil absorption coefficient is sufficiently described by Eq. 12. The calculation ofthe water absorption with Eq. 12 is only a convenient approximation. More precise values forthe water absorption are available in literature [23]. The errors which are added to the opticalproperties with the fitting algorithms can be estimated with the residual which is given besidethe parameters in the appendix. The residual r 2 is defined by r2 = 1−Serr/Smean with Serr, thesum of squares error and Smean the sum of squares about the mean. A perfect fit is characterizedby a residual of one, in practice a good fit is characterized by a residual very close to one (e.g.0.99 or 0.999).
(a) (b)
Fig. 13. a) Plot of the phase function of ClinOleic20% for wavelengths from 400nm to1000nm. The logarithm of the Intensity I(λ ,θ )is plotted over the negative cosine of θ forangles from 0° to 180°. b) Plot of the absolute difference of the surface fit to the data of (a).
In order to find an analytical expression for the phase function p(θ ,λ ) over the whole solidangle for wavelengths from 400nm to 1000nm the phase functions are normalized to a max-imum of one. The logarithm of the intensity log(I(λ )) is plotted against the negative cosine−cos(θ ) of the angle θ and the wavelength, see Fig. 13(a). We found that a rational equationfits the data
log(p(x,λ )) =a+ b · x+ c · x2+ d ·λ1+ e · x+ f ·λ + g ·λ 2 , with x = −cos(θ ). (13)
Parameters for the calculation of the phase function with Eq. 13 are given in Tab. 7 in theappendix for all measured fat emulsions. The absolute difference of the fit to the data shown inFig. 13(a) can be seen in Fig. 13(b). The average relative error of the intensity of the fit is 4.5%.
4. Conclusion
The knowledge of the exact optical properties of fat emulsions is crucial for calibration tasksand the development of systems for diffuse optical tomography. Measurements of the opticalproperties, μa, μs, μ ′
s, g and p(θ ), of six different fat emulsions were performed. The absorption
#92339 - $15.00 USD Received 1 Feb 2008; revised 18 Mar 2008; accepted 4 Apr 2008; published 11 Apr 2008
(C) 2008 OSA 14 April 2008 / Vol. 16, No. 8 / OPTICS EXPRESS 5923
coefficient of the fat emulsions was calculated from the water and soy bean absorption as wasexplained in section 3.5. The optical properties of the six fat emulsions were completely definedfor VIS and NIR wavelengths.
The differences in μs, g and p(θ ) of the different brands are significant and bigger thanthe standard deviations measured for different bottles of the same brand and concentration.Interestingly, also the same brands with different fat concentrations have significant differencesin μs, g and p(θ ) when diluted to the same fat concentration. Our measurements of μ s, g andp(θ ) of Intralipid10% shows large deviations to the measurements of van Staveren in 1991[5]. This may be explained by changes in the recipe and the manufacturing of Intralipid since1991. Interestingly the measurements of the reduced scattering coefficient of Intralipid10% arein good agreement with van Staverens findings. The significant deviations of μ s and g do justcompensate each other when calculating the reduced scattering coefficient with μ ′
s = (1−g)μs.Also all other fat emulsions show a similar reduced scattering coefficient when diluted to thescatterer concentration of Intralipid10%.
We introduced method to calculate the particle size distribution by fitting Mie theory cal-culations to the phase function measurements and to collimated transmission measurementssimultaneously. We computed the particle size distribution of six different emulsions. With theknowledge of the particle size distribution the optical properties, μ s, μ ′
s, g and the phase func-tion, were calculated with Mie theory. The calculations match the measurements reasonablewell in the range of the measurement accuracy. With this method it was possible to calculatethe optical properties also for wavelengths, at which no measurements have been performed. Incomparison to standard methods for the particle size distribution measurement we got a morerealistic result for the particle size distribution which could explain the optical properties well.Since the calculation with Mie theory is complicated, we introduced simple equations for thecalculation of μa, μs, μ ′
s, g and p(θ ) for unpolarized light. We presented parameters for sixdifferent fat emulsions for calculating the optical properties and the phase function with theseequations for wavelengths from 400nm - 900nm in the appendix.
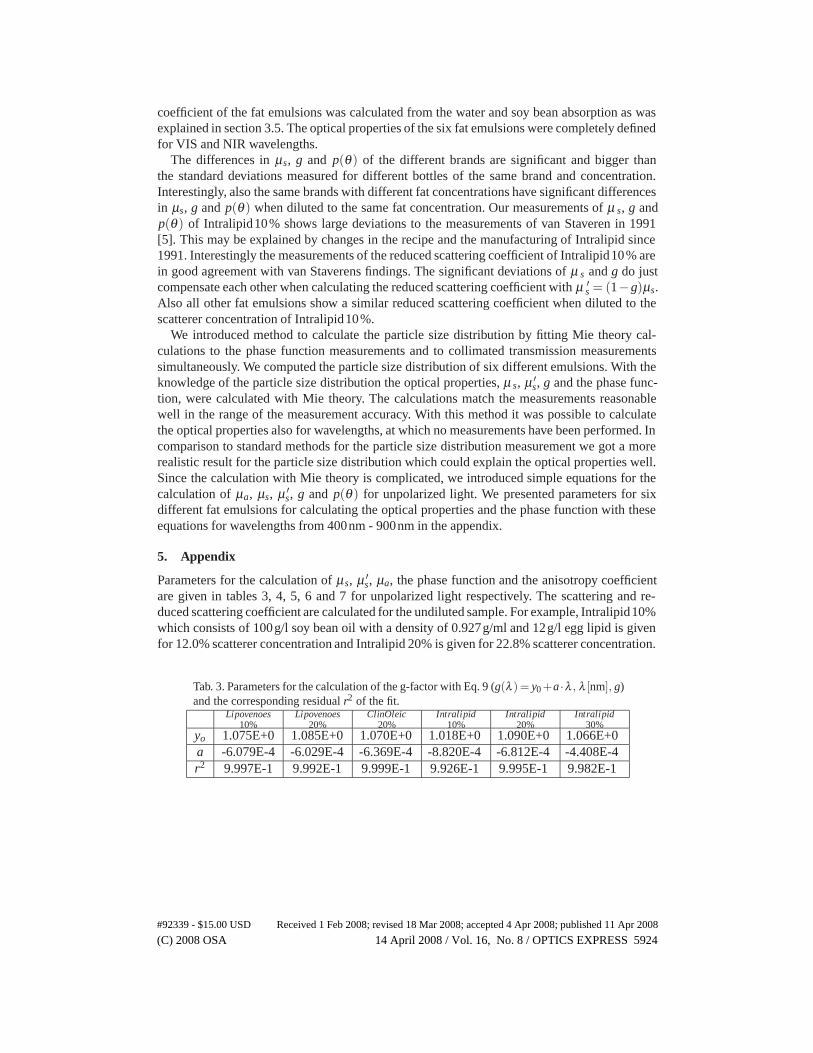
5. Appendix
Parameters for the calculation of μs, μ ′s, μa, the phase function and the anisotropy coefficient
are given in tables 3, 4, 5, 6 and 7 for unpolarized light respectively. The scattering and re-duced scattering coefficient are calculated for the undiluted sample. For example, Intralipid10%which consists of 100g/l soy bean oil with a density of 0.927g/ml and 12g/l egg lipid is givenfor 12.0% scatterer concentration and Intralipid 20% is given for 22.8% scatterer concentration.
Tab. 3. Parameters for the calculation of the g-factor with Eq. 9 (g(λ ) = y0 +a ·λ , λ [nm], g)and the corresponding residual r2 of the fit.
Lipovenoes10%
Lipovenoes20%
ClinOleic20%
Intralipid10%
Intralipid20%
Intralipid30%
yo 1.075E+0 1.085E+0 1.070E+0 1.018E+0 1.090E+0 1.066E+0a -6.079E-4 -6.029E-4 -6.369E-4 -8.820E-4 -6.812E-4 -4.408E-4r2 9.997E-1 9.992E-1 9.999E-1 9.926E-1 9.995E-1 9.982E-1
#92339 - $15.00 USD Received 1 Feb 2008; revised 18 Mar 2008; accepted 4 Apr 2008; published 11 Apr 2008
(C) 2008 OSA 14 April 2008 / Vol. 16, No. 8 / OPTICS EXPRESS 5924
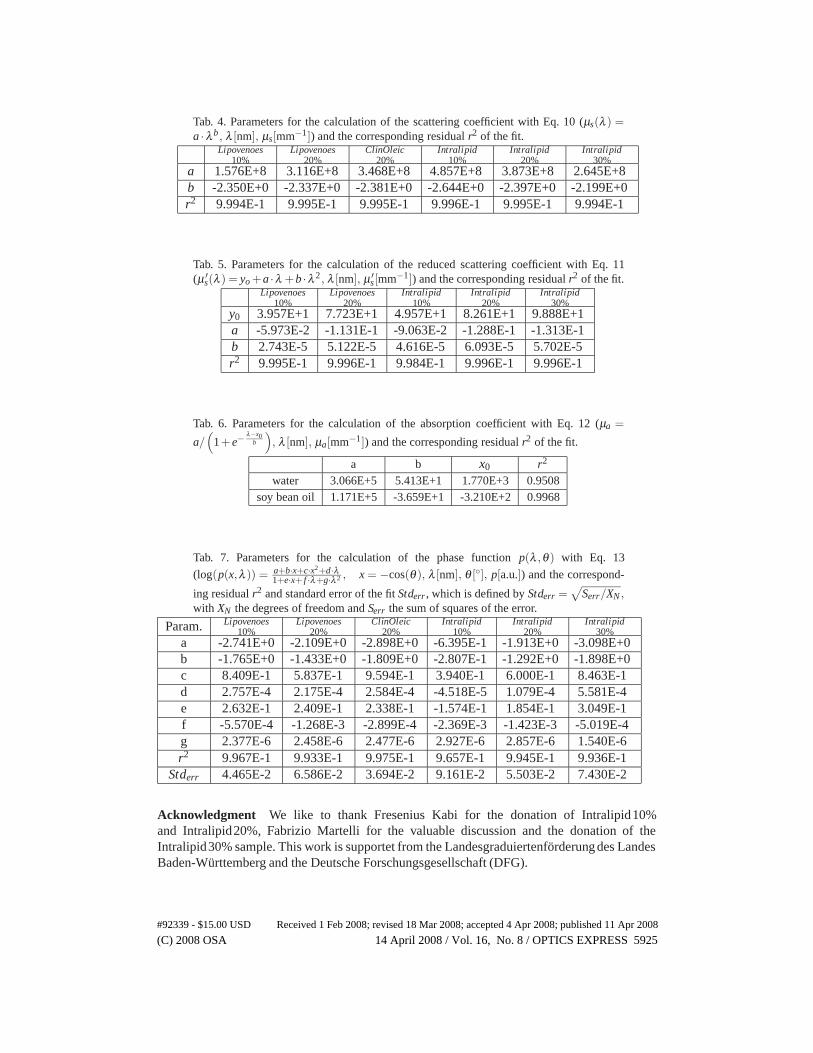
Tab. 4. Parameters for the calculation of the scattering coefficient with Eq. 10 (μs(λ ) =a ·λ b, λ [nm], μs[mm−1]) and the corresponding residual r2 of the fit.
Lipovenoes10%
Lipovenoes20%
ClinOleic20%
Intralipid10%
Intralipid20%
Intralipid30%
a 1.576E+8 3.116E+8 3.468E+8 4.857E+8 3.873E+8 2.645E+8b -2.350E+0 -2.337E+0 -2.381E+0 -2.644E+0 -2.397E+0 -2.199E+0r2 9.994E-1 9.995E-1 9.995E-1 9.996E-1 9.995E-1 9.994E-1
Tab. 5. Parameters for the calculation of the reduced scattering coefficient with Eq. 11(μ ′
s(λ ) = yo +a ·λ +b ·λ2, λ [nm], μ ′s[mm−1]) and the corresponding residual r2 of the fit.
Lipovenoes10%
Lipovenoes20%
Intralipid10%
Intralipid20%
Intralipid30%
y0 3.957E+1 7.723E+1 4.957E+1 8.261E+1 9.888E+1a -5.973E-2 -1.131E-1 -9.063E-2 -1.288E-1 -1.313E-1b 2.743E-5 5.122E-5 4.616E-5 6.093E-5 5.702E-5r2 9.995E-1 9.996E-1 9.984E-1 9.996E-1 9.996E-1
Tab. 6. Parameters for the calculation of the absorption coefficient with Eq. 12 (μa =
a/(
1+e−λ−x0
b
), λ [nm], μa[mm−1]) and the corresponding residual r2 of the fit.
a b x0 r2
water 3.066E+5 5.413E+1 1.770E+3 0.9508soy bean oil 1.171E+5 -3.659E+1 -3.210E+2 0.9968
Tab. 7. Parameters for the calculation of the phase function p(λ ,θ ) with Eq. 13
(log(p(x,λ )) = a+b·x+c·x2+d·λ1+e·x+ f ·λ+g·λ 2 , x = −cos(θ ), λ [nm], θ [◦], p[a.u.]) and the correspond-
ing residual r2 and standard error of the fit Stderr , which is defined by Stderr =√
Serr/XN ,with XN the degrees of freedom and Serr the sum of squares of the error.
Param. Lipovenoes10%
Lipovenoes20%
ClinOleic20%
Intralipid10%
Intralipid20%
Intralipid30%
a -2.741E+0 -2.109E+0 -2.898E+0 -6.395E-1 -1.913E+0 -3.098E+0b -1.765E+0 -1.433E+0 -1.809E+0 -2.807E-1 -1.292E+0 -1.898E+0c 8.409E-1 5.837E-1 9.594E-1 3.940E-1 6.000E-1 8.463E-1d 2.757E-4 2.175E-4 2.584E-4 -4.518E-5 1.079E-4 5.581E-4e 2.632E-1 2.409E-1 2.338E-1 -1.574E-1 1.854E-1 3.049E-1f -5.570E-4 -1.268E-3 -2.899E-4 -2.369E-3 -1.423E-3 -5.019E-4g 2.377E-6 2.458E-6 2.477E-6 2.927E-6 2.857E-6 1.540E-6r2 9.967E-1 9.933E-1 9.975E-1 9.657E-1 9.945E-1 9.936E-1
Stderr 4.465E-2 6.586E-2 3.694E-2 9.161E-2 5.503E-2 7.430E-2
Acknowledgment We like to thank Fresenius Kabi for the donation of Intralipid10%and Intralipid20%, Fabrizio Martelli for the valuable discussion and the donation of theIntralipid30% sample. This work is supportet from the Landesgraduiertenförderungdes LandesBaden-Württemberg and the Deutsche Forschungsgesellschaft (DFG).
#92339 - $15.00 USD Received 1 Feb 2008; revised 18 Mar 2008; accepted 4 Apr 2008; published 11 Apr 2008
(C) 2008 OSA 14 April 2008 / Vol. 16, No. 8 / OPTICS EXPRESS 5925


![[Presentation (pdf, 4.2 Mb)] - Harvard Universityacmg.seas.harvard.edu/presentations/IGC6/talks/MonD_BC_curci... · SENSITIVITY TESTS WITH GEOS-Chem AEROSOL OPTICAL PROPERTIES: THE](https://static.fdocument.org/doc/165x107/5a9d74e07f8b9abd058d5ffa/presentation-pdf-42-mb-harvard-tests-with-geos-chem-aerosol-optical-properties.jpg)