Oil spills bioremediation in marine environment-biofilm ...
178
i Oil spills bioremediation in marine environment-biofilm characterization around oil droplets Βιοαποδόμηση πετρελαιοειδών σε θαλάσσιο περιβάλλον - Χαρακτηρισμός σχηματισμού βιοστιβάδας σε σταγονίδια υδρογονανθράκων
Transcript of Oil spills bioremediation in marine environment-biofilm ...

i
Oil spills bioremediation in marine environment-biofilm
characterization around oil droplets
Βιοαποδόμηση πετρελαιοειδών σε θαλάσσιο περιβάλλον -
Χαρακτηρισμός σχηματισμού βιοστιβάδας σε σταγονίδια
υδρογονανθράκων

ii

iii
Examination Committee Nicolas Kalogerakis – Supervisor
Professor, Division II: Environmental Process Design and Analysis, School of Environmental Engineering, Technical University of Crete,
Chania, Greece
Nikos Pasadakis – Advisory Committee
Associate Professor
School of Mineral Resources Engineering, Technical University of Crete, Chania, Greece
Dr. Thomas R. Neu – Advisory Committee
Head of Group - Microbiology of Interfaces, Department River Ecology,
Helmholtz Centre for Environmental Research – UFZ, Magdeburg, Germany
Evangelos Gidarakos
Professor, Division I: Environmental Management School of Environmental Engineering, Technical University of Crete, Chania, Greece
Elia Psillakis
Associate Professor, Division II: Environmental Process Design and Analysis
School of Environmental Engineering, Technical University of Crete, Chania, Greece
Danae Venieri
Assistant Professor, Division II: Environmental Process Design and
Analysis School of Environmental Engineering, Technical University of Crete,
Chania, Greece
Marina Pantazidou
Associate Professor Department of Geotechnical Engineering, School of Civil Engineering,
National Technical University of Athens, Athens, Greece

iv
v
Acknowledgments
This work was funded by FP-7 PROJECT No. 266473 “Unravelling and exploiting
Mediterranean Sea microbial diversity and ecology for xenobiotics’ and pollutants’
clean up” – ULIXES and by the European Union (European Social Fund – ESF) and
Greek national funds through the Operational Program "Education and Lifelong
Learning" of the National Strategic Reference Framework (NSRF) - Research
Funding Program: Heracleitus II. Investing in knowledge society through the
European Social Fund.
First I would like to express my gratitude to my supervisor professor N. Kalogerakis
for his support, advice and guidance in completing this study. His judgment,
frustrating but also creative, was a stimulating process throughout all these years.
Special thanks to Associate Professor N. Pasadakis for his guidance and valuable
advice during my work in his lab and for the long, stimulating though, discussions
about this work.
I sincerely thank Dr. T. Neu for his hospitality, guidance and valuable observations
during my work in his lab at UFZ, Magdeburg.
At this point I would also like to express special thanks to his assistant Ute Kuhlicke
for her support, instructions but most of all for her company during the long dark
hours spent in front of the confocal laser scanning microscope (CLSM).
I also would like to thank Assistant Professor D. Venieri for her valuable advice, kind
support during my work and particularly for her consult in microbiological and
molecular assays whenever needed.
I have also to acknowledge S. Fodelianakis for his contribution in Pyrotag sequencing
analysis of this work.
I have to acknowledge the seven-member Examination Committee for their agreement
to participate and contribute with comments to this PhD thesis.
I must extend a special word of Thanks to friends and family who have supported me
throughout my various tasks of this PhD thesis.
Thank you Arly, Dora, Magda for all the laughs and keeping me sane in the lab and
encouraging me to carry on throughout disappointing and difficult periods.
Last but certainly not least to my parents Panagiotis and Eleni for being there for me
throughout my study period supporting my choices and encouraging me to follow my
decisions respecting my values no matter how difficult they would be.
I would like to thank my lovely husband George for his support and understanding,
although he did not always like the time I spent on this work, I know his is proud on
the end result.

vi
vii
Abstract
Oil spills are considered a widespread problem after the last accident at the Mexico
Gulf that poses great threat for any ecosystem. Specifically Mediterranean coastal
regions are exposed to oil pollution due to extensive industrialization and urbanization
and transport of crude and refined oil to and from refineries. The impact of an oil spill
in this closed sea and particularly in the Greek coastline and sea that are popular
touristic destinations and shelter of many marine species can be disastrous. First
response options, such as physical removal (e.g. booms, skimmers, adsorbents, etc.)
and dispersants whenever applicable due to their potential toxicity rarely achieve
complete cleanup of oil spills.
Nevertheless, major oil spills highlight the need for environmentally responsible and
cost-effective mitigation technologies. Bioremediation through bioaugmentation
(addition of oil-degrading bacteria) and/or biostimulation (addition of nutrients N&P)
constitutes a promising strategy for combatting oil spills following first response
actions and recent technological advances could promote bioremediation to a priority
option in combating oil spills. However, bioaugmentation is one of the most
controversial issues in bioremediation since nutrient addition alone has been found to
have a greater effect on oil biodegradation than the addition of microbial products that
are highly dependent on environmental conditions. There is increasing evidence that
the best way to overcome the above barriers is to exclusively use microorganisms
indigenous to the sites (soil, sand, and water) to be decontaminated, an approach
termed “autochthonous bioaugmentation” (ABA).
The specific aims of the present work were to investigate possible methods to enhance
the rate of biodegradation of oil in a contaminated marine environment (both seawater
and shoreline). Hence we investigated the capability of either acclimated indigenous
microbial consortium or hydrocarbon degraders consortium enriched from seawater
samples taken from Hellenic Petroleum Refinery (Athens, Greece) a site exposed to
chronic pollution with crude oil (ABA) in the presence or absence of other rate
limiting factors like nutrients and biosurfactants (biostimulation) as a potential
strategy for the successful remediation of polluted marine environments. In addition
the effectiveness of these certain acclimated consortia (ABA) was compared to
indigenous population activity (biostimulation) on the bioremediation of oil spills.
Specifically the effects of the lipophilic nutrients (uric acid and lecithin) and inorganic
nutrients (KNO3, K2HPO4) with or without biosurfactants on the degradation of crude
oil hydrocarbons in both seawater and sand matrix were also examined. While
bioremediation in liquid matrices (seawater) is implemented in a more direct way, in
the soil matrix (sand) is achieved through landfarming which is both simple and cost-
effective to implement compared with other treatment technologies.
Thus the outcome approaches include 4 sets of experiments:
1. Autochthonous bioaugmentation and/or biostimulation of seawater microcosm
(i.e. Seawater 1)
2. Autochthonous bioaugmentation & biostimulation with isolated hydrocarbon
degraders consortium of seawater microcosm (i.e. Seawater 2)
3. Landfarming of oil polluted beach sand through biostimulation (i.e. Sand 1)
4. Landfarming of oil polluted beach sand through autochthonous bioaugmentation
& biostimulation (i.e. Sand 2)
The method which has been used for the evaluation of these bioremediation methods
is based on a modified bioremediation agent effectiveness testing protocol by EPA

viii
(40 CFR Ch. I, Pt 300, App. C, 2003). The protocol tests for microbial activity by
Most Probable Number (MPN) determination and quantifies the disappearance of
saturated hydrocarbons and polynuclear aromatic hydrocarbons (PAHs) by GC-MS
analysis. Moreover the disappearance extent (degradation rate) of certain compounds
from both saturated fraction (n-alkanes) and aromatic fraction (PAHs was also
investigated through biodegradation kinetics analysis (Batch reactor). Furthermore
identification of the key microorganisms in oil biodegradation community response
and composition changes among different amendments was also performed through
molecular analysis (PCR, RT-PCR, pyrotag Sequencing) of DNA extracts from each
treatment.
Hydrocarbon degrading bacteria as shown by several studies have a high affinity to
oil droplets which indicates that oil bioremediation is a complex process that involves
interactions between oil and microorganisms under certain environmental conditions.
Therefore in this study another set of experiments investigating and characterizing the
interaction of hydrocarbon degraders consortia on oil and eicosane droplets (cellular
level) by means of confocal laser scanning microscopy (CLSM) was also included.
Moreover their response after the addition of certain commercial dispersants just like
those that have been or could be used in the event of a real oil spill (Corexit, S200,
Marichem) but also of more environmentally friendly biosurfactants (Rhamnolipids)
was also examined.
Investigation through chemical, microbiological and kinetics analysis (specific
degradation rate, qs) has revealed that Seawater 1 experimental set in which
acclimated or not indigenous microorganisms were used performed far better than
Sand 1 experimental set in which degradation was induced only by indigenous
microbial populations and despite the fact that combined Rhamnolipids and lipophilic
nutrients were used still microbial response was not as strong as in Seawater 1
experimental set. Bioavailability of oil hydrocarbons is the critical factor that affects
the efficiency of bioremediation in oil contaminated environments and It can be
concluded that in Seawater 1 experimental set biosurfactants, in particular
rhamnolipids, accelerated the biodegradation of crude oil by making it more available
to microorganisms as expected in the two ABA treatments (ULRM-Uric acid,
Lecithin, Rhamnolipinds and preadapted indigenous Microorganisms & NPKMR-
Inorganic nutrients, Rhamnolipinds and preadapted indigenous Microorganisms) and
the biostimulation treatment (ULR- Uric acid, Lecithin, Rhamnolipinds).
On the other hand Sand 2 experimental set seemed more successful than Seawater 2
experimental set in which both experimental sets the same consortium (Eb8) was
used. However it should be noted that despite the fact that Rhamnolipids were added
lipophilic nutrients were not included in Seawater 2 experimental set, which possibly
had contributed to the less successful performance of NPKMR treatment of Seawater
2 experimental set compared to ULRM treatment of Sand 2 experimental set.
Combined application of Rhamnolipids and lipophilic nutrients could be beneficial in
liquid matrix (seawater), however when applied to solid matrix their performance is
questioned compared to one in the liquid matrix. On the contrary inorganic nutrients
usually being washed out when applied in seawater perform better when applied to
sand almost equally to ULR combined performance. Inconsistent behaviour of ULR
(Sand 1 experimental set) and ULRM (Sand 2 experimental set) treatments between
the two oil fractions (alkanes-PAHs) compared to NPK (Sand 1 experimental set) and
NPKM (Sand 2 experimental set) treatments respectively could support this
conclusion. Still overall ULR treatment performance suggests that the presence of

ix
biosurfactant could possibly have contributed to utilization of lipophilic nutrients by
making them more available to soil microorganisms.
Nonetheless especially in the soil matrix (sand) bioavailability of hydrophobic
compounds is often the rate-limiting step in the process and the efficiency of
biosurfactants or other rate limiting co-substrates mainly could be attributed to the
interactions between target organic compounds, bacterial species, water content and
surfactants.
Different types of amendments provoke different structures in the resulting
biodegradation communities. Thus Alcanivoracaceae as investigated in the Seawater
1 experimental set was the dominant family in treatments with inorganic nutrients,
when biosurfactant is applied (rhamnolipids-treatments NPKMR, ULR & ULRM)
community shifts to the family of Pseudomonadaceae, which was also the dominant
family at the late stage (30 days) in the Seawater 2 experimental set (treatments
NPKM and NPKMR), whereas at early stage of the same experimental set
Alcanivoracaceae was the dominant family as well. Regarding this observation,
Pseudomonas sp. can be considered as exceptional biocatalysts utilizing either
metabolic by-products or other more recalcitrant hydrocarbons and thus can accelerate
bioremediation when other species stop.
Thus mixed consortia are advantageous over single species consortia on hydrocarbons
degradation and CLSM investigation has revealed that bacteria of mixed consortia are
organized into clusters forming strings, star and grape like shapes of bacteria and fine
oil droplets bridging each other with EPS. However it should be noted that contrary to
what so far was proposed as potential mechanism for the interaction between oil
droplets and bacteria biofilm was not the preferred interaction between the tested
consortia and the oil droplets.
This new organization and structure between oil and microbial consortia has brought
up a new perspective-mechanism in which mixed consortia utilize oil hydrocarbons
and could provide a new dimension for the study of coaggregation and biofilm
microbial communities in the marine ecosystem. Moreover understanding the
interactions between oil-degrading microorganisms is essential, not only when
predicting the fate of hydrocarbons in the environment but also for the development
of new improved surfactants formulations or biosurfactans that can be used under
different environmental conditions.
Nonetheless highly sensitive coastline environment and oil toxicity that fluctuates
depending on the amount released to the environment constitute the impact of an oil
spill exceptionally evident. Therefore immediate (bio)remediation is vital in order to
decrease oil concentration below critical level and by that diminish marine ecosystem
disturbance.
This work has demonstrated that in the absence of essential nutrients, inoculation only
with autochthonous hydrocarbon degraders is not an effective treatment, however
when the needed nutrients or other biostimulants are supplemented the advantages of
such combination are obvious and result in accelerated hydrocarbon consumption by
the added autochthonous consortium. Thus we strongly believe that the combination
of autochthonous bioaugmentation and biostimulation is a promising strategy to speed
up bioremediation in cases where there is lack of both nutrients and indigenous
degraders. This technique has a number of advantages like shorter treatment time,
greater potential efficiency, lower impact on the environment, and relative ease in
obtaining public support. Thus future research that would define the carrying
capacities of various environments and the mechanisms that control them could be
fruitful in this regard.

x

xi
Εκτενής Περίληψη
Παρα τους αυστηρότερους περιβαλλοντικούς κανονισμούς που έχουν θεσπιστεί και
έχουν υιοθετηθει από τις περισσότερες χώρες ατυχήματα όπως του Exxon Valdez
στην Αλάσκα, ένα από τα πρωτα που εχουν καταγραφει, μεχρι το πιο προσφατο του
Deep Horizon στον κόλπο του Μεξικό, καταδεικνύουν για ακόμη μια φορά την
επικινδυνότητα των θαλάσσιων πετρελαιοκηλίδων προς το θαλάσσιο οικοσύστημα.
Οι Μεσογειακές ακτές είναι ιδαιτέρως εκτεθειμένες σε κάθε πιθανή ρύπανση από
πετρελαιοειδή λογω της εκβιομηχάνισης και της αστικοποίησης των περιοχών και της
μεταφοράς του πετρελαίου και των ραφιναρισμένων προϊόντων του από τα
διυλιστήρια. Υπολογίζεται ότι το ένα τρίτο της παγκόσμιας παραγωγής πετρελαίου
που φορτώνεται ετησίως σε δεξαμενόπλοια, μεταφέρεται μέσω της Μεσογείου και
από αυτή κατ' εκτίμηση 330.000 τόνοι αποβάλλονται σκόπιμα σε αυτήν την κλειστή
θάλασσα, ενώ τα ατυχήματα αποτελούν μια πρόσθετη πηγή ρύπανσης 1.000.000
τόνων ετησίως. Οι επιπτώσεις από ένα τετοιο θαλάσσιο ατύχημα ιδιαιτέρως σε αυτή
την κλειστή θάλασσα είναι αρκετα καταστροφικές για το θαλάσσιο οικοσύστημα
οδηγώντας στη θνησιμότητα χιλιάδων θαλασσοπουλιών και θαλάσσιων θηλαστικών,
σε σημαντική μείωση του πληθυσμού πολλών οργανισμών, υποβάσμιση του βενθικού
συστηματος με πολλές μακροπρόθεσμες κοινωνικοοικονομικές επιπτώσεις π.χ. στην
αλιεία και στον τουρισμό. Δεδομένης λοιπόν της ευαισθησίας και σπουδαιότητας της
Μεσογείου και δη των ελληνικών ακτών και θαλασσών που αποτελούν δημοφιλή
τουριστικό προορισμό αλλά και αλιευτικό καταφύγιο πολλών ειδών κρίνεται
απαραίτητη η άμεση αντιμετώπιση αλλά και αποκατάσταση του θαλάσσιου
περιβάλλοντος από ρύπανση με πετρελαιοειδή.
Οι συμβατικές μέθοδοι, όπως η φυσική απομάκρυνση (π.χ., πλωτά φράγματα -
μηχανική συλλογή) που ανήκουν στους άμεσους τρόπους αντιμετώπισης μιας
πετρελαιοκηλίδας, σπάνια επιτυγχάνουν τον πλήρη καθαρισμό των
πετρελαιοκηλίδων, ενώ τα χημικά διασκορπιστικά εφ’όσον επιτρέπεται και δύναται
να χρησιμοποιηθούν κάτω από προυποθέσεις είναι τοξικά για τη θαλάσσια
βιοποικοιλότητα.
Επομένως και εφ’όσον η επικινδυνότητα για θαλάσσιες πετρελαιοκηλίδες
εξακολουθεί να υπάρχει, είναι επιτακτική ανάγκη να βρεθούν και να εξεταστούν νέοι
αποτελεσματικότεροι, πιο φιλικοί περιβαλλοντικά και πιο οικονομικοί τρόποι –
μέθοδοι αποκατάστασης και αντιμετώπισης ενός θαλάσσιου περιβάλλοντος
ρυπασμένου με πετρελαιοειδή. Η βιοεξυγίανση μεσω της βιοενίσχυσης (προσθηκη
βακτηρίων που αποδομουν το πετρέλαιο) και της βιοδιέγερσης (προσθήκη θρεπτικών
N&P ή άλλων περιοριστικών παραγόντων) αποτελεί μια πολλα υποσχόμενη
στρατηγική στην αντιμετώπιση πετρελαιοκηλιδων μετα την χρήση συμβατικών
μεθόδων άμεσης αντιμετώπισης, ενώ συμφωνα με προσφατες τεχνολογικές εξελίξεις
μπορει και να χρησιμοποιηθεί ως αμέσως τρόπος αποκατάστασης. Εντούτοις η
βιοενίσχυση ως μέθοδος βιοεξυγιανσης είναι αρκετά αμφιλεγόμενη ως προς την
αποτελεσματικότητα της δεδομένου ότι η προσθήκη μόνο θρεπτικών (βιοδιέγερση)
είχε μεγαλύτερη επίδραση στην βιοαποδόμηση του πετρελαίου από ότι η προσθήκη
μικροβιακών προιόντων που ουσιαστικά εξαρτώνται άμεσα από τις περιβαλλοντικές
συνθήκες. Ολοένα και περισσότερες έρευνες καταδεικνύουν ότι ο καλυτερος τρόπος
να ξεπεραστούν οι παραπάνω περιορισμοί είναι η αποκλειστική χρήση
μικροοργανισμών αυτοχθόνων με την περιοχη που θα αποκατασταθεί (έδαφος,
xii
αμμουδιά, νερό), μια προσέγγιση που έχει προταθεί ως βιοενισχυση με αυτόχθονες
μικροοργανισμούς-αυτόχθονη βιοενίσχυση (autochthonous bioaugmentation-ABA).
Οι πετρελαιοκηλίδες ανάλογα με τις ιδιάζουσες συνθήκες του προς αποκατάσταση
περιβάλλοντος διακρίνονται σε θαλάσσιες (ανοιχτής θαλάσσης) και παράκτιες (ή
αλλιώς χερσαίες), ετσι λοιπον και η αποκατάσταση του ρυπασμένου περιβάλλοντος
προσεγγίζεται διαφορετικά. Ενώ λοιπον η βιοξυγίανση των πετρελαιοκηλίδων στο
θαλλασινό νερό (υγρή μήτρα) αντιμετωπίζεται με άμεσο τρόπο, στο παράκτιο
περιβάλλον (στερεη μήτρα) προσεγγίζεται μέσω της τεχνικής αποκατάστασης
ρυπασμένων εδαφών γνωστή ως «τεχνική επεξεργασίας στερεάς φάσης»-
landfarming, η οποία είναι παράλληλα απλή και χαμηλού κόστους συγκρινόμενη με
άλλες τεχνικές αποκατάστασης ρυπασμένων εδαφών. Η επιτυχία της βιοεξυγίανσης
των πετρελαιοκηλίδων εξαρτάται από τη δυνατότητά να καθιερωθούν και να
διατηρηθούν οι συνθήκες (φυσικές, χημικές και βιολογικές) που ευνοούν τους
ρυθμούς ενισχυμένης βιοδιάσπασης του πετρελαίου στο ρυπασμένο περιβάλλον.
Αξιζει να σημειωθεί ότι η περιοχή επιφάνειας του πετρελαίου είναι σημαντική επειδή
η αύξηση των βιοαποδομητών πετρελαίου εμφανίζεται σχεδόν αποκλειστικά στη
διεπιφάνεια πετρελαίου-ύδατος οπου λαμβάνει χώρα η βιοαποδόμηση, ετσι η
διασπορά του πετρελαίου στην υδάτινη στήλη αυξάνει την περιοχή επιφάνειας του
πετρελαίου και έπομένως τη διαθεσιμότητά του για μικροβιακή επίθεση.
Οι πιο κοινοι τύποι θρεπτικών που έχουν χρησιμοποιηθει στην βιοεξυγίανση
περιοχών ρυπασμένων με πετρελαιοειδή αποτελουν τα υδατοδιαλυτά ανόργανα
θρεπτικα (water-soluble nutrients), τα στερεά βραδείας απελευθέρωσης (slow-release)
θρεπτικα και τα ολεοφιλικά/λιπόφιλα θρεπτικα (oleophilic/lipophilic nutrients). Κάθε
είδος θρεπτικής ουσίας έχει τα πλεονεκτήματα και τους περιορισμούς του. Τα ποικίλα
αποτελέσματα από διάφορες εργαστηριακές μελέτες υποδηλώνουν ότι η
αποτελεσματικοτητα τους επηρεάζεται από το ρυθμό απελευθέρωσης τους στο
περιβάλλον και από τις επικείμενες περιβαλλοντικες συνθήκες (κύματα, ρεύματα,
παλίρροιες κ.α.). Εν περιληψει, τα λιπάσματα βραδείας απελευθέρωσης μπορούν να
αποτελέσουν ιδανικές πηγές θρεπτικών εάν οι ρυθμοί απελευθέρωσης των θρεπτικών
μπορούν να ελεγχθούν καλά. Τα υδατοδιαλυτά λιπάσματα (water -soluble fertilizers)
είναι οικονομικότερα και αποδοτικότερα σε λεπτόκοκκες χαμηλής ενέργειας ακτές
όπου η μεταφορά ύδατος είναι περιορισμένη. Τα ολεοφιλικά λιπάσματα είναι
καταλληλότερα για χρήση σε χονδρόκοκκες υψηλής ενέργειας παραλίες. Πέραν της
προσθήκης θρεπτικών σκευασμάτων για την βιοαποδόμηση των πετρελαϊκών
υδρογονανθράκων η συνδυασμένη εφαρμογή θρεπτικών με επιφανειοδραστικές
ενώσεις βοηθά στην διασκόρπιση της πετρελαιοκηλίδας αυξάνοντας έτσι τη
διεπιφάνεια ύδατος-πετρελαίου και άρα την περιοχή δράσης των μικροοργανισμών.
Οι βιολογικές αυτές επιφανειοδραστικές ουσίες (biosurfactants) προτιμώνται έναντι
των χημικών διότι είναι πολύ λιγότερο τοξικές και πολύ ευκολότερα αποδομήσιμες.
Η λογική στην στρατηγική αυτή είναι ότι η βιοδιάσπαση του πετρελαίου εμφανίζεται
κυρίως στη διεπιφάνεια πετρελαίου-ύδατος, δεδομένου ότι οι βιογενείς
επιφανειοδραστικές ενώσεις (biosurfactants) αυξάνουν την διεπιφάνεια αυτή και ότι
τα ολεοφιλικά λιπάσματα είναι σε θέση να εμμείνουν στο πετρέλαιο και να παρέχουν
τις θρεπτικές ουσίες στη διεπιφάνεια πετρελαίου-ύδατος, μπορεί να υφίστανται
ενισχυμένη βιοδιάσπαση χωρίς την ανάγκη να αυξηθούν οι συγκεντρώσεις των
θρεπτικών στο νερό. Εντούτοις, για την επιτυχή εφαρμογή των προϊόντων
βιοεξυγίανσης απαιτούνται πάντα κατάλληλες δοκιμές για την αξιολόγηση τους
βασισμένες στις συγκεκριμένες συνθήκες κάθε ρυπασμένης περιοχής.
xiii
Σκοπός της παρούσας διατριβής ήταν να μελετηθούν πιθανές μέθοδοι που θα
ενίσχυαν τον ρυθμό βιοαποδόμησης του πετρελαίου στο ρυπασμένο θαλάσσιο
περιβάλλον (ανοιχτής θαλάσσης και παράκτιο) μειώνοντας έτσι τον χρόνο που
απαιτείται για να αποκατασταθεί.
Ως εκ τουτου εξετάστηκε η ικανότητα δυο κονσόρτσια ειτε με εγκλιματισμένους (σε
συνθήκες ρυπασμένης θαλάσσης με πετρέλαιο) αυτόχθονες θαλάσσιους
μικροοργανισμούς (παραλία αγ. Ονουφρίου) ειτε με απομονωμένους
μικροοργανισμούς που αποδομούν πετρελαϊκούς υδρογονάνθρακες (αυτόχθονη
βιοενίσχυση - ABA) ως επιτυχής στρατηγική στην εξυγίανση ρυπασμένου θαλάσσιου
περιβάλλοντος παρουσία ή μη άλλων περιοριστικών παραγόντων όπως θρεπτικά οι
βιογενείς επιφανειοδραστικές ενώσεις- biosurfactants (βιοδιέγερση).
Οι αποδομητές πετρελαίου προήλθαν από διαδοχικούς εμπλουτισμούς και
απομονώσεις θαλάσσιων δειγμάτων νερού που συλλέχθηκαν από την περιοχή του
κόλπου της Ελευσίνας κοντά στα διυλιστήρια των Ελληνικών Πετρελαίων (ΕΛΠΕ),
μια περιοχη που εκτίθεται σε χρόνια ρύπανση από πετρελαιοειδή. Επιπλέον η
ικανότητα των κονσόρτσια με τους ηδη προσαρμοσμένους αποδομητές πετρελαίου
(ABA) αντιπαρατεθηκε με την ικανότητα των αυτόχθονων μικροοργανισμών
(βιοδιέγερση) να αποδομήσουν τους πετρελαικούς υδρογονάνθρακες. Συγκεκριμένα
μελετήθηκε η επίδραση λιπόφιλων οργανικών θρεπτικών (ουρικό οξύ- uric acid,
λεκιθίνη-lecithin) και ανόργανων θρεπτικών (KNO3 και K2HPO4,-NPK treatment)
παρουσία ή μη βιογενών επιφανειοδραστικών ενώσεων- biosurfactants στην
βιοαποδόμηση πετρελαικών υδρογονανθράκων τοσο σε περιβάλλον ανοιχτής
θαλάσσης όσο και σε παράκτιο.
Ετσι προέκυψαν 4 σειρές πειραμάτων και περιλαμβάνουν:
1. Αυτόχθονη βιοενίσχυση και/ή βιοδιέγερση σε θαλάσσιο μικρόκοσμο (π.χ.
Seawater 1)
2. Αυτόχθονη βιοενίσχυση & βιοδιέγερση με κονσόρτσια απομονωμένων
μικροοργανισμών που αποδομούν τους πετρελαικούς υδρογονάνθρακες σε
θαλάσσιο μικρόκοσμο (π.χ. Seawater 2)
3. βιοδιέγερση σε ρυπασμένη με πετρέλαιο άμμο μεσω της τεχνικής landfarming
(π.χ. Sand 1)
4. Αυτόχθονη βιοενίσχυση & βιοδιέγερση σε ρυπασμένη με πετρέλαιο άμμο μεσω
της τεχνικής landfarming (π.χ. Sand 2)
Η μέθοδος που χρησιμοποιήθηκε για την εξέταση των παραγόντων βιοεξυγίανσης
βασίζεται στο τροποποιημένο πρωτόκολλο δοκιμής της αποτελεσματικότητας των
παραγόντων βιοεξυγίανσης της EPA (40 CFR Ch. I, Pt 300, App. C, 2003). Το
πρωτόκολλο δοκιμής της αποτελεσματικότητας των παραγόντων βιοεξυγίανσης
σχεδιάστηκε για να καθορίσει την ικανότητα ενός προϊόντος να βιοδιασπάσει το
πετρέλαιο ποσοτικοποιώντας τις αλλαγές στη σύνθεση του πετρελαίου ως
αποτέλεσμα της βιοδιάσπασης. Το πρωτόκολλο εξετάζει τη μικροβιακή
δραστηριότητα με την Ανάλυση του πιο Πιθανού Αριθμού (Most Propable Number)
και ποσοτικοποιεί την απομάκρυνση των κορεσμένων υδρογονανθράκων και των
πολυαρωματικών αρωματικών υδρογονανθράκων (PAHs) με τη χρήση GC-MS.
Επιπρόσθετα ο βαθμός απομάκρυνσης (ρυθμός αποδόμησης) επιλεγμένων
συστατικών (C15, C20, C25, C30, Pristane, Phytane, Fluorene, Dibenzothiothene,
Phenanthrene και Chrysene) και από τα δυο κλάσματα των κορεσμένων (ν-αλκάνια)
και των αρωματικών (PAHs) εξετάστηκε μεσω βιοχημικής κινητικής αναλυσης
λαμβάνοντας υποψη τις αρχές που διέπουν βιοαντιδραστήρα διαλείποντος έργου
(Batch reactor). Ενώ η ταυτοποίηση των μικροοργανισμών που αποδομούν τους
πετρελαικούς υδρογονάνθρακες, καθώς και η αποκριση και αλλαγη της δομής των

xiv
κονσόρτσια που χρησιμοποιήθηκαν μεταξυ των διαφορετικών πειραμάτων αλλα και
επεξεργασιών επετευχθηκε με μοριακή άναλυση (PCR, RT-PCR, pyrotag
Sequencing) δειγμάτων γενετικου υλικού που ελήφθησαν από κάθε επεξεργασία.
Προηγούμενες μελέτες που αφορούσαν τη βιοδιάσπαση υδρογονανθράκων οδήγησαν
στην παρατήρηση ότι τα βακτήρια που αποδομούν υδρογονάνθρακες παρουσιάζουν
υψηλή έλξη προς τα σταγονίδια πετρελαίου και δεδομένου ότι η βιοδιάσπαση του
πετρελαίου εμφανίζεται κυρίως στη διεπιφάνεια πετρελαίου-ύδατος, καθιστούν τη
βιοαποδόμηση πετρελαίου μια πολυπλοκη διεργασία η οποία περιλαμβάνει
αλληλεπιδράσεις μεταξυ των μικροοργανισμών και του πετρελαίου, οι οποιες
επηρεάζονται άμεσα απο τις επικρατούσες περιβαλλοντικές συνθήκες. Ετσι ενα
μεγάλο ερώτημα που προκυπτει στην βιοδιάσπαση των υδρογονανθράκων είναι πώς
οι μικροοργανισμοί ουσιαστικά έρχονται σε επαφή με το υπόστρωμα. Η κατανάλωση
των υδατοδιαλυτών υποστρωμάτων από τους μικροοργανισμούς φαίνεται να μην
παρουσιάζει πρόβλημα, αλλά πώς οι μικροοργανισμοί αλληλεπιδρούν με υλικά τα
οποία είναι αδιάλυτα όπως τα μεγάλου μοριακού βάρους αλκάνια παραμενει
προκληση. Ετσι λοιπον δημιουργηθηκε ακομη μια σειρα πειραματων που στοχο ειχε
τη διερεύνηση και χαρακτηρισμό των αλληλεπιδράσεων των κονσόρτσια
απομονωμένων μικροοργανισμών που αποδομούν πετρελαϊκούς υδρογονάνθρακες με
σταγονίδια πετρελαιου άλλα και εικοσανίου (στερεό συστατικό του πετρελαίου που
χρησιμοποιήθηκε ως πρότυπο), καθως επισης και τη διερευνηση της πιθανότητας
ανάπτυξης –παρακολούθησης βιοστιβάδας γύρω από σταγονίδια πετρελαιοειδών και
χαρακτηρισμό αυτής με τη χρήση μικροσκοπίας ομοεστιακής δέσμης λέιζερ (confocal
microscopy- CLSM). Επιπλεον εξετάστηκε η επίδραση των εμπορικών
διασκορσπιστικών ενωσεων (Corexit, S200 και Marichem) αλλά και της βιολογικης
προέλευσης επιφανειοδραστικής ένωσης-biosurfactant (ραμνολιπίδια-rhamnolipids)
στο σχηματισμό βιοστιβάδας αλλα και στη γενικότερη συσχέτιση των κονσόρτσια με
τα σταγονίδια πετρελαίου και εικοσανίου.
Εικόνα 1: % απομάκρυνση των αλκανίων μετα από 0, 5, 15, 30, 60 και 90 ημέρες
παρακολούθησης μεταξύ των Control, NPK, NPKM, NPKMR, ULR και ULRM διαφορετικών
επεξεργασιών της πειραματικής σειράς Seawater 1.
Η επεξεργασία των αποτελεσματων των χημικων και μικροβιολογικών αναλύσεων
αλλα και η κινητική επεξεργασία των δεδομένων τους (ειδικός ρυθμός αποδόμησης-
qs) απεκάλυψαν ότι στην πειραματική σειρά Seawater 1, στην οποία
χρησιμοποιήθηκαν αυτόχθονες μικροβιακοί πληθυσμοί εγκλιματισμένοι ή μη
απέδωσε πολύ καλύτερα σε σχέση με την πειραματικη σειρα Sand 1, στην οποία η
ControlNPK
NPKMNPKMR
ULR ULRM
0%
20%
40%
60%
80%
100%
90
30
5
% D
ep
leti
on
n-a
lkan
es
(C1
4-C
35
)
Days

xv
αποδόμηση προερχόταν αποκλειστικά από τους αυτόχθονες (μη εγκλιματισμένους)
μικροοργανισμούς και παρα το γεγονός ότι προστέθηκαν συνδυαστικά ραμνολιπίδια
(rhamnolipids) και λιπόφιλα θρεπτικά, η αποκριση τους ηταν χαμηλη σχετικα με
αυτην της πειραματικής σειράς Seawater 1.
Η βιοδιαθεσιμότητα των πετρελαικών υδρογονανθράκων αποτελει κρίσιμη
παράμετρο που επηρεάζει την αποδοτικότητα της βιοεξυγίανσης σε ρυπασμένα
περιβάλλοντα και επομένως εξάγεται το συμπέρασμα ότι στην πειραματική σειρά
Seawater 1 (Εικόνα 1), οι βιογενεις επιφανειοδραστικές ενώσεις, συγκεκριμένα τα
ραμνολιπίδια (rhamnolipids), επιτάχυναν τη βιοαποδόμηση του πετρελαίου κανοντας
το πιο διαθέσιμο προς τους μικροοργανισμους, όπως φάνηκε στις 2 επεξεργασίες
αυτόχθονης βιοενίσχυσης ABA ULRM & NPKMR (απομάκρυνση 88% και 99%
αντιστόιχως από τι πρώτες κιόλας 2 εβδομάδες εφαρμογής τους) και στην
επεξεργασία με βιοδιέγερση ULR (απομάκρυνση 97% σε 15 μέρες εφαρμογής της)
της συγκεκριμένης σειράς πειραμάτων. Ο συδυασμός θρεπτικών με τις βιογενεις
επιφανειοδραστικές ενώσεις σε αυτές τις 3 επεξεργασίες (ULR, ULRM & NPKMR)
εδειξε μεγάλη αποδόμηση τοσο σε κανονικά αλκάνια όσο και σε πολυκυκλικούς
αρωματικούς υδρογονάνθρακες, ενώ παράλληλα ειχε την μεγαλύτερη ανάπτυξη
αποδομητών πετρελαίου σε διάρκεια μόλις 15 ημερών από την αρχή του πειράματος.
Απεναντίας η πειραματική σειρά Sand 2 ήταν πολύ πιο αποτελεσματική σε σχέση με
την πειραματικη σειρα Seawater 2 (Εικόνα 2) παρολο που και στις δυο σειρές
χρησιμοποιήθηκε το ίδιο κονσόρτσιο μικροοργανισμών που αποδομούν πετρελαικους υδρογονάνθρακες (Eb8). Μολοταύτα αξίζει να σημειωθεί ότι παρά το γεγονός ότι
προστέθηκαν ραμνολιπίδια δεν συνδυάστηκαν με λιπόφιλα θρεπτικά στην
πειραματικη σειρα Seawater 2, γεγονός το οποιο πιθανότατα συνέβαλε στην όχι και
τοσο επιτυχημένη απόδοση της NPKMR επεξεργασίας της πειραματικής σειράς
Seawater 2 σε σχεση με την ULRM επεξεργασία της πειραματικής σειράς Sand 2.
Εικόνα 2: % απομάκρυνση των αλκανίων και μικροβιακή ανάπτυξη μεταξύ των
διαφορετικών επεξεργασιών (NPKM και NPKMR) στην πειραματική σειρά Seawater 2.
1.E+02
1.E+03
1.E+04
1.E+05
1.E+06
0
10
20
30
40
50
60
70
80
90
100
5 15 30
MP
N(c
ells
/ml)
% D
ep
leti
on
n a
lkan
es(
C1
4-C
35
)
Time (days)
NPKM NPKMR NPKM NPKMR

xvi
Εικόνα 3: % απομάκρυνση των αλκανίων και μικροβιακή ανάπτυξη μεταξύ των διαφορετικών
επεξεργασιών (NPKM και ULRM) στην πειραματική σειρά Landfarming 2.
Η συνδυασμένη εφαρμογή ραμνολιπιδίων και λιπόφιλων θρεπτικών είναι αρκετα
επωφελής σε υγρή μήτρα (θαλασσινό νερό), ωστόσο όταν γινει εφαρμογή τους σε
στερεή μήτρα (άμμος) η αποδοτικότητα τους είναι μέτρια και πολλες φορές
αμφισβητείται. Εν αντιθέσει τα ανόργανα θρεπτικα τα οποία εκπλένονται γρήγορα
στο θαλασσινό νερο αποδίδουν πολύ καλυτερα όταν εφαρμοστούν σε αμμώδη ακτή,
εξίσου αποδοτικά με το ULR (ραμνολιπίδια - λιπόφιλα θρεπτικά) συνδυασμό. Η
αντιφατική συμπεριφορά των επεξεργασιών ULR (πειραματική σειρά Sand 1) και
ULRM (πειραματική σειρά Sand 2) ως προς τα δύο κλάσματα (αλκανίων-
αρωματικών) σε σύγκριση με τις επεξεργασίες NPK (πειραματική σειρά Sand 1) και
NPKM (πειραματική σειρά Sand 2) αντιστοίχως συντείνει προς αυτό το συμπέρασμα.
Παραυτα η συνολικη εικόνα της επεξεργασίας ULR δείχνει ότι η παρουσία βιογενών
επιφανειοδραστικών ενώσεων συνεισέφερε στην χρησιμοποίηση των λιπόφιλων
θρεπτικών αυξάνοντας τη βιοδιαθεσιμότητα τους προς τους μικροργανισμούς που
βρίσκονται στην άμμο.
Τα αποτελέμστα των χημικών αναλύσεων και από τις 4 σειρές πειραμάτων κατέδειξε
ότι οι μικρής αλυσίδας υδρογονάνθρακες βιοαποδομούνται πιο ευκολα από ότι η
μεγάλης μοριακή αλυσίδας υδρογονάνθρακες. Ετσι το κλάσμα των κορεσμένων
συατατικών αποδομείται περισσότερο σε σχέση με το κλάσμα των αρωματικών και
ακολουθείται η σειρά: C15> C20> (Pristane, Phytane)>C25 > C30> C35 >(PAHs).
Τα Pristane και Phytane δεν μπορούν να χρησιμοποιηθουν ως βιοδείκτες καθως και
αυτά βιοαποδομούνται.
Η μικροβιακή ανάπτυξη μπορεί να συσχετιστεί με την απομάκρυνση συστατικών του
πετρελαίου από το διάλυμα.
1.E+00
1.E+01
1.E+02
1.E+03
1.E+04
1.E+05
1.E+06
1.E+07
0
10
20
30
40
50
60
70
80
90
100
0 7 15 21 30 38 45
cells
/g d
ry s
and
% D
ep
leti
on
n a
lkan
es(
C1
4-C
35
)
Time (days)
% Depletion NPKM % Depletion ULRM
MPN/g NPKM MPN/g ULRM

xvii
Εικόνα 4: Σχετική αφθονία των διαφορετικών οικογενειών εκφρασμένων ως operational
taxonomic units (OTUs) ανάμεσα στις διαφορετικές επεξεργασίες της πειραματικής σειράς
Seawater 1 μετα από 30 μέρες έναρξης του πειράματος. Οπου S1 και DS1 είναι τα αρχικά
δειγματα των αυτόχθονων και εγκλιματισμένων μικροοργανισμών των δειγμάτων ελέγχου
αντίστοιχα.
Μεχρι στιγμής τα στελέχη του alcanivorax θεωρούνται από τα επικρατέστερα OHCB
(obligate hydrocarbonoclastic bacteria) βακτήρια και απαντώνται σε όλα τα
ρυπασμένα με πετρελαιοειδή περιβάλλοντα, τα οπόια παίζουν σημαντικό ρόλο στην
αποδόμηση των πετρελαικών υδρογονανθράκων. Ωστόσο αξίζει να σημειωθεί ότι
παρόλο που η οικογένεια των Alcanivoracaceae κυριαρχεί στις επεξεργασίες με
ανόργανα θρεπτικά της πειραματικης σειρας Seawater 1 (Εικόνα 4), όταν
εφαρμοστούν βιογενεις επιφανειοδραστικές ενώσεις (ραμνολιπίδια -επεξεργασίες
NPKMR, ULR & ULRM) η σύνθεση της βακτηριακης κοινότητας αλλάζει προς την
οικογένεια των Pseudomonadaceae (15.6%, 79.3% & 15.3% για τις NPKMR, ULR &
ULRM επεξεργασίες αντιστοιχως). Συγκεκριμένα στη ULR επεξεργασία που έχουν
προστεθεί λιπόφιλα θρεπτικά, ο αυτόχθων μικροβιακός πληθυσμός απαρτίζεται
κυρίως από τις οικογένειες Pseudomonadaceae και Vibrionaceae family (12.6%).
Μολοταύτα ο συνδυασμός που απαρτίζεται από τις οικογένειες των Alcanivoracaceae
και Rhodospirillaceae (NPK, NPKM) δεν θεωρείται ο πιο επιτυχής οσον αφορα το
ρυθμό βιοαποδόμησης στη συγκεκριμένη χρονική περίοδο (30 ημέρες).
Η οικογένεια των Pseudomonadaceae είναι η επικρατέστερη στο τελευταίο στάδιο
(30 ημέρες) της πειραματικης σειρας Seawater 2, ενώ στο πρώιμο στάδιο η
οικογένεια των Alcanivoracaceae είναι και παλι η επικρατέστερη.
Είναι γνωστό ότι τα είδη του Alcanivorax ανήκουν στα OHCB βακτήρια και μπορούν
να οξειδώσουν τα C5-C16 n-αλκάνια και τα διακλαδισμένα αλκάνια. Αντιθετα τα είδη
του Pseudomonas αντέχουν και μπορουν να μεταβολίσουν συστατικά που
θεωρούνται τοξικά για άλλα βακτήρια, καθιστώντας τα έτσι σημαντικούς
βιοκαταλύτες οι οποιοι επιταχύνουν την βιοαποδόμηση εκει που τα άλλα ειδη
σταματούν. Τετοια είναι και η περίπτωση των επεξεργασιών NPKM και NKPMR,
οπου στην αρχή του πειράματος η μικροβιακή κοινότητα αποτελειται κυριως από
στελέχη που μπορουν να μεταβολίσουν υδρογονάνθρακες (αλκανια και καποιες
αρωματικές ενώσεις) ενώ στο τέλος του πειράματος οπου και οι περισσότεροι
υδρογονάνθρακες έχουν καταναλωθει τα στελέχη του Pseudomonas μεταβολίζουν
παραπροιόντα της βιοαποδόμησης ή αλλους πιο ανθεκτικούς υδρογονάνθρακες.
0%
10%
20%
30%
40%
50%
60%
70%
80%
90%
100%
OTU
s in
Sam
ple
s
Other
Vibrionaceae
Pseudomonadaceae
Moraxellaceae
Oceanospirillaceae
Halomonadaceae
Alcanivoracaceae
Shewanellaceae
Pseudoalteromonadaceae
Idiomarinaceae
Alteromonadaceae
Rhodospirillaceae
Rhodobacteraceae
Flavobacteriaceae

xviii
Η παραπανω αναλυση απεδειξε ότι οι διαφορετικές επεξεργασίες προκαλούν
διαφορετική απόκριση και σύνθεση των μικροβιακών κοινοτήτων καταδεικνύοντας
το πλεονέκτημα των μεικτών κονσόρτσια σε σχεση με κονσορσια που αποτελουνται
από στελέχη ενός είδους μόνο.
Α
Β
C
Εικόνα 5: Σχηματιζόμενες δομές μικροοργανισμών (πρασινο χρώμα) γυρω από σταγονιδια
πετρελαίου Α&Β (λιλά χρώμα) και εικόσάνιο C
Σε αυτό το συμπερασμα συντείνουν και τα αποτελέσματα των παρατηρήσεων με
μικρόσκόπιο CLSM (Εικόνα 5) οπου απεκάλυψαν ότι οι μικροοργανισμοί
οργανώνονται σε συμπλέγματα μεταξυ τους και με τα διασκορπισμένα σταγονίδια
πετρελαίου. Τα σταγονίδια πετρελαίου που είναι διασπαρμένα σε διάφορα μεγέθη
καλύπτονται πλήρως από βακτήρια και σχηματίζουν πολύπλοκες δομές τύπου
σταφυλιού και αστερία (grape style shapes- star-like patterns) πιθανότατα λόγω
μεγάλης βιοαποδόμησης του, οι οποίες ενώνονται μεταξύ τους με γέφυρες από
βακτήρια και βιοπολυμερή όπως είναι οι εξωκυτταρικοί πολυσακχαρίτες (EPS).
Η παραπάνω έρευνα κατέληξε σε πρωτοποριακά συμπεράσματα για τον τρόπο
δράσης των θαλάσσιων μικροοργανισμών σε πετρελαιοκηλίδες. Έδειξε ότι ο
μηχανισμός δράσης των μικροοργανισμών είναι πολύ διαφορετικός και
πολυπλοκότερος από αυτόν που οι μέχρι τώρα μελέτες με συγκεκριμένα στελέχη
είχαν δείξει (σχηματισμός βιοστιβαδας μεσω της οποίας αποδομούν το πετρέλαιο). Η
πιθανότερη εκδοχή με βάση τις μέχρι τώρα παρατηρήσεις, είναι ότι οι
μικροοργανισμοί μέσω της παραγωγης επιφανειοδραστικών ενώσεων διαχωρίζουν το
πετρέλαιο σε πολύ μικρότερα σταγονίδια (δημιουργώντας μία ομάδα εξαιρετικά
μικρών σταγονιδίων που βρίσκονται στην υδατική φάση σαν «τσαμπί σταφυλιού»)
ώστε να μπορούν πιο εύκολα να το αποδομήσουν και δεν προτιμούν να οργανώνονται
σε βιοστιβάδες γύρω από τα σταγονίδια. Το καινοτόμο αυτό συμπέρασμα που
καταρρίπτει τα έως τώρα δεδομένα οδηγει σε εντελώς διαφορετική θεώρηση στον
τρόπο δράσης των θαλάσσιων μικροοργανισμών οπου οδηγουν στη διαλυτοποίηση
ακομα και στερεών υποστρωματων όπως είναι το εικοσάνιο. Η εξέταση της
επίδρασης διάφορων διασκορπιστικών ενώσεων έδειξε ότι ο μηχανισμός δράσης τους
εφ’όσον δεν εχει τοξική επίδραση στους μικροοργανισμούς μπορει να παραλληριστεί
με αυτον των επιφανειοδραστικών ενώσεων που παράγουν οι ίδιοι οι μικροοργανσμοί
(π.χ. rhamnolipids) και ισως να μπορούσε να αποτελέσει μέρος ενός ευρύτερου
στρατηγικού πλαισίου στο σχεδιασμό διασκορπιστών πετρελαίου (dispersants) νέας
γενιάς.
Εν κατακλείδι εξετάζοντας τα παραπάνω αποτελέσματα και γνωρίζοντας ότι
απελευθέρωση πετρελαιοειδών στο θαλάσιο περιβάλλον αποτελεί μόνιμη απειλή για
το θαλάσιο οικοσύστημα κρίνεται απαραίτητη η εφαρμογή της βιοεξυγίανσης σαν
μέθοδος αποκατάστασης του θαλάσσιου περιβάλλοντος.
xix
Συγκεκριμένα η παραπάνω διερεύνηση απέδειξε ότι απουσία στοιχειωδών θρεπτικών,
ο εμβολιασμός μονάχα με πληθυσμό αυτόχθονων μικροοργανισμών ικανών να
αποδομήσουν τους πετρελαικούς υδρογονάνθρακες δεν θεωρείται επαρκής. Ωστοσο ο
συνδυασμός απαραιτητων θρεπτικών ή άλλων περιοριστικών παραγόντων (π.χ.
ραμνολιπίδια) μαζι με τον αυτόχθονο πληθυσμό των αποδομητών υδρογοναθράκων
πλεονεκτεί με αποτέλεσμα την αυξημένη κατανάλωση των υδρογονανθράκων από
τον πληθυσμό αυτόχθονων μικροοργανισμών που προστέθηκε. Ετσι λοιπον
πιστεύουμε ότι ο συνδυασμός αυτόχθονης βιοενίσχυσης και βιοδιέγερσης μπορει να
αποτελέσει μελλοντικη στρατηγική που θα μπορούσε να επιταχύνει την
βιοαποδόμηση σε περιπτώσεις οπου υπάρχει έλλειψη θρεπτικών και
μικροοργανισμών. Μια τέτοια προσέγγιση γίνεται πιο επιτακτική κυρίως όταν μια
πετρελαιοκηλιδα πλησιάζει απειλητικά την ακτή και απαιτείται γρήγορη και άμεση
αποδόμηση των πετρελαικών υδρογονανθράκων.
Μελλοντικά η περαιτερω εκτενής και διεξοδική μελέτη των βασικών μηχανισμών
αλληλεπίδρασης μεταξύ μικροοργανισμών και ρυπαντή (πετρελαιοειδή) μπορει να
βοηθήσει στην κατανόηση όχι μονο της τύχης του πετρελαίου στο περιβάλλον αλλα
και να συντελεσει στην δημιουργία βελτιωμένων παραγόντων βιοεξυγίανσης
(θρεπτικών-διασκορπιστικών ουσιών κ.α.), ενώ κυρίως μπορει να βοηθήσει στην
κατάστρωση στρατηγικού σχεδίου δράσης προσαρμοσμένου στις συνθήκες του προς
αποκατάσταση ρυπασμένου περιβαλλοντος.

xx
xxi
Table of Contents Abstract .................................................................................................................................... vii
Εκτενής Περίληψη ..................................................................................................................... xi
List of Figures .......................................................................................................................... xxv
List of Tables .......................................................................................................................... xxix
1. INTRODUCTION ................................................................................................................. 3
1.1. Addressing the problem ............................................................................................ 3
1.2. Oil Chemical Composition and Physical Properties ................................................... 4
1.4.1. Chemical Composition ....................................................................................... 4
1.4.2. Physical Properties of Oil ................................................................................... 6
1.3. Fate (Weathering) of Oil Spills in the Environment ................................................... 6
1.4. Mechanism of Oil Biodegradation: A Microbiological Perspective ........................... 8
1.4.1. Distribution of Hydrocarbon-Degrading Microorganisms ................................. 8
1.4.2. Bacterial Affinity-Interaction to Oil ................................................................. 10
1.5. Response to Oil Spills in Marine Shorelines ............................................................ 12
1.6. Alternative Technologies to Combat Oil Spills ........................................................ 13
1.6.1. Landfarming ..................................................................................................... 14
1.7. Types of Bioremediation Amendments and Considerations in Their Application .. 16
1.7.1. Biostimulation ................................................................................................. 16
1.7.2. Bioaugmentation ............................................................................................. 22
1.7.3. Bioaugmentation or Biostimulation? .............................................................. 27
1.8. Contribution of this PhD .......................................................................................... 30
2. Materials and Methods ................................................................................................... 35
2.1. Determing Soil Characteristics ................................................................................ 35
2.1.1. Water Holding Capacity ................................................................................... 35
2.1.2. Soil Gravimetric Water Content and Soil Dry Mass ......................................... 35
2.2. Crude oil weathering ............................................................................................... 36
2.3. Sand preparation and spiking with crude oil ........................................................... 36
2.4. Types of Amendments ............................................................................................. 36
2.4.1. Nutrients .......................................................................................................... 36
2.4.2. Rhamnolipids as Biosurfactant ........................................................................ 37
2.4.3. Dispersants ...................................................................................................... 37
2.4.4. Isolated Consortia ............................................................................................ 37
2.5. Culture Media .......................................................................................................... 37

xxii
2.6. Microbiological Analyses ......................................................................................... 38
2.6.1. Plate Counts ..................................................................................................... 38
2.6.2. MPN Procedure ............................................................................................... 38
2.7. Chemical Analysis .................................................................................................... 38
2.7.1. Reagents, materials and standards ................................................................. 38
2.7.2. Procedure and sample preparation of spilled oil ............................................ 39
2.8. Biodegradation kinetics ........................................................................................... 41
2.9. Molecular Analyses.................................................................................................. 42
2.9.1. Autochthonous Bioaugmentation and/or Biostimulation of Seawater
Microcosm (Seawater 1) ................................................................................................. 43
2.9.2. Autochthonous Bioaugmentation & Biostimulation with Isolated Hydrocarbon
Degraders Consortium of Seawater Microcosm (Seawater 2) ........................................ 45
2.10. CLSM conditions .................................................................................................. 46
3. Experimental Design ........................................................................................................ 49
3.1. Autochthonous Bioaugmentation and/or Biostimulation of Seawater Microcosm
(Seawater 1) ........................................................................................................................ 49
3.2. Autochthonous Bioaugmentation & Biostimulation with Isolated Hydrocarbon
Degraders Consortium of Seawater Microcosm (Seawater 2) ............................................ 50
3.3. Landfarming of Oil Polluted Beach Sand through Biostimulation (Sand 1) ............. 51
3.4. Landfarming of Oil Polluted Beach Sand through Autochthonous Bioaugmentation
& Biostimulation (Sand 2) .................................................................................................... 52
3.5. Biofilm Investigation on Oil Droplets & Eicosane .................................................... 52
4. Experimental Results and Discussion .............................................................................. 57
4.1. Autochthonous Bioaugmentation and/or Biostimulation of Seawater Microcosm
(Seawater 1) ........................................................................................................................ 57
4.2. Autochthonous Bioaugmentation & Biostimulation with Isolated Hydrocarbon
Degraders Consortium of Seawater Microcosm (Seawater 2) ............................................ 73
4.3. Landfarming of Oil Polluted Beach Sand through Biostimulation (Sand 1) ............. 81
4.4. Landfarming of Oil Polluted Beach Sand through Autochthonous Bioaugmentation
& Biostimulation (Sand 2) .................................................................................................... 91
4.5. Cluster analysis ...................................................................................................... 101
4.6. Biofilm Investigation on Oil Droplets&C20 ............................................................ 109
4.7. General Conclusions .............................................................................................. 120
References ............................................................................................................................. 125
Appendix ................................................................................................................................ 139
Box Plots ............................................................................................................................ 139
xxiii
Standard curves and Melting curves of RT-PCR analysis ................................................... 141
Rarefaction curves ............................................................................................................. 147

xxiv

xxv
List of Figures
Figure 1: Disastrous consequences following oil spills. ............................................................. 3
Figure 2: Examples of representative organic compounds found in crude oils. ....................... 5
Figure 3: Oil spill weathering processes (http://www.sintef.no). ............................................. 7
Figure 4: Most common first response options to an oil spill. ................................................ 13
Figure 5: Typical landfarming treatment unit ......................................................................... 14
Figure 6: Effect of bioaugmentation and biostimulation on biodegradation of petroleum
hydrocarbons (not to scale) for four different cases. Abbreviations of treatments:
BA=Bioaugmentation, BS=Biostimulation, BS+BA=Bioaugmentation and biostimulation ..... 29
Figure 7: L-L Extraction ............................................................................................................ 39
Figure 8: Soxhlet apparatus ..................................................................................................... 39
Figure 9: Solid Phase Extraction apparatus used for the fractionation of oil samples. .......... 40
Figure 10: Depletion Rate of C14-C35 n-alkanes after 0, 5, 15, 30, 60 and 90 days of
monitoring in Control, NPK, NPKM, NPKMR, ULR and ULRM treatments (Seawater 1). ........ 57
Figure 11: Concentration of C14-C35 n-alkanes after 0, 5, 15, 30, 60 and 90 days of
monitoring in NPKM treatment (Seawater 1). ........................................................................ 58
Figure 12: Concentration of C14-C35 n-alkanes after 0, 5, 15, 30, 60 and 90 days of
monitoring in NPKMR treatment (Seawater 1). ...................................................................... 58
Figure 13: Concentration of C14-C35 n-alkanes after 0, 5, 15, 30, 60 and 90 days of
monitoring in ULR treatment (Seawater 1). ............................................................................ 59
Figure 14: Concentration of C14-C35 n-alkanes after 0, 5, 15, 30, 60 and 90 days of
monitoring in ULRM treatment (Seawater 1). ........................................................................ 59
Figure 15: Concentration of fluorene, dibenzothiophene, phenanthrene and chrysene after
0, 5, 15, 30, 60 and 90 days of monitoring in NPKM treatment (Seawater 1). ....................... 61
Figure 16: Concentration of fluorene, dibenzothiophene, phenanthrene and chrysene after
0, 5, 15, 30, 60 and 90 days of monitoring in NPKMR treatment (Seawater 1). ..................... 61
Figure 17: Concentration of fluorene, dibenzothiophene, phenanthrene and chrysene after
0, 5, 15, 30, 60 and 90 days of monitoring in ULR treatment (Seawater 1). ........................... 62
Figure 18: Concentration of fluorene, dibenzothiophene, phenanthrene and chrysene after
0, 5, 15, 30, 60 and 90 days of monitoring in ULRM treatment (Seawater 1). ....................... 62
Figure 19: Concentration profiles of selected n-alkanes and PAHs compounds in NPKM,
NPKMR, ULR and ULRM treatments (Seawater 1). ................................................................. 64
Figure 20: Alkanes % depletion and microbial growth curve between different treatments
(NPKM and ULRM) through 90 days of monitoring (Seawater 1). .......................................... 65
Figure 21: MPN profile in NPKM, NPKMR, ULR and ULRM treatments (Seawater 1). ............ 65
Figure 22: Abundance of alkB2 (Alcanivorax), alkB (Thalassolituus) and phnA (Cycloclasticus)
genes in NPKM, NPKMR, ULR and ULRM treatments (Seawater 1). ....................................... 67
Figure 23: Relative abundance of different family groups based on operational taxonomic
units (OTUs) obtained by pyrotag sequencing of amplified 16S rDNA genes (Seawater 1). .. 68
Figure 24: Samples grouping according to Bray-Curtis similarity index (Seawater 1) ............ 69
Figure 25: Concentration of C14-C35 n-alkanes after 0, 15 and 30 days of monitoring in
Control (CM) treatment and at 0 days of NPKM and NPKMR treatments (Seawater 2). ....... 73
Figure 26: Concentration of C14-C35 n-alkanes after 0, 5, 15 and 30 days of monitoring in
NPKM treatment (Seawater 2). ............................................................................................... 74
xxvi
Figure 27: Concentration of C14-C35 n-alkanes after 0, 5, 15 and 30 days of monitoring in
NPKMR treatment (Seawater 2). ............................................................................................. 74
Figure 28: Concentration of fluorene, dibenzothiophene, phenanthrene and chrysene after
0, 5, 15 and 30 days of monitoring in NPKM treatment (Seawater 2). ................................... 75
Figure 29: Concentration of fluorene, dibenzothiophene, phenanthrene and chrysene after
0, 5, 15 and 30 days of monitoring in NPKMR treatment (Seawater 2). ................................. 75
Figure 30: Alkanes % depletion and microbial growth curve between different treatments
(NPKM and NPKMR) through 30 days of monitoring (Seawater 2). ........................................ 76
Figure 31: Concentration profiles of selected n-alkanes and PAHs compounds in NPKM and
NPKMR treatments (Seawater 2). ........................................................................................... 77
Figure 32: Phylogenetic tree of bacteria isolated during NPKM treatment (Seawater 2). ..... 78
Figure 33: Phylogenetic tree o of bacteria isolated during NPKMR treatment (Seawater 2). 80
Figure 34: Concentration of C12-C35 n-alkanes after 0, 15, 30 and 45 days of monitoring in
Control treatment (Sand 1). .................................................................................................... 81
Figure 35: Concentration of C12-C35 n-alkanes after 0, 15, 30 and 45 days of monitoring in
NPK treatment (Sand 1). .......................................................................................................... 82
Figure 36: Concentration of C12-C35 n-alkanes after 0, 15, 30 and 45 days of monitoring in ULR
treatment (Sand 1). ................................................................................................................. 82
Figure 37: Concentration of fluorene, dibenzothiophene, phenanthrene and chrysene after
0, 15, 30 and 45 days of monitoring in Control treatment (Sand 1). ...................................... 83
Figure 38: Concentration of fluorene, dibenzothiophene, phenanthrene and chrysene after
0, 15, 30 and 45 days of monitoring in NPK treatment (Sand 1). ............................................ 84
Figure 39: Concentration of fluorene, dibenzothiophene, phenanthrene and chrysene after
0, 15, 30 and 45 days of monitoring in ULR treatment (Sand 1). ............................................ 84
Figure 40: Alkanes % depletion and microbial growth curve between different treatments
(NPK and ULR) through 45 days of monitoring (Sand 1). ........................................................ 86
Figure 41: Moisture and microbial growth curve in Control treatment through 45 days of
monitoring (Sand 1). ................................................................................................................ 86
Figure 42: Moisture and microbial growth curve in NPK treatment through 45 days of
monitoring (Sand 1). ................................................................................................................ 87
Figure 43: Moisture and microbial growth curve in ULR treatment through 45 days of
monitoring (Sand 1). ................................................................................................................ 87
Figure 44: Concentration profiles of selected n-alkanes and PAHs compounds in Control, NPK
and ULR treatments (Sand 1). ................................................................................................. 88
Figure 45: Concentration of C14-C35 n-alkanes after 0, 7, 15, 30 and 45 days of monitoring in
Control treatment (Sand 2). .................................................................................................... 91
Figure 46: Concentration of C14-C35 n-alkanes after 0, 7, 15, 30 and 45 days of monitoring in
NPK treatment (Sand 2). .......................................................................................................... 92
Figure 47: Concentration of C14-C35 n-alkanes after 0, 7, 15, 30 and 45 days of monitoring in
ULR treatment (Sand 2). .......................................................................................................... 92
Figure 48: Concentration of fluorene, dibenzothiophene, phenanthrene and chrysene after
0, 7, 15, 30 and 45 days of monitoring in Control M treatment (Sand 2). .............................. 93
Figure 49: Concentration of fluorene, dibenzothiophene, phenanthrene and chrysene after
0, 7, 15, 30 and 45 days of monitoring in NPKM treatment (Sand 2). .................................... 94

xxvii
Figure 50: Concentration of fluorene, dibenzothiophene, phenanthrene and chrysene after
0, 7, 15, 30 and 45 days of monitoring in ULRM treatment (Sand 2)...................................... 94
Figure 51: Alkanes % depletion and microbial growth curve between different treatments
(NPKM and ULRM) through 45 days of monitoring (Sand 2). ................................................. 95
Figure 52: Moisture and microbial growth curve in Control M treatment through 45 days of
monitoring (Sand 2). ................................................................................................................ 96
Figure 53: Moisture and microbial growth curve in NPKM treatment through 45 days of
monitoring (Sand 2). ................................................................................................................ 96
Figure 54: Moisture and microbial growth curve in ULRM treatment through 45 days of
monitoring (Sand 2). ................................................................................................................ 97
Figure 55: Concentration profiles of selected n-alkanes and PAHs compounds in Control M,
NPKM and ULRM treatments (Sand 2). ................................................................................... 98
Figure 56: Dendogram developed from gas chromatograms of the two seawater
experimental data sets. ......................................................................................................... 102
Figure 57: Dendogram developed from gas chromatograms of the two Sand experimental
data sets. ............................................................................................................................... 103
Figure 58: Dendogram developed from gas chromatograms of Seawater 1 and Sand 1
experimental data sets. ......................................................................................................... 106
Figure 59: Dendogram developed from gas chromatograms of Seawater 2 and Sand 2
experimental data sets. ......................................................................................................... 107
Figure 60: Structures formed between oil droplets and bacteria from consortia Eb8 (A-E) & S
(F). Photos represent Maximum Intensity Projections (MIPs) of data sets consisting of several
optical sections. ..................................................................................................................... 109
Figure 61: Rhamnolipids effects on the interaction between oil droplets and bacteria from
consortia Eb8 & E4. Photos represent Maximum Intensity Projections (MIPs) of data sets
consisting of several optical sections .................................................................................... 110
Figure 62: Corexit effects on the interaction between oil droplets and bacteria from
consortia Eb8 (D-F) & E4 (A-C). Photos represent Maximum Intensity Projections (MIPs) of
data sets consisting of several optical sections. .................................................................... 111
Figure 63: S200 effects on the interaction between oil droplets and bacteria from consortia
Eb8 (D-F) & E4 (A-C). Photos represent Maximum Intensity Projections (MIPs) of data sets
consisting of several optical sections. ................................................................................... 112
Figure 64: Grape like structure of bacteria on oil droplets after 18 days in sample with S200
and consortium Eb8. Photos represent Maximum Intensity Projections (MIPs) of data sets
consisting of several optical sections. ................................................................................... 112
Figure 65: Marichem effects on the interaction between oil droplets and bacteria from
consortia Eb8& E4 thought time. Photos represent Maximum Intensity Projections (MIPs) of
data sets consisting of several optical sections. .................................................................... 113
Figure 66: Marichem effects on the interaction between oil droplets and bacteria from
consortia Eb8& E4 thought time. Photos represent Maximum Intensity Projections (MIPs) of
data sets consisting of several optical sections. .................................................................... 113
Figure 67: Evolution of bacteria development on eicosane droplets through time for
consortia Eb8& E4 shown as XYZ projections. ...................................................................... 114
Figure 68: Evolution of bacteria development on eicosane droplets through time in the
presence of rhamnolipids for consortia Eb8 (D, E) & E4 (A-C, F) shown as XYZ projections. 115

xxviii

xxix
List of Tables
Table 1: Conventional shoreline clean-up options .................................................................. 12
Table 2: Advantages and Disadvantages of Landfarming (US EPA, 2004; Maila and Cloete,
2004). ....................................................................................................................................... 15
Table 3: Major nutrient types used in oil bioremediation * ................................................... 20
Table 4: Additional criteria for successful bioremediation of contaminated shorelines ........ 21
Table 5: Situations where biostimulation is recommended for the bioremediation of
contaminated shorelines ......................................................................................................... 21
Table 6: Primer sets used for group-specific amplification of alkB and phnA gene fragments
................................................................................................................................................. 44
Table 7: 1st Experimental approach Set Up (Seawater 1) ........................................................ 49
Table 8: 2nd Experimental approach Set Up (Seawater 2) ....................................................... 51
Table 9: 3rd Experimental approach Set Up (Sand 1) ............................................................... 52
Table 10: 4th Experimental approach Set Up (Sand 2) ............................................................. 52
Table 11: Experimental Set up of Selected Consortia and Rhamnolipids on Eicosane Droplets
................................................................................................................................................. 54
Table 12: Experimental Set up of Selected Consortia and Dispersants on Crude oil Droplets 54
Table 13: Specific growth and degradation rate of selected alkanes (Seawater 1) ................ 60
Table 14: Specific degradation rate of the selected PAHs (Seawater 1) ................................. 63
Table 15: alpha diversity estimates changes between treatments (Seawater 1). .................. 69
Table 16: The most significant OTUs in determining similarity/dissimilarity within or between
“no” and “npk” nutrient groups (Seawater 1)......................................................................... 70
Table 17: Phylogenetic affiliation of the OTUs presented in Table 1 based on the BLAST
results of the consensus sequence of each OTU against the “nr” nucleotide collection of the
NCBI database (Seawater 1). ................................................................................................... 70
Table 18: Specific growth and degradation rate of the selected alkanes (Seawater 2) .......... 76
Table 19: Specific degradation rate of the selected PAHs (Seawater 2) ................................. 76
Table 20: Specific growth and degradation rate of the selected alkanes (Sand 1) ................. 83
Table 21: Specific growth and degradation rate of the selected PAHs (Sand 1) ..................... 85
Table 22: Specific growth and degradation rate of the selected alkanes (Sand 2) ................. 93
Table 23: Specific growth and degradation rate of the selected PAHs (Sand 2) ..................... 95

xxx

Chapter 1- Introduction

2
Chapter 1 Introduction
3
1. INTRODUCTION
1.1. Addressing the problem
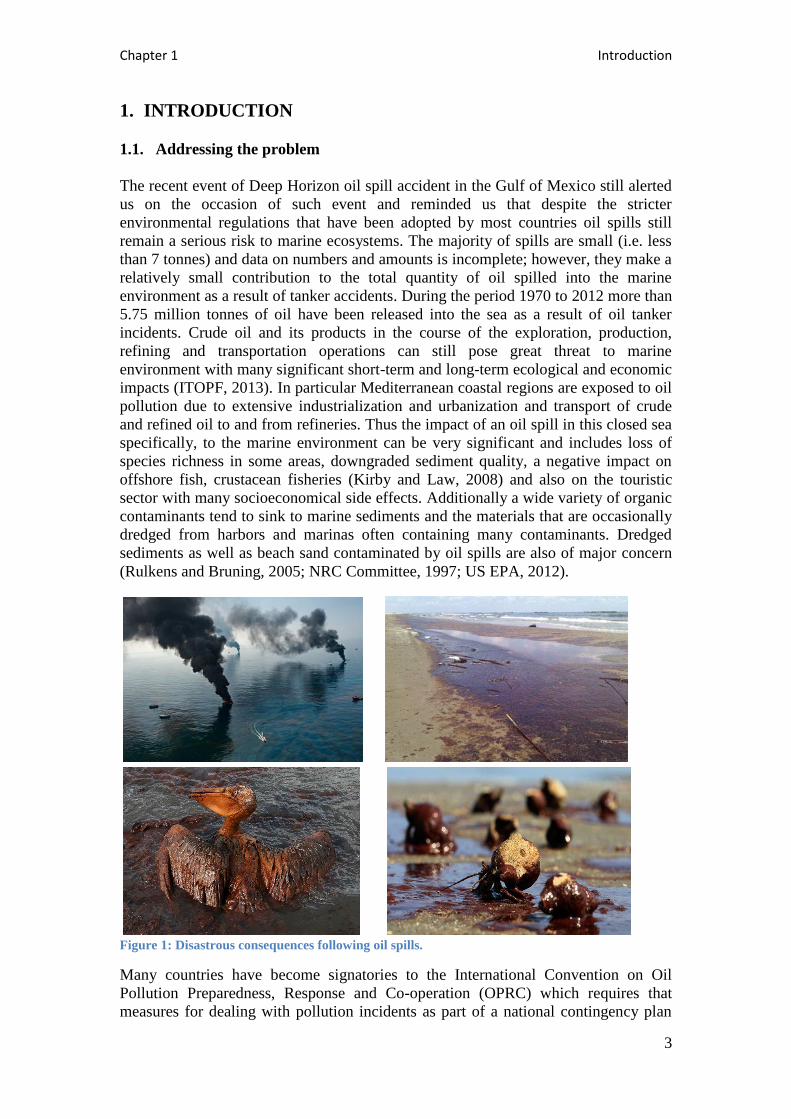
The recent event of Deep Horizon oil spill accident in the Gulf of Mexico still alerted
us on the occasion of such event and reminded us that despite the stricter
environmental regulations that have been adopted by most countries oil spills still
remain a serious risk to marine ecosystems. The majority of spills are small (i.e. less
than 7 tonnes) and data on numbers and amounts is incomplete; however, they make a
relatively small contribution to the total quantity of oil spilled into the marine
environment as a result of tanker accidents. During the period 1970 to 2012 more than
5.75 million tonnes of oil have been released into the sea as a result of oil tanker
incidents. Crude oil and its products in the course of the exploration, production,
refining and transportation operations can still pose great threat to marine
environment with many significant short-term and long-term ecological and economic
impacts (ITOPF, 2013). In particular Mediterranean coastal regions are exposed to oil
pollution due to extensive industrialization and urbanization and transport of crude
and refined oil to and from refineries. Thus the impact of an oil spill in this closed sea
specifically, to the marine environment can be very significant and includes loss of
species richness in some areas, downgraded sediment quality, a negative impact on
offshore fish, crustacean fisheries (Kirby and Law, 2008) and also on the touristic
sector with many socioeconomical side effects. Additionally a wide variety of organic
contaminants tend to sink to marine sediments and the materials that are occasionally
dredged from harbors and marinas often containing many contaminants. Dredged
sediments as well as beach sand contaminated by oil spills are also of major concern
(Rulkens and Bruning, 2005; NRC Committee, 1997; US EPA, 2012).
Figure 1: Disastrous consequences following oil spills.
Many countries have become signatories to the International Convention on Oil
Pollution Preparedness, Response and Co-operation (OPRC) which requires that
measures for dealing with pollution incidents as part of a national contingency plan

Chapter 1 Introduction
4
are produced including the use of oil spill treatment products where appropriate
(Kirby and Law, 2008).
Strategies for cleaning up an oil spill both physico-chemical and biological are greatly
affected by a variety of factors, such as the type of oil, the characteristics of the spill
site, and occasionally political considerations (Zhu et al., 2001).
1.2. Oil Chemical Composition and Physical Properties
The chemical composition of petroleum products is complex and will change over
time when released into the marine environment, which makes difficult to select the
appropriate either countermeasure or analytical method to evaluate the environmental
impact. Thus it is important to understand and evaluate the properties of petroleum
and petroleum products to choose the appropriate response option.
1.4.1. Chemical Composition
Crude oil is an extremely complex mixture of tens of thousands of individual
hydrocarbons (aliphatics and aromatics) and nonhydrocarbons (containing sulfur,
nitrogen, oxygen, and various trace metals). The hydrocarbon content may be as high
as 97% by weight in a conventional (lighter) paraffinic crude oil, or about 50% by
weight in a heavy crude oil and less than 30% by weight in tar sand bitumen. These
compounds range from small, simple, volatile, and distinct compounds (e.g., methane)
to extremely large, complex, nonvolatile, colloidally dispersed macromolecules (e.g.,
asphaltenes). Some representative organic compounds found in crude oil are
illustrated in Figure 2. The distribution of these compounds imparts certain physical
properties on the oil, and it is these physical properties (e.g., density or viscosity) by
which crude oils are generally classified, bought, and sold. Conventional crude oils
can be generally classified based upon the predominance of the major hydrocarbon
classes — paraffins, naphthenes, and aromatics.
The proportions of aliphatics, aromatics hydrocarbons and non-hydrocarbons occur in
varying amounts, depend on the source and character of the oil and can be classified
into five major groups:
1 Saturated hydrocarbons: Include normal and branched alkanes (also called n-
paraffins) and cyclic alkanes or cycloparaffins (also called naphthenes) which include
sesquit-, di-, tri-, tetra-, and pentacyclic terpanes and sterane biomarkers. Saturates
usually are the most abundant constituents in crude oils and are markedly reduced due
to biodegradation in heavy crude oils.
2 Unsaturated hydrocarbons: Include linear and branched alkenes (also called
olefins). Alkenes are not generally found in crude oil, but are common in thermally-
produced products, such as naphtha.
3 Aromatic hydrocarbons: Include single-ring aromatics (also called
monoaromatics e.g., benzene, toluene, and xylenes) which are considered to be the
most acutely toxic components of crude oil and potential carcinogens, and multi-ring
aromatics also known as polycyclic aromatic hydrocarbons (PAHs) (e.g., naphthalene,
anthracene, and phenanthrene), which have two or more fused aromatic rings. A
typical crude oil contains approximately 1% polycyclic aromatic hydrocarbons.
Nonhydrocarbons include polars, resins, and asphaltenes.
4 Resins: Include polar compounds containing nitrogen, sulfur, and oxygen
atoms that impart a “polarity” to the compounds and are often referred to as NSO

Chapter 1 Introduction
5
compounds. Nitrogen-containing compounds include benzocarbazoles, quinolines,
and porphyrins, sulfhur-containing compounds include benzo-, dibenzo-, and
polynuclear thiophenes, and oxygen-containing compounds include furans, phenols,
and acids.
5 Asphaltenes: Consist of poorly characterized high molecular weight
compounds that include both high molecular weight and poorly characterized
hydrocarbons and NSOs. Metals such as nickel, vanadium, and iron are also
associated with asphaltenes.
Heavy crude oils contain higher percentages of aromatic hydrocarbons, predominantly
PAH, and nonhydrocarbons (NSOs) than conventional crude oils. (Zhu et al., 2001;
Speight and Arjoon, 2012; Wang and Stout, 2007).
Figure 2: Examples of representative organic compounds found in crude oils.

Chapter 1 Introduction
6
1.4.2. Physical Properties of Oil
Important properties for characterizing the behaviour of petroleum and its products
when released to the environment include:
Density is the mass of a unit volume of material at a specified temperature and has the
the dimensions of g/cm3. Density is a determinant as to whether or not the crude
petroleum or its product will float on water and therefore remain susceptible to aerial
oxidation and subsequent emulsion formation. :
Two types of density expressions for oils are often used: specific gravity and
American Petroleum Institute (API) gravity. Specific gravity is the ratio of the mass
of a volume of the substance to the mass of the same volume of water at a specified
temperature. The API gravity arbitrarily assigns a value of 10 to pure water at 10°C
(60°F). The API gravity can be calculated from the specific gravity using the formula:
141.5
131.5(16 / 60 )o o
API GravitySpecific Gravity C F
Oils with low densities or low specify gravities have high API gravities. The specific
gravity of petroleum usually ranges from about 0.8 (45.3 API) for the light and heavy
crude oil to over 1.0 (< 10 API) for tar sand bitumen. Oil density is an important
index of oil composition that is frequently used to predict its fate in water.
2. Viscosity: Viscosity is the property of a fluid that describes how it resists a change
in shape or movement. The lower the viscosity a fluid has, the more easily it flows.
The viscosity of petroleum is related to oil compositions and the ambient temperature.
It is an important index of the spreading rate of spilled oil.
3. Pour Point: The pour point of an oil is the temperature at which it becomes semi-
solid or stops flowing. The pour point of crude oils varies from –57°C to 32°C. It is
another important characteristic with respect to oil fate and cleanup strategies.
4. Solubility in water: The solubility of oil in water is extremely low and depends on
the chemical composition of the petroleum hydrocarbon in question and temperature.
For a typical crude oil, solubility is around 30 mg/L. The most soluble oil components
are the low molecular weight aromatics such as benzene, toluene and xylene. This
property is important with respect to oil fate, oil toxicity and bioremediation
processes.
Other important physical properties of oils include flash point, vapor pressure, surface
tension, emulsion formation and adhesion (Zhu et al., 2001; Speight and Arjoon,
2012).
1.3. Fate (Weathering) of Oil Spills in the Environment
Oil is a generic term used for petroleum products that consist mainly of hydrocarbons.
Crude oils constitute of a wide variety of hydrocarbons ranging from very volatile
such as propane and benzene to more complex heavy compounds such as bitumens,
asphaltenes, resins and waxes. Refined petroleum products such as diesel or jet oil are
composed of smaller and more specific ranges of hydrocarbons.
When oil is spilled in a marine environment, it will break up and be dissipated or
scattered over time. This dissipation is the result of a number of processes (chemical,
physical or biological) that change the composition of the originally spilled oil. These
processes are collectively known as weathering (ITOPF, 2013). As bioremediation is

Chapter 1 Introduction
7
a rather slow process used after conventional cleanup has been applied, the residual
oil is often highly weathered before enhanced bioremediation strategies are applied.
Figure 3: Oil spill weathering processes (http://www.sintef.no).
The physicochemical and biological processes that take place in the weathering of
crude oil are: spreading, evaporation, dissolution, photo-oxidation, dispersion,
emulsification, biodegradation as well as adsorption onto suspended particulate
matter, sedimentation and tar ball formation. During the early stages of a spill,
spreading, evaporation, dispersion, emulsification and dissolution are the most
important weathering processes whilst oxidation, sedimentation and biodegradation
are more important later on and determine the ultimate fate of the oil (ITOPF, 2013).
In the long run, it is biodegradation that eventually removes the spilled oil from the
environment. The combined effect of these processes in addition to action of the
waves creates high variability in field studies and difficulties in the evaluation of the
efficacy of bioremediation enhancing agents.
Biomarkers are often used to overcome the latter problem. These are non-
biodegradable components present in crude oil. The extent of biodegradation is
estimated by comparing the ratio of a target hydrocarbon concentration to the
concentration of any of these recalcitrant biomarkers. Several substances have been
proposed as biomarkers (e.g., pristane & phytane; hopanes and alkylated PAHs
isomers) although hopanes have emerged as the best choice (Prince et al., 1994).
Hopane normalization is an effective way to distinguish biodegradation from the
effects of the physical washout and sand/sediment exchange (Venosa et al., 1996).
Chapter 1 Introduction
8
1.4. Mechanism of Oil Biodegradation: A Microbiological Perspective
1.4.1. Distribution of Hydrocarbon-Degrading Microorganisms
Hydrocarbons as part of the organic carbon cycle exist for years in the environment
and consequently hydrocarbon degrading microorganisms are present globally but in
very low abundance. However fossil fuels exploitation with serious amounts of
hydrocarbons either deliberately or accidentally released to the marine environment
are interfering to the carbon cycle and are causing substantial changes in the
hydrocarbon degraders community’s composition and activity. Oil inputs to the
marine environment can be highly toxic to the marine microbial communities but on
the other hand this selective pressure can considerably increase the number of the
hydrocarbon discriminating microbial communities in the particular oil contaminated
areas (Harayama et al., 2004).
Hydrocarbon degraders have a very versatile metabolism, so that petroleum
hydrocarbons are one amongst many other substrate classes that can serve as carbon
sources and are not the first ones which are preferred as substrates (Harayama et al.,
2004; Margesin et al., 2003). However there is a newly characterized class of bacteria
that uses exclusively hydrocarbons as substrates and has been categorized as obligate
hydrocarbonoclastic bacteria (OHCB) (Harayama et al., 2004; Head et al., 2006;
Yakimov et al., 2007). These so called hydrocarbonoclastic bacteria are of great
importance since they belong to the key players in oil removal from contaminated
marine sites.
Seawater bacteria cannot be readily retrieved by culture-dependent methods and those
few that can be cultured are generally quite different from those identified by the
culture-independent molecular techniques rRNA approaches.
Marine microbial communities response to oil pollution has been extensively
investigated with molecular techniques like Polymerase Chain Reaction (PCR) in
combination with methods that generate fingerprints such as Denaturing Gradient Gel
Electrophoresis (DGGE) the last few years with effective characterization and
isolation of hydrocarbon degrading bacteria that usually belong to the genera of
Alcanivorax , Cycloclasticus, Marinobacter, Thallassolituus, Neptunomonas,
Oleiphilus and Oleispira within the γ-Proteobacteria, and of the genus Planococcus
within Gram-positive bacteria (Harayama et al., 2004; Yakimov et al., 2004). Among
these Alcanivorax, Marinobacter, Thallassolituus, Cycloclasticus, Oleispira are the
most characteristic representatives of the hydrocarbonoclastic bacteria (OHCB) due to
their universal distribution and frequent domination on HC-degrading communities
that have been fully investigated (Yakimov et al., 2007).
Alcanivorax borkumensis, which is ubiquitous in oil polluted marine environment is
able to metabolize linear and branched alkanes, but unable to use aromatic
hydrocarbons, sugars, amino acids, fatty acids and most other common substrates as
the carbon source (Schneiker et al., 2006; Yakimov et al., 1998). Thallassolituus
oleivorans is highly specialized in aliphatic hydrocarbons from C7 to C20 carbons
(Yakimov et al., 2004). On the contrary Cycloclasticus strains are exclusively able to
grow with several PAHs like naphthalene, dibenzothiophenes, phenanthrenes,
anthracene, pyrene and fluorenes with or without alkyl substitution (Staley, 2010)
On the other hand Oleiphilus and Oleispira strains grow on the aliphatic
hydrocarbons, alkanoles and alkanoates (Harayama et al., 2004) whereas
Marinobacter strains are able to degrade efficiently hydrocarbon and petroleum
compounds. This ability to use either aliphatic (i.e. C14-C18, pristine) or aromatic

Chapter 1 Introduction
9
hydrocarbons (i.e. fluoranthene) as sole carbon sources is a significant characteristic
since this ability is not described for other true marine hydrocarbon-degrading strains
(Duran, 2010).
Other ‘non-professional’ hydrocarbonoclastic bacteria that have been isolated include:
Vibrio, Pseudoalteromonas, Marinomonas and Halomonas which are marine bacteria
capable of degrading phenanthrene or chrysene, naphthalene-degrading bacteria
Staphylococcus and Micrococcus, 2-methylphenanthrene- degrading Sphingomonas
and alkane-degrading Geobacillus (Harayama et al., 2004).
In general, the trend in biodegradation of petroleum hydrocarbons rate follows the
order: n-alkanes > branched alkanes > low-molecular-weight aromatics > cyclic
alkanes. However, this pattern is not consistent since it is highly influenced by the
compositional heterogeneity among different petroleum and petroleum products
nonetheless resin and asphaltenes are the most recalcitrant compounds of the
petroleum hydrocarbons.
Alkane degradation is induced by alkane hydroxylases which introduce oxygen atoms
derived from molecular oxygen into the alkane substrate and convert alkanes to
alkanols. According to van Beilen and Funhoff, 2007 depending on the chain-length
of the alkane substrate three categories of alkane hydroxylases that act on short-,
medium- and long-chain alkanes can be distinguished. Short-chain-length alkanes
(C2–C4) are oxidized by methane monooxygenase-like enzymes. Medium-chain-
length alkanes (C5–C16) are oxidized by integral membrane non-heme iron
monooxygenases, related to the well-characterized Pseudomonas putida GPo1 AlkB
alkane hydroxylase, or by cytochrome P450 monooxygenases. Finally, longer (C17+)
chain alkanes contain other types of alkane hydroxylases that only recently have
started to be characterized (van Beilen and Funhoff, 2007).
Furthermore aromatic hydrocarbons besides their recalcitrant nature can be
metabolized by specific microorganisms that possess the suitable genes encoding the
initial enzymes mono- and dioxygenases that catalyze hydroxylation reactions that
activate aromatic rings by addition of the atoms of molecular oxygen to one or more
carbon atoms of the substrate. Cyclic aromatic products containing two hydroxyl
substituents on adjacent carbon atoms of the ring are then converted to noncyclic
products by ring-cleavage dioxygenases that cleave the C–C bond either between the
hydroxylated carbons (ortho cleavage) or between a hydroxylated and
nonhydroxylated carbon (meta cleavage). The pathways for degradation of diverse
aromatic compounds often converge by channeling the intermediates towards
production of a few common hydroxylated ring-cleavage substrates such as
(methyl)catechols and protocatechuate. Following ring cleavage, subsequent reactions
then yield products such as acetate, pyruvate and succinate that enter the Krebs
Tricarboxylic Acid cycle or are used for biosynthesis (Haddock, 2010).
In this sense and due to practical reasons and most likely because functional genes
like alkBs (alkane hydroxylases) have a broad spectrum, it is informative to quantify
the spatial and temporal distribution of the alkB genes with PCR (van Beilen et al.,
2003). Thus gene alkB could possibly be used as a marker to predict the potential of
different environments for oil degradation (van Beilen and Funhoff, 2005). In the
same sense functional genes like PAH dioxygenases could be used as markers for the
prediction of the contaminated environment’s capacity for aromatic hydrocarbons
degradation.
Additionally as has been reported by Yakimov et al., 2007 studies have shown that an
influx of oil in a marine site causes population densities of OHCB to transiently
increase up to 90% of the total microbial community. Among them (OHCB )
Chapter 1 Introduction
10
Alcanivorax borkumensis, Thallassolituus oleivorans and Cycloclasticus spp. are
recognized as key players in the clean-up of petroleum-contaminated marine
environments due to their global distribution by, respectively, degrading alkanes and
aromatic compounds of petroleum. Hence, these universal hydrocarbon degraders
which appear to be reliable bio-indicators could be used as model organisms for
monitoring the age and type of hydrocarbon contamination occurred in marine
environment by tracking there functional genes responsible for alkanes and PAHs
degradation.
1.4.2. Bacterial Affinity-Interaction to Oil
Bioremediation studies have depicted the ability of certain bacteria to degrade
petroleum hydrocarbons as was discussed above, however the mechanisms of
interaction between bacteria and oil still are not completely clear -haven’t been
studied extensively.
However observation by microscopical apparatus (means) has demonstrated that
hydrocarbon degrading bacteria have a high affinity to oil droplets and Kennedy et al,
1975 was the first that indicated direct contact between bacterial cells and oil droplets
while observing hexadecane spheres densely covered by Acinetobacter sp. cells.
Examination by microscopy has shown the ability of bacteria to grow on several
single compounds of oil HCs both liquid and solid in the saturated and in the aromatic
fraction as well forming aggregates, clusters and biofilm around HCs droplets.
Biofilms are increasingly being recognised as the preferred mode of growth of
microbes in a wide range of interfaces liquid–liquid, solid–liquid, gas–liquid or solid–
gas. These spatially structured communities of microbes whose function is dependent
upon a complex web of symbiotic interactions, are held together by sugary molecular
strands, collectively termed "extracellular polymeric substances" or "EPS." The cells
produce EPS and are held together by these strands, allowing them to develop
complex three-dimensional, resilient, attached communities. Biofilms can be as thin
as a few cell layers or many inches thick, depending on environmental conditions
(CBE, 2013; Neu and Lawrence, 2009). EPS are organic polymers of microbiological
origin which, in biofilm systems, are responsible for the interaction with interfaces, as
well as with dissolved, colloidal and particulate compounds (after T.R. Neu and J.R.
Lawrence) and these organic polymers include polysaccharides (PSs), proteins,
nucleic acids, amphiphilic polymers and bacterial refractory compounds expressing
different functionalities (EPS can be constructive, adsorptive, active, surface-active,
informative, nutritive, locomotive and redox-active) (Neu and Lawrence, 2009).
Biofilm growth follows a stepwise pattern of development involving cell
differentiation and collective behavior of the cells; however studies of bacteria
growing at oil hydrocarbons interfaces have not yet gone far enough to say whether
they share all the characteristics of extensively studied model biofilms. Moreover in
this particular type of biofilms, oil droplets can serve both as substrate and substratum
for bacteria that can be found embedded within the matrix or growing at the oil–water
interface utilizing these compounds as energy source. This specificity distinguishes
this type of biofilms among others and so far hasn’t been studied extensively
(Grimaud et al, 2010).
Since the time of first observation of cells around Hexadecane droplets by Kennedy et
al, 1975, analogous examinations have been repeated by diverse alkane degrading
strains like, Rhodococcus sp. Q15 on C16, C28 (Whyte et al., 1999), Acinetobacter

Chapter 1 Introduction
11
venetianus RAG-1 on C16, nC12-C28 (Baldi et al., 1999), Oleiphilus messinensis on
C16 (Golyshin et al., 2002), Pseudomonas UP-2 on C24 (Zilber Kirschner et al.,
1980), Acinetobacter calcoaceticus MM5 on C14 (Marin et al., 1996), Halomonas sp.
ANT-3b on C16 (Pepi et al., 2005), Marinobacter hydrocarbonoclasticus SP17 on
C16, nC8-C28 (Klein et al., 2008) and Acinetobacter oleivorans DR1 on C16 (Jung
et al., 2011).
Attachment to solid surfaces like polycyclic aromatic hydrocarbons (PAHs) has also
been described for Pseudomonas sp. on pyrene, naphthalene, fluorene and
phenanthrene (Eriksson et al., 2002; Mulder et al., 1998, Rodrigues et al., 2005, Seo
and Bishop 2007), Sphingomonas sp.CHY-1 on chrysene (Willison, 2004) and
Mycobacterium sp. LB501T on fluorene and phenanthrene (Bastiaens et al., 2000).
Few studies focused on attachment to more complex HCs mixtures like crude oil,
diesel fuel, and heating oil as has been described for Acinetobacter calcoaceticus
MM5 (Marin et al., 1996) and Alcanivorax borkumensis SK2 (Martins dos Santos et
al., 2010).
However biofilms in nature most often consist of multi-species consortia. In these
consortia, individual species interact with the community in both synergistic and
antagonistic ways. Relationships between species can either be mutualistic, where
both organisms benefit, commensal, where one benefits and the other is unaffected, or
parasitic, where one organism benefits at the expense of another. Nonetheless only
few studies have been conducted for the observation of multispecies biofilm
development on HCs. Deppe et al., 2005 has observed biofilm forming on oil droplets
by a consortium that was enriched on crude oil from Arctic Sea ice and seawater from
Spitzbergen. This consortium effectively utilized n-c24-c34, pristine, xylenes and
crude oil as mixed culture on the contrary single or combination of strains weren’t
able to adapt and degrade crude oil successfully. Similar investigations were
conducted by other researchers like Li et al., 2000 using 16 different kinds of
hydrocarbon degrading bacteria on liquid paraffin and naphthalene, Southam et al.,
2001 on waste engine oil with an unknown consortium and Oliveira et al., 2009 using
2 species consortium on oil. Finally Stach and Burns, 2002 compared diversity of
planktonic cells to biofilm cells developing on PAHs (naphthalene-phenanthrene)
which exhibited 3 times higher diversity from planktonic cultures.
Although attachment and growth of bacterial cells on several hydrocarbon compounds
has been demonstrated, only few studies examined actual consumption i.e.
degradation of these hydrocarbon compounds (Efroymson and Alexander, 1991; Wick
et al., 2003; Zilber Kirschner et al., 1980; Rodrigues et al., 2005;, Macebo et al.,
2005;, Seo and Bishop 2007;, Klein et al., 2008;, Jung et al., 2011).
By experience and knowledge, immediate response actions in the event of an oil spill
include first of all mechanical containment and collection of the oil spill and most
likely afterwards the application if it is environmentally accepted of dispersants in
order to dissolve the remaining oil into the water column which subsequently will be
drifted away by the waves and the currents.
Studies have shown that there is great variety of bacteria that either have affinity, can
metabolize hydrocarbons or produce biosurfactants or similar chemicals that is
induced in a hydrocarbon polluted environment. Nonetheless single strain bacteria
have been thoroughly tested as has been described in detail above on their ability to
degrade a variety of single components of petroleum but not so many on mixtures of
hydrocarbons such as crude oil or any other petroleum products, little work has been
conducted on multispecies effect and action on degradation of either single
components nor complex mixtures of hydrocarbons

Chapter 1 Introduction
12
Although in the real environment numerous bacteria are organized and grouped in an
interactive way in between them and become associated to the pollutant, studies
haven’t yet focused on multispecies consortia mechanisms to degrade hydrocarbons
and most preferably oil since real accidents include release of oil and its products.
Every possible means of Microscopy have been used for the observation of biofilm
community developing at Hydrocarbon - water interfaces. However a major question
that arises from investigations on hydrocarbons biodegradation is how
microorganisms contact the substrate.
1.5. Response to Oil Spills in Marine Shorelines
A number of approaches and technologies have been developed for controlling oil spills
in marine shorelines. These methods have been reviewed and described extensively in a
number of technical documents and the most commonly used shoreline cleanup options
are summarized in Table 1.
Table 1: Conventional shoreline clean-up options
Category of Response Options Example Technology
Physical Method Booming
Skimming
Manual removal (Wiping)
Mechanical removal
Washing
Sediment relocation/Surf-washing
Tiling
In-situ burning
Chemical Method Dispersants
Demulsifiers
Solidifiers
Surface film chemicals
Although conventional response actions, such as physical removal with booms,
skimmers and absorbent materials (Figure 4), are the first option, they rarely achieve
complete cleanup of oil spills (10-15% of spilled oil is recovered) and must be
deployed soon after the spill occurs. Chemical methods, particularly dispersants,
although they have been routinely used in many countries as a response action, are
only allowed when the coastline depth is more than 15 m. Chemical dispersants, a
mixture of solvents and surfactants, reduce the interfacial tension between the water
and oil phases and, hence, the oil is easily dispersed into small droplets carried away
by natural seawater movement. They offer immediate and significant relief to sea-
surface wildlife (marine birds and mammals) and shoreline protection although these
benefits are realized to the detriment of the prevailing environmental quality in the
water column. Due to their potential toxicity effects on marine organisms, chemical
dispersants can be applied only under certain conditions and after they have
undergone significant testing before their use is approved (Kirby and Law, 2008). The
dispersion of oil into small droplets increases its bioavailability to naturally occurring
microorganisms and thus if the chemical dispersants are not very toxic, they are
generally expected to enhance biodegradation rates. This expected increase can only

Chapter 1 Introduction
13
be realized if other potentially limiting substrates are also present in the water column,
i.e., N, P and dissolved oxygen (Nikolopoulou and Kalogerakis, 2009).
On the other hand biological methods have gain importance and acceptance mainly
due to the low environmental impact, the costs and the capability to degrade a wide
variety of organic contaminants (Rulkens and Bruning, 2005). Bioremediation
through its first successful application on Exxon Valdez spill (Zhu et al., 2001), has
motivated many researchers to investigate physical, chemical and biological factors
that could produce favorable conditions for in-situ and ex-situ treatments.
Figure 4: Most common first response options to an oil spill.
1.6. Alternative Technologies to Combat Oil Spills
Over the past few years enhanced bioremediation has emerged as a promising
technology for combating marine oil spills following first response actions in the case
that decontaminated area is accessible and not sensitive. By now it is a well known
fact that diverse oil-degrading bacteria inhabit marine environments around the globe.
The natural cleaning action by indigenous hydrocarbon degraders, known as intrinsic
bioremediation, can be enhanced by the following two complementary approaches:
bioaugmentation and biostimulation. In bioaugmentation, the addition of oil-
degrading bacteria boosts bioremediation rates whereas in biostimulation, the growth
of indigenous hydrocarbon degraders is stimulated by the addition of nutrients
(mainly N & P) or other growth-limiting nutrients.
Oil spill incidents are approached differently due to the case specific conditions that
can be encountered near Shore and off shore. So oil spill problems are divided in two
categories open water problems and Shoreline problems. While bioremediation in
liquid matrices (seawater) is implemented in a more direct way, in the soil matrix is
achieved through landfarming systems. The common strategy that is being followed
in the seawater matrix is to design bioremediation agents which target the oil droplets
in the sea water and are not readily diluted or washed out by the wave action.

Chapter 1 Introduction
14
1.6.1. Landfarming
Landfarming, typically used for remediating refinery petroleum sludges, is among the
bioremediation technologies that have been also used for the remediation of crude oil
contaminated marine soil and sediments (Nikolopoulou and Kalogerakis, 2011).
Landfarming, also known as land treatment or land application, is an above-ground
remediation technology for soils that reduces concentrations of petroleum constituents
through volatilization and biodegradation (Figure 5). This technology usually involves
spreading excavated contaminated soils in a thin layer on the ground surface and
stimulating aerobic microbial activity within the soils through aeration and/or the
addition of minerals, nutrients, and moisture (US EPA, 2004). Landfarming has been
successfully practiced for over 100 years in treating mostly hydrocarbon contaminated
soils. Lighter petroleum hydrocarbons are mainly removed from soil through
volatilization and to a lesser extent due to microbial degradation. On the other hand,
heavier petroleum hydrocarbons like lubricating oils and diesel fuel do not evaporate
and their removal is due to microbial breakdown, which takes longer (Khan et al.,
2004). Nonetheless it has become more attractive than other soil remediation methods
because it has low cost, energy consumption, risk of contaminant migration and low
environmental impact, but most importantly landfarming complies with government
regulations and is very versatile to any climate and location (Besaltatpour et al.,
2011). Major factors influencing landfarming performance are summarized in Table
2. Landfarming can be in situ or ex situ; if contaminated soils are shallow (i.e., < 1 m
below ground surface), it may be possible to effectively stimulate microbial activity
without excavating the soils, if petroleum contaminated soil is deeper than 1.7 m, the
soils should be excavated and reapplied on the ground surface (US EPA, 2004).
Figure 5: Typical landfarming treatment unit
Soil conditions that are often controlled to optimize the rate of contaminant
degradation include:
Moisture content (usually by irrigation or spraying).
Aeration (by tilling the soil with a predetermined frequency, the soil is mixed
and aerated).
pH (buffered near neutral pH by adding crushed limestone or agricultural lime).
Other amendments (e.g., Soil bulking agents, nutrients, etc.) (US FRTR, 2007).
Petroleum hydrocarbon compounds bind to soil components and are more difficult to
remove and degrade compared to oil in seawater. According to Harmsen et al., 2007

Chapter 1 Introduction
15
microorganisms that exist within pores in the soil or the sediment matrix cannot
inhabit pores that are smaller than their own size. Under such conditions of pore size
distribution, the bioavailability of the absorbed contaminants is limited (Harmsen et
al., 2007). The stimulation of the indigenous microbial population is often beneficial
since they can produce oil dispersive compounds like biosurfactants that could
accelerate hydrocarbon degradation processes (Kosaric, 2001; Ron and Rosenberg,
2002). Biosurfactants which are more effective and environmentally friendlier than
chemical surfactants consist of a hydrophilic moiety and a hydrophobic moiety,
structure that allows them to enhance water solubility of hydrocarbons and increase
the displacement of oil molecules from soil particles (Calvo et al., 2009; Banat et al.,
2010; Ron and Rosenberg, 2010). For these reasons, the application of biosurfactants
in a bioremediation treatment of a hydrocarbon polluted environment could be really
advantageous. In addition, successful landfarming operation requires beside the
addition of N & P based-nutrients and other growth limiting co-substrates
(biosurfactants), the addition of specialized cultures typically comprising of
allochthonous degrading prokaryotes especially at the startup phase of the
landfarming process (Kalogerakis, 2005).
Table 2: Advantages and Disadvantages of Landfarming (US EPA, 2004; Maila and Cloete, 2004).
Advantages Disadvantages
Technology is simple to design and
implement
Reductions of concentration greater than
95% and concentrations lower than 0.1
ppm are difficult to achieve
Short treatment times (6-24 months under
optimal conditions)
May not be effective for high constituent
concentrations (greater than 50,000 ppm
total petroleum hydrocarbons)
Very low capital and operation input required Applicable only to biodegradable
pollutants
Large soil volumes can be treated Large treatment area is needed
Can be applied ex-situ Volatile constituents tend to evaporate
rather than biodegrade during treatment
Effective on organic constituents with slow
biodegradation rates
Involves risk of pollutant exposure
Has small environmental impact Adsorbents like clay and organic matter
can decrease the bioavailability and
therefore lower biodegradation efficiency
as contaminants are tightly bound to the
soil matrix
Energy efficient Substantial cost can be incurred during
excavation

Chapter 1 Introduction
16
Existing bioremediation approaches and current research for open sea or near shore
polluted marine environments by petroleum hydrocarbons are reviewed in the
following section.
1.7. Types of Bioremediation Amendments and Considerations in Their
Application
1.7.1. Biostimulation
In marine ecosystems, spilled petroleum hydrocarbons represent a large carbon source
for the microorganisms whereas in most cases the presence of nitrogen and
phosphorous is limited. Biostimulation refers to the addition of one or more rate-
limiting nutrients to accelerate contaminant biodegradation rates. In most shoreline
ecosystems that have been heavily contaminated with hydrocarbons, nutrients are
likely the limiting factors in oil biodegradation. Oxygen represents another very
significant and potentially rate-limiting nutrient that should be kept in mind before
embarking on a biostimulation program in the field (Nikolopoulou and Kalogerakis,
2009).
1.7.1.1. Water Soluble Inorganic Nutrients
From laboratory experiments it has been shown that the addition of growth limiting
nutrients, namely nitrogen and phosphorus, enhances the rate of oil biodegradation
and the optimum ratio of carbon to nitrogen to phosphorus is about 100:10:1 (Evers et
al., 2004). The actual amount of N and P needed for biodegradation of the released
hydrocarbons is site-specific as it is associated with the type of oil and the background
value of nutrients in the marine environment.
Xia et al., 2006 studied the effects of different forms of N in seawater polluted by
diesel. They found that the addition of NO3-N was more successful than that of NH4-
N in accordance to previous studies by Wrenn et al., 1994 where in poorly buffered
seawater polluted with Arabian light crude oil, nitrate was found as a better nitrogen
source compared to ammonia. This is attributed to acid production associated with
ammonia metabolism which inhibits oil biodegradation. When the pH was controlled,
the performance of oil biodegradation was similar for both amendments with a shorter
lag time for ammonia. With no control of pH, nitrate was found to have the most
pronounced effect in stimulating oil degradation when using pristane as a biomarker
(Ramstad and Sveum, 1995).
Prevailing seawater temperature affects oil biodegradation. Coulon et al., 2007 found
that when temperature was increased from 4°C to 20°C, it had a significant effect in
all microcosm treatments and the maximum degradation of TPH was observed at
20°C. Furthermore, addition of N and P resulted in the greatest hydrocarbon
degradation. However, these results do not exclude bioremediation as a treatment in
polluted arctic environments, as Wrabel and Peckol, 2000 showed the effectiveness of
nutrients application at coastline temperatures of the western North Atlantic.
Biostimulation has been tested and applied successfully to enhance oil biodegradation
in cold arctic, alpine, and Antarctic environments where psychrophilic bacteria are
plentiful (Margesin and Schinner, 1999). Recently, Garcia-Blanco et al., 2007
assessed the effectiveness of biostimulation in remediating an oil-contaminated

Chapter 1 Introduction
17
coastal marsh dominated by Spartina alterniflora under north-temperate conditions
(Nova Scotia, Canada).
Commonly used water-soluble nutrients include mineral nutrient salts (e.g. KNO3,
NaNO3, NH3NO3, K2HPO4, MgNH4PO4, Ca(H2PO4)2, Na5P3O10), and many
commercial inorganic fertilizers (e.g., the 23:2 N:P garden fertilizer used in the Exxon
Valdez case). Typically, they are applied in the field by spraying aqueous nutrient
solutions or by spreading dry granules. This approach was used in many field trials
and was found to be effective in enhancing oil biodegradation (Roling et al., 2004;
Swannell et al., 1996; Venosa et al., 1996) including arctic environments (Prince et
al., 2003). However, the problem that still remains is that water-soluble nutrients are
easily washed by wave and tide action and thus enhanced biodegradation is difficult
to achieve in non sheltered marine environments or medium to high energy
shorelines.
1.7.1.2. Slow Release Fertilizers
Considerable effort has been devoted to the development of nutrient delivery systems
that overcome the washout problems characteristic of open sea and intertidal
environments. Use of slow release fertilizers can provide a continuous source of
nutrients to oil contaminated areas overcoming the requirement for multiple nutrient
applications in the field and resulting in cost benefits compared to water-soluble
nutrients due to less frequent application. Slow release fertilizers consist typically of
inorganic nutrients in solid form coated with a hydrophobic compound like paraffin or
vegetable oil (Nikolopoulou and Kalogerakis 2009). The best known slow-release
fertilizer, Customblen (vegetable oil coated calcium phosphate, ammonium
phosphate, and ammonium nitrate) performed well on some of the shorelines of
Prince William Sound, particularly in combination with an oleophilic fertilizer (Atlas,
1995; Swannell et al., 1996).
Kasai et al., 2002 investigated the effects of slow release fertilizers -solid granular
nitrogen fertilizer (Super IB) and slow-release solid granular phosphorous fertilizer
(Linstar 30)- on the biodegradation of crude oil. The addition of fertilizers promoted
the degradation of certain components of crude oil: more than 90% of n-alkanes
(C15–C30) and more than 60% of (alkyl)naphthalenes were degraded within 30 days,
whereas the degradation of three-ring aromatics (phenanthrene, anthracene, fluorene
and their alkylsubstituted derivatives) was less extensive, being between 30% and
40%. On the other hand, Maki et al., 2002; 2003 found that alkanes were degraded to
a lesser extent than naphthalenes or fluorenes and to almost the same extent as
dibenzothiophenes and phenanthrenes in field experiments performed in sand and
cobblestone beaches in Japan after the Nakhodka oil spill. However, in both
laboratory and field experiments the final degradation efficiencies for each oil
component in the fertilized sections were not significantly different from those in the
unfertilized sections, and the degradation of each oil component had almost ceased
after 6 weeks. It was concluded that excessive amounts of macronutrients are required
to accelerate oil biodegradation and under these conditions fertilization is only
effective in the early stages.
Xu et al., 2004 conducted a 105-d field experiment to determine the potential of
Osmocote (Scotts, Marysville, OH), a slow-release fertilizer, to stimulate
biodegradation of petroleum hydrocarbons in an oil-spiked beach sediment at an
intertidal foreshore in Singapore. Triplicate microcosms containing 80 kg of
weathered sediment, spiked with 5% (w/w) Arabian light crude oil and 1.2% (w/w)
Osmocote pellets, were established, together with control microcosms without

Chapter 1 Introduction
18
fertilizers. The concentration of Osmocote used in this study was previously
optimized in the laboratory (Xu et al., 2003). Relative to the control, the presence of
the Osmocote sustained a significantly higher level of nutrients and metabolic activity
of the indigenous microbial biomass in the sediment pore water over the duration of
the experiment. The loss of total recoverable petroleum hydrocarbons (TRPH) and
biodegradation of total n-alkanes (C10–C33), branched alkanes (pristane and
phytane), as well as total target polycyclic aromatic hydrocarbons (PAHs) (two- to
six-ring), in both the control and Osmocote-amended sediments, could be described
by a first-order biodegradation model. The first-order loss rate was 2.57 times greater
than that of the control. The hopane-normalized rate constants for total n-alkanes,
branched alkanes, and total target PAHs biodegradation in the Osmocote-treated
sediments were 3.95-, 5.50-, and 2.45-fold higher than the control, respectively.
Overall, the presence of Osmocote was able to significantly enhance and accelerate
the biodegradation of aliphatics and PAHs in oil-contaminated sediments under
natural field conditions (Xu et al., 2004).
Xu et al., 2005a; 2005b also investigated the effect of the slow-release fertilizer
Osmocote as well as two biopolymers, chitin and chitosan, on the bioremediation of
oil-spiked beach sediments over a 56-day period under laboratory conditions.
Osmocote was found to be effective in sustaining a high level of nutrients in leached
sediments, as well as elevated levels of microbial activity resulting in elevated rates of
hydrocarbon biodegradation. Chitin was more biodegradable than chitosan and
gradually released nitrogen into the sediment. The addition of chitin or chitosan to the
Osmocote amended sediments enhanced biodegradation rates of the alkanes relative
to the presence of Osmocote alone, where chitosan was more effective than chitin due
to its greater oil sorption capacity. Furthermore, chitosan significantly enhanced the
biodegradation rates of all target polycyclic aromatic hydrocarbons (Xu et al., 2005a;
2005b).
Oh et al., 2001 studied the effect of a slow release fertilizer to stimulate the
indigenous microbial biodegradation of petroleum hydrocarbons in an oil-
contaminated microcosm (3% v/v) which simulated intertidal environmental systems.
Results in this study suggested that nutrient amendment in a high dose (microcosm I,
144.4 mg C/Kg sand/day, versus microcosm II, 8.5 mg C/Kg sand/day) can accelerate
initial oil degradation rates and this in turn may shorten the treatment period for
cleaning up the contaminated site (Oh et al., 2001).
Nonetheless, the challenge that still remains in applying slow release fertilizers is to
control the release rates so that suitable nutrient concentrations can be maintained
over longer periods of time in the marine environment. Fast release rates do not
provide a long term source of nutrients whereas very slow release rates are
insufficient to enhance biodegradation rates. For example, Sveum and Ramstad, 1995
tested Max Bac, a slow release fertilizer similar to Customblen, and found that it
failed to enhance oil biodegradation significantly due to its slow release rate. On the
other hand, if one uses a mixture of water soluble and slow release fertilizers in one
application better results can be obtained.
1.7.1.3. Oleophilic Biostimulants
A successful alternative that overcomes the problem of quick dilution and wash out of
water-soluble nutrients containing nitrogen and phosphorus is oleophilic
biostimulants. The application of N and P sources in oleophilic form is considered to
be the most effective nutrient application method, since oleophilic additives remain
dissolved in the oil phase and thus are available at the oil-water or oil-sediment
Chapter 1 Introduction
19
interface where they enhance bacterial growth and metabolism (Santas and Santas,
2000).
The best-known oleophilic fertilizer is Inipol EAP22, a microemulsion containing
urea as N-source, lauryl phosphate as P-source, 2-butoxy-1-ethanol as a surfactant,
and oleic acid to give the mixture its hydrophobicity. This fertilizer has been
subjected to extensive studies under various shoreline conditions and was successfully
used in oil bioremediation on the shorelines of Prince William Sound (Swannell et al.,
1996; Zhu et al., 2001). Another oleophilic fertilizer that was used extensively at the
Prestige heavy fuel oil spill is S200 which differs from Inipol EAP22 only in the
formulation of the surfactant component (Díez et al., 2005; Jiménez et al., 2006). Díez
et al., 2005 observed enhanced biodegradation of the Prestige fuel oil in microcosms
containing S200 compared with those containing inorganic phosphorous and
nitrogenous salts. These results led to a bioremediation field assay at a cobblestone
mixed with sand and gravel beach on the Cantabrian coast (north Spain) using S200.
A rigorous control of biodegradation of aliphatic and aromatic hydrocarbons using
internal conservative molecular markers for 220 days showed an acceleration of
biodegradation at 30–60 days and an enhancement of biodegradation, especially of the
heavier n-alkanes (C25–C35) and the alkylated PAHs (Jiménez et al., 2006). Other
oleophilic fertilizers include polymerized urea and formaldehyde, and organic
fertilizers derived from natural products such as fishmeal and meat meal or from
natural byproducts such as guano fertilizer.
As an alternative to the chemical surfactants present in most commercial oleophilic
biostimulant formulations, biosurfactants can be employed. Biosurfactants are
surface-active compounds produced by microorganisms. Glycolipids,
lipopolysaccharides, oligosaccharides, and lipopeptides, produced by diverse bacterial
genera, have received considerable attention for environmental applications including
bioremediation, soil washing, and soil flushing. Biosurfactants seem to enhance
biodegradation by increasing the bioavailability of organic pollutants including crude
oil components. Due to their biodegradability and low toxicity they are very
promising for use in remediation technologies (Mulligan, 2005). However, successful
commercialization of biosurfactants can be accomplished, only if their production
costs are low and their efficacy as dispersion and remediation agents is proven in the
field. Research efforts for the development of novel biosurfactants with diverse
environmental applications are continuing (Mulligan, 2005; Saeki et al., 2009).
The effectiveness of oleophilic biostimulant formulations depends on the
characteristics of the site such as type of sediment or high/low energy wave action and
tide. From early on it was shown that oleophilic fertilizers can be more effective than
water-soluble fertilizers when the spilled oil resided in the intertidal zone (Sveum et
al., 1994); however, no enhancement of biodegradation rates was observed in zones of
limited water transport. Variable results have also been produced regarding the
persistence of oleophilic fertilizers. Some studies showed that Inipol EAP22 can
persist in a sandy beach for a long time under simulated tide and wave actions
(Swannell et al., 1995; Santas and Santas, 2000); however, experience from very high
energy shorelines suggests that even oleophilic fertilizers can be rapidly washed out.
It is noted that addition of rhamnolipid biosurfactants alone had little effect on
biodegradation; however, in combination with water soluble nutrient additions,
provoked a significant increase (McKew et al., 2007). Sole biosurfactant addition is
warranted only to increase bioavailability of weathered petroleum components in
situations where background levels of N & P are sufficiently high to sustain increased
biodegradation rates.

Chapter 1 Introduction
20
Many researches (Atlas, 1995; Coulon et al., 2007; Díez et al., 2005; Garcia-Blanco et
al., 2007; Jiménez et al., 2006; Kasai et al., 2002; Maki et al., 2002; Maki et al., 2003;
Margesin and Schinner, 1999; McKew et al., 2007; Prince et al., 2003; Ramstad and
Sveum, 1995; Roling et al., 2004; Santas and Santas, 2000; Swannell et al., 1995;
Swannell et al., 1996; Sveum et al., 1994; Sveum and Ramstad, 1995; Venosa et al.,
1996; Wrabel and Peckol, 2000; Wrenn et al., 1994; Xia et al., 2006; Zhu et al., 2001)
have compared the effectiveness of these nutrient products to stimulate oil
biodegradation rates. Experimental results from laboratory and field studies indicate
the importance of local prevailing conditions. Water-soluble fertilizers are likely more
cost-effective in low-energy and fine-grained shorelines and generally sheltered sites
where washout is limited. On the other hand, slow-release fertilizers may be ideal
nutrient sources if the nutrient release rates can be well controlled and the non
dissolved particles cannot be washed out by the wave action. Finally, oleophilic
fertilizers may be more suitable for use in higher-energy, coarse-grained beaches and
generally exposed sites and open sea environments. Biostimulation with nutrients and
biosurfactants enables naturally occurring microbes to adapt better and faster to the oil
spill environment resulting in shorter lag phase and faster crude oil degradation
(Nikolopoulou et al., 2007; Nikolopoulou and Kalogerakis, 2008), thus making it an
effective tool for combating oil spills. In Table 3 the major nutrient types used in
biostimulation of oil spills are shown.
Table 3: Major nutrient types used in oil bioremediation *
Type of
nutrients
Advantages Disadvantages Applications in
the field or field
trials
Water soluble
(e.g., KNO3,
NaNO3, NH3NO3,
K2HPO4,
MgNH4PO4)
o Readily available
o Easy to manipulate
for target nutrient
concentrations
o No complicated
effect of organic
matter
o Rapidly washed out
by wave and tide
o Labor-intensive, and
physical intrusive
applications
o Potential toxic effect
Alaska (Pritchard
et al., 1992)
Delaware
(Venosa et al.,
1996)
Slow release
(e.g.,
Customblen,
IBDU, Max-Bac)
o Provides a
continuous sources
of nutrients
o More cost effective
than other types of
nutrients
o Maintaining optimal
nutrient release rates
could be a challenge
Alaska (Pritchard
et al., 1992)
Nova Scotia (Lee
and Trembley,
1993)
Japan (Maki et
al., 2003)
Oleophilic
(e.g., Inipol
EAP22, F1,
MM80, S200)
o Able to adhere to oil
o Provides nutrients at
the oil-water
interface
o Expensive
o Effectiveness is
variable
o Containing organic
carbon, which may
compete with oil
degradation and
result in undesirable
anoxic conditions
Alaska (Pritchard
et al., 1992)
Nova Scotia (Lee
and Levy, 1987;
Lee and Levy,
1989; Lee et al.,
1995a; Lee et al.,
1995b)
Cantabrian Coast,
Spain (Jiménez et
al., 2006 ) * adapted from Zhu et al., 2001 and updated with recent studies.

Chapter 1 Introduction
21
1.7.1.4. Oxygen Limitations
Despite the apparent effectiveness of oleophilic fertilizers or mixed products, no
enhancement of oil biodegradation rates should be expected if they are added to an
anoxic marine environment. In several instances the concentration of dissolved
oxygen can be close to zero leading to practically zero aerobic biodegradation rates. It
should be noted that although anaerobic biodegradation of hydrocarbons has been
documented in marine environments, the actual rate is very low. Although oxygen can
be successfully delivered (in various forms) to hydrocarbon-contaminated soils and
groundwater enhancing biodegradation rates, this is not the case in marine
environments as it is very difficult to implement such technologies in the field. Tiling
is essentially the only option in aerating the top layers of contaminated sediments
during low tide. All the above criteria for the successful biostimulation of oil spills are
summarized in Tables 4 and 5.
Table 4: Additional criteria for successful bioremediation of contaminated shorelines
Criterion Condition
Oil type Medium – heavy oil
Treatment volume < 4000 L
Nutrients Limitation
Prevailing temperatures > +5oC
Table 5: Situations where biostimulation is recommended for the bioremediation of
contaminated shorelines
Type of Coast Type of exposure
High Energy Low Energy
Cliffs, seawalls and piers NR+ NR
Rock platforms NR NR
Pebble beaches Oleophilic Oleophilic
Mixed sand and gravel beaches Oleophilic Oleophilic
Coarse grained sand beaches Oleophilic Slow Release
Fine grained sand beaches N/A Slow Release OR Water
Soluble
(plus tiling if oxygen
limitations)
+ NR: Biostimulation is Not Recommended
It should be noted that when we are faced with a chronically polluted marine site, we
should be careful and examine more carefully the conditions that inhibit
bioremediation prior to proceeding with the addition of slow release or oleophilic
fertilizers (Nikolopoulou and Kalogerakis, 2009).
Chapter 1 Introduction
22
1.7.2. Bioaugmentation
Bioaugmentation is defined as the technique for improving the biodegradation
capacity within a contaminated site to remove pollution by the introduction of specific
competent strains or consortia of microorganisms (El Fantroussi and Agathos, 2005).
1.7.2.1. Laboratory Studies on Bioremediation of Oil
Bioaugmentation is one of the most controversial issues of bioremediation. Addition
of oil-degrading microorganisms has been proposed as a bioremediation strategy. The
rationale for adding oil-degrading microorganisms is that indigenous microbial
populations may not be capable of degrading the wide range of potential substrates
present in complex mixtures such as crude oil (Leahy and Colwell, 1990).
Many vendors offer microbial agents claiming to enhance oil biodegradation (Prince,
1993). However, laboratory studies on bioaugmentation have produced mixed results.
Aldrett et al., 1997 tested thirteen different bioremediation products for their
effectiveness in biodegrading petroleum hydrocarbons. All 13 products tested in this
28-day period experiment were listed on the NCP (US EPA National Contingency
Plan) product schedule. Of these 13 products, 12 were bioaugmentation agents and
one was a biostimulation agent. This experiment revealed that the petroleum
hydrocarbons were biodegraded to an extent significantly greater than that achieved
by the naturally occurring microorganisms. After 28 days, some products reduced the
total saturated petroleum hydrocarbons fraction to 60% of its initial weight and the
total aromatic petroleum hydrocarbons fraction to 65%. Three of the 13 products
tested enhanced microbial degradation of the petroleum to a degree significantly
better than the nutrient control treatments (Aldrett et al., 1997).
Hozumi et al., 2000 tested the effectiveness of the bioaugmentation agent
TerraZymeTM
in treating heavy oil spilled from Nakhodka. The results exhibited a
high potential for biodegradation of oil. Approximately 35% of the Nakhodka oil was
degraded in 100 ml of test samples containing 1000 ppm of the initial concentration of
the oil during the three-week test period and biodegradation extended to the hardest
material in this contained heavy oil, the asphaltene fraction (Hozumi et al., 2000).
In another shaker flask experiment ten oil spill bioremediation products were tested
for their ability to enhance biodegradation of weathered Alaskan North Slope crude
oil in both freshwater and saltwater media. The products included nutrients to
stimulate inoculated microorganisms, nutrients plus an oil-degrading inoculum,
nutrients plus compounds intended to stimulate oil degrading activity, or other
compounds intended to enhance microbial activity. The product tests were undertaken
to evaluate significant modifications in the existing official United States
Environmental Protection Agency (EPA) protocol used for qualifying commercial
bioremediation agents for use in oil spills. In saltwater tests, six products
demonstrated various degrees of biodegradative activity against the alkane fraction of
the crude oil and three degraded the aromatic hydrocarbons by more than 10% (2 of
them were oleophilic ferilizers and one was microorganisms with nutrients). In
general, little evidence of significant growth of either alkane- or PAH-degraders
occurred among any of the ten products in the saltwater. With respect to the seven
products containing microbial cultures, only one product was able to significantly
biodegrade both oil fractions (Haines et al., 2005).

Chapter 1 Introduction
23
Vinas et al., 2002 investigated the capacity of three microbial consortia that were
obtained by sequential enrichment using three different oil products on degrading
crude oil. Consortium F1AA was obtained on a heavily saturated fraction of a
degraded crude oil; consortium TD, by enrichment on diesel and consortium AM, on
a mixture of five polycyclic aromatic hydrocarbons. The three consortia were
incubated for 10 and 20 days at 25 oC on a rotary shaker with Casablanca crude oil in
order to investigate possible differences in the biodegradation of these complex
hydrocarbon mixtures in relation to their origin. The extent of the attack on the
different fractions of a crude oil by the different consortia was consistent with their
origin. Consortium F1AA was more efficient in degradation of the saturated fraction
(60%); consortium TD attacked the aliphatic fraction to a high degree (48%) but also
degraded the polyaromatic fraction (11%); and consortium AM was the most efficient
in the degradation of the polyaromatic fraction (19%). Consortia F1AA and TD
removed 100% of n-alkanes and branched alkanes, whereas with consortium AM,
91% of branched alkanes remained. The 500-fold amplification of the inocula from
the consortia by subculturing in rich media, necessary for use of the consortia in
bioremediation experiments, showed no significant decrease in their degradation
capability. They came to the conclusion that enrichment on selected PAHs does not
make mixed populations more efficient in degrading the aromatic fractions of crude
oils than crude oil fractions such as diesel (Vinas et al., 2002).
Zrafi-Nouira et al., 2009 examined the ability of the indigenous microbiota of polluted
coastal seawater in Tunisia that was enriched by increasing the concentration of
zarzatine crude oil to degrade this oil. The results of the present study showed that the
heavy zarzatine crude oil was significantly biodegraded after 28 days of incubation
with the adapted microbiota, with non-aromatic and aromatic hydrocarbon
degradation rates having reached 92.6 and 68.7%, respectively. This suggests that the
native microflora could have a positive effect on hydrocarbon degradation (Zrafi-
Nouira et al., 2009).
Gertler et al., 2009 tested in a series of microcosms, 25 different treatments including
nutrient amendment, bioaugmentation with Alcanivorax borkumensis and application
of sorbent. The amount of transformed oil in microcosms containing non sterile
seawater in general was higher than in pure cultures of A. borkumensis. Moreover, the
relative concentrations of all components measured after 36 days of the experiment
were generally lower than those measured after 7 days. Interestingly, the relative
concentration of polyaromatic hydrocarbons detected after 7 days was relatively
similar between 58% and 45%, but decreased in microcosms containing the original
seawater community within the following 29 days. Aliphatic compounds on the other
hand decreased in a different pattern depending on the type of the microcosm. After
36 days, more than 95% of the aliphatic compounds were transformed in the
augmented microcosms, whereas the seawater-based microcosm still contained 18%
and with the pure culture of A. borkumensis more than 30% of the residual
hydrocarbons were remaining.
Results of this study indicate that owing to its exceptional adaptation to oil-polluted
marine environments and its strong dominance in case of adequate nutrient supply, A.
borkumensis is a major organism initiating and mainly conducting the degradation of
aliphatic hydrocarbons. As it is not able to degrade all components of the oil type used
in the experiment, it obviously promotes the growth of other microbes possibly by
providing better access to the substrate through oil emulsification using extracellular
polysaccharides (Gertler et al., 2009).

Chapter 1 Introduction
24
The role of biosurfactants and microorganisms that promote the production of
biosurfactants on oil degradation is also stressed in another study conducted by Zhang
et al., 2005. They found that Pseudomonas aeruginosa could degrade more than 58%
of crude oil with direct or indirect addition of rhamnolipids that were used to improve
the emulsification of the crude oil and thus make it more accessible to microbes
(Zhang et al., 2005).
This conclusion was supported by another study from Perfumo et al., 2006 with strain
Pseudomonas aeruginosa AP02-1 that was isolated from a hot spring environment on
hydrocarbon containing mineral salts media and based on its ability to utilize a range
of hydrocarbons both n-alkanes and polycyclic aromatic hydrocarbons as sole carbon
source. Strain AP02- 1 had an optimum growth temperature of 45°C and degraded
99% of crude oil 1% (v/v) and diesel oil 2% (v/v) when added to a basal mineral
medium within 7 days of incubation. Surface activity measurements indicated that
biosurfactants, mainly glycolipids in nature, were produced during the microbial
growth on hydrocarbons as well as on both water-soluble and insoluble substrates
(Perfumo et al., 2006).
Abalos et al., 2004 found also that the addition of rhamnolipids accelerated the
biodegradation of total petroleum hydrocarbons from 32% to 61% at 10 days of
incubation. Nevertheless, the enhancement by biosurfactant addition was more
noticeable in the case of the group of isoprenoids from the aliphatic fraction and the
alkylated polycyclic aromatic hydrocarbons (PHAS) from the aromatic fraction. The
biodegradation of some targeted isoprenoids increased from 16% to 70% and for
some alkylated PAHs from 9% to 44%, indicating that the solubilization of these
complex hydrophobic compounds was effective (Abalos et al., 2004).
1.7.2.2. Mesocosm Studies
Although laboratory tests were very positive, numerous mesocosm studies have
demonstrated the ineffectiveness of bioaugmentation treatments. For example, Tagger
et al., 1983 tested two mesocosms with crude oil. One was inoculated with an
acclimated culture, while only indigenous populations were used in the other.
Treating an experimental oil spill by adding a large quantity of a mixed culture of
hydrocarbon utilizing bacteria did not appear to be effective: five months after the
spill, the differences between the treated and untreated basins could not be determined
by an uninformed observer. These tests as well as previous work led them to the
conclusion that when nitrogen and phosphorous concentrations are the principal
limiting factors of bacterial growth rate in an oil spill, it does not seem necessary to
treat it with additional bacterial species adapted to hydrocarbon degradation. In
addition, none of the five allochthonous species previously selected on crude oil were
able to proliferate in the marine environment. However, the natural adaptative
capabilities of autochthonous marine microflora suggests that it would be interesting
to promote the proliferation of these widespread marine bacteria (Tagger et al., 1983).
Wright and Weaver, 2004 investigated the effect of seeding in salt marsh conditions.
Glasshouse experiments were conducted to determine the impacts of fertilization and
commercial bioremediation products on crude oil biodegradation and on changes in
nutrient concentrations and populations of hydrocarbon-degrading microorganisms in
salt marsh mesocosms growing Spartina alterniflora. Five commercial
bioremediation products were used in this study and were designated by numbers 1
through 5. Product 1 was Oil Spill Eater-II Concentrate (OSEI Corp., Dallas, Texas),
which contained enzymes. Product 2 was BioGEE HC Concentrate (BioGEE
Chapter 1 Introduction
25
International Inc., Houston, Texas), which was a microbial inoculant. Product 3 was
Alpha Biosea (Alpha Environmental Inc., Austin, Texas), a microbial inoculant with
nutrients. Product 4 was Oppenheimer Formula I (Oppenheimer Environmental Corp.,
Austin, Texas), a microbial inoculant with enzymes. Product 5 was Micro-Blaze Out
(Verde Environmental Inc., Houston, Texas), a microbial inoculant with enzymes and
dispersing agents. Experiments were conducted under continuously flooded and
alternately-flooded/drained conditions with and without N and P fertilization.
MaxBac, a slow-release fertilizer, was applied at a rate of 100 kg N /ha and 20 kg P
/ha, while additional P was applied at 20 kg P /ha. Commercial products failed to
enhance total oil or total petroleum hydrocarbon (TPH) degradation or the population
sizes of total heterotrophs and hydrocarbon degrading microorganisms under either
continuously or alternately-flooded conditions. It appears that native microbial
populations were capable of degrading oil and TPH without further need of
bioaugmentation. Over 50% of total oil and 60% of TPH were degraded within 33 to
41 d. The location of applied oil, either on the water surface or the flooded sediment
surface, had little influence on either oil or TPH degradation. However, total oil and
TPH degradation was dependent on N and P fertilization under continuously-flooded
conditions. Maximum enhancement of oil degradation for continuously-flooded
mesocosms occurred when the mesocosms were supplemented with NH4+ and P,
although N and P fertilization may not be necessary when oil is associated with
sediments (Wright and Weaver, 2004).
1.7.2.3. Field Studies
Most field studies have indicated that bioaugmentation is not very effective in
enhancing oil biodegradation in marine shorelines, and nutrient addition or
biostimulation alone had a greater effect on oil biodegradation than the microbial
seeding. Nonetheless, there are some field trials that have demonstrated the
effectiveness of commercial bioaugmentation products in enhancing oil
biodegradation. Alpha BioSea
(Alpha Environmental, Houston, Tex.) was used to
treat the Angolan Palanca crude oil spilled from Mega Borg off Texas coast (Mauro
and Wynne, 1990) and the catalytic feedstock oil spilled from Apex Barge in the
Pelican Island and Marrow Marsh in Texas (Swannell et al., 1996). Terra-Zyme
(Oppenheimer Biotechnology) was used in enhancing biodegradation of heavy oil
spilled from Nakhodka in Japan in a period of eight weeks (Tsutsumi et al., 2000).
Although in these studies it is claimed that bioaugmentation success was supported by
either visual observation (i.e., the Mega Borg study and Apex Borg study) or digital
photographic image analysis (i.e., the Nakhodka study), there is no concrete evidence
to demonstrate that natural biodegradation rates of the oil were enhanced or that
bioaugmentation was responsible for the disappearance of the oil.
On the other hand, Venosa et al., 1992 based on a previous laboratory (Venosa et al.,
1991) study evaluating the effectiveness of 10 commercial products in stimulating
enhanced biodegradation of Alaska North Slope crude oil, chose two of the products
that provided significantly greater alkane degradation in closed flasks than indigenous
Alaskan bacterial populations supplied only with excess nutrients. These two
products, which were microbial in nature, were then taken to a Prince William Sound
beach to determine if similar enhancements were achievable in the field. A
randomized complete block experiment was designed in which four small plots
consisting of a no-nutrient control, a mineral nutrient plot, and two plots receiving
mineral nutrients plus the two products were laid out in random order on a beach in

Chapter 1 Introduction
26
Prince William Sound that had been contaminated 16 months earlier from the Exxon
Valdez spill. The results indicated no significant differences (P < 0.05) among the
four treatments in the 27-day time period of the experiment. A statistical power
analysis, however, revealed that the variability in the data prevented a firm conclusion
in this regard. Failure to detect significant differences was attributed not only to
variability in the data but also to the highly weathered nature of the oil and the lack of
dissolved oxygen and sufficient time for biodegradation to take place (Venosa et al.,
1992).
Several studies (Lee and Levy, 1987; Venosa et al., 1992; Wright and Weaver, 2004)
have noted the advantage of natural bacterial communities over allochthonous
microbial inocula.
Rosenberg et al., 1992 after optimizing conditions in the laboratory for the use of F-1
and the selected bacteria for degrading crude oil, a field trial was performed on an oil
contaminated sandy beach between Haifa and Acre, Israel, in the summer of 1992.
The sand was treated with 5 g F-1 per kg sand and inoculated with the selected
bacteria; the plot was watered with sea water and plowed daily. After 28 days the
average hydrocarbon content of the sand decreased from 5.1 mg/g sand to 0.6 mg/g
sand. Overall, there was an approx. 86% degradation of pentane extractables as
demonstrated by dry weight, I.R. and GLC analyses. An untreated control plot
showed only a 15% decrease in hydrocarbons. During the winter of 1992, the entire
beach (approx. 200 tons of crude oil) was cleaned using the F-1 bacteria technology.
The rate of degradation was 0.06 mg/g day (10 °C) compared to 0.13 mg/g day during
the summer (25 °C) (Rosenberg et al., 1992). However, conclusions were confounded
by the lack of adequate controls in the study (Swannell et al., 1996).
Accordingly Lee at al., 1997 concluded that in both shaker-flask and mesocosm-scale
experiments, a commercial oleophilic bioremediation agent containing biostimulation
(nutrients) and bioaugmentation (bacterial inocula) properties was more effective in
enhancing oil biodegradation rates than that of no treatment and/or periodic inorganic
nutrient addition. However, similar results were not obtained from a subsequent 129-
day field trial conducted in a sand beach environment. In this case, periodic additions
of inorganic nutrients, with and without the commercial bioremediation agent PRP
(Petrol Rem, Incorporated, Pittsburgh, Pennsylvania), enhanced the number of
heterotrophic bacteria and microbial respiration rates within the oiled sediments. The
commercial product appeared to elevate the number of oil-degrading bacteria within
the oiled sediment between days 17 and 89. However, the addition of inorganic
nutrients alone, on a periodic basis, was the most effective means of enhancing the
extent of oil biodegradation within the residual oil and of reducing sediment toxicity.
By retaining residual oil and altering the physical and chemical characteristics of the
treated sediment, the oleophilic product suppressed both the rate and extent of oil loss
by tidal activity and biodegradation. This is not to say that the use of the product was
ineffective in protecting the environment or was detrimental to it; the product does
enhance natural biodegradation rates, and it limits the transport of beached oil to more
sensitive areas (Lee at al., 1997).
In a similar way Simon et al., 1996, 2004 evaluated the performance of two
commercial bioaugmentation products used to enhance petroleum bioremediation in a
wetland. A 152-day experiment was conducted at a research facility on the San
Jacinto River near Houston, TX, USA, using a controlled oil application to reduce
heterogeneity normally associated with spilled petroleum. Additional treatments
included inorganic nutrients and an oiled control (intrinsic). The biodegradation rates
obtained for the bioaugmentation treatments did not show any significant differences

Chapter 1 Introduction
27
as compared to the oiled control, although the products demonstrated enhanced
performance in the laboratory flask experiment (Aldrett et al., 1997). Overall, none of
the bioremediation treatments appeared to benefit the wetland recovery in these
environmental conditions (Simon et al., 2004).
Fernandez-Alvarez et al., 2006 also conducted a field study to assess the efficiency of
several bioremediation products in accelerating the in situ biodegradation of the
Prestige heavy fuel oil spill. Trials of bioremediation were conducted in sand, rocks
and granite tiles on the beach of Sorrizo (A Coruna, NW Spain) with a water-soluble
commercial fertilizer (Nitrophoska® Suprem), two commercial bioaugmentation
products B350 and L1800 (Bio-Systems Co., USA) and an autochtonous microbial
culture obtained by enrichment of fuel-degrading populations from the beach of
Corrubedo (A Coruna, NW Spain) that was polluted by the spill. In contrast to
Jimenez et al., 2006 neither the added microorganisms nor the nutrients significantly
enhanced the degradation rate of the fuel oil in rocks, granite tiles or sand. Eighteen
months after the spill, the rocks of the beach were still coated by a black layer of
weathered fuel oil. For this reason an oleophilic product, sunflower biodiesel was
tested on a rock. The application of biodiesel accelerated the gradual clean-up of the
polluted surface and could also accelerate the degradation of the residual oil
(Fernandez-Alvarez et al., 2006).
In summary, bioaugmentation may be effective in bench-scale studies where
environmental conditions are well controlled, but this will not guarantee its
effectiveness in the field.
1.7.3. Bioaugmentation or Biostimulation?
From all the above we see that even though the addition of microorganisms may be
able to enhance oil biodegradation in the laboratory, the effectiveness of
bioaugmentation has not been convincingly demonstrated in the field. Most of the
field studies indicated that bioaugmentation is not effective in enhancing significantly
oil biodegradation in most environments. Generally, it appears that in most
environments, indigenous oil-degrading microorganisms can carry out oil the
biodegradation if the prevailing environmental conditions do not limit them. Case
studies conducted by vendors and research teams still support bioaugmentation
potential as a remediation strategy to combat oil spills. The bioaugmentation
treatment has been regarded as a promising technology, but is still in the experimental
stage (El Fantroussi and Agathos 2005).
Studies comparing the relative performance of bioaugmentation and biostimulation
suggest that nutrient addition alone had a greater effect on oil biodegradation than the
addition of microbial products (Lee et al., 1997; Venosa et al., 1996) as the survival
and degrading ability of microbes introduced to a contaminated site are highly
dependent on environmental conditions (Gentry et al., 2004; Pritchard, 1992; Vogel,
1996). Microbial populations grown on rich media under laboratory conditions are
stressed when exposed to field conditions where nutrient concentrations are
substantially lower.
There are several studies (Lee and Levy, 1987; Venosa et al., 1992; Xia et al., 2006)
that have reported the advantage of natural bacterial communities over allochthonous
microbial inocula.
The growth of exogenous microorganisms used for bioaugmentation within a
contaminated site is affected by biotic and abiotic factors. The factors responsible for

Chapter 1 Introduction
28
the failure of inocula in degrading contaminants in nature were summarized by
Goldstein et al., 1985, Pritchard et al., 1992, Vogel, 1996 and van Veen et al., 1997.
Abiotic factors include: (1) low contaminant concentration not capable to support the
growth of the inoculated species, (2) the environmental conditions that play a pivotal
role in determining biological activity, such as temperature, humidity and ionic
strength that reduce the microbial activity and clay and organic-matter content that
restrict the mass transfer (mainly by diffusion in sediments, the seeded
microorganisms may be unable to move through the pores of the sediment to the
contaminants),and mainly the physical removal rate caused by scouring of biomass
when breaking waves tumble sand grains, (3) the biodegradability of the pollutants,
which is related to chemical structure and its related physico-chemical characteristics,
(4) the growth of the inoculated species may be limited by predation (e.g.,by
protozoa) or competition and (5) the inoculated microorganisms may use other
available substrates instead of the targeted contaminants.
There is increasing evidence that the best way to overcome the above barriers is to use
microorganisms from the polluted area. Ueno et al., 2007 have proposed
autochthonous bioaugmentation (ABA) defined as the bioaugmentation technology
that uses exclusively microorganisms indigenous to the sites (soil, sand, and water) to
be decontaminated. Isolated single strains or enriched cultures, which are obtained
‘‘before’’ or ‘‘after’’ the contamination of the target sites, are administered to the sites
once contamination occurs. The key idea is to conduct the enrichment of contaminant-
degrading bacteria under the same or very similar conditions to those where
bioaugmentation will be performed. ABA as defined in this study uses indigenous
microbial consortia or isolates that are highly enriched and much better adapted to the
historically or artificially contaminated environments (Hosokawa et al., 2009).
The application of ABA in the coastal areas of Hokkaido Prefecture, Japan, was
considered by Hosokawa et al., 2009, as Hokkaido is located south of Sakhalin Island,
Russia, where development of oil fields is in progress. If oil spills in this region were
well characterized in advance, ABA could be a feasible technology in the near future.
Crude oil-degrading microbial consortia collected from the seashores of Abashiri,
Hokkaido, were enriched using liquid and sea sand-containing solid media
supplemented with MSM and crude oil. When no-sterilized sand from the same place
was inoculated with two types of microbial consortia, degradation of crude oil was
greater in the consortium prepared by cultivation in sand (consortium 2) than in that
prepared by liquid cultivation (consortium 1). The extent of degradation of crude oil
by consortium 1 was almost the same as that by biostimulation. These results
suggested that the proliferation of bacteria indigenous to sea sand is highly dependent
on their environment (Hosokawa et al., 2009).
Although, the ABA technique is not a new concept as it has been described above,
only a limited number of reports have been published on ABA (Vinas et al., 2002;
Zrafi-Nouira et al., 2009) compared to other types of bioaugmentation treatments.
This is probably because the practical benefits of this method (ABA) have not been
recognized according to Hosokawa et al., 2009.
The question that still arises is bioaugmentation or biostimulation? The answer is not
unique. The appropriate strategy is shown in Figure 1 and depends highly on the
particular environmental conditions (background nutrients concentration, type of
pollutant, indigenous population, etc.). For example, if nutrients are limiting, the rate
of oil biodegradation will be less than optimal even if there are many oil-degraders
present (case II). In this case, supply of nutrients will enhance bioremediation rates,
whereas bioaugmentation is not expected to have a significant effect except only short
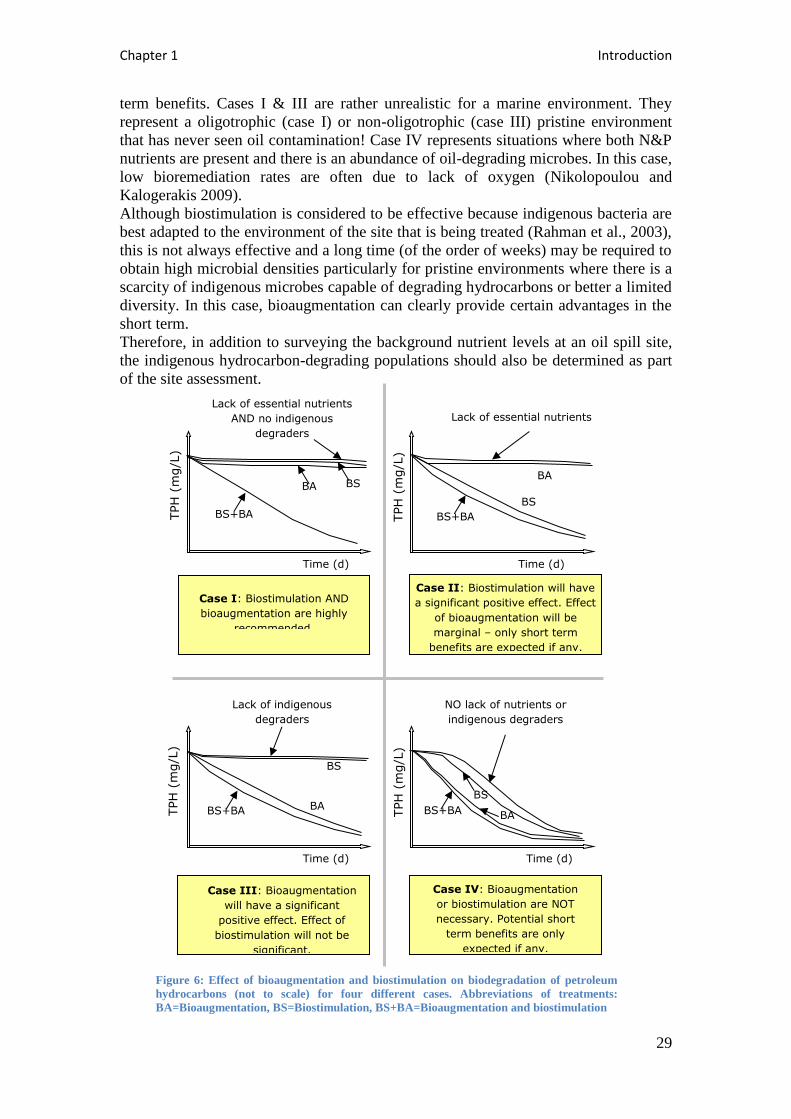
Chapter 1 Introduction
29
term benefits. Cases I & III are rather unrealistic for a marine environment. They
represent a oligotrophic (case I) or non-oligotrophic (case III) pristine environment
that has never seen oil contamination! Case IV represents situations where both N&P
nutrients are present and there is an abundance of oil-degrading microbes. In this case,
low bioremediation rates are often due to lack of oxygen (Nikolopoulou and
Kalogerakis 2009).
Although biostimulation is considered to be effective because indigenous bacteria are
best adapted to the environment of the site that is being treated (Rahman et al., 2003),
this is not always effective and a long time (of the order of weeks) may be required to
obtain high microbial densities particularly for pristine environments where there is a
scarcity of indigenous microbes capable of degrading hydrocarbons or better a limited
diversity. In this case, bioaugmentation can clearly provide certain advantages in the
short term.
Therefore, in addition to surveying the background nutrient levels at an oil spill site,
the indigenous hydrocarbon-degrading populations should also be determined as part
of the site assessment.
Time (d)
Time (d) Time (d)
Time (d)
Lack of essential nutrients
AND no indigenous
degraders
BA
BA BA
BA
BS
BS
BS
BS
BS+BA BS+BA
BS+BA BS+BA
Lack of essential nutrients
Lack of indigenous
degraders
NO lack of nutrients or
indigenous degraders
Case I: Biostimulation AND
bioaugmentation are highly
recommended.
Case III: Bioaugmentation
will have a significant
positive effect. Effect of
biostimulation will not be
significant.
Case II: Biostimulation will have
a significant positive effect. Effect
of bioaugmentation will be
marginal – only short term
benefits are expected if any.
Case IV: Bioaugmentation
or biostimulation are NOT
necessary. Potential short
term benefits are only
expected if any.
TPH
(m
g/L
)
TPH
(m
g/L
) TPH
(m
g/L
)
TPH
(m
g/L
)
Figure 6: Effect of bioaugmentation and biostimulation on biodegradation of petroleum
hydrocarbons (not to scale) for four different cases. Abbreviations of treatments:
BA=Bioaugmentation, BS=Biostimulation, BS+BA=Bioaugmentation and biostimulation
Chapter 1 Introduction
30
Based on the above, it becomes rather obvious that a robust bioremediation strategy
should provide suitable stimulation for long term performance and augmentation with
oil-degrading consortia for short term benefits. Furthermore, if the augmentation is
performed using indigenous populations over allochthonous ones, the
bioaugmentation effects will be much more pronounced.
1.8. Contribution of this PhD
As long as society keeps on relying on petroleum hydrocarbons to cover its energy
needs, despite the stricter environmental regulations that have been adopted by most
countries, oil spills will remain a serious hazard to marine ecosystems. Furthermore
Mediterranean Sea sensitivity, importance and especially of the Greek coastline and
sea that are popular touristic destinations and shelter of many marine species makes it
crucial to act and remediate the marine environment in the threat of oil spills.
Accordingly seeking new, alternative, natural methods that could speed up cleaning
process with minimum environmental impact could become priority.
In this manner the specific aims of the present work were to investigate possible
methods to enhance the rate of biodegradation of oil in a contaminated marine
environment (both seawater and shoreline), which could be incorporated in a general
contingency plan. Hence we investigated the capability of either acclimated
indigenous microbial consortium or enriched consortia from seawater samples taken
from Hellenic Petroleum Refinery (Athens, Greece) a site exposed to chronic
pollution with crude oil (ABA) in the presence or not of other rate limiting factors like
nutrients and biosurfactants (biostimulation) as a potential strategy for the successful
remediation of polluted marine environments. In addition the effectiveness of these
certain acclimated consortia (ABA) was compared to indigenous population activity
(biostimulation) on the bioremediation of oil spills.
Specifically the effects of the oleophilic nutrients (uric acid and lecithin) and
inorganic nutrients (KNO3, K2HPO4) with or without biosurfactants on the
degradation of crude oil hydrocarbons in both seawater and sand matrix were also
examined.
Thus the outcome approaches included 4 sets of experiments:
1. Autochthonous bioaugmentation and/or biostimulation of seawater microcosm
(i.e. Seawater 1)
2. Autochthonous bioaugmentation & biostimulation with isolated hydrocarbon
degraders consortium of seawater microcosm (i.e. Seawater 2)
3. Landfarming of oil polluted beach sand through biostimulation (i.e. Sand 1)
4. Landfarming of oil polluted beach sand through autochthonous
bioaugmentation & biostimulation (i.e. Sand 2)
The method which has been used for the evaluation of these bioremediation methods
is based on a modified bioremediation agent effectiveness testing protocol by EPA
(40 CFR Ch. I, Pt 300, App. C, 2003). This protocol was designed to determine a
product’s ability to biodegrade oil by quantifying changes in the oil composition
resulting from biodegradation. The protocol tests for microbial activity by Most
Probable Number (MPN) determination and quantifies the disappearance of saturated
hydrocarbons and polynuclear aromatic hydrocarbons (PAHs) by GC-MS analysis.
Moreover whether the disappearance extent (degradation rate) of certain compounds
from both saturated fraction (n-alkanes) and aromatic fraction (PAHs) is due to
biomass increase or due to specific degradation rate increase which implies a different

Chapter 1 Introduction
31
metabolic pathway was also investigated through biodegradation kinetics analysis
(Batch reactor). The degradation kinetics of representative compounds from n-alkanes
group and PAHs group were investigated, namely C15, C20, C25, C30, Pristane,
Phytane, Fluorene, Dibenzothiothene, Phenanthrene and Chrysene. The average
specific degradation rate qs of any particular compound (S) can be obtained by Least
Squares Estimation as the slope in linear plot of St versus the integral I(t)=∫X(t)dt
where X(t) is the biomass concentration at time t.
Furthermore identification of the key organisms that play roles in pollutant
biodegradation is important for understanding, evaluating and developing in situ
bioremediation strategies. For this reason, one of the tasks was to characterize
bacterial communities, to identify responsible degraders, and to elucidate the catalytic
potential of these degraders under different bioremediation methods. In the above
experimental sets besides microbial activity and oil chemical analysis, molecular
analysis (PCR, RT-PCR, pyrotag sequencing) of DNA extracts to identify community
response and composition changes through different amendments was also performed.
Early studies on hydrocarbon biodegradation led to the observation that hydrocarbon
degrading bacteria have a high affinity to oil droplets. Oil bioremediation is a
complex process that involves interactions between oil and microorganisms under
certain environmental conditions. Therefore in this study a 5th
set of experiments
investigating and characterizing the interaction of hydrocarbon degraders consortia on
oil and eicosane droplets (cellular level) by means of confocal laser scanning
microscopy (CLSM) was also included. Moreover their response after the addition of
certain commercial dispersants just like those that have been or could be used in the
event of a real oil spill (Corexit, S200, Marichem) but also of more environmentally
friendly biosurfactants (Rhamnolipids) was also examined. Investigation of these
interactions that take place between marine bacteria and oil hydrocarbons could
improve our understanding on the fate of hydrocarbons in the environment and thus
help to develop the most suitable bioremediation strategy.

Chapter 1 Introduction
32

Chapter 2- Materials and Methods

34

Chapter 2 Materials and Methods
35
2. Materials and Methods
For the evaluation of the bioremediation agents used, laboratory and field tests can be
conducted. In this study we have run some laboratory tests in a microcosm scale
according to a modified EPA bioremediation agent effectiveness test protocol.
The method which has been used for the evaluation of these bioremediation agents is
based on a modified bioremediation agent effectiveness testing protocol by EPA (40
CFR Ch. I, Pt 300, App. C, 2003). This protocol was designed to determine a
product’s ability to biodegrade oil by quantifying changes in the oil composition
resulting from biodegradation. The protocol tests for microbial activity by Most
Probable Number (MPN) determination and quantifies the disappearance of saturated
hydrocarbons and polynuclear aromatic hydrocarbons (PAHs) by GC-MS analysis.
In some experimental sets besides microbial activity and oil chemical analysis,
molecular analysis of DNA extracts to identify community response and composition
changes through different amendments was also performed.
2.1. Determing Soil Characteristics
2.1.1. Water Holding Capacity
The water-holding capacity of the soil was determined by placing duplicate 20 g field-
moist soil samples in funnels fitted with folded Whatman 2V filter paper on the inside
and mounted on preweighed 250 ml flasks as described by Forster, 1995. Percentage
water-holding capacity was calculated with the following formula:
( )
, (1)
where Wp is the weight of the percolated water in grams, Wi is the initial amount of
water in grams contained in the sample, and dwt is the soil dry weight in grams
(Forster, 1995).
The soil was classified as sandy and its estimated water-holding capacity for the soil
was 33.73%. Too much water in the soil will hinder the supply of oxygen and as a
result will decrease the rate of biodegradation. On the other hand, too little water will
inhibit microbial activities. The optimal soil moisture range for supporting the
microbes is between 30 and 60% of the field capacity and as was estimated the
optimal soil moisture content should be between 10.12% and 20.24%.
2.1.2. Soil Gravimetric Water Content and Soil Dry Mass
Water content in sand samples was determined gravimetrically after desiccation at
105°C overnight. The differences in masses before and after drying are a measure for
the water content of soils. The water content is calculated on gravimetric (g water/g
soil) or on volumetric basis (cm3 water/cm
3 soil) (Wilke, 2005).
The dry mass content (wdm) or water content (wH2O) on a dry mass basis expressed as
percentages by mass to an accuracy of 0.1% (m/m) are calculated using the following
equations:
(2),
(3), where:

Chapter 2 Materials and Methods
36
m0= mass of the empty container (g)
m1 =mass of the container with field-moist soil (g)
m2= mass of the container plus oven-dried soil (g)
2.2. Crude oil weathering
Two types of crude oils were used (A: Uralsk -light B: light from Iran, both
compliments of Hellenic Petroleum Co., Aspropyrgos, Greece) Crude oil is artificially
weathered (<C15) by heating to 200°C according to ASTM D86 (Standard Test
Method for Distillation of Petroleum Products), which covers the atmospheric
distillation of petroleum products using a laboratory batch distillation unit.
The unweathered Iranian light crude oil had a gravity of: 0.8232 g/cm3 and SG
(specific gravity): 0.8247 g/cm3 at RT. The weathered Iranian light crude oil had a
gravity of: 0.8886g/cm3 and SG (specific gravity): 0.8902 g/cm
3 at RT
2.3. Sand preparation and spiking with crude oil
Sand for the landfarming experiments was collected from Agios Onoufrios beach
(Chania), screened to remove particulates greater than 2 mm in size and was spiked
with weathered crude oil at 5 g per 1000 g of sand (dry weight equivalent) that was
dispersed in 1 L of pentane/DCM (1:20) solution. The soil was then further
homogenized. The solvents were allowed to evaporate from the soil by placing the
container of spiked soil in a fume hood, thus leaving behind the fuel oil in the sand at
a theoretical initial TPH concentration of approximately 5,000 mg/kg of sand after
equilibration.
In all treatments, the water content was adjusted to 60% of the field-holding capacity.
This moisture content has been used in several studies and lies within the interval
recommended by Dibble and Bartha, 1979.
2.4. Types of Amendments
2.4.1. Nutrients
Two types of nutrients have been used and compared: inorganic and lipophilic.
Advantages and disadvantages for both types have been described in detail in the
Introduction section. In addition the effect of a biosurfactant was also tested.
• Source of nitrogen:
Inorganic form: potassium nitrate (KNO3- Sigma-Aldrich Co), which is water soluble
and basic ingredient of many fertilizers.
Lipophilic form: uric acid (Sigma-Aldrich Co) that is cost effective natural origin
waste product of birds etc., it has low solubility in water (it isn’t readily washed out)
binds to crude oil and is therefore available for bacteria which grow at the
hydrocarbon-water interface
• Source of phosphorous:
Inorganic form: dipotassium phosphate (K2HPO4- Sigma-Aldrich Co) that is water
soluble and basic ingredient of many fertilizers.
Lipophilic form: lecithin (L-a-Phosphatidylcholine (L-a-Lecithin) derived from
soybean, Type II-S, with a purity of about 19% was supplied by Sigma-Aldrich Co)
Chapter 2 Materials and Methods
37
that is a natural phospholipid in fact oil soluble, easy to get at low cost as by-product
of oil seeds industry and has good dispersant properties (serves as a biosurfactant).
Nutrients were added to such amount that resulted in a final concentration equivalent
to a C:N:P molar ratio of 100:10:1.
2.4.2. Rhamnolipids as Biosurfactant
The biosurfactant JBR210 of microbial origin (rhamnolipid) was a blend of C26H48O9
and C32H58O13. It was composed of 10% active ingredient, supplied by Jeneil
Biosurfactants Co., USA. The biosurfactant is readily biodegradable and has a very
low environmental impact, low toxicity and low skin irritation with excellent wetting
and emulsification properties. Rhamnolipids are glycosides of rhamnose (6-
deoxymannose) and β-hydroxydecanoic acid.
2.4.3. Dispersants
Corexit, a 2nd
generation dispersant approved as Type I, was kindly offered by
CHEMO SA (Skaramagas, Piraeus, Greece)
S200 was used at the Prestige oil spill accident in Spain and was kindly offered by
IEP EUROPE, S. L. Co. (Madrid-Spain).
Marichem, a 3rd
generation dispersant approved as Type II&III dispersant, was kindly
offered by EPE S.A. (Piraeus, Greece).
2.4.4. Isolated Consortia
Consortia Eb8 and E4 which have been used in this study have been obtained from
successive enrichments and isolations in ONR7 medium with crude oil as the sole
hydrocarbon source of seawater samples taken on April 6th, 2011 from the Elefsina
Refinery (Hellenic Petroleum), a site exposed to chronic oil pollution in Elefsina gulf
near Athens, Greece. This work has been conducted under the FP-7 project ULIXES.
2.5. Culture Media
ONR7 Medium
ONR7 medium, an artificial seawater mineral salts medium, was used for enrichment
cultures and isolation of HDB (Dyksterhouse et al., 1995). ONR7 contains (per liter of
deionized water) 22.79 g of NaCl, 11.18 g of MgCl2⋅6H2O, 3.98 g of Na2SO4, 1.46 g
of CaC12⋅2H2O, 1.3 g of TAPSO {3-[N-tris(hydroxymethyl) methylamino]-2-
hydroxypropanesulfonic acid}, 0.72 g of KCl, 0.27 g of NH4Cl, 89 mg of
Na2HPO4⋅7H2O, 83 mg of NaBr, 31 mg of NaHCO3, 27 mg of H3BO3, 24 mg of
SrCl2⋅6H2O, 2.6 mg of NaF, and 2.0 mg of FeCl2⋅4H2O.
Bushnell Haas Medium (BHM)
The medium, used to prepare the dilutions for the dilution series to perform the most
probable number (MPN) and plate count determination, was prepared by suspending
3.27 g of Bushnell Haas Broth (HiMedia) in 1000 mL deionized H2O.
Marine Agar
ZoBell Marine Agar 2216 (HiMedia) has been used for the CFUs determination of
marine heterotrophs by plate count.

Chapter 2 Materials and Methods
38
2.6. Microbiological Analyses
2.6.1. Plate Counts
Enumeration of total marine heterotrophs was undertaken by spreading aliquots of
100 μL in pre estimated dilutions, taken from the MPN determination, on ZoBell
Marine Agar 2216 (HiMedia). Plates were incubated aerobically at 20oC for 48 h.
2.6.2. MPN Procedure
Hydrocarbon degraders in the flasks were estimated by the most probable number
(MPN) method according to Wrenn and Venosa, 1996. The growth medium was a
Bushnell-Hass minimal salts medium (BHS) supplemented with crude oil as the
hydrocarbon substrate. The MPN plates were 96-well microtiter tissue culture plates,
with each well containing 180 μl BHS, 5 μL crude oil and 20 μL of the appropriate
dilution of sample. For seawater microcosms one milliliter from each microcosm was
diluted in a 9 mL Bushnell-Hass solution (pH 7). While for landfarming microcosms
an initial 1:10 (w/v) dilution was prepared for each sand sample before setting up the
microbial assays. This was done to assure that the sediment-associated microbes were
as evenly distributed as possible for all assays. Ten grams of wet sand was added to
90 mL of marine BH medium. The initial dilution bottles were shaken for 30 min at
200 rpm. Once the soil particles settled down, one milliliter from each supernatant
was diluted in a 9 mL Bushnell-Hass solution (pH 7).
Then for both type of matrices samples (seawater and sand) the procedure was
comprised by tenfold serial dilutions that were carried out to 10-10
and the plates were
inoculated by adding 20 μL of each dilution to one of the 12 rows of eight wells. The
inoculated plates were incubated at 20 oC for 2 weeks. At the end of the incubation
period, 50 μL of p-iodonitrotetrazolium violet dye (INT 3 g/L) was added to each well
of the tissue culture plates and allowed to stand at room temperature for 1 hour. The
dye turns from colorless to red (when reduced) in the presence of actively respiring
microorganisms. The MPNs were calculated using “MPN Calculator” software
program by Albert J. Klee, 1993 of the EPA Risk Reduction Engineering Laboratory.
2.7. Chemical Analysis
2.7.1. Reagents, materials and standards
Trace analysis (SupraSolv) dichloromethane (CH2Cl2) and n-hexane (C6H14) were
obtained from Merck (Darmstadt, Germany). Solid-phase cartridges of
silica/cyanopropyl (SiO2/C3–CN, 1.0/0.5 g, 6 ml) were obtained from Interchim (Best
Buy Analytical, Greece) and solid phase extraction cartridges “Varian Bond Elut
TPH” were obtained from Agilent technologies.
The standard hydrocarbon mix (100 ppm in hexane/DCM, 9:1) for the calibration
curve that contained aliphatic hydrocarbons (n-C10- n-C35, pristane, phytane) and
polycyclic aromatic hydrocarbons (PAHs) (naphthalene, phenanthrene, anthracene,
fluorene, dibenzothiophene, fluoranthene, pyrene, chrysene, benzo(b)fluoranthene,
benzo(k)fluoranthene, benzo(e)pyrene, benzo(a)pyrene, perylene,
indeno(g,h,i)pyrene, dibenzo(a,h)anthracene, benzo(1,2,3-cd)perylene) was obtained
from Absolute Standards Inc. The semivolatile internal standard mix contained 7
deuterated compounds: d8-naphthalene, d12-chrysene, d12-perylene, d10-acenaphthene,
d10-phenanthrene and d4-1,4-dichlorobenzene (2000 ppm in DCM) was obtained from
Supelco Co. The surrogate standards (d10-anthracene and 5α-androstane 2000 ppm
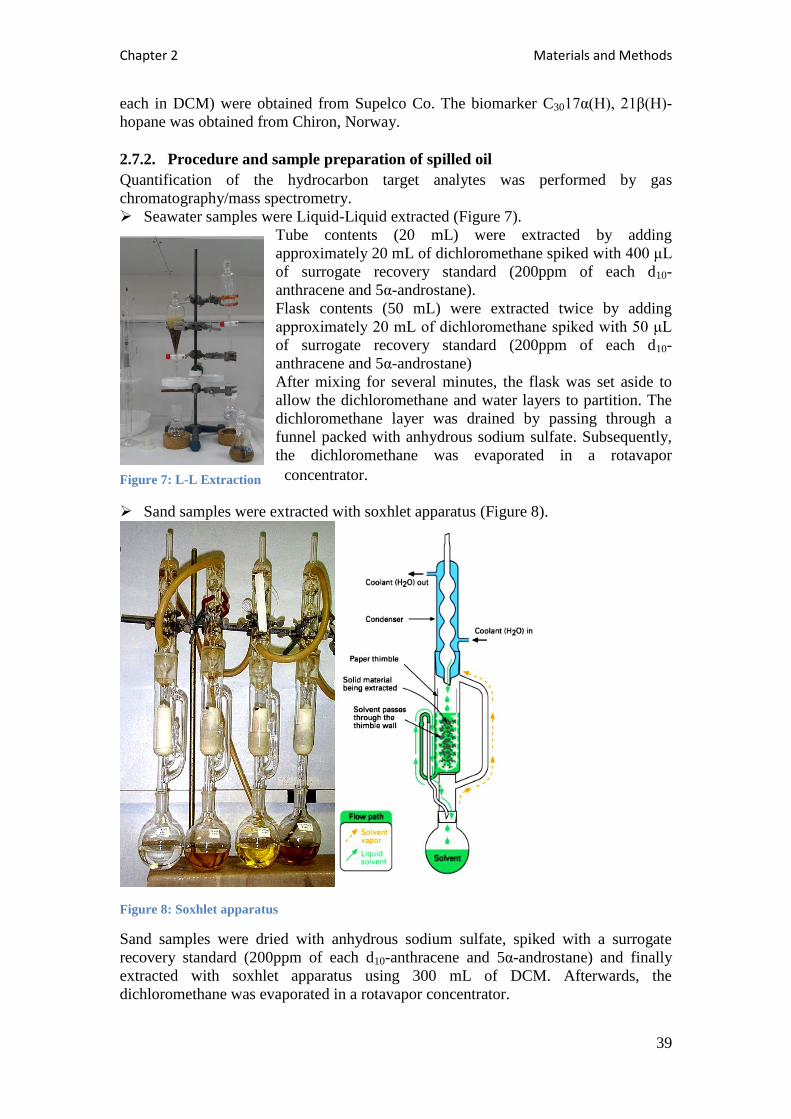
Chapter 2 Materials and Methods
39
each in DCM) were obtained from Supelco Co. The biomarker C3017α(H), 21β(H)-
hopane was obtained from Chiron, Norway.
2.7.2. Procedure and sample preparation of spilled oil
Quantification of the hydrocarbon target analytes was performed by gas
chromatography/mass spectrometry.
Seawater samples were Liquid-Liquid extracted (Figure 7).
Tube contents (20 mL) were extracted by adding
approximately 20 mL of dichloromethane spiked with 400 μL
of surrogate recovery standard (200ppm of each d10-
anthracene and 5α-androstane).
Flask contents (50 mL) were extracted twice by adding
approximately 20 mL of dichloromethane spiked with 50 μL
of surrogate recovery standard (200ppm of each d10-
anthracene and 5α-androstane)
After mixing for several minutes, the flask was set aside to
allow the dichloromethane and water layers to partition. The
dichloromethane layer was drained by passing through a
funnel packed with anhydrous sodium sulfate. Subsequently,
the dichloromethane was evaporated in a rotavapor
concentrator.
Sand samples were extracted with soxhlet apparatus (Figure 8).
Figure 8: Soxhlet apparatus
Sand samples were dried with anhydrous sodium sulfate, spiked with a surrogate
recovery standard (200ppm of each d10-anthracene and 5α-androstane) and finally
extracted with soxhlet apparatus using 300 mL of DCM. Afterwards, the
dichloromethane was evaporated in a rotavapor concentrator.
Figure 7: L-L Extraction

Chapter 2 Materials and Methods
40
Figure 9: Solid Phase Extraction apparatus used for the fractionation of oil samples.
Recovered oil from experimental set of Seawater 1 and Sand 1 was fractionated using
Solid Phase Extraction cartridges as described by Alzaga et al., 2004. According to
this method a known weight of 5-10 mg of the dried oil was dissolved in n-hexane
and was transferred onto the SiO2/C3–CN SPE cartridge and eluted, under a positive
pressure, with 4ml of n-C6 (FI- aliphatics) and 5ml of n-C6– DCM (1:1) (FII-
aromatics). Prior to sample loading, before the SPE fractionation, cartridges were
conditioned with 4.0 ml of hexane. The two fractions were blown down to dryness
with nitrogen. The weight of FI- aliphatics and FII- aromatics was recorded and
redesolved in 1 mL n-C6 and 1 mL n-C6– DCM (1:1) respectively for use on the
autosampler of the GC/MS instrument.
Recovered oil from experimental set 2 and 4 was fractionated with 4mL of n-C6 (FI-
aliphatics) and 4mL of DCM (FII- aromatics) using Solid Phase Extraction cartridges
“Varian Bond Elut TPH” as suggested by Agilent technologies. The two fractions
were dried with nitrogen flow. The weight of FI- aliphatics and FII- aromatics was
recorded, redissolved in 1 mL n-C6 and 1 mL DCM respectively and samples were
ready to be putted on the autosampler of GC-MS for analysis.
The final concentration of the internal standards added in each fraction right before
the injection is 1 ppm. This solution contained 4 deuterated compounds: d8-
naphthalene, d10-phenanthrene, d12-chrysene and d12-perylene.For quantitative
analyses, an Agilent HP 7890/5975C GC-MS system with an Agilent HP-5 5%
phenyl methyl siloxane column (30m x 250μm x 0.25μm) was operated in Full scan
mode (range 50-500 m/z). The initial oven temperature was set at 60 °C, followed by
a temperature ramp of 6 °C/min up to 300 °C. The samples (1μL) were injected
through a split-splitless injector (pulsed-splitless mode, at 250 °C) by an Agilent
7693A Automatic Liquid Sampler. The transfer line, MS source and quadrupole
temperatures were set at 280 °C, 230 °C and 150 °C respectively.
External multilevel calibrations were carried out for both alkanes and PAHs
quantification ranging from 1 ppb to 20ppm. Major hydrocarbons in crude oil were
identified on the basis of their retention time and by comparing them with those of
analytical standards. The repeatability of the whole experimental procedure for each
experimental approach is given in the appendix, where in boxplot form the analytical
data for the saturated hydrocarbons determined from all the control experiments are
shown. For clarity the data are presented after subtraction of their average value. The
relative standard deviation (%RSD) of the saturated fraction of n-alkanes and of the
aromatic fraction of selected compounds ranged from 0.9 to 13.5 for n=5 repetitive
analyses which is well below 25% which is the acceptable limit of each compound
analysed.
To help ensure that the observed decline in target analytes is caused by
biodegradation rather than by physical loss from mishandling or inefficient extraction,
it is necessary to normalize the concentrations of the target analytes via a "conserved
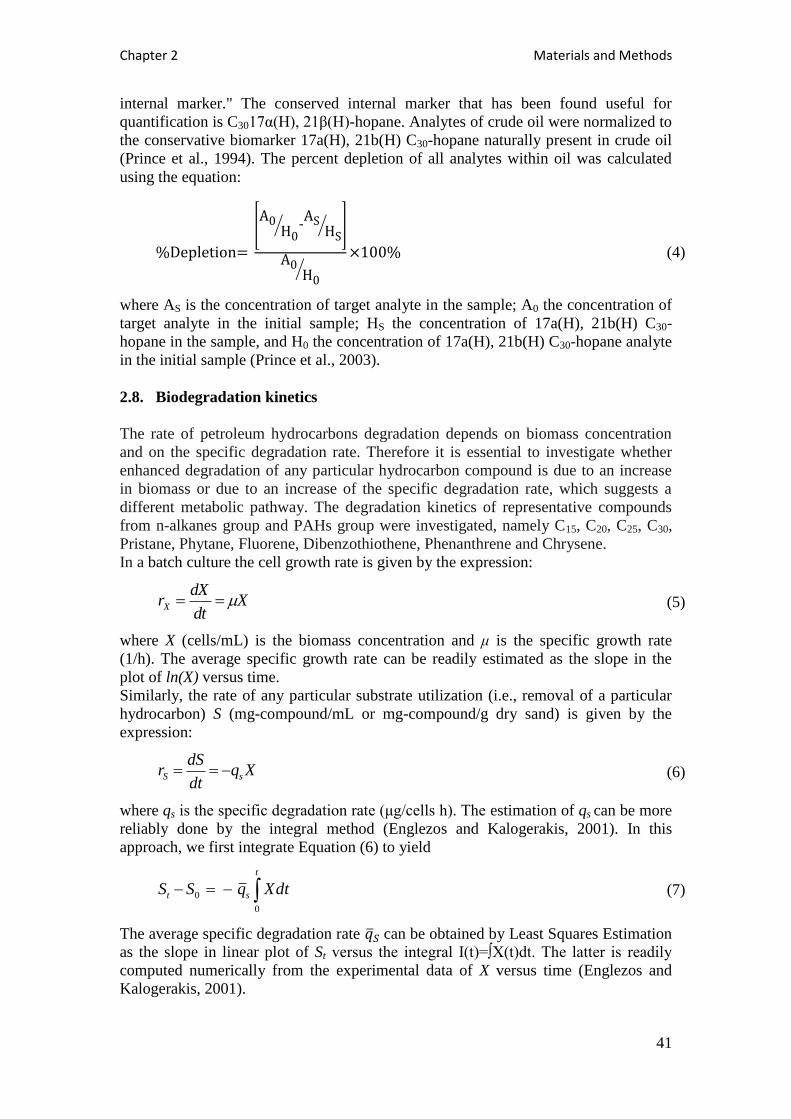
Chapter 2 Materials and Methods
41
internal marker." The conserved internal marker that has been found useful for
quantification is C3017α(H), 21β(H)-hopane. Analytes of crude oil were normalized to
the conservative biomarker 17a(H), 21b(H) C30-hopane naturally present in crude oil
(Prince et al., 1994). The percent depletion of all analytes within oil was calculated
using the equation:
[
⁄ -
⁄ ]
⁄
(4)
where AS is the concentration of target analyte in the sample; A0 the concentration of
target analyte in the initial sample; HS the concentration of 17a(H), 21b(H) C30-
hopane in the sample, and H0 the concentration of 17a(H), 21b(H) C30-hopane analyte
in the initial sample (Prince et al., 2003).
2.8. Biodegradation kinetics
The rate of petroleum hydrocarbons degradation depends on biomass concentration
and on the specific degradation rate. Therefore it is essential to investigate whether
enhanced degradation of any particular hydrocarbon compound is due to an increase
in biomass or due to an increase of the specific degradation rate, which suggests a
different metabolic pathway. The degradation kinetics of representative compounds
from n-alkanes group and PAHs group were investigated, namely C15, C20, C25, C30,
Pristane, Phytane, Fluorene, Dibenzothiothene, Phenanthrene and Chrysene.
In a batch culture the cell growth rate is given by the expression:
(5)
where X (cells/mL) is the biomass concentration and μ is the specific growth rate
(1/h). The average specific growth rate can be readily estimated as the slope in the
plot of ln(X) versus time.
Similarly, the rate of any particular substrate utilization (i.e., removal of a particular
hydrocarbon) S (mg-compound/mL or mg-compound/g dry sand) is given by the
expression:
(6)
where qs is the specific degradation rate (μg/cells h). The estimation of qs can be more
reliably done by the integral method (Englezos and Kalogerakis, 2001). In this
approach, we first integrate Equation (6) to yield
(7)
The average specific degradation rate can be obtained by Least Squares Estimation
as the slope in linear plot of St versus the integral I(t)=∫X(t)dt. The latter is readily
computed numerically from the experimental data of X versus time (Englezos and
Kalogerakis, 2001).
Xdt
dXrX
Xqdt
dSr sS
dtXqSS
t
st 0
0
Chapter 2 Materials and Methods
42
2.9. Molecular Analyses
Identification of the key organisms that play roles in pollutant biodegradation is
important for understanding, evaluating and developing in situ bioremediation
strategies. For this reason, one of the tasks was to characterize bacterial communities,
to identify responsible degraders, and to elucidate the catalytic potential of these
degraders under different bioremediation methods.
Molecular fingerprinting techniques were introduced in soil microbial ecology in the
past 15 years and allowed the study of the ecology of microorganisms which could
not be cultivated in synthetic media yet constitute the majority of soil microorganisms
(2). Denaturating gradient gel electrophoresis (DGGE) and terminal restriction
fragment length polymorphism (TRFLP) are two of the most popular fingerprinting
methods used in microbial ecology (3). DGGE and TRFLP alone or in combination
with cloning and sequencing have been used in different steps of bioaugmentation
strategies (Karpouzas and Singh, 2010).
The ecological role of strains and their impact on the endogenous microbial
community of the micro-ecosystems are investigated by fingerprinting PCR-based
methods. PCR-based microbial community analyses are widely used in microbial
ecology and, for most environments, they give a more realistic picture about
community structure than classical techniques based on cultivation. Over the past
decades, this technique has helped to identify, taxonomically, microorganisms that
have never been cultured. In environmental microbiology, a routine molecular
analysis starts with the thorough sampling of the material to be investigated (soil,
water, sediment, etc.). Subsequently, isolation and purification of nucleic acids is
followed by the corner-stone of the technique: a nucleic acid amplification step using
PCR, with primers binding to conserved regions of specific genes containing
phylogenetic or functional information. It is a Polymerase enzyme that drives a PCR.
A polymerase will synthesize a complementary sequence of bases to any single strand
of DNA providing it has a double stranded starting point. The template for the PCR
amplification is a mixture of homologous genes; therefore, the objective is to produce
adequate amounts of DNA from each taxon present in the sample from which specific
taxa can be distinguished qualitatively and quantitatively. The analysis of the
heterogeneous PCR products is carried out by cloning and sequence analysis or by
different fingerprinting techniques, such as denaturing gradient gel electrophoresis
(DGGE), single-strand conformation polymorphism (SSCP), or terminal restriction
fragment length polymorphism (T-RFLP) (Sipos et al., 2010).
Real-time PCR on the other hand monitors the progress of a PCR reaction based on
the detection and quantification of a fluorescent reporter molecule that binds to the
target PCR template. From the amount of fluorescence emitted at each cycle in the
exponential phase, it is possible to calculate the initial amount of target template.
Real-time PCR is highly sensitive, down to a detection limit of 1–2 genome copies, in
contrast to microarrays (see below), which may be 100- to 10,000-fold less sensitive
than PCR, a potential problem for sequences of poor abundance. Real-time PCR does
not require any tedious post- PCR steps for the quantification of amplicons, as their
amount is monitored in real time. Therefore, this is a high-throughput technique with
superior analytical sensitivity for the detection and quantification of specific genes in
environmental samples (Stenuit et al., 2009).

Chapter 2 Materials and Methods
43
Real-time PCR is now widely used for measuring 16S rRNA and functional gene
abundance and expression in the environment, including many studies of
hydrocarbon-degrading bacteria in which specific primers and probes have been
developed.
The dominant native microorganisms in the oil contaminated seawater and sand after
each treatment processes were determined via various molecular techniques such as:
Real Time PCR, polymerase chain reaction, pyrotag sequencing and nucleotide
sequence analysis.
2.9.1. Autochthonous Bioaugmentation and/or Biostimulation of Seawater
Microcosm (Seawater 1)
Since oil components have been proved to be biodegradable it is therefore of great
importance to understand the behavior of microbial populations responsible for the
degradation of crude oil. Thus two RT-PCR primer sets were used to detect a wide
range of genes encoding alkane hydroxylases, which are the key enzymes catalyzing
the first step of alkane degradation. Another set of RT-PCR was used to detect the
gene encoding the aromatic ring-hydroxylating dioxygenase which is the key enzyme
catalyzing the aromatic ring of PAHs (Table 6).
DNA extraction from seawater samples: DNA was extracted from 2 mL of the
seawater microcosms using QIAamp STOOL kit (Qiagen). Extracted DNA was
further purified by PureLink PCR Purification kit (Invitrogen).
RT-PCR analysis: Abundance of specific aerobic degradation genes in seawater
samples is tracked with Real-time PCR. Primers were based on the Alcanivorax
alkane hydroxylase (alkB2) gene, Thalassolituus alkane hydroxylase (alkB) gene and
Cycloclasticus aromatic ring-hydroxylating dioxygenase (phnA) gene. Standard
curves of targeted genes for RT-PCR were generated by stock solutions of total
extracted DNA from pure cultures of A. borkumensis, T.oleivorans, C. pugetti.
DNA standard curves for each gene were then created using dilution series ranging
from 5101 to 510
7 ng dna/μl. DNA isolated from the microcosm samples, together
with no-template controls (NTC) were used in RT-PCR amplifications in triplicate
with each target gene as standard. Reactions were performed on an ABI StepOnePlus
Sequence Detection System (Applied Biosystems) with initial denaturation for 5 min
at 95°C, followed by 40 cycles of 95°C for 15 s and 60°C for 1 min. Each 20 μl of
reaction contained 2 μl of template, 10 μl of 2 SYBR® Green PCR Master Mix
(Applied Biosystems) and 100 nM of each primer.

Chapter 2 Materials and Methods
44
Table 6: Primer sets used for group-specific amplification of alkB and phnA gene fragments
Target
genes
Primer Sequence (5’-3’) Product
(bp)
References
alkB2 ALCalkB2F867 CGCCGTGTGAATGACAAGGG
132 MacKew et
al., 2007 ALCalkB2R999 CGACGCTTGGCGTAAGCATG
alkB THALalkBF125 GACGTCGCCACACCTGCC 217
MacKew et
al., 2007 THALalkBR342 GGGCCATACAGAGCAAGCAA
phnA CYCphnAF243 CGTTGTGCGCATAAAGGTGCGG 145
MacKew et
al., 2007 CYCphn-AR388 CTTGCCCTTTCATACCCCGCC
The number of gene copies per microliter was calculated as follows:
(8)
The molecular weight (MWF) of the fragment is determined by multiplying the
product size in base pairs with the molecular weight of double-stranded DNA (660
Da).
When changing target concentration to ng/μl then formula converts to:
(9)
, and target abundance can be expressed as gene copies/μl.
Amplicon numbers were quantified against the standard curve using the ABI Step
One sequence detection software (Applied Biosystems) using automatic analysis
settings for the Ct values and baseline settings. The limit of detection for all three
genes was set at 3.3 cycles lower than the Ct value of the NTC (Smith et al., 2006),
which corresponds with a gene abundance of 3 104, 5 10
3 and 1 10
4 cells per
millilitre of seawater for Thalassolituus alkB, Alcanivorax alkB2 and Cycloclasticus
phnA respectively. Detected target genes were converted to cell density (cells/ml)
assuming a single copy per genome, as demonstrated for Alcanivorax (Schneiker et
al., 2006). This assumption was further indirectly confirmed for all three target genes
using the Q-PCR primers for amplification from known amounts of genomic DNA,
where the chromosome copy number was calculated from the known genome sizes of
3.12, 2.9 and 2.2 Mb for Alcanivorax (Schneiker et al., 2006), Cycloclasticus (Button
et al., 1998) and Thalassolituus (Yakimov et al., 2004) respectively.
Community screening by pyrotag sequencing: PCR and pyrotag sequencing were
performed in Research and Testing Laboratory, Lubbock, Texas, for the V4
hypervariable region of the 16S rDNA locus using primers 515F (5'-
GTGCCAGCMGCCGCGGTAA-3') and 806R (5'-
GGACTACHVGGGTWTCTAAT-3') which are known to have reduced bias for soil
and sediment bacterial communities and cover a wide range of bacterial and archaeal
phyla (Kuczynski et al., 2012). Noise filtering (using the AmpliconNoise package),
chimera removal (using the PerseusD algorithm), Operational Taxonomic Unit (OTU)
clustering (at 97% similarity), OTU table construction, phylogenetic assignments
using the RDP naïve Bayesian classifier (Wang et al., 2007) and heatmap analysis

Chapter 2 Materials and Methods
45
were performed using QIIME v1.4 (Caporaso et al., 2010). For the creation of
rarefaction curves, the OTU table was rarefied from 100 to 9,000 sequences (the
lowest number of clean reads per sample) with a step of 100 sequences ten times at
each step and the mean Chao1 and "observed species" diversity indices were
calculated at each step. The Chao1/"observed species" Vs the number of sequences
plot was performed in QIIME.
For alpha diversity estimates, Shannon's index (log 2), Pielou’s evenness and the
expected number of species (for the smallest sample size, 9,000) were calculated
using Primer 6 software for Windows (PRIMER-E Ltd, Plymouth, UK). Non-metric
multidimensional scaling (nMDS) plots, similarity percentages (SIMPER) analysis
and analysis of similarity (ANOSIM) tests were also performed with the PRIMER6
software, by transforming the rarefied OTU table into a resemblance matrix using the
Bray-Curtis similarity index. A square root transformation was performed prior to all
the above analyses in order to down-weight the highly abundant OTUs. The closest
known representatives of OTUs of interest were determined by BLASTing the
consensus sequences of the OTUs in question against the "nr" nucleotide collection of
the NCBI database.
2.9.2. Autochthonous Bioaugmentation & Biostimulation with Isolated
Hydrocarbon Degraders Consortium of Seawater Microcosm (Seawater
2)
DNA extraction from seawater samples: Cells were harvested from 2 mL of the
seawater microcosms cultures pelleted by centrifugation (16,000 g for 15 min at 4°C)
and processed according to “miniprep” method described by Moore et al., 1999.
PCR analysis: The bacterial 16S rDNA fluorescently labelled universal primers
(Escherichia coli numbering) used for PCR were 27F (5′-
AGAGTTTGATCMTGGCTCAG-3′) and 1492R (5′- GGTTACCTTGTTACGACTT-
3′) which generates a ~1465 bp product. PCR reactions were carried out in a final
volume of 50 μL mixture that contained both primers at 0.5 μM, 0.01 mM dNTPs,
0.03U of Taq Polymerase and the buffer supplied with the enzyme (Roche).
Amplification was performed using a Mastercycler PCR system 9700 Thermocycler
(Eppendorf) as follows: an initial denaturation step of 94°C for 5 min, followed by 30
cycles of denaturation at 94°C for 1 min, annealing at 55°C for 1 min, and extension
at 72°C for 2 min. Cycling was completed by a final elongation at 72°C for 10 min
(Benito et al., 2004). The fluorescent PCR products were viewed on 1% w/v agarose
gels, cleaned with PCR purification kit (Invitrogen) and subsequently were processed
to sequencing analysis.
Sequencing analysis of PCR products: Sequencing analysis was performed in an
ABI PRISM 3700 automated sequencer (Applied Biosystems) and BIOEDIT software
was used to assemble the sequences. The resulting sequences were examined with the
BLAST search alignment tool comparison software (BLASTN) to detect the closest
bacterial group to each strain from the GenBank database and multiple alignment of
this set of sequences was performed with CLUSTALW software. Phylogenetic trees
were generated by MEGA 5.0 software using maximum likelihood and neighbour-
joining treeing algorithms (Tamura et al., 2007).

Chapter 2 Materials and Methods
46
2.10. CLSM conditions
Sample droplets from the cultures in the flasks were placed to a specifically designed
1.02mm Deep Chamber stained with Syto 9, a specific nucleic acid dye which can
stain bacteria, and were monitored under the CLSM.
PMT properties have been adjusted in a way that the adhered bacteria could be
differentiated from the bulk autofluorescence of the oil area that was even stronger
after the staining with Syto9 and the corrected adjustment had resulted in lila
autofluorescence of oil.
CLSM. Laser scanning microscopy was performed using the model TCS SP1 (Leica,
Heidelberg, Germany) attached to an upright microscope. The instrument was
controlled by Leica Confocal software, version 2.61, built 1537. The system was
equipped with three visible lasers: an Ar laser (458, 476, 488, and 514 nm), a laser
diode (561 nm), and a He-Ne laser (633 nm). The spectrophotometer feature allowed
flexible and optimal adjustment of sliders on the detector side. The following settings
were used for excitation and recording of emission signals, respectively: for Syto9,
excitation of 488 and emission from 500 to 550 nm, also for oil autofluoresence
excitation of 561 and emission from 575 to 620nm and excitation of 633 with
emission from 650 to 700nm. Biofilm samples were observed with 63× 1.2-NA, and
63× 0.9-NA water-immersible lenses (Neu and Lawrence, 2010).
Digital image analysis. Images were visualized by using the microscope software
(Leica) for maximum-intensity projections and the free open source software for
image post-processing, visualization and analysis BioImageXD, version 1.0, for XYZ
projections and isosurface rendering. Images were mounted in Photoshop CS5
(Adobe, San Jose, Calif.) without any image adjustments.
Chapter 3- Experimental Design

48

Chapter 3 Experimental Design
49
3. Experimental Design
In this study we examined the effectiveness of the combined autochthonous
bioaugmentation with biostimulation versus biostimulation strategies for the
successful remediation of polluted marine environments. Indigenous populations
adapted or not to oil pollution and isolated hydrocarbon degrading consortia were
examined both in seawater and on shore in the presence or not of other rate limiting
factors like nutrients (inorganic or lipophilic) and biosurfactants as a potential strategy
for the successful remediation of polluted marine environments. Thus the outcome
approaches include:
1. Autochthonous bioaugmentation and/or biostimulation of seawater microcosm
(Seawater 1)
2. Autochthonous bioaugmentation & biostimulation with isolated hydrocarbon
degraders consortium of seawater microcosm (Seawater 2)
3. Landfarming of oil polluted beach sand through biostimulation (Sand 1)
4. Landfarming of oil polluted beach sand through autochthonous
bioaugmentation & biostimulation (Sand 2)
5. Biofilm investigation on oil droplets & Eicosane
3.1. Autochthonous Bioaugmentation and/or Biostimulation of Seawater
Microcosm (Seawater 1)
In this study we examined the effectiveness of the combined
autochthonous bioaugmentation with biostimulation versus
biostimulation strategies for the successful remediation of polluted
marine environments. Seawater was collected from a pristine
environment in Crete (Agios Onoufrios beach, Chania) and was
placed in a batch bioreactor (Autoclavable laboratory fermenter ALF,
Bioengineering) with 1% v/v crude oil in order to grow and adapt
indigenous population and use this consortium later for
bioaugmentation purposes.
Duplicate microcosms were established in sterile 40 ml vial bottles
containing 20 ml of seawater and contaminated with 0.5% w/v
weathered crude oil (A).
Table 7: 1
st Experimental approach Set Up (Seawater 1)
Treatment
Weathered
crude oil
0.5% w/v
Nutrients
(KNO3,
KH2PO4)
Nutrients
(uric acid,
lecithin)
Rhamnolipid
biosurfactant
Preadapted
indigenous
population
Control ┼
NPK ┼ ┼
ULR ┼ ┼ ┼
NPKM ┼ ┼ ┼
NPKMR ┼ ┼ ┼ ┼
ULRM ┼ ┼ ┼ ┼
Three biostimulation treatments: (i) seawater + oil (Control), (ii) seawater + oil
supplemented with KNO3 and K2HPO4 (NPK), (iii) seawater + oil supplemented with
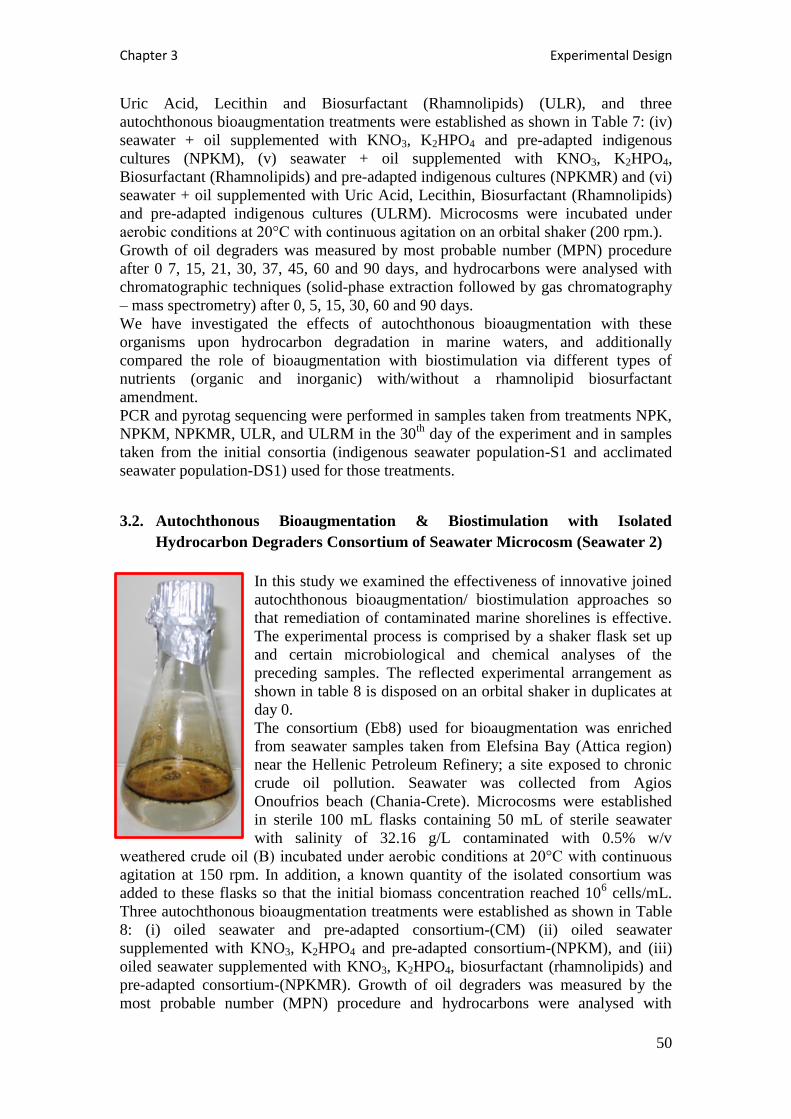
Chapter 3 Experimental Design
50
Uric Acid, Lecithin and Biosurfactant (Rhamnolipids) (ULR), and three
autochthonous bioaugmentation treatments were established as shown in Table 7: (iv)
seawater + oil supplemented with KNO3, K2HPO4 and pre-adapted indigenous
cultures (NPKM), (v) seawater + oil supplemented with KNO3, K2HPO4,
Biosurfactant (Rhamnolipids) and pre-adapted indigenous cultures (NPKMR) and (vi)
seawater + oil supplemented with Uric Acid, Lecithin, Biosurfactant (Rhamnolipids)
and pre-adapted indigenous cultures (ULRM). Microcosms were incubated under
aerobic conditions at 20°C with continuous agitation on an orbital shaker (200 rpm.).
Growth of oil degraders was measured by most probable number (MPN) procedure
after 0 7, 15, 21, 30, 37, 45, 60 and 90 days, and hydrocarbons were analysed with
chromatographic techniques (solid-phase extraction followed by gas chromatography
– mass spectrometry) after 0, 5, 15, 30, 60 and 90 days.
We have investigated the effects of autochthonous bioaugmentation with these
organisms upon hydrocarbon degradation in marine waters, and additionally
compared the role of bioaugmentation with biostimulation via different types of
nutrients (organic and inorganic) with/without a rhamnolipid biosurfactant
amendment.
PCR and pyrotag sequencing were performed in samples taken from treatments NPK,
NPKM, NPKMR, ULR, and ULRM in the 30th
day of the experiment and in samples
taken from the initial consortia (indigenous seawater population-S1 and acclimated
seawater population-DS1) used for those treatments.
3.2. Autochthonous Bioaugmentation & Biostimulation with Isolated
Hydrocarbon Degraders Consortium of Seawater Microcosm (Seawater 2)
In this study we examined the effectiveness of innovative joined
autochthonous bioaugmentation/ biostimulation approaches so
that remediation of contaminated marine shorelines is effective.
The experimental process is comprised by a shaker flask set up
and certain microbiological and chemical analyses of the
preceding samples. The reflected experimental arrangement as
shown in table 8 is disposed on an orbital shaker in duplicates at
day 0.
The consortium (Eb8) used for bioaugmentation was enriched
from seawater samples taken from Elefsina Bay (Attica region)
near the Hellenic Petroleum Refinery; a site exposed to chronic
crude oil pollution. Seawater was collected from Agios
Onoufrios beach (Chania-Crete). Microcosms were established
in sterile 100 mL flasks containing 50 mL of sterile seawater
with salinity of 32.16 g/L contaminated with 0.5% w/v
weathered crude oil (B) incubated under aerobic conditions at 20°C with continuous
agitation at 150 rpm. In addition, a known quantity of the isolated consortium was
added to these flasks so that the initial biomass concentration reached 106 cells/mL.
Three autochthonous bioaugmentation treatments were established as shown in Table
8: (i) oiled seawater and pre-adapted consortium-(CM) (ii) oiled seawater
supplemented with KNO3, K2HPO4 and pre-adapted consortium-(NPKM), and (iii)
oiled seawater supplemented with KNO3, K2HPO4, biosurfactant (rhamnolipids) and
pre-adapted consortium-(NPKMR). Growth of oil degraders was measured by the
most probable number (MPN) procedure and hydrocarbons were analysed with

Chapter 3 Experimental Design
51
chromatographic techniques (solid-phase extraction followed with gas
chromatography–mass spectrometry) after 0, 5, 15 and 30 days.
Table 8: 2nd
Experimental approach Set Up (Seawater 2)
Treatment
Weathered
crude oil 0.5%
w/v
Nutrients
(KNO3,
KH2PO4)
Rhamnolipid
biosurfactant
Isolated Hydrocarbon
Degraders Consortium
(Eb8)
Control ┼ ┼
NPKM ┼ ┼ ┼
NPKMR ┼ ┼ ┼ ┼
3.3. Landfarming of Oil Polluted Beach Sand through Biostimulation (Sand 1)
The main objective of this work was to explore possible methods that could enhance
the rate of oil biodegradation in contaminated beach sand and consequently reduce the
lag phase of indigenous hydrocarbon degraders. Enhancement of biodegradation was
achieved through biostimulation and the effectiveness of novel biostimulants for the
successful remediation of polluted marine environments was examined.
All landfarming treatments were prepared in duplicate and placed in aerobic stainless
steel trays (38 cm long × 27 cm wide × 3 cm high) microcosms (2Kg of sand, dry
weight equivalent) at ambient temperature. Water content was adjusted to 60% of the
field-holding capacity using seawater before spiking with weathered crude oil (A).
Twice a week, the microcosm content was mixed to maintain an aerobic condition and
deionized water was added. Three treatments (Table 9) were carried out in duplicate
trays during 45 days: (i) sand + oil (Control), (ii) oiled sand + KNO3 and K2HPO4
(NPK), (iii) oiled sand + Uric Acid, Lecithin and Biosurfactant (Rhamnolipids) (ULR
Growth of oil degraders was measured by most probable number (MPN) procedure
and hydrocarbons were analysed with chromatographic techniques (solid-phase
extraction, gas chromatography–mass spectrometry) after 0, 15, 30 and 45 days.
We have investigated the effects of landfarming through biostimulation of oil
hydrocarbons in marine oil contaminated soil by comparing the role of different types
of nutrients (organic and inorganic) and/or rhamnolipid biosurfactant amendment.

Chapter 3 Experimental Design
52
Table 9: 3rd
Experimental approach Set Up (Sand 1)
Treatment
Weathered
crude oil
0.5% w/v
Nutrients
(KNO3,
KH2PO4)
Nutrients
(uric acid,
lecithin)
Rhamnolipid
biosurfactant
Indigenous
population
Control ┼ ┼
NPK ┼ ┼ ┼
ULR ┼ ┼ ┼ ┼
3.4. Landfarming of Oil Polluted Beach Sand through Autochthonous
Bioaugmentation & Biostimulation (Sand 2)
In this study we examined the effectiveness of novel combined autochthonous
bioaugmentation/biostimulation strategies for the successful remediation of polluted
marine coastlines. For that reason adapted consortium degrading capabilities
combined with inorganic or lipophilic nutrients in the presence of biosurfactants were
explored.
The consortium was enriched from seawater samples taken from Elefsina Bay (Attica
region) near the Hellenic Petroleum Refinery; a site exposed to chronic crude oil
pollution. All landfarming treatments were prepared in pyrex trays (20 cm long × 20
cm wide × 6 cm high) microcosms (1Kg of sand, dry weight equivalent) with a
quantity of isolated consortium equivalent to 106 cells/g and incubated under aerobic
conditions at 20°C. Water content was adjusted to 60% of the field-holding capacity
using seawater before spiking with weathered crude oil (B). Twice a week, the
microcosm content was mixed to maintain an aerobic condition and deionized water
added. Three treatments (Table 10) were carried for 45 days: (i) oiled sand + pre-
adapted consortium (Control M), (ii) oiled sand + KNO3 and K2HPO4 + pre-adapted
consortium (NPKM,), (iii) oiled sand + Uric Acid, Lecithin and Biosurfactant
(Rhamnolipids) + pre-adapted consortium (ULRM). Growth of oil degraders was
measured by most probable number (MPN) procedure and hydrocarbons were
analysed with chromatographic techniques (solid-phase extraction, gas
chromatography–mass spectrometry) after 0, 7, 15, 30 and 45 days.
Table 10: 4th
Experimental approach Set Up (Sand 2)
Treatment
Weathered
crude oil
0.5% w/v
Nutrients
(KNO3,
KH2PO4)
Nutrients
(uric acid,
lecithin)
Rhamnolipid
biosurfactant
Isolated
Hydrocarbon
Degraders
Consortium
Control M ┼
NPKM ┼ ┼ ┼
ULRM ┼ ┼ ┼ ┼
3.5. Biofilm Investigation on Oil Droplets & Eicosane
Studies have shown that there is great variety of bacteria that either have affinity, can
metabolize hydrocarbons or produce biosurfactants or similar chemicals that is
induced in a hydrocarbon polluted environment. Nonetheless single strain bacteria

Chapter 3 Experimental Design
53
have been thoroughly tested as has been described (Ch. 1) on their ability to degrade a
variety of single components of petroleum but not so many on mixtures of
hydrocarbons such as crude oil or any other petroleum products. Although in the real
environment numerous bacteria are organized and grouped on the basis of how they
interact with each other and become associated to the pollutant, studies haven’t yet
focused on multispecies consortia mechanisms to degrade hydrocarbons and most
preferably oil since real accidents include release of oil and its products. Investigation
of these interactions that take place between marine bacteria and oil hydrocarbons
could improve our understanding on the fate of hydrocarbons in the environment and
thus help to develop the most suitable bioremediation strategy.
Thus the main objective in this study was to observe through Confocal Laser
Microscopy the response of consortia Eb8 (20oC) and E4(14
oC) that were enriched
from seawater samples taken from Elefsina Bay (Attica region) near the Hellenic
Petroleum Refinery; a site exposed to chronic crude oil pollution, on crude oil
contamination. Moreover their response after the addition of certain commercial
dispersants just like those that have been or could be used in the event of a real oil
spill but also of more environmentally friendly biosurfactants (Rhamnolipids) was
also examined.
Enrichments and Investigation of the tested consortia
The consortia were enriched from seawater samples taken from Elefsina Bay (Attica
region) near the Hellenic Petroleum Refinery; a site exposed to chronic crude oil
pollution. Consortia Eb8 and E4 were enriched in 100ml ONR7 medium with 607μl
crude oil under constant agitation (200 rpm) at 20 oC and at 14
oC respectively. We
haven’t further proceed to isolations of the enriched consortium since our primary
goal was to use the acclimated consortium as it was and observe how it responds on
oil contamination in seawater.
Droplets of crude oil and C20 (500000 ppm, 0.4 μl) were placed on a plastic sterile
slide that is a solvent-resistant and is inert against crude oil, although solvents such as
dichloromethane cause specific plastic slides to warp. Prepared slides with the C20
droplets were placed downwards on the water surface of a petri dish filled with
100mL of ONR7 medium with the appropriate consortium (Eb8/E4), the appropriate
amount of nutrients and/or Rhamnolipids. The flasks of the testing consortia
accordingly were filled with 100mL of ONR7 medium with the appropriate
consortium (Eb8/E4) and 0.5%w/v of weathered crude oil, the appropriate amount of
nutrients and/or Rhamnolipids in the recommended dose dispersant: oil (1:10) by the
manufacturer as described in Tables 11&12. Three types of Dispersants were used:
Corexit, S200 and Marichem. The petri dish microcosms and prepared flasks were
Floating slide carrying eicosane
droplets
Eicosane droplets
ONR7 medium
level
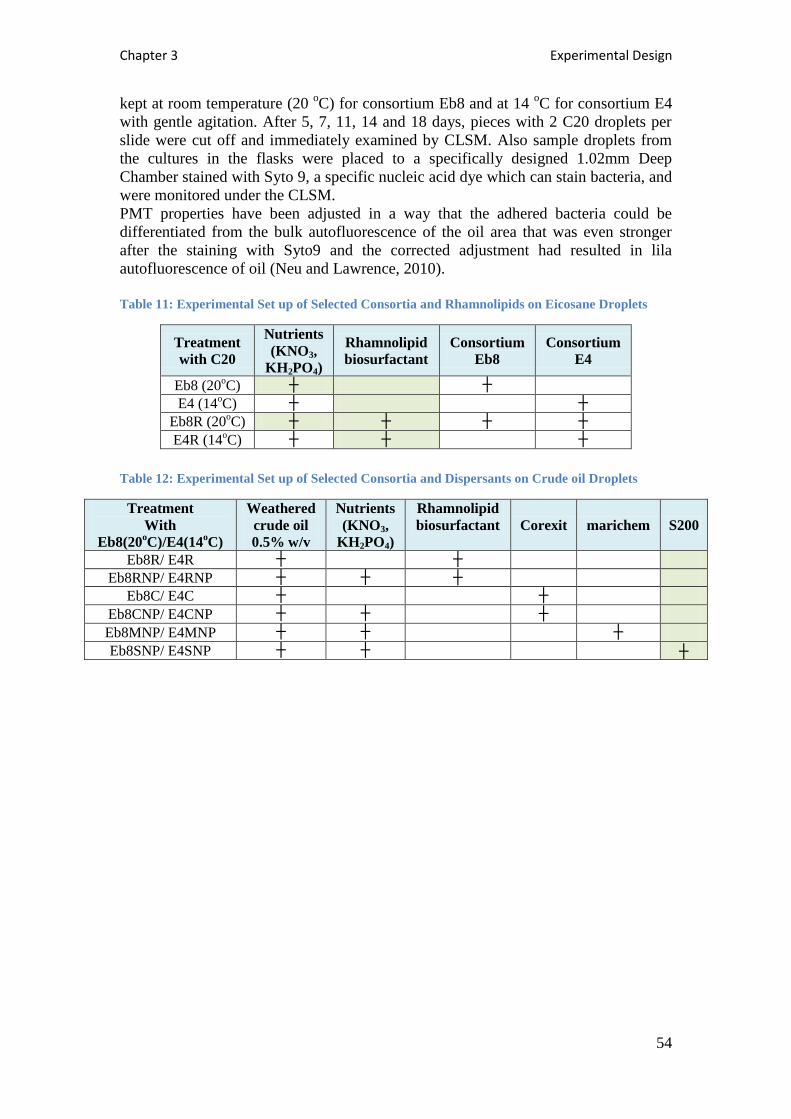
Chapter 3 Experimental Design
54
kept at room temperature (20 oC) for consortium Eb8 and at 14
oC for consortium E4
with gentle agitation. After 5, 7, 11, 14 and 18 days, pieces with 2 C20 droplets per
slide were cut off and immediately examined by CLSM. Also sample droplets from
the cultures in the flasks were placed to a specifically designed 1.02mm Deep
Chamber stained with Syto 9, a specific nucleic acid dye which can stain bacteria, and
were monitored under the CLSM.
PMT properties have been adjusted in a way that the adhered bacteria could be
differentiated from the bulk autofluorescence of the oil area that was even stronger
after the staining with Syto9 and the corrected adjustment had resulted in lila
autofluorescence of oil (Neu and Lawrence, 2010).
Table 11: Experimental Set up of Selected Consortia and Rhamnolipids on Eicosane Droplets
Treatment
with C20
Nutrients
(KNO3,
KH2PO4)
Rhamnolipid
biosurfactant
Consortium
Eb8
Consortium
E4
Eb8 (20oC) ┼ ┼
E4 (14oC) ┼ ┼
Eb8R (20oC) ┼ ┼ ┼ ┼
E4R (14oC) ┼ ┼ ┼
Table 12: Experimental Set up of Selected Consortia and Dispersants on Crude oil Droplets
Treatment
With
Eb8(20oC)/E4(14
oC)
Weathered
crude oil
0.5% w/v
Nutrients
(KNO3,
KH2PO4)
Rhamnolipid
biosurfactant Corexit marichem S200
Eb8R/ E4R ┼ ┼
Eb8RNP/ E4RNP ┼ ┼ ┼
Eb8C/ E4C ┼ ┼
Eb8CNP/ E4CNP ┼ ┼ ┼
Eb8MNP/ E4MNP ┼ ┼ ┼
Eb8SNP/ E4SNP ┼ ┼ ┼

Chapter 4- Experimental Results and
Discussion

56
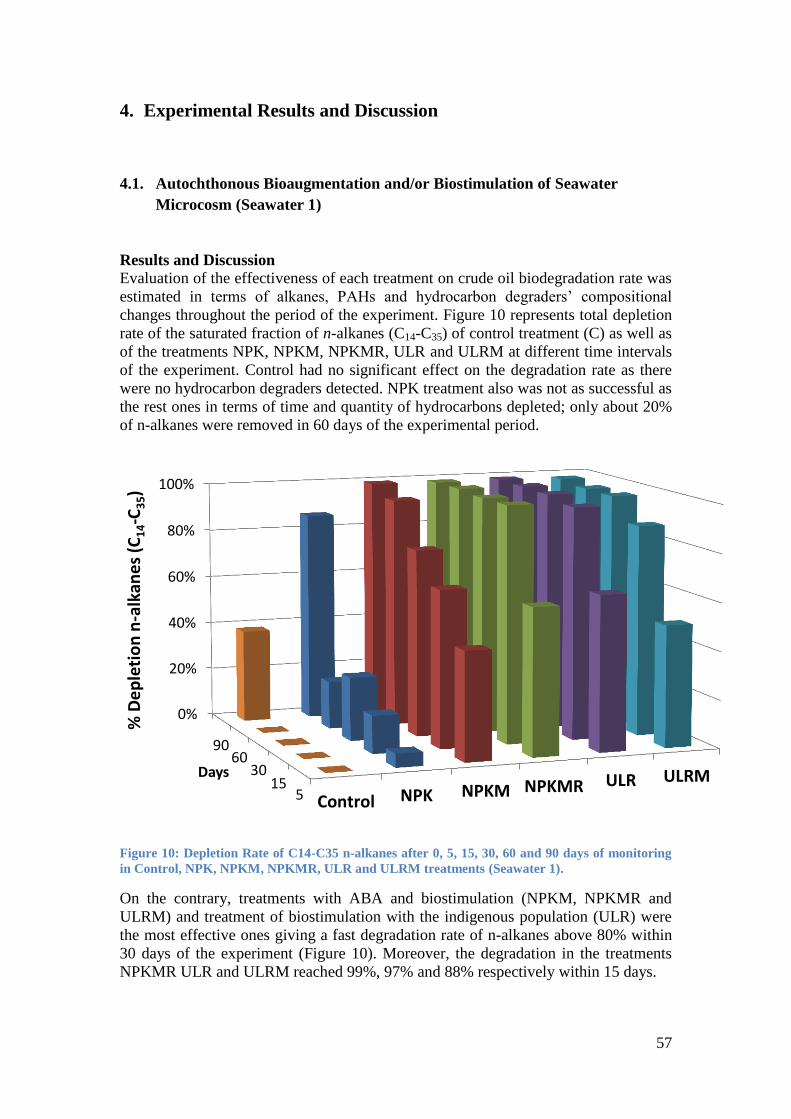
57
4. Experimental Results and Discussion
4.1. Autochthonous Bioaugmentation and/or Biostimulation of Seawater
Microcosm (Seawater 1)
Results and Discussion
Evaluation of the effectiveness of each treatment on crude oil biodegradation rate was
estimated in terms of alkanes, PAHs and hydrocarbon degraders’ compositional
changes throughout the period of the experiment. Figure 10 represents total depletion
rate of the saturated fraction of n-alkanes (C14-C35) of control treatment (C) as well as
of the treatments NPK, NPKM, NPKMR, ULR and ULRM at different time intervals
of the experiment. Control had no significant effect on the degradation rate as there
were no hydrocarbon degraders detected. NPK treatment also was not as successful as
the rest ones in terms of time and quantity of hydrocarbons depleted; only about 20%
of n-alkanes were removed in 60 days of the experimental period.
Figure 10: Depletion Rate of C14-C35 n-alkanes after 0, 5, 15, 30, 60 and 90 days of monitoring
in Control, NPK, NPKM, NPKMR, ULR and ULRM treatments (Seawater 1).
On the contrary, treatments with ABA and biostimulation (NPKM, NPKMR and
ULRM) and treatment of biostimulation with the indigenous population (ULR) were
the most effective ones giving a fast degradation rate of n-alkanes above 80% within
30 days of the experiment (Figure 10). Moreover, the degradation in the treatments
NPKMR ULR and ULRM reached 99%, 97% and 88% respectively within 15 days.
Control NPK NPKM NPKMR ULR ULRM
0%
20%
40%
60%
80%
100%
9060
3015
5
% D
ep
leti
on
n-a
lkan
es
(C1
4-C
35)
Days

58
Figure 11: Concentration of C14-C35 n-alkanes after 0, 5, 15, 30, 60 and 90 days of monitoring in
NPKM treatment (Seawater 1).
Figure 12: Concentration of C14-C35 n-alkanes after 0, 5, 15, 30, 60 and 90 days of monitoring in
NPKMR treatment (Seawater 1).
0
5
10
15
20
25
30
35
C1
4
C1
5
C1
6
C1
7 Pr
C1
8
Ph
C1
9
C2
0
C2
1
C2
2
C2
3
C2
4
C2
5
C2
6
C2
7
C2
8
C2
9
C3
0
C3
1
C3
2
C3
3
C3
4
C3
5
ng
alka
ne
s/n
g h
op
ane
NPKM
NPKM_0 NPKM_5 NPKM_15
NPKM_30 NPKM_60 NPKM_90
0
5
10
15
20
25
30
35
40
C1
4
C1
5
C1
6
C1
7 Pr
C1
8
Ph
C1
9
C2
0
C2
1
C2
2
C2
3
C2
4
C2
5
C2
6
C2
7
C2
8
C2
9
C3
0
C3
1
C3
2
C3
3
C3
4
C3
5
ng
alka
ne
s/n
g h
op
ane
NPKMR
NPKMR_0 NPKMR_5 NPKMR_15
NPKMR_30 NPKMR_60 NPKMR_90

59
Figure 13: Concentration of C14-C35 n-alkanes after 0, 5, 15, 30, 60 and 90 days of monitoring in
ULR treatment (Seawater 1).
Figure 14: Concentration of C14-C35 n-alkanes after 0, 5, 15, 30, 60 and 90 days of monitoring in
ULRM treatment (Seawater 1).
As it is seen from Figures 11-14 in treatments ULR, NPKMR and ULRM (where
rhamnolipids were added) there is high decreasing rate for medium chain n-alkanes
(C14 to C30) as well as for high chain alkanes (C31 to C35) in almost 15 days of the
experiment. In treatment NPKM however, high chain alkanes (C31 to C35) remained
0
5
10
15
20
25
C1
4
C1
5
C1
6
C1
7 Pr
C1
8
Ph
C1
9
C2
0
C2
1
C2
2
C2
3
C2
4
C2
5
C2
6
C2
7
C2
8
C2
9
C3
0
C3
1
C3
2
C3
3
C3
4
C3
5
ng
alka
ne
s/n
g h
op
ane
ULR
ULR_0 ULR_5 ULR_15
ULR_30 ULR_60 ULR_90
0
2
4
6
8
10
12
14
16
18
C1
4
C1
5
C1
6
C1
7 Pr
C1
8
Ph
C1
9
C2
0
C2
1
C2
2
C2
3
C2
4
C2
5
C2
6
C2
7
C2
8
C2
9
C3
0
C3
1
C3
2
C3
3
C3
4
C3
5
ng
alka
ne
s/n
g h
op
ane
ULRM
ULRM_0 ULRM_5 ULRM_15
ULRM_30 ULRM_60 ULRM_90

60
stable for the whole duration of the experiment as shown in Figure 11. The average
specific consumption (degradation) rate was calculated over the time period that
degradation occurred, which as can be observed in Figure 12 for NPKMR and ULR is
0 to15 days, for ULRM 0 to 30 days and for NPKM is 0 to 60 days. Although there is
nearly no growth detected in the control treatment, we can assume that specific
degradation rate in the control treatment is very low in the magnitude of 0.0001. If we
compare the specific degradation rate of treatments NPKM, NPKMR, ULR and
ULRM (Table 13 and Figure 19) we can estimate that specific degradation rate in
those treatments can exceed 106 orders of magnitude than the control.
Table 13: Specific growth and degradation rate of selected alkanes (Seawater 1)
Treatment μ
(1/h)
qs (μg/cells h)
C15 C20 C25 C30 C35 Pristane Phytane
NPKM 0.004 64.9 51.3 15.7 8.4 3 39.6 42.4
NPKMR 0.023 1239.3 854.8 257.3 131.3 65.2 760.6 807.3
ULR 0.024 898.4 783.2 202.3 158.3 116.9 474.6 571
ULRM 0.010 105 84.1 47.7 24.9 19.9 53.4 59
If we make the comparison between treatments we can estimate that specific
degradation rate for C15 in NPKMR, ULR and ULRM treatments is 18, 13 and 1.5
times higher than that of treatment NPKM. Also the specific degradation rate for C20
is approximately 16, 14 and 1.5 times higher for treatments NPKMR, ULR and
ULRM than treatment NPKM. Moreover, the specific degradation rate for C25 and C30
in treatments NPKMR and ULRM is about 16 and 3 times higher than treatment
NPKM respectively, where specific degradation rate for C25 and C30 in treatment ULR
is 12 and 18 times higher than treatment NPKM. The specific degradation rate for the
heavier components C35 is 21, 37 and 6.5 times higher than treatment NPKM in
NPKMR, ULR and ULRM treatments respectively. More specifically, for treatments
NPKMR, ULR and ULRM (where the biosurfactant is present) the average specific
growth rate μ for NPKMR and ULR equals to approximately 0.02 (1/h), whereas in
treatment ULRM the specific degradation rate is not equal to the other two treatments,
leading to the conclusion that this consortium in the presence of organic lipophilic
nutrients prefers to utilize this carbon source rather than petroleum hydrocarbons.
Branched alkanes and formerly used biomarkers like Pristane and Phytane are also
degraded by 18, 12 times higher in NPKMR and ULR treatments and 1.5 times higher
in ULRM treatment compared to NPKM.
The same behaviour between treatments NPKM-NPKMR-ULR-ULRM in terms of
specific degradation rate applies also for selected PAHs that are shown in figures 15-
18. Furhtermore, we observe that there is a low but decreasing rate in low molecular
weight PAHs (fluorene-dibenzothiothene- phenanthrene) compared to high molecular
weight PAH (chrysene) which remains practically stable. Degradation in treatments
ULR and NPKMR of low molecular PAHs is achieved within 15 days, while for
NPKM and ULRM is achieved within 30 days of the experiment (Figures 15-18).
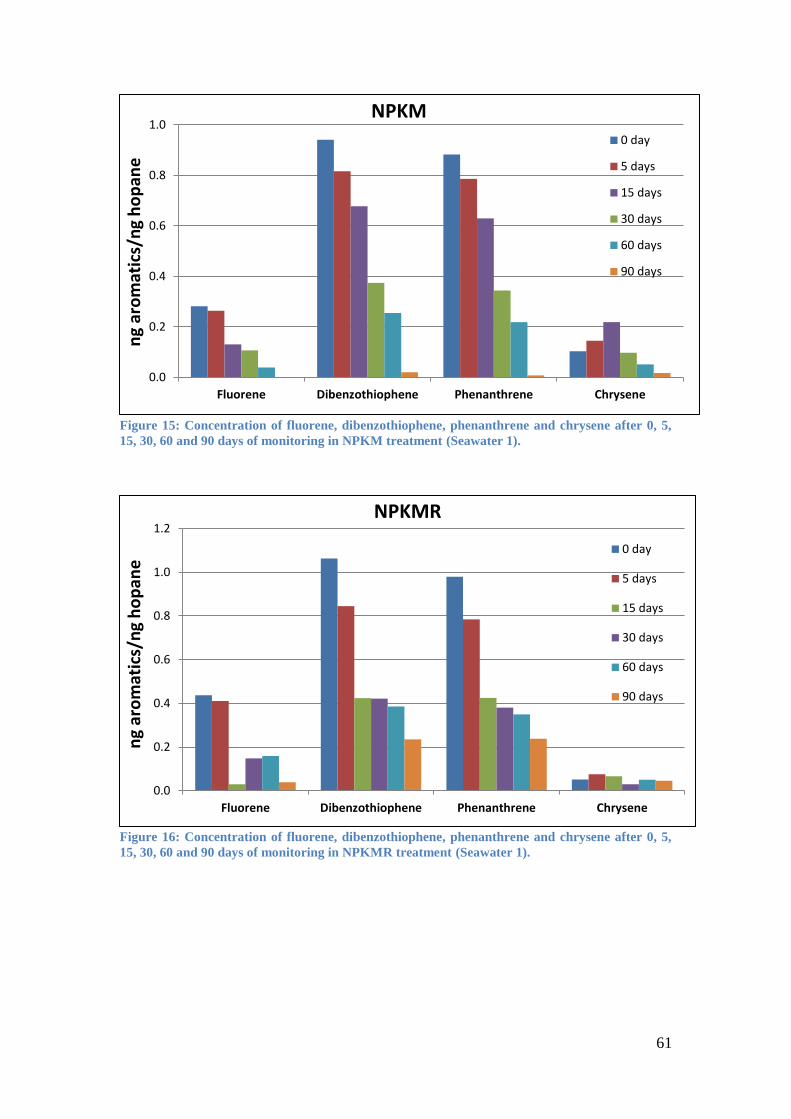
61
Figure 15: Concentration of fluorene, dibenzothiophene, phenanthrene and chrysene after 0, 5,
15, 30, 60 and 90 days of monitoring in NPKM treatment (Seawater 1).
Figure 16: Concentration of fluorene, dibenzothiophene, phenanthrene and chrysene after 0, 5,
15, 30, 60 and 90 days of monitoring in NPKMR treatment (Seawater 1).
0.0
0.2
0.4
0.6
0.8
1.0
Fluorene Dibenzothiophene Phenanthrene Chrysene
ng
aro
mat
ics/
ng
ho
pan
e
NPKM 0 day
5 days
15 days
30 days
60 days
90 days
0.0
0.2
0.4
0.6
0.8
1.0
1.2
Fluorene Dibenzothiophene Phenanthrene Chrysene
ng
aro
mat
ics/
ng
ho
pan
e
NPKMR
0 day
5 days
15 days
30 days
60 days
90 days

62
Figure 17: Concentration of fluorene, dibenzothiophene, phenanthrene and chrysene after 0, 5,
15, 30, 60 and 90 days of monitoring in ULR treatment (Seawater 1).
Figure 18: Concentration of fluorene, dibenzothiophene, phenanthrene and chrysene after 0, 5,
15, 30, 60 and 90 days of monitoring in ULRM treatment (Seawater 1).
PAHs degradation in the NPKMR treatment reached 60% within 15 days equally for
fluorene, dibenzothiothene and phenanthrene, which remained practically stable for
the next 45 days and was reduced to 90% (fluorene) and 75% (dibenzothiothene-
phenanthrene) by the end of the experiment. Accordingly in ULR treatment
degradation rate reached 60% for fluorene and above 75% for dibenzothiothene and
phenanthrene during the first 2 weeks of the experiment, then all reached 87% by the
30th
day and remained stable until the end of the experiment with only fluorene
reaching 98% after 60 days. On the contrary, in the NPKM treatment fluorene and
0.0
0.5
1.0
1.5
2.0
2.5
3.0
Fluorene Dibenzothiophene Phenanthrene Chrysene
ng
aro
mat
ics/
ng
ho
pan
e
ULR
0 day
5 days
15 days
30 days
60 days
90 days
0.0
0.1
0.2
0.3
0.4
0.5
0.6
Fluorene Dibenzothiophene Phenanthrene Chrysene
ng
aro
mat
ics/
ng
ho
pan
e
ULRM
0 day
5 days
15 days
30 days
60 days
90 days
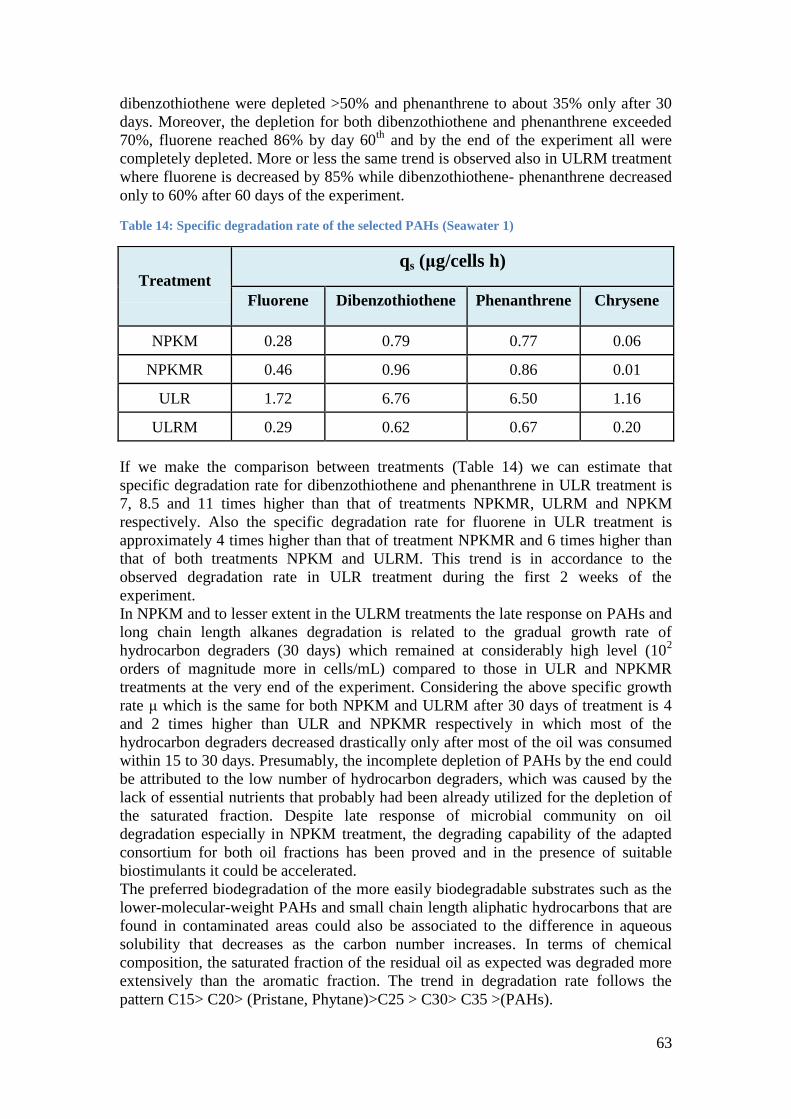
63
dibenzothiothene were depleted >50% and phenanthrene to about 35% only after 30
days. Moreover, the depletion for both dibenzothiothene and phenanthrene exceeded
70%, fluorene reached 86% by day 60th
and by the end of the experiment all were
completely depleted. More or less the same trend is observed also in ULRM treatment
where fluorene is decreased by 85% while dibenzothiothene- phenanthrene decreased
only to 60% after 60 days of the experiment.
Table 14: Specific degradation rate of the selected PAHs (Seawater 1)
Treatment
qs (μg/cells h)
Fluorene Dibenzothiothene Phenanthrene Chrysene
NPKM 0.28 0.79 0.77 0.06
NPKMR 0.46 0.96 0.86 0.01
ULR 1.72 6.76 6.50 1.16
ULRM 0.29 0.62 0.67 0.20
If we make the comparison between treatments (Table 14) we can estimate that
specific degradation rate for dibenzothiothene and phenanthrene in ULR treatment is
7, 8.5 and 11 times higher than that of treatments NPKMR, ULRM and NPKM
respectively. Also the specific degradation rate for fluorene in ULR treatment is
approximately 4 times higher than that of treatment NPKMR and 6 times higher than
that of both treatments NPKM and ULRM. This trend is in accordance to the
observed degradation rate in ULR treatment during the first 2 weeks of the
experiment.
In NPKM and to lesser extent in the ULRM treatments the late response on PAHs and
long chain length alkanes degradation is related to the gradual growth rate of
hydrocarbon degraders (30 days) which remained at considerably high level (102
orders of magnitude more in cells/mL) compared to those in ULR and NPKMR
treatments at the very end of the experiment. Considering the above specific growth
rate μ which is the same for both NPKM and ULRM after 30 days of treatment is 4
and 2 times higher than ULR and NPKMR respectively in which most of the
hydrocarbon degraders decreased drastically only after most of the oil was consumed
within 15 to 30 days. Presumably, the incomplete depletion of PAHs by the end could
be attributed to the low number of hydrocarbon degraders, which was caused by the
lack of essential nutrients that probably had been already utilized for the depletion of
the saturated fraction. Despite late response of microbial community on oil
degradation especially in NPKM treatment, the degrading capability of the adapted
consortium for both oil fractions has been proved and in the presence of suitable
biostimulants it could be accelerated.
The preferred biodegradation of the more easily biodegradable substrates such as the
lower-molecular-weight PAHs and small chain length aliphatic hydrocarbons that are
found in contaminated areas could also be associated to the difference in aqueous
solubility that decreases as the carbon number increases. In terms of chemical
composition, the saturated fraction of the residual oil as expected was degraded more
extensively than the aromatic fraction. The trend in degradation rate follows the
pattern C15> C20> (Pristane, Phytane)>C25 > C30> C35 >(PAHs).

64
Figure 19: Concentration profiles of selected n-alkanes and PAHs compounds in NPKM,
NPKMR, ULR and ULRM treatments (Seawater 1).
Although Pristane and Phytane were considered in the past as conserved internal
markers in biodegradation index, as shown in Figure 17 and Table 13 (especially in
0
5
10
15
20
25
30
35
0 20 40 60 80 100
ng
alka
ne
s/n
g h
op
ane
t (days)
C15
NPKM NPKMR
ULR ULRM
0
5
10
15
20
25
0 50 100
ng
alka
ne
s/n
g h
op
ane
t (days)
C20
NPKM NPKMR
ULR ULRM
0
1
2
3
4
5
6
7
0 50 100
ng
alka
nes
/ng
ho
pan
e
t (days)
C25
NPKM NPKMR
ULR ULRM
0
1
2
3
4
5
0 50 100
ng
alka
nes
/ng
ho
pan
e
t (days)
C30 NPKM NPKMR
ULR ULRM
0.0
0.2
0.4
0.6
0.8
1.0
0 50 100
ng
aro
mat
ics/
ng
ho
pan
e
t (days)
Fluorene
NPKM NPKMR
ULR ULRM
0.0
0.5
1.0
1.5
2.0
2.5
3.0
0 50 100
ng
aro
mat
ics/
ng
ho
pan
e
t (days)
Dibenzothiophene
NPKM NPKMR
ULR ULRM

65
ULR treatment) they were completely degraded within 15 days and thus they should
be considered unreliable as biodegradation index.
Figure 20: Alkanes % depletion and microbial growth curve between different treatments
(NPKM and ULRM) through 90 days of monitoring (Seawater 1).
Comparison of the removal of the saturated fraction and the microbial growth among
the NPKM (figure 20) NPKMR and ULR treatments suggests that the removal of the
saturated fraction depends on the increase in population of hydrocarbon degraders.
Figure 21: MPN profile in NPKM, NPKMR, ULR and ULRM treatments (Seawater 1).
The application of nutrients in the solutions enhanced the growth of the hydrocarbon
degraders as was estimated by the MPN method in comparison with the control
1.E+01
1.E+02
1.E+03
1.E+04
1.E+05
1.E+06
0
10
20
30
40
50
60
70
80
90
100
0 5 15 30 60 90
MP
N (
cells
/mL)
% D
ep
leti
on
of
n-a
lkan
es
(C1
4-C
35)
Time (days)
% Depletion NPKM % Depletion ULRM MPN/mL NPKM MPN/Ml ULRM
1.E+00
1.E+01
1.E+02
1.E+03
1.E+04
1.E+05
1.E+06
1.E+07
0 20 40 60 80 100
MP
N (
cells
/mL)
Time (days) NPKM NPKMRULR ULRM
66
solution where no nutrients were added. Hydrocarbon degraders population in
NPKMR, ULR and ULRM microcosms reached 106 per mL within 15 days where
nearly complete degradation above 90% was achieved (SE for all values ranged from
1.89 to 2.04 for NPKM, NPKMR and ULR treatments and only for ULRM treatment
ranged from 1.89 to 2.09). On the contrary, in the NPKM treatment the hydrocarbon
degraders population reached 105 per mL and degradation reached 65%. The
application of biosurfactants in the solutions enhanced the growth of the hydrocarbon
degraders within 5 days as it was estimated by the MPN method in NPKMR, ULR
and ULRM treatments (Figure 21).
A comparison of the n-alkanes and PAHs profiles (Figures 12-18) after oil application
revealed that the application of fertilizer plus biosurfactant can favour the degradation
of crude oil in communities that are already well adapted but lack essential nutrients.
It has been observed in previous study by McKew et al., 2007 that addition of
rhamnolipid biosurfactants alone had little effect on biodegradation; however, in
combination with water soluble nutrient additions, provoked a significant increase.
Sole biosurfactant addition increases only bioavailability of petroleum components;
however, if there is lack of essential nutrients (N & P) microbial activity will still be
limited.
On the other hand when the added fertilizer is of organic origin it could result in an
increased consumption of the organic source rather than consumption of oil. In cases
where there is an excess of biosurfactant present, any further production of
biosurfactant is stopped while the microbes utilize these nutrients. As it was reported
in previous studies on liquid microcosms when these lipophilic nutrients alone
(Nikolopoulou et al., 2007) or in combination with rhamnolipids (Nikolopoulou and
Kalogerakis, 2008) are applied to the indigenous population, a high degradation of
petroleum hydrocarbons can be achieved, which is also confirmed in the present study
(ULR treatment). Furthermore, most of the crude oil saturated fractions were totally
utilized after 5 days of treatment with the fertilizer plus biosurfactant (NPKMR). The
biodegradation reached almost 50 % within 5 days of incubation while 70% was
reached after 15 days of incubation (NPKMR). Microbial response to hydrocarbon
consumption was remarkable as stated above, however information on the community
structure variability and shift mainly affected by the different amendments was
investigated also along.
RT-PCR results revealed (Figure 22) that the dominant bacteria in population
numbers among the three model markers (Alcanivorax, Thalossolituus and
Cycloclasticus) that were estimated was Alcanivorax at the early stage (5days) in the
three autochthonous bioaugmentation treatments NPKM, NPKMR and ULRM, which
after 15 days becomes the leader in all four treatments. The population numbers of
Alcanivorax in NPKM especially and NPKMR treatments are particularly high (1012
-
1013
cells/mL) compared to the other 2 treatments during the first 30 days of the
experiment. Though the highest number of Alcanivorax in NPKM treatment, no
significant degradation occurs during this time span that could be correlated in part to
Alcanivorax dominant presence and as has been investigated through pyrosequencing
other species and particularly other Alcanivorax strains can be responsible for
hydrocarbons degradation in these treatments.

67
5 days 15 days
30 days 60 days Figure 22: Abundance of alkB2 (Alcanivorax), alkB (Thalassolituus) and phnA (Cycloclasticus)
genes in NPKM, NPKMR, ULR and ULRM treatments (Seawater 1).
As it can be observed in the above graphs Cycloclasticus numbers have gradually
increased, slightly though over time in treatments NPKMR and ULRM, whereas in
treatments NPKM and ULR remained practically stable, in the region of 1010
cells/mL. It is though remarkable that Thalossolittus numbers were kept low at most
of the experimental time below Alcanivorax’s and in some cases Cycloclasticus’
numbers except for ULR biostimulation treatment the only one that contain
indigenous population in which pattern changed after 30 days with Thalossolituus
being the dominant strain among the three that were estimated. As has been described
and in detail investigated through pyrosequencing in the samples taken after 30 days
of the starting period of the experiments community structure shifts and changes
through time depending on the nutrients and the inoculum used in the specific
bioremediation strategy.
Specifically twelve families made up the largest part of the community in each sample
(84-97% of clean sequences per sample): Flavobacteriaceae (0.01-15.3% per
sample), Rhodobacteraceae (0.04-1.4% per sample), Rhodospirillaceae (0.04-23.6%
per sample), Alteromonadaceae (0-5% per sample), Idiomarinaceae (0-28.8% per
sample), Pseudoalteromonadaceae (0-30.4% per sample), Shewanellaceae (0-7.3%
per sample), Alcanivoracaceae (0.01-79% per sample), Halomonadaceae (0-11.1%
per sample), Oceanospirillaceae (0-18% per sample), Moraxellaceae (0.01-19.3% per
sample), Pseudomonadaceae (0-79.3% per sample) and Vibrionaceae (0-24% per
sample). The rest (3.2-18.8%) of the community consisted of 69 low abundant
(<0.01%) families as well as some OTUs without possible phylogenetic affiliation to
the family level. Family distribution is presented in Figure 23.
1.E+00
1.E+02
1.E+04
1.E+06
1.E+08
1.E+10
1.E+12
1.E+14
NPKM NPKMR ULR ULRM
Gen
e co
pie
s/m
L
Alcanivorax Thalassolituus Cycloclasticus
1.E+00
1.E+02
1.E+04
1.E+06
1.E+08
1.E+10
1.E+12
1.E+14
NPKM NPKMR ULR ULRM
Gen
e co
pie
s/m
L
Alcanivorax Thalassolituus Cycloclasticus
1.E+00
1.E+02
1.E+04
1.E+06
1.E+08
1.E+10
1.E+12
NPKM NPKMR ULR ULRM
Gen
e co
pie
s/m
L
Alcanivorax Thalassolituus Cycloclasticus
1.E+00
1.E+02
1.E+04
1.E+06
1.E+08
1.E+10
1.E+12
1.E+14
NPKM NPKMR ULR ULRM
Gen
e co
pie
s/m
L
Alcanivorax Thalassolituus Cycloclasticus

68
Figure 23: Relative abundance of different family groups based on operational taxonomic units
(OTUs) obtained by pyrotag sequencing of amplified 16S rDNA genes (Seawater 1).
S1 represents the initial seawater indigenous population used in biostimulation
treatments and DS1 the acclimated consortium in a bioreactor that has been used in
the autochthonous bioaugmentation treatments and clearly look similar in terms of
species distribution, bacteria belonging mainly to the families of
Pseudoalteromonadaceae (30.4% & 19.4% for S1 and DS1 respectively),
Halomonadaceae (7.8% & 11.1%), Oceanospirillaceae (15.4% & 18%) and
Vibrionaceae (19.6% & 24%) per sample). Dominant family groups in NPK, NPKM
and NPKMR treatments that inorganic nutrients were used, belong to
Alcanivoracaceae (59.1%, 79% & 46.6% for NPK, NPKM and NPKMR treatments
respectively) and Rhodospirillaceae (23.6%, 9.6% & 8% for NPK, NPKM and
NPKMR treatments respectively). However in the presence of biosurfactant
(rhamnolipids-treatments NPKMR, ULR & ULRM) there is a community shift to the
family of Pseudomonadaceae (15.6%, 79.3% & 15.3% for NPKMR, ULR & ULRM
treatments respectively). Specifically for ULR treatment that lipophilic nutrients
added to support indigenous population, indigenous population shifts to consist
mainly additionally to Pseudomonadaceae family, Vibrionaceae family (12.6%).
While preadapted consortium that was treated also with lipophilic nutrients besides
Pseudomonadaceae family also consists mainly of the families of Idiomarinaceae
(28.8%), Moraxellaceae (19.3%), Rhodospirillaceae (17.1%) and to lesser extent to
the family of Alcanivoracaceae (10%).
Total diversity as a mean across all relevant samples (based on the Shannon index,
H'log2), species richness (based on the expected number of species corrected for the
lowest sample size, ES9000) and/or community evenness (based on Piellou's evenness
0%
10%
20%
30%
40%
50%
60%
70%
80%
90%
100%
DS1
NP
K3
0
NP
KM
30
NP
KM
R3
0 S1
ULR
30
ULR
M3
0
OTU
s in
Sam
ple
s
Other
Vibrionaceae
Pseudomonadaceae
Moraxellaceae
Oceanospirillaceae
Halomonadaceae
Alcanivoracaceae
Shewanellaceae
Pseudoalteromonadaceae
Idiomarinaceae
Alteromonadaceae
Rhodospirillaceae
Rhodobacteraceae
Flavobacteriaceae
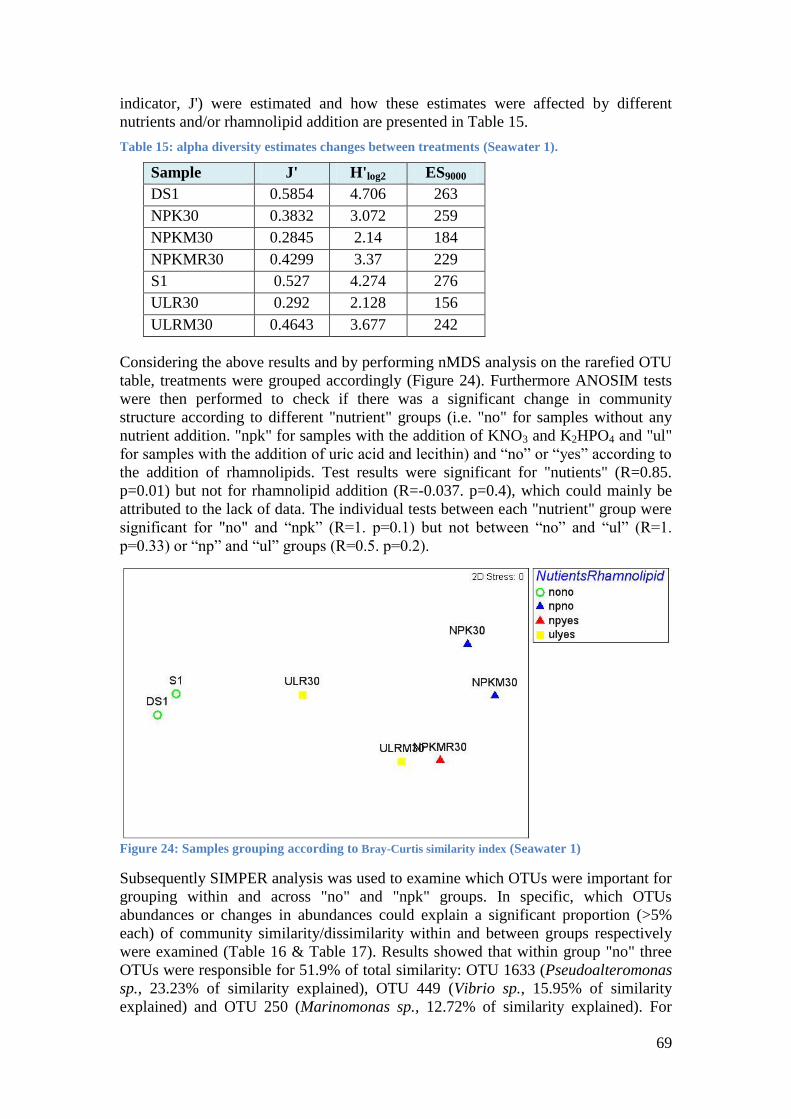
69
indicator, J') were estimated and how these estimates were affected by different
nutrients and/or rhamnolipid addition are presented in Table 15.
Table 15: alpha diversity estimates changes between treatments (Seawater 1).
Sample J' H'log2 ES9000
DS1 0.5854 4.706 263
NPK30 0.3832 3.072 259
NPKM30 0.2845 2.14 184
NPKMR30 0.4299 3.37 229
S1 0.527 4.274 276
ULR30 0.292 2.128 156
ULRM30 0.4643 3.677 242
Considering the above results and by performing nMDS analysis on the rarefied OTU
table, treatments were grouped accordingly (Figure 24). Furthermore ANOSIM tests
were then performed to check if there was a significant change in community
structure according to different "nutrient" groups (i.e. "no" for samples without any
nutrient addition. "npk" for samples with the addition of KNO3 and K2HPO4 and "ul"
for samples with the addition of uric acid and lecithin) and “no” or “yes” according to
the addition of rhamnolipids. Test results were significant for "nutients" (R=0.85.
p=0.01) but not for rhamnolipid addition (R=-0.037. p=0.4), which could mainly be
attributed to the lack of data. The individual tests between each "nutrient" group were
significant for "no" and “npk” (R=1. p=0.1) but not between “no” and “ul” (R=1.
p=0.33) or “np” and “ul” groups (R=0.5. p=0.2).
Figure 24: Samples grouping according to Bray-Curtis similarity index (Seawater 1)
Subsequently SIMPER analysis was used to examine which OTUs were important for
grouping within and across "no" and "npk" groups. In specific, which OTUs
abundances or changes in abundances could explain a significant proportion (>5%
each) of community similarity/dissimilarity within and between groups respectively
were examined (Table 16 & Table 17). Results showed that within group "no" three
OTUs were responsible for 51.9% of total similarity: OTU 1633 (Pseudoalteromonas
sp., 23.23% of similarity explained), OTU 449 (Vibrio sp., 15.95% of similarity
explained) and OTU 250 (Marinomonas sp., 12.72% of similarity explained). For

70
group "npk" most (93.78%) of similarity could be attributed to two OTUs: OTU 824
(Alcanivorax borkumensis, 80.96% of similarity explained) and OTU 1611
(Thalassospira lucentensis, 12.82% of similarity explained). Likewise 60.07% of
dissimilarity between "no" and "npk" groups could be attributed to changes in the
abundances of the same OTUs: an increase in OTU 824 (Alcanivorax borkumensis,
29.4% of similarity explained), a decrease in OTU 1633 (Pseudoalteromonas sp.,
12.03% of similarity explained), a decrease in OTU 449 (Vibrio sp., 6.97% of
similarity explained), an increase in OTU 1611 (Thalassospira lucentensis, 6.38% of
similarity explained) and a decrease in OTU 250 (Marinomonas sp., 5.28% of
similarity explained) after the addition of nutrients.
Table 16: The most significant OTUs in determining similarity/dissimilarity within or between
“no” and “npk” nutrient groups (Seawater 1). The examined group/groups are presented in the
first column. The ID number of the most contributing OTUs in each case is shown in the second
lane. The third and fourth lanes show the individual and cumulative community similarity or
dissimilarity respectively that can be attributed to these OTUs.
Group/Groups Most contributing
OTUs ID
Contribution
(%)
Cumulative contribution
(%)
"no"
1633 23.23
51.90 449 15.95
250 12.72
"npk" 824 80.96
93.78 1611 12.82
"no" and "npk"
824 29.40
60.07
1633 12.03
449 6.97
1611 6.38
250 5.28
Table 17: Phylogenetic affiliation of the OTUs presented in Table 1 based on the BLAST results
of the consensus sequence of each OTU against the “nr” nucleotide collection of the NCBI
database (Seawater 1).
OTU ID Phylogenetic affiliation Accession number Similarity %
1633 Pseudoalteromonas sp. HQ724506.1 100
449 Vibrio sp. KC737551.1 99
250 Marinomonas sp. JQ409370.1 99
824 Alcanivorax borkumensis KC565664.1 99
1611 Thalassospira lucentensis KC534149 99
Despite the fact that the above statistical analysis of rarefied OTUs was limited only
to treatments with inorganic nutrients, due to lack of data especially for the treatments
with lipophilic nutrients, has though provided important information on the
community structure (grouped in families) based on the treatments applied compared
to the initial consortia used for biostimulation and ABA treatments. It needs to be
stressed out that although Alcanivoracaceae is the dominant family in treatments with
inorganic nutrients, when rhamnolipids are applied community shifts to the family of
Pseudomonadaceae, nonetheless combination of Alcanivoracaceae and
Rhodospirillaceae (NPK, NPKM) is not regarded as the strongest in terms of
biodegradation rate at the particular time interval (30 days). On the contrary

71
combinations of Pseudomonadaceae and Vibrionaceae families (ULR), of
Alcanivoracaceae, Pseudomonadaceae, Flavobacteriaceae and Rhodospirillaceae
families (NPKMR), of Pseudomonadaceae, Idiomarinaceae, Moraxellaceae,
Rhodospirillaceae and Alcanivoracaceae families (ULRM) have been more effective
in terms of hydrocarbons degradation. This proves that different type of amendments
and consortia provoke different structures in the resulting biodegradation
communities and should be considered when deciding for the suitable bioremediation
strategy, however further investigation on the composition of microbial communities
with respect to time and interactions with oil hydrocarbons under different conditions
should be run in this regard. The advantage of mixed consortia over single species
consortia on hydrocarbons degradation has been proved in this study.
It can be concluded that in this study biosurfactants, in particular rhamnolipids,
accelerated the biodegradation of crude oil by making it more available to
microorganisms as expected in the two ABA treatments (ULRM & NPKMR) and the
biostimulation treatment (ULR). Bioavailability of oil hydrocarbons is the critical
factor that affects the efficiency of bioremediation in oil contaminated environments.
The ability of biosurfactants to emulsify hydrocarbon – water mixtures, to enhance
water solubility of hydrocarbons and thus increase the uptake and assimilation of
hydrocarbons by the microorganisms is highly recognized (Ron and Rosenberg, 2002;
Banat et al., 2010). Kinetics investigation of the specific degradation rate (qs) support
this conclusion since the specific degradation rate is not only growth associated but is
also enhanced by intermediate products or biosurfactants activity that possibly affects
metabolic pathway. However this was not the case for ULRM treatment in the
presence of other organic sources (lipophilic nutrients-rhamnolipids) and leads to the
conclusion that either other intermediate products delay the degradation process or
this certain community prefers utilizing organic carbon from the organic fertilizers -
something that needs to be investigated further.
Nonetheless combination of lipophilic nutrients with/without biosurfactants in
combination with a well-adapted indigenous community of hydrocarbon degraders
can be a promising tool to be used in cases where immediate response to oil spill
incidents is necessary particularly in pristine environments.

72
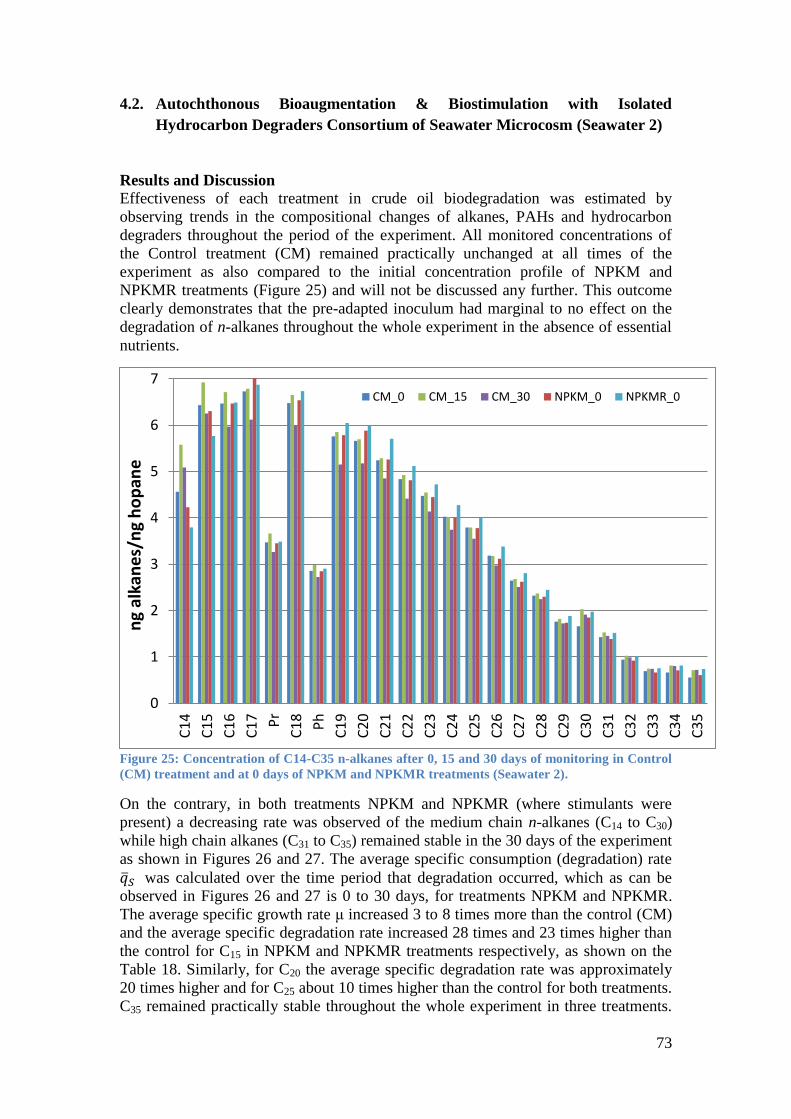
73
4.2. Autochthonous Bioaugmentation & Biostimulation with Isolated
Hydrocarbon Degraders Consortium of Seawater Microcosm (Seawater 2)
Results and Discussion
Effectiveness of each treatment in crude oil biodegradation was estimated by
observing trends in the compositional changes of alkanes, PAHs and hydrocarbon
degraders throughout the period of the experiment. All monitored concentrations of
the Control treatment (CM) remained practically unchanged at all times of the
experiment as also compared to the initial concentration profile of NPKM and
NPKMR treatments (Figure 25) and will not be discussed any further. This outcome
clearly demonstrates that the pre-adapted inoculum had marginal to no effect on the
degradation of n-alkanes throughout the whole experiment in the absence of essential
nutrients.
Figure 25: Concentration of C14-C35 n-alkanes after 0, 15 and 30 days of monitoring in Control
(CM) treatment and at 0 days of NPKM and NPKMR treatments (Seawater 2).
On the contrary, in both treatments NPKM and NPKMR (where stimulants were
present) a decreasing rate was observed of the medium chain n-alkanes (C14 to C30)
while high chain alkanes (C31 to C35) remained stable in the 30 days of the experiment
as shown in Figures 26 and 27. The average specific consumption (degradation) rate
was calculated over the time period that degradation occurred, which as can be
observed in Figures 26 and 27 is 0 to 30 days, for treatments NPKM and NPKMR.
The average specific growth rate μ increased 3 to 8 times more than the control (CM)
and the average specific degradation rate increased 28 times and 23 times higher than
the control for C15 in NPKM and NPKMR treatments respectively, as shown on the
Table 18. Similarly, for C20 the average specific degradation rate was approximately
20 times higher and for C25 about 10 times higher than the control for both treatments.
C35 remained practically stable throughout the whole experiment in three treatments.
0
1
2
3
4
5
6
7
C1
4
C1
5
C1
6
C1
7 Pr
C1
8
Ph
C1
9
C2
0
C2
1
C2
2
C2
3
C2
4
C2
5
C2
6
C2
7
C2
8
C2
9
C3
0
C3
1
C3
2
C3
3
C3
4
C3
5
ng
alka
ne
s/n
g h
op
ane
CM_0 CM_15 CM_30 NPKM_0 NPKMR_0

74
On the contrary biomarkers Pristane and Phytane were also degraded by 3 and 12
times higher than the control, as seen for the treatments NPKM and NPKMR
respectively.
Figure 26: Concentration of C14-C35 n-alkanes after 0, 5, 15 and 30 days of monitoring in
NPKM treatment (Seawater 2).
Figure 27: Concentration of C14-C35 n-alkanes after 0, 5, 15 and 30 days of monitoring in
NPKMR treatment (Seawater 2).
Low molecular weight PAHs (fluorene & dibenzothiothene) exhibited a lower
specific degradation rate compared to n-alkanes whereas the concentration of the
0
1
2
3
4
5
6
7
8C
14
C1
5
C1
6
C1
7 Pr
C1
8
Ph
C1
9
C2
0
C2
1
C2
2
C2
3
C2
4
C2
5
C2
6
C2
7
C2
8
C2
9
C3
0
C3
1
C3
2
C3
3
C3
4
C3
5
ng
alka
ne
s/n
g h
op
ane
NPKM
day 0 day 5 day 15 day 30
0
1
2
3
4
5
6
7
8
C1
4
C1
5
C1
6
C1
7 Pr
C1
8
Ph
C1
9
C2
0
C2
1
C2
2
C2
3
C2
4
C2
5
C2
6
C2
7
C2
8
C2
9
C3
0
C3
1
C3
2
C3
3
C3
4
C3
5
ng
alka
ne
s/n
g h
op
ane
NPKMR
day 0 day 5 day 15 day 30

75
higher molecular weight PAHs (phenanthrene & chrysene) remained practically stable
(at least 15 days for phenanthrene) as shown in Figures 28 and 29.
Figure 28: Concentration of fluorene, dibenzothiophene, phenanthrene and chrysene after 0, 5,
15 and 30 days of monitoring in NPKM treatment (Seawater 2).
Figure 29: Concentration of fluorene, dibenzothiophene, phenanthrene and chrysene after 0, 5,
15 and 30 days of monitoring in NPKMR treatment (Seawater 2).
Specific degradation rate of PAHs is much slower when compared to n-alkanes as
shown in Table 19. Saturated fraction is depleted to greater extent than aromatics
fraction and the degradation rate follows the pattern from high to low: C15 > C20 >
C25 > (Pristane, Phytane) > C30 > (PAHs).
Pristane and Phytane have often been used as conserved internal markers in
biodegradation index; however, especially in the NPKMR treatment, we observe that
both compounds were completely degraded within 30 days as shown in Figure 27 and
Table 18 and thus, they are unreliable as biodegradation index and should not be used.
0.00
0.04
0.08
0.12
0.16
Fluorene Dibenzothiophene Phenanthrene Chrysene
ng
aro
mat
ics/
ng
ho
pan
e
NPKM
day0 day5
day15 day30
0.00
0.04
0.08
0.12
0.16
Fluorene Dibenzothiophene Phenanthrene Chrysene
ng
aro
mat
ics/
ng
ho
pan
e
NPKMR day0 day5
day15 day30

76
Table 18: Specific growth and degradation rate of the selected alkanes (Seawater 2)
Treatment μ
(1/h)
qs (μg/cells h)
C15 C20 C25 C30 Pristane Phytane
CM 0.011 9 24 12 ~0 10 6
NPKM 0.031 250 218 121 31 29 21
NPKMR 0.083 196 197 128 41 116 92
Table 19: Specific degradation rate of the selected PAHs (Seawater 2)
Treatment qs (μg/cells h)
Fluorene Dibenzothiothene Phenanthrene Chrysene
CM ~0 ~0 ~0 0
NPKM 0.97 3.94 2.15 0
NPKMR 1.04 3.06 1.05 0
Figure 30: Alkanes % depletion and microbial growth curve between different treatments
(NPKM and NPKMR) through 30 days of monitoring (Seawater 2).
Percent depletion of n-alkanes fraction compared to microbial growth between NPKM
and NPKMR treatments (as seen in Figure 30) depicts that the depletion of n-alkanes
is a function of oil degrading bacteria augmentation. In particular by applying certain
nutrients amendments, population of oil degrading bacteria was increased as was
verified by the MPN method contrary to the no nutrients amendment-control (reached
103 cells/mL at the end of the experiment). Hydrocarbon degraders population in
NPKMR microcosms reached 106 cells/mL (SE for all values ranged from 1.89 to
2.04) within 30 days where nearly complete degradation above 90% was achieved. On
the contrary, in the NPKM microcosm hydrocarbon degraders population reached 104
1E+02
1E+03
1E+04
1E+05
1E+06
0
10
20
30
40
50
60
70
80
90
100
5 15 30
MP
N (
cells
/mL)
(%)
Dep
leti
on
of
n-a
lkan
es (
C1
4-C
35)
Time (days)
NPKM NPKMR NPKM NPKMR

77
cells/mL (SE for all values ranged from 1.89 to 2.03) and total degradation reached
77%. When biosurfactants were applied in the NPKMR treatment the population of
hydrocarbon degrading bacteria was favored within 5 days according to MPN
estimations.
Figure 31: Concentration profiles of selected n-alkanes and PAHs compounds in NPKM and
NPKMR treatments (Seawater 2).
A comparison of the n-alkanes and PAHs concentration profiles (Figures 26-29 and
31) after crude oil application confirmed that substrate (oil) consumption rate was
considerably higher when nutrients and biosurfactant were jointly applied.
Particularly saturated fraction in crude oil was entirely consumed in almost 5 days in
the NPKMR amendment that inorganic nutrients and biosurfactant were used
simultaneously. The biodegradation almost reached 50% within 5 days after the initial
application of biostimulants and 70% after 15 days in the NPKMR amendment.
0
2
4
6
8
0 10 20 30
ng
alka
ne
s/n
g h
op
ane
t (days)
C15
NPKM NPKMR
0
2
4
6
8
0 10 20 30
ng
alka
ne
s/n
g h
op
ane
t (days)
C20
NPKM NPKMR
0
1
2
3
4
5
0 10 20 30
ng
alka
ne
s/n
g h
op
ane
t (days)
C25 NPKM NPKMR
0
1
1
2
2
3
0 10 20 30
ng
alka
nes
/ng
ho
pan
e
t (days)
C30 NPKM NPKMR
0.00
0.01
0.02
0.03
0.04
0.05
0 10 20 30
ng
aro
mat
ics/
ng
ho
pan
e
t (days)
Fluorene
NPKM NPKMR
0.00
0.03
0.06
0.09
0.12
0.15
0 10 20 30
ng
aro
mat
ics\
ng
ho
pan
e
t (days)
Dibenzothiophene
NPKM NPKMR

78
Hence biosurfactant's capability to speed up oil biodegradation by emulsifying
hydrocarbon – water mixtures and thus increasing its bioavailability is demonstrated
in the present work (Banat et al., 2000; Southam et al., 2001; Mulligan, 2005; Ron
and Rosenberg, 2010). Kinetics investigation of the specific degradation rate qS
supports this conclusion since it is not only growth associated but was also enhanced
by intermediate products or biosurfactants activity that possibly affected the metabolic
pathway.
Figure 32: Phylogenetic tree of bacteria isolated during NPKM treatment (Seawater 2).
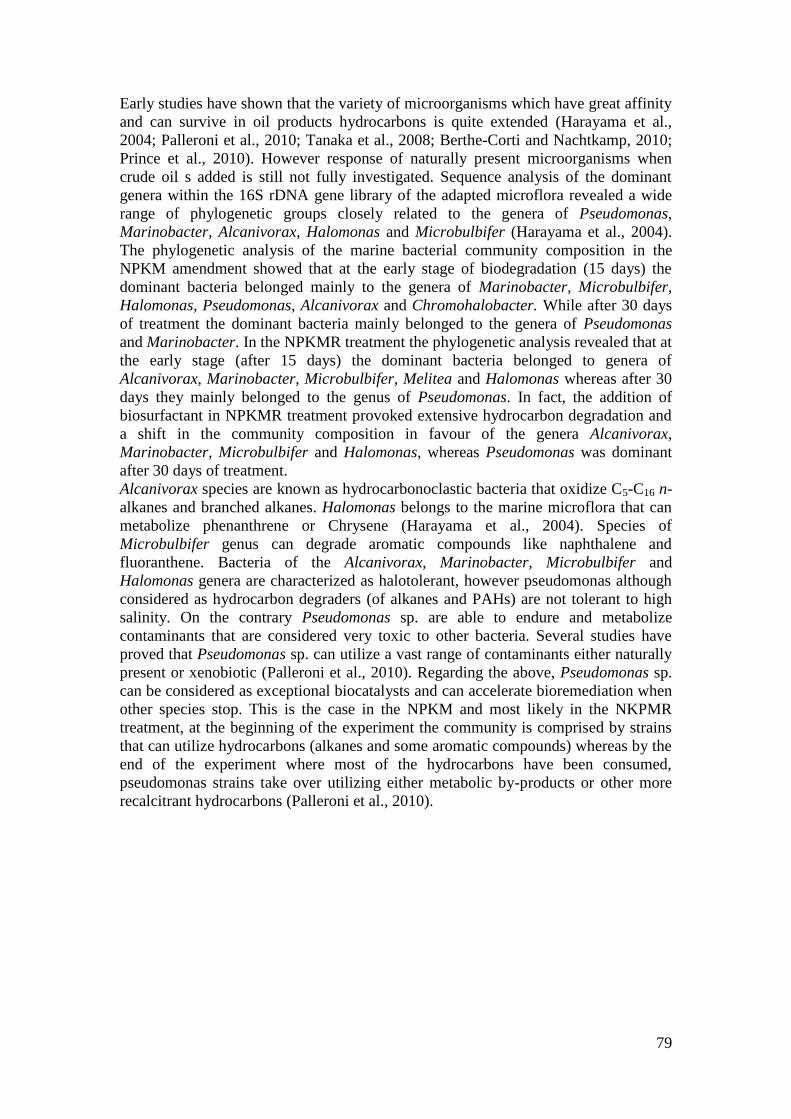
79
Early studies have shown that the variety of microorganisms which have great affinity
and can survive in oil products hydrocarbons is quite extended (Harayama et al.,
2004; Palleroni et al., 2010; Tanaka et al., 2008; Berthe-Corti and Nachtkamp, 2010;
Prince et al., 2010). However response of naturally present microorganisms when
crude oil s added is still not fully investigated. Sequence analysis of the dominant
genera within the 16S rDNA gene library of the adapted microflora revealed a wide
range of phylogenetic groups closely related to the genera of Pseudomonas,
Marinobacter, Alcanivorax, Halomonas and Microbulbifer (Harayama et al., 2004).
The phylogenetic analysis of the marine bacterial community composition in the
NPKM amendment showed that at the early stage of biodegradation (15 days) the
dominant bacteria belonged mainly to the genera of Marinobacter, Microbulbifer,
Halomonas, Pseudomonas, Alcanivorax and Chromohalobacter. While after 30 days
of treatment the dominant bacteria mainly belonged to the genera of Pseudomonas
and Marinobacter. In the NPKMR treatment the phylogenetic analysis revealed that at
the early stage (after 15 days) the dominant bacteria belonged to genera of
Alcanivorax, Marinobacter, Microbulbifer, Melitea and Halomonas whereas after 30
days they mainly belonged to the genus of Pseudomonas. In fact, the addition of
biosurfactant in NPKMR treatment provoked extensive hydrocarbon degradation and
a shift in the community composition in favour of the genera Alcanivorax,
Marinobacter, Microbulbifer and Halomonas, whereas Pseudomonas was dominant
after 30 days of treatment.
Alcanivorax species are known as hydrocarbonoclastic bacteria that oxidize C5-C16 n-
alkanes and branched alkanes. Halomonas belongs to the marine microflora that can
metabolize phenanthrene or Chrysene (Harayama et al., 2004). Species of
Microbulbifer genus can degrade aromatic compounds like naphthalene and
fluoranthene. Bacteria of the Alcanivorax, Marinobacter, Microbulbifer and
Halomonas genera are characterized as halotolerant, however pseudomonas although
considered as hydrocarbon degraders (of alkanes and PAHs) are not tolerant to high
salinity. On the contrary Pseudomonas sp. are able to endure and metabolize
contaminants that are considered very toxic to other bacteria. Several studies have
proved that Pseudomonas sp. can utilize a vast range of contaminants either naturally
present or xenobiotic (Palleroni et al., 2010). Regarding the above, Pseudomonas sp.
can be considered as exceptional biocatalysts and can accelerate bioremediation when
other species stop. This is the case in the NPKM and most likely in the NKPMR
treatment, at the beginning of the experiment the community is comprised by strains
that can utilize hydrocarbons (alkanes and some aromatic compounds) whereas by the
end of the experiment where most of the hydrocarbons have been consumed,
pseudomonas strains take over utilizing either metabolic by-products or other more
recalcitrant hydrocarbons (Palleroni et al., 2010).

80
Figure 33: Phylogenetic tree o of bacteria isolated during NPKMR treatment (Seawater 2).
Microbial communities’ structure is affected and shifts depending on these
interactions between surfactants and other stimulants. Thus identifying the key
organisms that play role in different bioremediation treatments is very important for
understanding, evaluating and further decide on the best in situ bioremediation
strategy.

81
4.3. Landfarming of Oil Polluted Beach Sand through Biostimulation (Sand 1)
Results and Discussion
Evaluation of the effectiveness of each treatment on crude oil biodegradation rate was
estimated in terms of alkanes, PAHs and hydrocarbon degraders compositional
changes throughout the whole period of the experiment. Figures 34-36 represent total
depletion rate of the saturated fraction of n-alkanes (C12-C35) of control treatment (C)
as well as for treatments NPK and ULR at different time intervals of the experiment.
Control, in which hydrocarbon degraders population was not further increased, had no
significant effect on the degradation rate at the first 30 days of treatment (Figure 34).
NPK treatment with inorganic nutrients and ULR treatment were more successive in
terms of time and quantity of hydrocarbons depleted; about 48% and 58 % of n-
alkanes were removed in 15 days of the experimental period respectively, whereas in
control treatment depletion of n-alkanes reached 58% after 30 days of treatment.
Moreover the degradation rate of NPK and ULR reached equally 97% within 30 days
and 99% at the end of the experiment. On the contrary in control treatment depletion
of n-alkanes reached 97% after 45 days of treatment.
Figure 34: Concentration of C12-C35 n-alkanes after 0, 15, 30 and 45 days of monitoring in
Control treatment (Sand 1).
0
2
4
6
8
10
12
14
16
18
C1
2C
13
C1
4C
15
C1
6C
17 Pr
C1
8P
hC
19
C2
0C
21
C2
2C
23
C2
4C
25
C2
6C
27
C2
8C
29
C3
0C
31
C3
2C
33
C3
4C
35
ng
alka
ne
s/n
g h
op
ane
Control
0 day 15 days 30 days 45 days

82
Figure 35: Concentration of C12-C35 n-alkanes after 0, 15, 30 and 45 days of monitoring in NPK
treatment (Sand 1).
Figure 36: Concentration of C12-C35 n-alkanes after 0, 15, 30 and 45 days of monitoring in ULR
treatment (Sand 1).
As it is observed from Figures 35&36 in treatment ULR, (where Rhamnolipids were
added) and in treatment NPK (inorganic nutrients) there is high decreasing rate for
medium chain n-alkanes (C12 to C30) within 15 days of the experiment as well as for
high chain alkanes (C31 to C35) in almost 30 days of the experiment. In control
treatment instead medium to high chain alkanes (C25 to C35) remain stable for the
whole duration of the experiment as shown in Figure 34.
0
2
4
6
8
10
12
14
16
18
20
C1
2C
13
C1
4C
15
C1
6C
17 Pr
C1
8P
hC
19
C2
0
C2
1C
22
C2
3C
24
C2
5C
26
C2
7
C2
8C
29
C3
0C
31
C3
2C
33
C3
4
C3
5
ng
alka
ne
s/n
g h
op
ane
NPK
0 day 15 days 30 days 45 days
0
5
10
15
20
25
C1
2
C1
3
C1
4
C1
5
C1
6
C1
7 Pr
C1
8
Ph
C1
9
C2
0
C2
1
C2
2
C2
3
C2
4
C2
5
C2
6
C2
7
C2
8
C2
9
C3
0
C3
1
C3
2
C3
3
C3
4
C3
5
ng
alka
ne
s/n
g h
op
ane
ULR
0 day 15 days 30 days 45 days

83
Table 20: Specific growth and degradation rate of the selected alkanes (Sand 1)
Treatment μ
(1/h)
qs (μg/cells h)
C15 C20 C25 C30 Pristane Phytane
Control 0.005 61.3 50.6 27.6 13.3 30.2 34
NPK 0.014 201.1 161.6 98.2 47.7 88.4 99.3
ULR 0.017 202.7 145.9 89.5 44 89.4 102.5
The average specific consumption (degradation) rate was calculated over the time
period that degradation occurred, which for NPK and ULR is 030 days and for
Control is 045 days. If we make the comparison between treatments (Table 20) we
can estimate that specific degradation rate for C15, C20, C25 and C30 in NPK and ULR
treatments is 3-3.5 times higher than control whereas C35 remained practically stable.
By the end of the experiment specific degradation rates for C15, C20, C25 and C30 is
equal for all treatments, however in the presence of specific nutrients (treatments
NPK and ULR) specific degradation rates are accelerated within 15 days. Especially
for treatments NPK and ULR (biosurfactant is present) specific growth rate μ equals
to 0.014 (1/h) and 0.017(1/h) respectively, and is approximately 3-3.5 times higher
than the one of the control treatment, which implies a growth associated degradation
rate. Branched alkanes like Pristane and Phytane are also degraded by 3 times higher
in both NPK and ULR treatments compared to control. Regarding the above
observations, this trend implies that at early stage of the experiment light
hydrocarbons, which are more water soluble are depleted at about the same level in all
treatments, however depletion rate of medium, high and branched alkanes that are less
accessible is accelerated in treatments were nutrients are added later on.
Figure 37: Concentration of fluorene, dibenzothiophene, phenanthrene and chrysene after 0, 15,
30 and 45 days of monitoring in Control treatment (Sand 1).
0.0
0.1
0.2
0.3
0.4
0.5
0.6
0.7
Fluorene Dibenzothiophene Phenanthrene Chrysene
ng
aro
mat
ics/
ng
ho
pan
e
Control
0 day
15 days
30 days
45 days
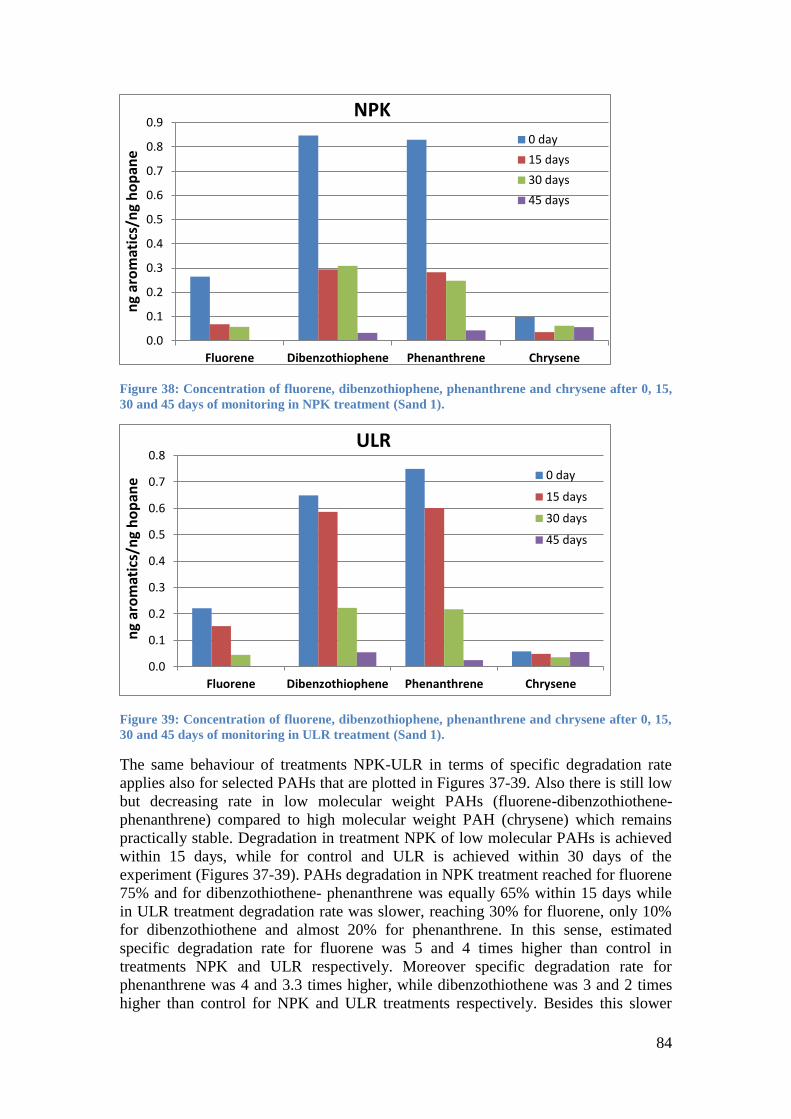
84
Figure 38: Concentration of fluorene, dibenzothiophene, phenanthrene and chrysene after 0, 15,
30 and 45 days of monitoring in NPK treatment (Sand 1).
Figure 39: Concentration of fluorene, dibenzothiophene, phenanthrene and chrysene after 0, 15,
30 and 45 days of monitoring in ULR treatment (Sand 1).
The same behaviour of treatments NPK-ULR in terms of specific degradation rate
applies also for selected PAHs that are plotted in Figures 37-39. Also there is still low
but decreasing rate in low molecular weight PAHs (fluorene-dibenzothiothene-
phenanthrene) compared to high molecular weight PAH (chrysene) which remains
practically stable. Degradation in treatment NPK of low molecular PAHs is achieved
within 15 days, while for control and ULR is achieved within 30 days of the
experiment (Figures 37-39). PAHs degradation in NPK treatment reached for fluorene
75% and for dibenzothiothene- phenanthrene was equally 65% within 15 days while
in ULR treatment degradation rate was slower, reaching 30% for fluorene, only 10%
for dibenzothiothene and almost 20% for phenanthrene. In this sense, estimated
specific degradation rate for fluorene was 5 and 4 times higher than control in
treatments NPK and ULR respectively. Moreover specific degradation rate for
phenanthrene was 4 and 3.3 times higher, while dibenzothiothene was 3 and 2 times
higher than control for NPK and ULR treatments respectively. Besides this slower
0.0
0.1
0.2
0.3
0.4
0.5
0.6
0.7
0.8
0.9
Fluorene Dibenzothiophene Phenanthrene Chrysene
ng
aro
mat
ics/
ng
ho
pan
e
NPK
0 day
15 days
30 days
45 days
0.0
0.1
0.2
0.3
0.4
0.5
0.6
0.7
0.8
Fluorene Dibenzothiophene Phenanthrene Chrysene
ng
aro
mat
ics/
ng
ho
pan
e
ULR
0 day
15 days
30 days
45 days
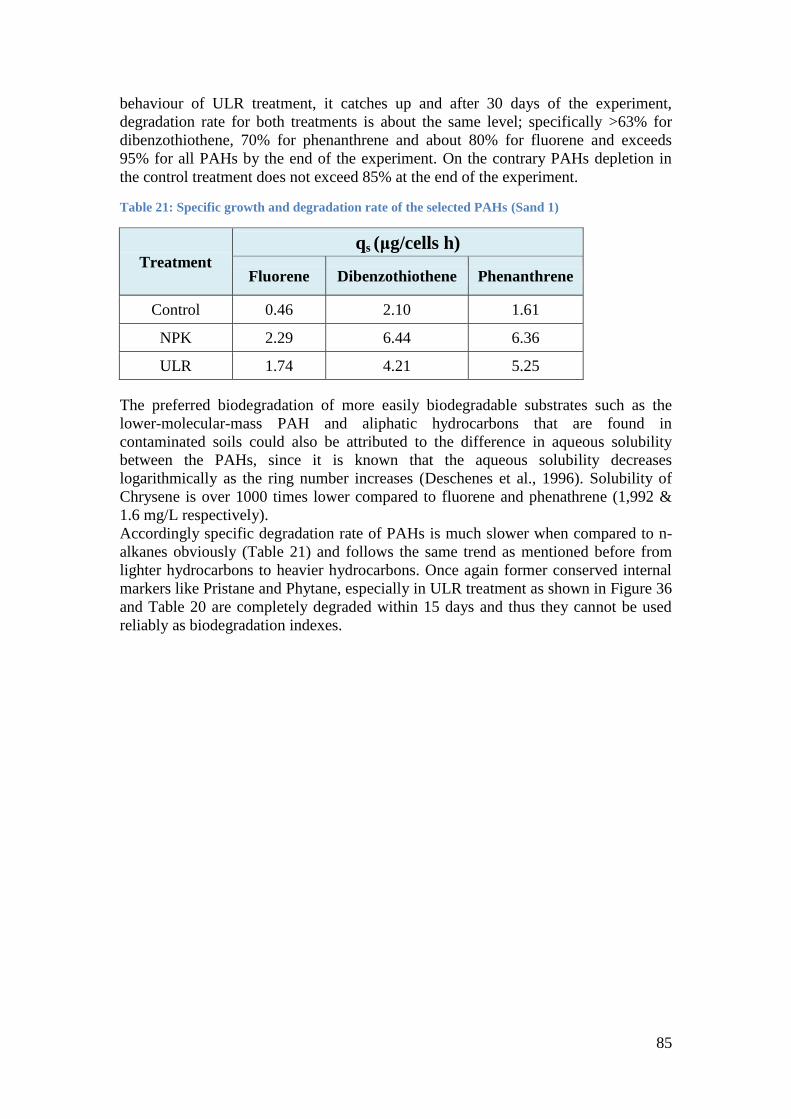
85
behaviour of ULR treatment, it catches up and after 30 days of the experiment,
degradation rate for both treatments is about the same level; specifically >63% for
dibenzothiothene, 70% for phenanthrene and about 80% for fluorene and exceeds
95% for all PAHs by the end of the experiment. On the contrary PAHs depletion in
the control treatment does not exceed 85% at the end of the experiment.
Table 21: Specific growth and degradation rate of the selected PAHs (Sand 1)
Treatment
qs (μg/cells h)
Fluorene Dibenzothiothene Phenanthrene
Control 0.46 2.10 1.61
NPK 2.29 6.44 6.36
ULR 1.74 4.21 5.25
The preferred biodegradation of more easily biodegradable substrates such as the
lower-molecular-mass PAH and aliphatic hydrocarbons that are found in
contaminated soils could also be attributed to the difference in aqueous solubility
between the PAHs, since it is known that the aqueous solubility decreases
logarithmically as the ring number increases (Deschenes et al., 1996). Solubility of
Chrysene is over 1000 times lower compared to fluorene and phenathrene (1,992 &
1.6 mg/L respectively).
Accordingly specific degradation rate of PAHs is much slower when compared to n-
alkanes obviously (Table 21) and follows the same trend as mentioned before from
lighter hydrocarbons to heavier hydrocarbons. Once again former conserved internal
markers like Pristane and Phytane, especially in ULR treatment as shown in Figure 36
and Table 20 are completely degraded within 15 days and thus they cannot be used
reliably as biodegradation indexes.
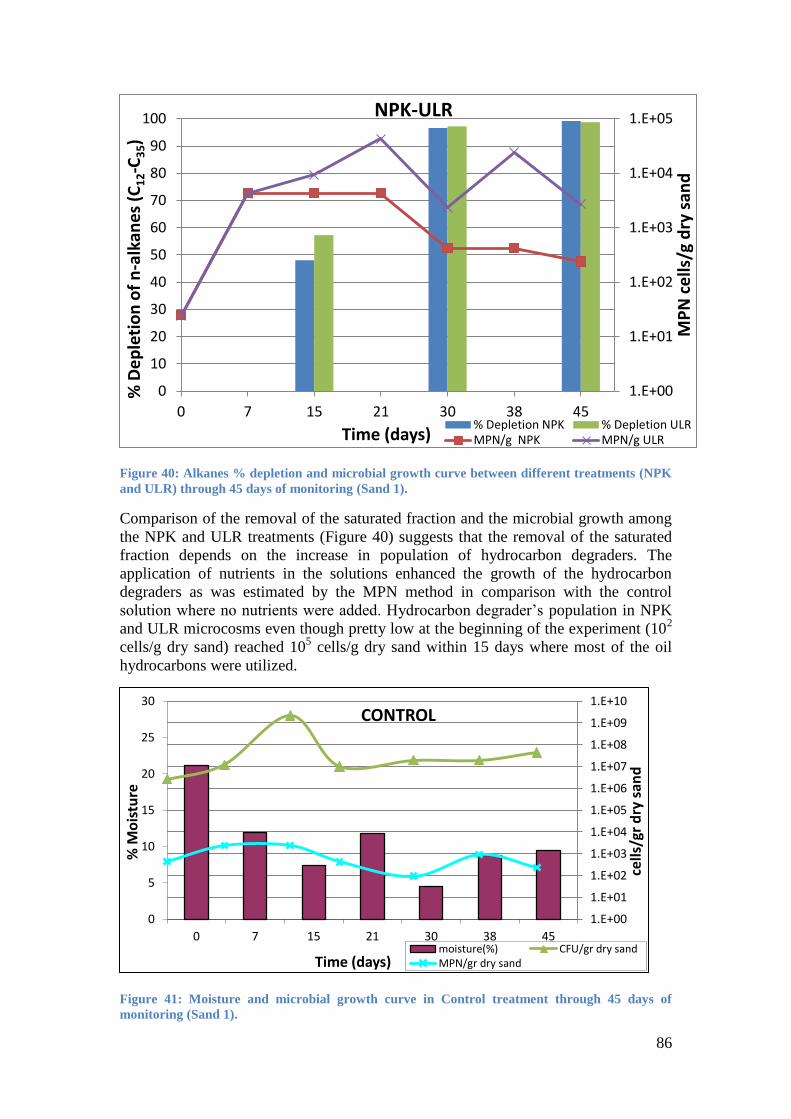
86
Figure 40: Alkanes % depletion and microbial growth curve between different treatments (NPK
and ULR) through 45 days of monitoring (Sand 1).
Comparison of the removal of the saturated fraction and the microbial growth among
the NPK and ULR treatments (Figure 40) suggests that the removal of the saturated
fraction depends on the increase in population of hydrocarbon degraders. The
application of nutrients in the solutions enhanced the growth of the hydrocarbon
degraders as was estimated by the MPN method in comparison with the control
solution where no nutrients were added. Hydrocarbon degrader’s population in NPK
and ULR microcosms even though pretty low at the beginning of the experiment (102
cells/g dry sand) reached 105 cells/g dry sand within 15 days where most of the oil
hydrocarbons were utilized.
Figure 41: Moisture and microbial growth curve in Control treatment through 45 days of
monitoring (Sand 1).
1.E+00
1.E+01
1.E+02
1.E+03
1.E+04
1.E+05
0
10
20
30
40
50
60
70
80
90
100
0 7 15 21 30 38 45
MP
N c
ells
/g d
ry s
and
% D
ep
leti
on
of
n-a
lkan
es
(C1
2-C
35)
Time (days)
NPK-ULR
% Depletion NPK % Depletion ULRMPN/g NPK MPN/g ULR
1.E+00
1.E+01
1.E+02
1.E+03
1.E+04
1.E+05
1.E+06
1.E+07
1.E+08
1.E+09
1.E+10
0
5
10
15
20
25
30
0 7 15 21 30 38 45
cells
/gr
dry
san
d
% M
ois
ture
Time (days)
CONTROL
moisture(%) CFU/gr dry sandMPN/gr dry sand

87
Figure 42: Moisture and microbial growth curve in NPK treatment through 45 days of
monitoring (Sand 1).
Figure 43: Moisture and microbial growth curve in ULR treatment through 45 days of
monitoring (Sand 1).
Water content availability for microbial growth and metabolism can be rate limiting in
hydrocarbons landfarming. Even though as reported by Calvo et al., 2009 the addition
of surfactant to sandy soil can increase retention of soil moisture over longer time,
moisture content in our case dropped below 10% through most of the time of the
experiment, thus microbial activity was kept low and finally decreased after 30 days.
The application of nutrients and biosurfactants in the solutions enhanced the growth
of the hydrocarbon degraders within 15 days as it was estimated by the MPN method
in NPK and ULR treatments even though moisture content was pretty low.
A comparison of the n-alkanes and PAHs profiles (Figures 34-39 and 44) after oil
application revealed that application of fertilizer plus biosurfactant can favour the
degradation of crude oil in indigenous communities that lack essential nutrients.
1.E+00
1.E+01
1.E+02
1.E+03
1.E+04
1.E+05
1.E+06
1.E+07
1.E+08
1.E+09
1.E+10
0
5
10
15
20
25
30
0 7 15 21 30 38 45
cells
/gr
dry
san
d
% M
ois
ture
Time (days)
NPK
moisture(%) CFU/gr dry sand
MPN/gr dry sand
1.E+00
1.E+01
1.E+02
1.E+03
1.E+04
1.E+05
1.E+06
1.E+07
1.E+08
1.E+09
1.E+10
0
5
10
15
20
25
30
0 7 15 21 30 38 45
cells
/gr
dry
san
d
% M
ois
ture
Time (days)
ULR
moisture(%) CFU/gr dry sand
MPN/gr dry sand
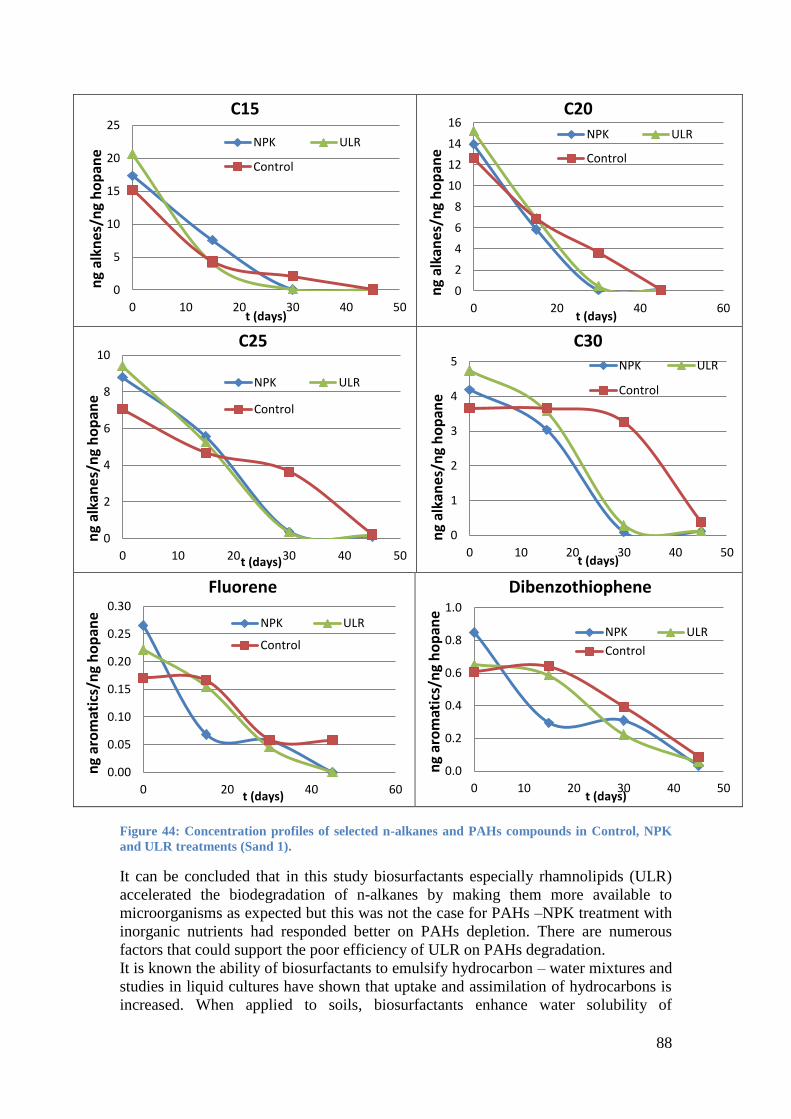
88
Figure 44: Concentration profiles of selected n-alkanes and PAHs compounds in Control, NPK
and ULR treatments (Sand 1).
It can be concluded that in this study biosurfactants especially rhamnolipids (ULR)
accelerated the biodegradation of n-alkanes by making them more available to
microorganisms as expected but this was not the case for PAHs –NPK treatment with
inorganic nutrients had responded better on PAHs depletion. There are numerous
factors that could support the poor efficiency of ULR on PAHs degradation.
It is known the ability of biosurfactants to emulsify hydrocarbon – water mixtures and
studies in liquid cultures have shown that uptake and assimilation of hydrocarbons is
increased. When applied to soils, biosurfactants enhance water solubility of
0
5
10
15
20
25
0 10 20 30 40 50
ng
alkn
es/n
g h
op
ane
t (days)
C15
NPK ULR
Control
0
2
4
6
8
10
12
14
16
0 20 40 60
ng
alka
nes
/ng
ho
pan
e
t (days)
C20
NPK ULR
Control
0
2
4
6
8
10
0 10 20 30 40 50
ng
alka
nes
/ng
ho
pan
e
t (days)
C25
NPK ULR
Control
0
1
2
3
4
5
0 10 20 30 40 50
ng
alka
nes
/ng
ho
pan
e
t (days)
C30 NPK ULR
Control
0.00
0.05
0.10
0.15
0.20
0.25
0.30
0 20 40 60
ng
aro
mat
ics/
ng
ho
pan
e
t (days)
Fluorene
NPK ULR
Control
0.0
0.2
0.4
0.6
0.8
1.0
0 10 20 30 40 50
ng
aro
mat
ics/
ng
ho
pan
e
t (days)
Dibenzothiophene
NPK ULR
Control

89
hydrocarbons and thus increase the displacement of oily substances from soil
particles. However, reports of biosurfactants effects on bioremediation in
contaminated soils were inconsistent (Kosaric, 2001; Ron and Rosenberg, 2002;
Calvo et al., 2009; Banat et al., 2010; Ron and Rosenberg, 2010; Ward, 2010).
Rhamnolipids efficiency in desorption of hydrocarbons has been subjected into many
studies with diverse results, while the complex interactions taking place in soil
between oil diverse hydrophobic molecules and different types of soil particulates
makes difficult to interpret and characterize the roles of biosurfactants in oil
bioremediation (Ward, 2010). As mentioned by Noordman et al., 2002 biodegradation
process efficiency in soil and the specific mechanism of rhamnolipid’s action highly
depend on substrates physicochemical interactions within certain matrix. Regarding
this, they showed that rhamnolipid and several other surfactants stimulated the
degradation of hexadecane to a greater extent when it was entrapped in matrices with
pore-sizes larger than 300 nm rather than in matrix with smaller pore-sizes or in sea
sand (Noordman et al., 2002).
Chun-jiang et al., 2011 have showed that the variation of desorption of contaminants
is also closely related with the soil DOM and the presence of more salt ions made
phenanthrene more persistent on the solid phase and adversely affected its desorption
from contaminated soil. Moreover many researchers support that long term
bioremediation inefficiency of rhamnolipids is caused by the biodegradation of itself
(Ward, 2010). On the other hand solubilization of high concentrations of PAH could
be toxic to the soil microorganisms (Deschenes et al., 1996) as well as alter the
composition of the microbial populations responsible for hydrocarbon mineralization.
As mentioned before soil hydrocarbon degradation may also be limited by the
available water for microbial growth and metabolism.
Other studies have confirmed also that inorganic nutrients are more suitable to fine
grained shorelines rather than to coarse-grained shorelines that lipophilic nutrients
could be more efficient (Nikolopoulou and Kalogerakis, 2011). Inconsistent
behaviour of ULR between the two oil fractions (alkanes-PAHs) compared to NPK
treatment could support this conclusion although in previous studies lipophilic
nutrients have effectively promoted oil degradation in liquid microcosms
(Nikolopoulou et al., 2007; Nikolopoulou and Kalogerakis, 2008). Still overall ULR
treatment performance suggests that the presence of biosurfactant could possibly have
contributed to utilization of lipophilic nutrients by making them more available to soil
microorganisms.
As has already been mentioned, bioavailability of hydrophobic compounds in
contaminated soils is often the rate-limiting step in the process and the efficiency of
biosurfactants or other rate limiting co-substrates mainly could be attributed to the
interactions between target organic compounds, bacterial species and surfactants.
Hence further investigation should be done in this regard and more possible
combinations of different types of nutrients and biosurfactants on bioremediation of a
variety of oil contaminated shorelines should be tested.

90
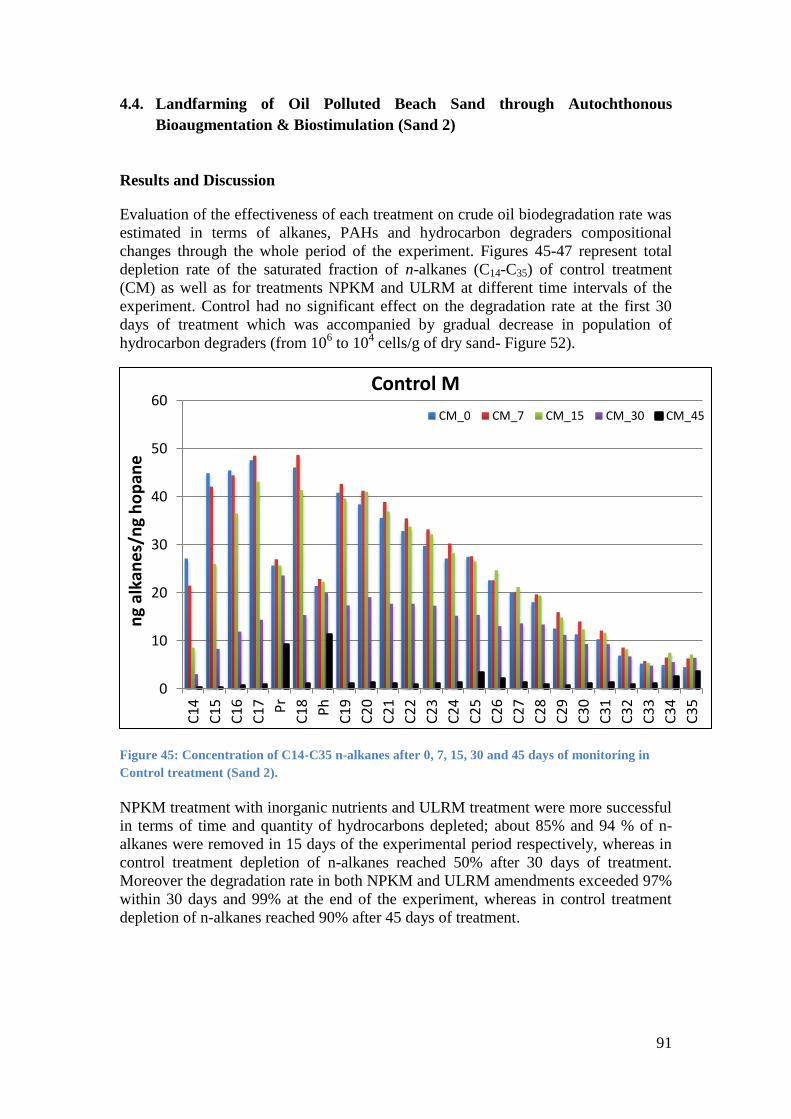
91
4.4. Landfarming of Oil Polluted Beach Sand through Autochthonous
Bioaugmentation & Biostimulation (Sand 2)
Results and Discussion
Evaluation of the effectiveness of each treatment on crude oil biodegradation rate was
estimated in terms of alkanes, PAHs and hydrocarbon degraders compositional
changes through the whole period of the experiment. Figures 45-47 represent total
depletion rate of the saturated fraction of n-alkanes (C14-C35) of control treatment
(CM) as well as for treatments NPKM and ULRM at different time intervals of the
experiment. Control had no significant effect on the degradation rate at the first 30
days of treatment which was accompanied by gradual decrease in population of
hydrocarbon degraders (from 106 to 10
4 cells/g of dry sand- Figure 52).
Figure 45: Concentration of C14-C35 n-alkanes after 0, 7, 15, 30 and 45 days of monitoring in
Control treatment (Sand 2).
NPKM treatment with inorganic nutrients and ULRM treatment were more successful
in terms of time and quantity of hydrocarbons depleted; about 85% and 94 % of n-
alkanes were removed in 15 days of the experimental period respectively, whereas in
control treatment depletion of n-alkanes reached 50% after 30 days of treatment.
Moreover the degradation rate in both NPKM and ULRM amendments exceeded 97%
within 30 days and 99% at the end of the experiment, whereas in control treatment
depletion of n-alkanes reached 90% after 45 days of treatment.
0
10
20
30
40
50
60
C1
4
C1
5
C1
6
C1
7 Pr
C1
8
Ph
C1
9
C2
0
C2
1
C2
2
C2
3
C2
4
C2
5
C2
6
C2
7
C2
8
C2
9
C3
0
C3
1
C3
2
C3
3
C3
4
C3
5
ng
alka
ne
s/n
g h
op
ane
Control M
CM_0 CM_7 CM_15 CM_30 CM_45

92
Figure 46: Concentration of C14-C35 n-alkanes after 0, 7, 15, 30 and 45 days of monitoring in
NPK treatment (Sand 2).
Figure 47: Concentration of C14-C35 n-alkanes after 0, 7, 15, 30 and 45 days of monitoring in
ULR treatment (Sand 2).
Medium chain n-alkanes (C14 to C30) as observed from Figures 46&47 in treatment
NPKM (inorganic nutrients) have been decreased to a great extent within almost a
week, whereas in treatment ULRM, (where Rhamnolipids were added) are depleted in
an even higher rate as well as high chain alkanes (C31 to C35) within 2 weeks of the
experiment followed by NPKM treatment in efficiency. Most of the n-alkanes fraction
was lost after 30 days for both treatments (NPKM-ULRM). On the contrary medium
0
10
20
30
40
50
60
70
C1
4
C1
5
C1
6
C1
7 Pr
C1
8
Ph
C1
9
C2
0
C2
1
C2
2
C2
3
C2
4
C2
5
C2
6
C2
7
C2
8
C2
9
C3
0
C3
1
C3
2
C3
3
C3
4
C3
5
ng
alka
ne
s/n
g h
op
ane
NPKM
NPKM_0 NPKM_7 NPKM_15NPKM_30 NPKM_45
0
10
20
30
40
50
60
70
C1
4
C1
5
C1
6
C1
7 Pr
C1
8
Ph
C1
9
C2
0
C2
1
C2
2
C2
3
C2
4
C2
5
C2
6
C2
7
C2
8
C2
9
C3
0
C3
1
C3
2
C3
3
C3
4
C3
5
ng
alka
ne
s/n
g h
op
ane
ULRM ULRM_0 ULRM_7 ULRM_15
ULRM_30 ULRM_45

93
to high chain alkanes (C25 to C35) in the control (Figure 45) remain stable for the most
time of the experiment and are only depleted after 45 days of the experiment. In
addition past conservative biodegradation indexes like phytane and pristine are
severely degraded in amendments NPKM-ULRM within 2 weeks compared to control
(Figures 45-47).
Table 22: Specific growth and degradation rate of the selected alkanes (Sand 2)
Treatment qs (μg/cells h)
C15 C20 C25 C30 C35 Pristane Phytane
Control M 160.7 133.7 86.6 36.9 3 59.2 36.4
NPKM 1203.8 1096.1 751.9 324.3 82.2 700.9 598.3
ULRM 1252.1 1097.2 745.5 302.7 114.4 621 512.6
When comparing the treatments (Table 22), we can estimate that specific degradation
rate for C15 in NPKM and ULRM treatments is 7 times higher than control from the
first week of the experiment, while specific degradation rate for C20, C25 and C30 is 8-
9 times higher than control for both treatments within 2 weeks. Moreover specific
degradation rate for C35 in treatments NPKM and ULRM is about 29 and 38.5 times
higher than the control respectively. By the end of the experiment specific
degradation rates for C15, C20, C25 and C30 is more or less equal for all treatments,
however in the presence of specific nutrients (treatments NPKM and ULRM) specific
degradation rates, as were estimated, are accelerated within 15 days. Branched
alkanes like Pristane and Phytane are also degraded by 12 and 17 times higher in
NPKM and by 10.5 and 14 times higher in ULRM treatments respectively when
compared to control.
Figure 48: Concentration of fluorene, dibenzothiophene, phenanthrene and chrysene after 0, 7,
15, 30 and 45 days of monitoring in Control M treatment (Sand 2).
0.0
0.2
0.4
0.6
0.8
1.0
1.2
1.4
fluorene dibenzothiophene phenanthrene chrysene
ng
aro
mat
ics/
ng
ho
pan
e
Control M 0 day
7 days
15 days
30 days
45 days

94
Figure 49: Concentration of fluorene, dibenzothiophene, phenanthrene and chrysene after 0, 7,
15, 30 and 45 days of monitoring in NPKM treatment (Sand 2).
Figure 50: Concentration of fluorene, dibenzothiophene, phenanthrene and chrysene after 0, 7,
15, 30 and 45 days of monitoring in ULRM treatment (Sand 2).
The behaviour of treatments CM, NPKM and ULRM in terms of specific degradation
rate for selected PAHs that are plotted in Figures 48-50 is different. Decreasing rate in
low molecular weight PAHs (fluorene-dibenzothiothene- phenanthrene) is still low
compared to n-alkanes and high molecular weight PAH (chrysene) remains practically
stable. PAHs degradation in NPKM treatment reached for fluorene 85% and for
dibenzothiothene- phenanthrene was 65% and 60% respectively for over 30 days. In
this sense, estimated specific degradation rate in NPKM treatment for fluorene was 3
and 2 times higher than control and ULRM treatments respectively. Moreover specific
degradation rate for phenanthrene was 3.3 and 4 times higher than control and ULRM
treatments respectively, while dibenzothiothene was equally 2.3 times higher for both
treatments (control and ULRM).
0.0
0.2
0.4
0.6
0.8
1.0
1.2
1.4
1.6
1.8
fluorene dibenzothiophene phenanthrene chrysene
ng
aro
mat
ics/
ng
ho
pan
e
NPKM 0 day
7 days
15 days
30 days
45 days
0.0
0.2
0.4
0.6
0.8
1.0
1.2
1.4
fluorene dibenzothiophene phenanthrene chrysene
ng
aro
mat
ics/
ng
ho
pan
e
ULRM 0 day
7 days
15 days
30 days
45 days

95
Table 23: Specific growth and degradation rate of the selected PAHs (Sand 2)
Treatment Fluorene Dibenzothiothene Phenanthrene
Control M 0.96 2.74 2.51
NPKM 2.86 6.38 8.34
ULRM 1.52 2.89 2.22
However in ULRM treatment degradation rate was slower, reaching 75% for fluorene,
only 50% for dibenzothiothene and almost 30% for phenanthrene, which remained at
the same level by the end of the experiment for both treatments. Contrary to above
treatments, depletion in the control for fluorene was above 60% and for
dibenzothiothene- phenanthrene was 70% and almost 30% respectively after 30 days
which by the end of the experiment reached 90% for fluorene, 83% for
dibenzothiothene and 55% for phenanthrene.
Figure 51: Alkanes % depletion and microbial growth curve between different treatments
(NPKM and ULRM) through 45 days of monitoring (Sand 2).
Comparison of the removal of the saturated fraction and the microbial growth in
ULRM treatment (Figure 51) suggests that the removal of the saturated fraction
depends on the increase in population of hydrocarbon degraders when water content is
not rate limiting. Marine heterotrophs remained relatively stable throughout the whole
duration of the experiment in the range of 108-10
9 cfus/g dry sand for all treatments.
However this was not the case for NPKM where utilization of lighter and more
accessible hydrocarbons just kept alive hydrocarbon degraders since water content in
the sand was pretty low and dropped to below 5% after 20 days (Figure 53), after
1.E+00
1.E+01
1.E+02
1.E+03
1.E+04
1.E+05
1.E+06
1.E+07
0
10
20
30
40
50
60
70
80
90
100
0 7 15 21 30 38 45
MP
N c
ells
/g d
ry s
and
% D
ep
leti
on
of
n-a
lkan
es
(C1
4-C
35)
Time (days)
NPKM-ULRM
% Depletion NPKM % Depletion ULRMMPN/g NPKM MPN/g ULRM

96
which population of hydrocarbon degraders decreased (from 106 to 10 cells/g of dry
sand) radically as was estimated by the MPN method.
Figure 52: Moisture and microbial growth curve in Control M treatment through 45 days of
monitoring (Sand 2).
Figure 53: Moisture and microbial growth curve in NPKM treatment through 45 days of
monitoring (Sand 2).
1.E+00
1.E+01
1.E+02
1.E+03
1.E+04
1.E+05
1.E+06
1.E+07
1.E+08
1.E+09
1.E+10
0
5
10
15
20
25
30
0 7 15 21 30 38 45
cells
/gr
dry
san
d
% M
ois
ture
Time (days)
CONTROL M
% moisture CFUs / gr dry sandMPN/gr dry sand
1.E+00
1.E+01
1.E+02
1.E+03
1.E+04
1.E+05
1.E+06
1.E+07
1.E+08
1.E+09
1.E+10
0
5
10
15
20
25
30
0 7 15 21 30 38 45
cells
/gr
dry
san
d
% M
ois
ture
Time (days)
NPKM
% moisture CFUs / gr dry sandMPN/gr dry sand

97
Figure 54: Moisture and microbial growth curve in ULRM treatment through 45 days of
monitoring (Sand 2).
Hydrocarbon degraders’ population profile between all treatments follows moisture
pattern (Figures 52-54). Hydrocarbon degraders were sustained for longer in ULRM
treatment especially because as reported by Calvo et al., 2009 the addition of
surfactant to sandy soil can increase retention of soil moisture over longer time. In
this situation moisture content dropped below 5% after 30 days and affected
consortium survival which led to a radical decrease in the population of hydrocarbon
degraders (107 to 10
2 cells /g of dry sand), however later moisture content was raised
above 10% but microbial population couldn’t recover (it was increased only to 103
cells /g of dry sand) by the end of the experiment. Moisture was reserved for longer
time above 10% in control treatment which had a better response on hydrocarbons
degraders population and even when only dropped for a while in the middle of the
process (20 days), population even in the end remained in the range of 104 cells /g of
dry sand. The results support that microbial growth and activity are consistent with
moisture content in soils and can be rate limiting in hydrocarbons landfarming.
As already has been mentioned biodegradation index of hydrocarbons present in
contaminated soils is a function of their aqueous solubility and increases when
aqueous solubility increases, i.e. when ring number decreases (Deschenes et al.,
1996). Water content in soil also influences solubility of adsorbed hydrocarbons from
the soil matter to the bulk liquid and further their availability to soil microorganisms.
In the case of NPKM and ULRM treatments soil moisture was the critical parameter
that inhibited hydrocarbon degraders growth and succession of alkane degradation by
more recalcitrant hydrocarbons like PAHs after 2 weeks of treatment, where most of
the n-alkanes were completely depleted. However control treatment that moisture was
retained to an accepted level surprisingly exhibited a better performance the last 2
weeks of the experiment in terms of n-alkanes and PAHs consumption, which shows
the high potential and dynamic of the added consortium to degrade even more
recalcitrant compounds like PAHs.
1.E+00
1.E+01
1.E+02
1.E+03
1.E+04
1.E+05
1.E+06
1.E+07
1.E+08
1.E+09
1.E+10
0
5
10
15
20
25
30
0 7 15 21 30 38 45
cells
/gr
dry
san
d
% M
ois
ture
Time (days)
ULRM
% moisture CFUs / gr dry sandMPN/gr dry sand

98
Figure 55: Concentration profiles of selected n-alkanes and PAHs compounds in Control M,
NPKM and ULRM treatments (Sand 2).
In this sense specific degradation rate of PAHs is much slower when compared to n-
alkanes obviously (Table 23) and follows the same pattern as mentioned before, i.e.
C15> C20> (Pristane, Phytane)>C25 > C30> C35 >(PAHs).
The comparison of the n-alkanes and PAHs profiles (Figures 45-50 and 55) after oil
application revealed that application of fertilizer plus biosurfactant can favour the
degradation of crude oil by the adapted indigenous consortium that lacks essential
nutrients.
0
10
20
30
40
50
60
0 10 20 30 40 50
ng
alka
nes
/ng
ho
pan
e
t (days)
C15
CM NPKM
ULRM
0
10
20
30
40
50
60
0 10 20 30 40 50
ng
alka
nes
/ng
ho
pan
e
t (days)
C20
CM NPKM
ULRM
0
5
10
15
20
25
30
35
40
0 10 20 30 40 50
ng
alka
nes
/ng
ho
pan
e
t (days)
C25
CM NPKM
ULRM
0
2
4
6
8
10
12
14
16
0 10 20 30 40 50
ng
alka
nes
/ng
ho
pan
e
t (days)
C30
CM NPKM
ULRM
0
0.05
0.1
0.15
0.2
0.25
0.3
0.35
0.4
0 10 20 30 40 50
ng
aro
mat
ics/
ng
ho
pan
e
t (days)
Fluorene CM NPKM
ULRM
0
0.2
0.4
0.6
0.8
1
1.2
0 10 20 30 40 50
ng
aro
mat
ics/
ng
ho
pan
e
t (days)
Dibenzothiophene
CM NPKM
ULRM

99
Despite the known ability of biosurfactants to emulsify hydrocarbon – water mixtures
which when applied specifically to soils enhance water solubility of hydrocarbons and
increase the displacement of oily substances from soil particles, reports of
biosurfactants effects on bioremediation in contaminated soils were inconsistent
(Kosaric, 2001; Ron and Rosenberg, 2002; Calvo et al., 2009; Banat et al., 2010; Ron
and Rosenberg, 2010; Ward, 2010).
It can be concluded that in this study biosurfactants especially rhamnolipids (ULRM)
accelerated the biodegradation of n-alkanes by making them more available to
microorganisms as expected but this was not the case for PAHs even though partially
could be attributed to the low water content of soil as described above –still NPKM
treatment with inorganic nutrients had responded better on PAHs depletion. There are
numerous factors that could support the pour efficiency of ULRM on PAHs
degradation.
Rhamnolipid’s efficiency on biodegradation process depends on the pore size of the
matrix, the smaller the pore size the less efficient rhamnolipids will be (Noordman et
al., 2002). Furthermore poor long term bioremediation efficiency of rhamnolipids
(biosurfactant) is caused by the biodegradation of itself (Ward, 2010), While
solubilization of high concentrations of PAH could be toxic to the soil
microorganisms (Deschenes et al., 1996) as well as affecting the distribution and the
composition of the hydrocarbon degraders populations.
Moreover as has been reported lipohlilic nutrients were found to be more effective in
to coarse grained shorelines than in fine grained shorelines due to the difficulty in
penetration for the lipohlilic nutrients in fine grained shorelines. By contrast,
inorganic nutrients are recommended for hydrocarbon biodegradation into fine
grained shorelines (Nikolopoulou and Kalogerakis, 2011). Accordingly inconsistent
behaviour of ULRM amendment between the two fractions (alkanes-PAHs) of oil
could have also be influenced by the addition of lipophilic nutrients, despite the fact
that previous studies in liquid micocosms proved that lipophlic nutrients have
effectively contributed in oil degradation (Nikolopoulou et al., 2007; Nikolopoulou
and Kalogerakis, 2008).
On the other hand overall ULRM treatment performance suggests that utilization of
lipophilic nutrients could possibly have been favoured by the presence of
biosurfactant which increased their bioavailability to soil microorganisms.
Rhamnolipids efficiency in desorption of hydrocarbons from soil matrix is imposed to
complex interactions existing in soil between oil diverse hydrophobic molecules and
various types of soil particulates (Ward, 2010).
As has been mentioned bioavailability of hydrophobic compounds in contaminated
soils is often the rate-limiting step in the process and the efficiency of biosurfactants
or other rate limiting cosubstrates mainly could be attributed to the interactions
between target organic compounds, bacterial species and surfactants. Hence further
investigation should be done in this regard and more possible combinations of
different types of nutrients and/or biosurfactants on bioremediation of a variety of oil
contaminated shorelines should be tested, since elsewhere it was found that
biosurfactants alone are capable of promoting biodegradation to a large extent without
added fertilizers (Thavasi et al., 2011).
This work denotes that inoculation only with autochthonous hydrocarbon degraders
without any additional nutrients is not an effective treatment, however when the
needed nutrients or other biostimulants are supplemented the advantages of such
combination are obvious and result in accelerated hydrocarbon consumption by the
added autochthonous consortium. Thus the combination of autochthonous

100
bioaugmentation with biostimulation could be really beneficial in this regard,
however further tests regarding new formulations application to a variety of different
type of shorelines should be carried out, in order to establish the parameters that could
enhance oil bioremediation in particular marine environments and thus lead to a
detailed contingency plan to high risk areas.
Nonetheless combination of autochthonous bioaugmentation with biostimulation is
still a very promising strategy that could speed up the natural biodegradation process
as long as crucial parameters for microbial sustainability are well monitored and
controlled.

101
4.5. Cluster analysis
Much chemistry involves using data to determine patterns. For example can a
chromatograph be used to decide on the origin of a treatment and if so, what main
features in the chromatograph distinguish different treatments?
Exploratory data analysis techniques are often quite helpful in elucidating the
complex nature of multivariate relationships and determine general relationships
between data. Sometimes more complex questions need to be answered, such as, do
the samples fall into groups? Cluster analysis is a well established approach that was
developed to determine similarities between samples.
A major problem in cluster analysis is defining a cluster. There is no measure of
cluster validity that can serve as a reliable indicator of the quality of a proposed
partitioning of the data. Clusters are defined intuitively, depending on the context of
the problem, and not mathematically, which limits their utility. Therefore, prior
knowledge about the problem is essential when using these methods. Because the
threshold value for similarity is developed directly from the data, criteria for
similarity are often subjective and depend to a large degree on the nature of the
problem investigated, the goals of the study, the number of clusters in the data sought,
and previous experience.
Cluster analysis is based on the principle that distances between pairs of points (i.e.,
samples) in the measurement space are inversely related to their degree of similarity.
Although several different types of clustering algorithms exist, by far the most
popular is hierarchical clustering, which is the focus here. The starting point for a
hierarchical clustering experiment is the similarity matrix, which is formed by first
computing the distances between all pairs of points in the data set. Each distance is
then converted into a similarity value
(10)
Where Sik is the measure of similarity between samples i and k, dik is the Euclidean
distance between samples i and k, and dmax is the distance between the two most
dissimilar samples, which is also the largest distance in the data set. The smaller is the
value the more similar are the samples.
The next step is to link the objects. The most common approach is called
agglomerative clustering whereby single objects are gradually connected to each other
in groups. There is a variety of ways to compute distances between data points and
clusters in hierarchical clustering such as, single-linkage, complete-linkage and
average linkage method. In this analysis we used the average linkage method which
assesses similarity by computing the distance between all pairs of points where a
member of each pair belongs to the cluster, with the average of these distances being a
measure of similarity between a cluster and a data point.
The result of this procedure is a diagram called a dendogram, which is a visual
representation of the relationships between samples in the data set. Interpretation of
the results is intuitive, which is the major reason for the popularity of these methods
(Davidson and Lavine, 2006).

102
Figure 56: Dendogram developed from gas chromatograms of the two seawater experimental data sets.

103
Figure 57: Dendogram developed from gas chromatograms of the two Sand experimental data sets.
104
Cluster analysis has been used to group samples from the two Seawater experimental
data sets and from the two Sand data sets computing Euclidean distance and average
linkage. In order to establish a common comparison base in terms of mutual time
sampling periods, data of n-alkanes (C14-C35) concentration profiles up to 30 days of
treatment have been used for all experimental data sets. The dendogram shown in
Figure 56 suggests that gas chromatographs from Seawater experimental data set can
be divided into 4 main groups (Cluster 1: NPKMR_15, ULR_30, NPKMR_30,
ULRM_30, ULR_15, NPKMR3_30; cluster 2: ULRM_15, NPKM3_30, NPKM3_15,
NPKMR3_15; cluster 3: NPKM_30, NPKM3_5, NPKMR3_5; cluster 4: NPKM_15,
ULR_5, NPKM3_0, NPKMR3_0, NPKMR_5, ULRM_5). Moreover dendogram
shown in Figure 57 indicates that gas chromatographs from Sand experimental data
set can be divided also into 4 main groups (Cluster 1:, ULR_30L, ULRM_30L,
NPK_30L, NPKM_30L; cluster 2: C_15L, ULR_15L, NPKM_15L, NPK_15L,
C_30L, ULRM_15L; cluster 3: C_0L, NPK_0L, ULR_0L, CM_30L; cluster 4:
CM_0L, NPKM_0L, CM_15L, ULRM_0L).
Cluster 1 from both data sets (Seawater & Sand) is the visualization of the best
performance treatments expressed in biodegradation index which have been already
shown. However it should be noted that any differences in the pattern of dendogram
which doesn’t follows overall degradation rate between treatments could be attributed
to the different initial composition (type of crude oil) and concentration of crude oil
used between the experimental data sets. Nonetheless it is clear those treatments that
exhibited more or less same performance in terms of degradation index can be
grouped and grouping follows chromatograms concentration profile.
Furthermore changes in profile concentrations of selected compounds (n-alkanes C14-
C35) in the chromatograms due to different treatments applied could be only
examined into data sets that contained the same type (composition) of crude oil. Thus
two groups of data sets depending on the type of crude oil used have been recognized
and these are:
Group A Seawater 1 experimental data set and Sand 1 experimental data set and
Group B Seawater 2 experimental data set and Sand 2 experimental data set
Weighted concentrations (to their sum) have been used to overcome differences
arising from the amount of the initial concentration used in each experimental set.
Insight on the behavior of crude oil components due to different treatments applied
was investigated and dendogram of Goup A experimental data sets (Figure 58)
revealed 4 main clusters (Cluster 1: NPKMR_15, ULR_30, NPKMR_30, ULR_15;
cluster 2: C_30L, NPKM_30, ULRM_15, ULRM_30, NPK_30L, ULR_30L; cluster
3: C_15L, ULR_15L, NPKM_15L; cluster 4: C_0L, NPK_0L, ULR_0L, ULR_0,
NPK_15L NPKM_0, NPKMR_0, ULRM_0, NPKM_5, NPKMR_5, ULRM_5).
Each cluster represents different distribution of oil components (concentration profile)
which in other words mean different response in terms of oil components depletion to
various amendments. Cluster 1 represents the profile of oil light, heavy and branched
hydrocarbons (pristine-phytane) which have been severely depleted in NPKMR and
ULR treatments after 15 days. Cluster 2 represents the profile of oil components in all
three treatments of Sand 1 experimental data set (Control, NPK &ULR) after 30 days
105
and also for NPKM and ULRM treatments of Seawater 2 experimental set after 30
and 15 days respectively. Particularly in this cluster light and heavy hydrocarbons of
crude oil are also depleted but to a lesser extent compared to cluster 1, on the other
hand branched hydrocarbons (pristine-phytane) are not depleted at the same level as
the rest hydrocarbons. Moreover in cluster 3 treatments of control and ULR from
Sand 1 experimental data set and treatment NPKM from Seawater 2experimental set
exhibit the same trend after 15 days, light to medium chain hydrocarbon are depleted
to some point compared to cluster 4 which comprises mostly by treatments of starting
day 0 for both experimental sets (Sand 1 and Seawater 2). In addition branched
alkanes are depleted to even lesser extent compared to treatments of cluster 1 and
heavy chain hydrocarbons remain stable. In the same manner but to lesser extent
depletion of oil hydrocarbons somewhat which have been severely depleted in
NPKMR and ULR treatments after 15 days.
In the same manner behavior of crude oil components among different amendments
was investigated and dendogram of Goup B experimental data sets (Figure 59)
revealed 3 main clusters (Cluster 1: CM_0L, NPKM_0L, CM_15L, ULRM_0L,
NPKM3_0, NPKMR3_0, NPKM3_5; cluster 2: CM_30L, NPKM_15L, ULRM_15L,
NPKM_30L, ULRM_30L; cluster 3: NPKM3_30, NPKM3_15, NPKMR3_5,
NPKMR3_15, NPKMR3_30). Each cluster demonstrates a different oil concentration
pattern (concentration profile) that corresponds to different response in terms of oil
components depletion of each group of amendments. Cluster 1 represents the profile
of oil initial concentration which consequently is the same for both Seawater 1 and
Sand 2 experimental set, however classification in cluster 2 and 3 matches samples
according to the matrix in which amendments have been applied, i.e. cluster 2 for
solid matrix (Sand 2) and cluster 3 for liquid matrix (Seawater 1). Nonetheless this
denotes that in each matrix concentrations profile of oil components follow different
patterns. Specifically as has also been verified by previous examination through
biodegradation kinetics in cluster 2 long chain alkanes (above C25) and branched
alkanes (pristine-phytane) are severely depleted compared to cluster 3 in which
instead, long chain alkanes and branched alkanes remain practically stable or are
slowly depleted (NPKMR3) .
Number 3 at the end of each treatment name has been used to distinguish samples with same titles
that come from different experimental data set, so treatments that include 3 come from 2nd
seawater
experimental data set. Letter L stands for Landfarming and has been used to distinguish common
treatments titles between sand data sets and seawater data sets. The number after the underscore
symbol (_) though implies the treatment days of each sample.

106
Figure 58: Dendogram developed from gas chromatograms of Seawater 1 and Sand 1 experimental data sets.

107
Figure 59: Dendogram developed from gas chromatograms of Seawater 2 and Sand 2 experimental data sets.

Chapter 4 Experimental Results
108

Chapter 4 Experimental Results
109
4.6. Biofilm Investigation on Oil Droplets&C20
Results and Discussion
Preliminary tests of the tested consortia
Preliminary tests were conducted on consortia Eb8 and E4 ( samples taken from Elefsina
Bay -Attica region near the Hellenic Petroleum Refinery; a site exposed to chronic crude
oil pollution), that were enriched in 100ml ONR7 medium with 607μl crude oil and
consequently there development within 10 days was monitored with CLSM. The
response of consortia was surprisingly at the beginning (2nd
day) very promising with
bacteria covering dispersed oil droplets (Figure 60A) which evolved further after a week
of incubation (Figures 60B&C). Analysis of the samples with consortium Eb8 showed
scattered small oil droplets forming clusters with bacteria of grape, star style shapes with
strings of cells and oil droplets, probably due to heavy degradation. Strings are
composed by larger and also fine oil droplets connected to bacteria, probably due to EPS
bridging between the bacteria (Figures 60D&E).
A
B
C
2nd
day 1 week 1 week
D
E
F
1 week Figure 60: Structures formed between oil droplets and bacteria from consortia Eb8 (A-E) & S (F).
Photos represent Maximum Intensity Projections (MIPs) of data sets consisting of several optical
sections.
Consortium from the pristine area also adapted well and formed various size of oil
droplets covered with the adapted indigenous seawater bacteria. Also as detected (Figure
60F) there were interesting spots of spherical, dissolved like a sponge roll shapes but not
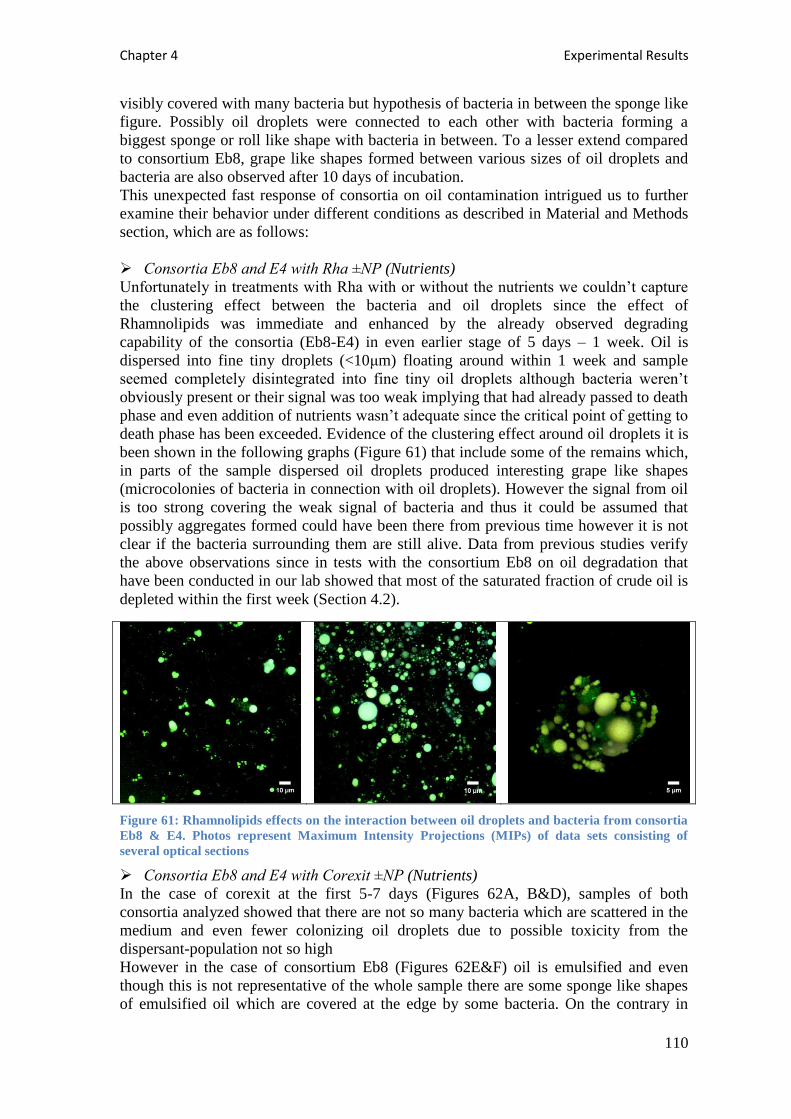
Chapter 4 Experimental Results
110
visibly covered with many bacteria but hypothesis of bacteria in between the sponge like
figure. Possibly oil droplets were connected to each other with bacteria forming a
biggest sponge or roll like shape with bacteria in between. To a lesser extend compared
to consortium Eb8, grape like shapes formed between various sizes of oil droplets and
bacteria are also observed after 10 days of incubation.
This unexpected fast response of consortia on oil contamination intrigued us to further
examine their behavior under different conditions as described in Material and Methods
section, which are as follows:
Consortia Eb8 and E4 with Rha ±NP (Nutrients)
Unfortunately in treatments with Rha with or without the nutrients we couldn’t capture
the clustering effect between the bacteria and oil droplets since the effect of
Rhamnolipids was immediate and enhanced by the already observed degrading
capability of the consortia (Eb8-E4) in even earlier stage of 5 days – 1 week. Oil is
dispersed into fine tiny droplets (<10μm) floating around within 1 week and sample
seemed completely disintegrated into fine tiny oil droplets although bacteria weren’t
obviously present or their signal was too weak implying that had already passed to death
phase and even addition of nutrients wasn’t adequate since the critical point of getting to
death phase has been exceeded. Evidence of the clustering effect around oil droplets it is
been shown in the following graphs (Figure 61) that include some of the remains which,
in parts of the sample dispersed oil droplets produced interesting grape like shapes
(microcolonies of bacteria in connection with oil droplets). However the signal from oil
is too strong covering the weak signal of bacteria and thus it could be assumed that
possibly aggregates formed could have been there from previous time however it is not
clear if the bacteria surrounding them are still alive. Data from previous studies verify
the above observations since in tests with the consortium Eb8 on oil degradation that
have been conducted in our lab showed that most of the saturated fraction of crude oil is
depleted within the first week (Section 4.2).
Figure 61: Rhamnolipids effects on the interaction between oil droplets and bacteria from consortia
Eb8 & E4. Photos represent Maximum Intensity Projections (MIPs) of data sets consisting of
several optical sections
Consortia Eb8 and E4 with Corexit ±NP (Nutrients)
In the case of corexit at the first 5-7 days (Figures 62A, B&D), samples of both
consortia analyzed showed that there are not so many bacteria which are scattered in the
medium and even fewer colonizing oil droplets due to possible toxicity from the
dispersant-population not so high
However in the case of consortium Eb8 (Figures 62E&F) oil is emulsified and even
though this is not representative of the whole sample there are some sponge like shapes
of emulsified oil which are covered at the edge by some bacteria. On the contrary in

Chapter 4 Experimental Results
111
consortium E4 there are some isolated spots of very small microcolonies and aggregates
but most bacteria are free. More bacteria in microcolonies rather colonizing oil droplets
(Figure 62C).
A
B
C
D E
F
5 days 7 days 11, 14 days Figure 62: Corexit effects on the interaction between oil droplets and bacteria from consortia Eb8
(D-F) & E4 (A-C). Photos represent Maximum Intensity Projections (MIPs) of data sets consisting
of several optical sections.
After the addition of nutrients bacteria seemed to recover and made some progress in
associating with oil droplets, however this wasn’t so effective and still many of the
bacteria prefer to stay at free state in the water phase. Bacteria don't seem to like the
environment they look tiny and few and their weak signal is covered by the strong signal
of the oil which makes difficult to differentiate
Consortia Eb8 and E4 with S200 +NP (Nutrients)
S200 has a similar behavior as corexit and tends also to emulsify oil. At the first 5 days
as shown in Figures 63A&D below bacteria from both consortia are swimming around
and only few are just starting colonizing oil droplets (>10μm). Sample of consortium
Eb8 is more populated than sample of consortium E4 which implies that Eb8 is less
affected by the presence of S200. Improvement on colonization of oil droplets has been
observed for both consortia forming strands with each other and oil droplets within a
week (Figures 63B&E) but to greater extent for consortium Eb8, however after 11 days
although there are some remains and isolated spots of clusters formed between oil
droplets-bacteria in the samples, which are not indicative of the whole sample’s
impression, the number of bacteria has decreased which implies that already passed to
death phase most likely due to lack of essential nutrients that help them keep the balance
with crude oil (Figures 63C&E). Therefore nutrients were added to both consortia and
bacteria population has recovered but not as anticipated and although bacteria have
started again to colonize oil droplets, this trait was more or less restricted to some

Chapter 4 Experimental Results
112
isolated spots in the sample with star like shapes of bacteria microcolonies around oil
droplets (Figure 64).
A
B
C
D
E
F
5 days 11 days 14 days
Figure 63: S200 effects on the interaction between oil droplets and bacteria from consortia Eb8 (D-
F) & E4 (A-C). Photos represent Maximum Intensity Projections (MIPs) of data sets consisting of
several optical sections.
Figure 64: Grape like structure of bacteria on oil droplets after
18 days in sample with S200 and consortium Eb8. Photos
represent Maximum Intensity Projections (MIPs) of data sets
consisting of several optical sections.
The recovery of bacteria population was more limited
especially for consortium E4 in which no traces of
bacteria were detected after 18 days of incubation. The
fact that S200 emulsifies oil rather than disperses, has
limited the colonization of oil droplets by bacteria and
possible biochemical interactions between dispersant and
consortia have prevailed bacteria from producing
surfactant like biopolymers or adapting their cell hydrophobicity. In addition possible
dispersant toxicity probably has affected consortia survival, even planktonic bacteria
were few.
Consortia Eb8 and E4 with Marichem +NP (Nutrients)
Surprisingly for a dispersant like behavior Marichem did effectively disperse crude oil
into fine droplets but also promoted growth in both consortia compared to the other two
dispersants which proved to be toxic, particularly Corexit, for bacteria. Especially in the
case of consortium Eb8 it was even faster (less than the initial starting date-5 days),
which made the lack of essential nutrients the main reason of getting earlier to the death

Chapter 4 Experimental Results
113
phase (11 days) and even after the addition of nutrients this was inevitable. But this was
not the case for consortium E4 which had a later response compared to Eb8 and re-
addition of nutrients prevented bacteria of passing to death phase. Nonetheless same
features and structures apply for both consortia which demonstrate the effectiveness of
Marichem dispersant in enhancing both growth of bacteria and colonization of oil
droplets (Figures 65&66).
5 days 7 days 11 days
Figure 65: Marichem effects on the interaction between oil droplets and bacteria from consortia
Eb8& E4 thought time. Photos represent Maximum Intensity Projections (MIPs) of data sets
consisting of several optical sections.
At the beginning some of the bacteria have already covered effectively oil droplets
forming clusters between them and the oil, however evolution through time showed that
star like shapes of bacteria and oil interconnected to each other were the dominant
features in the samples. Oil was highly colonized by bacteria forming grape style shapes
with oil droplets and bacteria in between which helped to assume that a lot of EPS is
formed connecting each other. Series of oil droplets were covered with bacteria forming
filamentous structures and bacteria were oriented in a directed way.
14 days 18 days
Figure 66: Marichem effects on the interaction between oil droplets and bacteria from consortia
Eb8& E4 thought time. Photos represent Maximum Intensity Projections (MIPs) of data sets
consisting of several optical sections.
Consortia Eb8 and E4 with C20 and NP (Nutrients)
In the case of C20 both consortia responded well and covered the edge and center of
C20 droplet from the first 5 days of incubation and especially for Eb8 evolution was
even faster. Even though C20 has irregular structure that hides bacteria an obvious thick
film, particularly for consortium Eb8 is very thick, has been formed all over this C20
droplet within a week in either consortia. After 11 days of incubation the C20 is fully

Chapter 4 Experimental Results
114
covered by bacteria which have already dissolved -degraded some parts of C20 that look
floating from the rest part of C20. Dissolution of C20 droplet is even more intense in
consortium Eb8 in which a strong biofilm of bacteria with lots of EPS is formed
minimizing drastically the radius of the droplet, while the resulting reflection signal of
C20 becomes weak. C20 droplet got a more rift form full of canyons and openings that
resulted into smaller pieces of C20 that have been cut off from the main one possibly
due to bacteria action after 14-18 days of incubation. This cracked form of C20 with
many isolated parts of C20 like a complex of islands makes it difficult to define
anymore the edge or the center of the original droplet. More severe dissolution is
observed in Eb8 consortium.
5 days 7 days 11-18 days
Figure 67: Evolution of bacteria development on eicosane droplets through time for consortia Eb8&
E4 shown as XYZ projections.
Consortia Eb8 and E4 with C20 with NP (Nutrients)+Rha
In the presence of biosurfactant Rha the structure of C20 droplet is affected in both
consortia and more drastically in consortium Eb8. Same pattern (thick biofilm) as
described previously at the beginning (5 days) is observed in C20 (Figures 68A&D)- is
fully inhabited by bacteria that form mushroom pattern after 11 days that seems to be
ought to Rha dispersive action still fully covered by bacteria (Figures 68B&E). After 14
days C20 is completely disintegrated and it is difficult to distinguish edge from center
part with many pieces of C20 dislocated from the rest structure.by the end (18 days)
whatever left from the original droplet has been extensively emulsified and degraded
(Figures 68C&F).
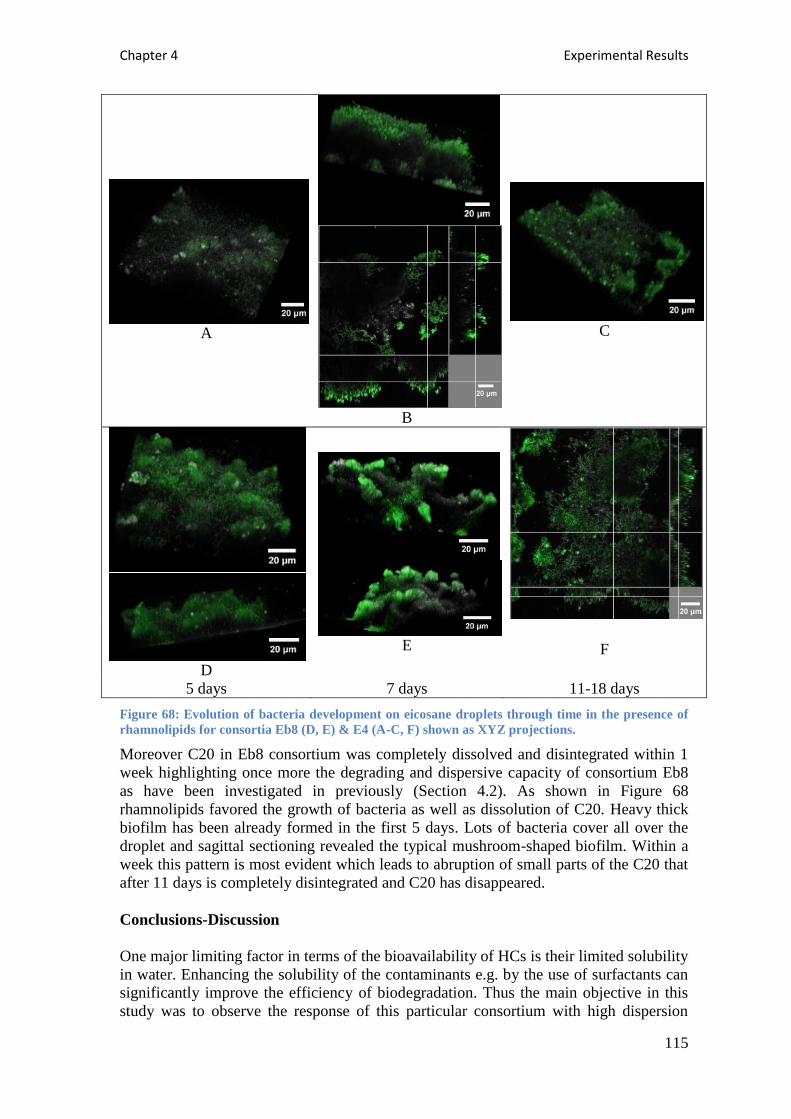
Chapter 4 Experimental Results
115
A
B
C
D
E
F
5 days 7 days 11-18 days
Figure 68: Evolution of bacteria development on eicosane droplets through time in the presence of
rhamnolipids for consortia Eb8 (D, E) & E4 (A-C, F) shown as XYZ projections.
Moreover C20 in Eb8 consortium was completely dissolved and disintegrated within 1
week highlighting once more the degrading and dispersive capacity of consortium Eb8
as have been investigated in previously (Section 4.2). As shown in Figure 68
rhamnolipids favored the growth of bacteria as well as dissolution of C20. Heavy thick
biofilm has been already formed in the first 5 days. Lots of bacteria cover all over the
droplet and sagittal sectioning revealed the typical mushroom-shaped biofilm. Within a
week this pattern is most evident which leads to abruption of small parts of the C20 that
after 11 days is completely disintegrated and C20 has disappeared.
Conclusions-Discussion
One major limiting factor in terms of the bioavailability of HCs is their limited solubility
in water. Enhancing the solubility of the contaminants e.g. by the use of surfactants can
significantly improve the efficiency of biodegradation. Thus the main objective in this
study was to observe the response of this particular consortium with high dispersion

Chapter 4 Experimental Results
116
characteristics in the case of adding certain commercial dispersants just like those that
have been or could be used in the event of a real oil spill. Due to the high toxicity of
commercial dispersants, there are certain rules on how and when they should be applied
in the marine environment.
On the other hand, for the purpose of bioremediation only those surfactants should be
used that are themselves completely biodegradable. In addition, they have to be
compatible to the surfaces of the bacteria. Physical properties of the macromolecules
found on cells membranes and bridges constructed by EPS are the main factors that
enable bacterial cells to adhere on HCs (Neu, 1996; Rodrigues et al., 2005). Controlled
by the growth conditions extracellular polymers can either be binded on the cell surface
or released into the surrounding medium (Osterreicher-Ravid et al. 2000). Moreover,
many biosurfactants/bioemulsifiers that have been examined are just complex structures
of polysaccharides and proteins, which are known to increase the apparent solubility of
hydrophobic compounds (Rodrigues et al., 2005).
Undoubtedly, EPS promotes direct contact between the bacteria cells surfaces and the
hydrocarbon substrate and consequently cell surface-associated biosurfactant(s) can
favor substrate cellular uptake by solubilizing the hydrocarbon substrate. In this sense
EPS have primary role in floc formation between bacteria cells and the hydrocarbon
substrate, keeping bacteria cells in close contact to the hydrocarbons (Whyte et al.,
1999).
Therefore, the biosynthesis and release of polymeric substances can be a bacterial
strategy to promote bioavailability of less water-soluble compounds and/or adhesion to
hydrophobic surfaces (Neu, 1996; Rodrigues et al., 2005).
According to Al-Tahhan et al., 2000 there are two main mechanisms by which
biosurfactants enhance biodegradation. First, biosurfactants can solubilize hydrophobic
compounds within micelle structures, effectively increasing the apparent aqueous
solubility of the organic compound and its availability for uptake by a cell. Second,
biosurfactants can cause the cell surface to become more hydrophobic, thereby
increasing the association of the cell with the slightly soluble substrate. Since the second
mechanism requires very low levels of added biosurfactant, it is the more intriguing of
the two mechanisms from the perspective of enhancing the biodegradation process.
Regarding the above, the requirements of biocompatibility and biodegradability are met
by biosurfactants and by those surfactants that contain structures comparable to naturally
occurring microbial surfactants and for that reason they were also tested in this certain
consortia (Eb8 &E4).
Microscopy observations of biofilm community developing at Hydrocarbon - water
interfaces so far have provided evidence of a stepwise development pattern of the
biofilm and typical production of extracellular matrix which is close to the
characteristics of the proposed model biofilms. Contrary to what was believed up to now
in this work biofilm formation as has been proposed by various stepwise models was not
obvious. Special characteristics of this biofilm formation in which hydrocarbons serve as
substrate and substratum simultaneously makes difficult to characterize and also to
simulate this type of biofilm. Single species –single compound (substrate) interactions
have been fully investigated as has been described above and revealed a gradient
development of cells aggregates around hydrocarbon droplets forming a biofilm.
Nevertheless in this work the impression we got is completely different to what so far
has been observed or proposed as a stepwise pattern of biofilm formation and maybe be a
special type of biofilm at the water-oil interface is formed between the tested consortia and
the oil droplets. As has been shown in the above figures bacteria are organized into
clusters forming strings, star and grape like shapes of bacteria and fine oil droplets
Chapter 4 Experimental Results
117
bridging each other with EPS. However it should be noted that speculation of EPS
production arises mainly by the fact that EPS of any kind is atypical trait in biofilms and
that specificity of Syto9 dye to nucleic acids could also be responsible for staining
informative type of EPS (nucleic acids). The chemical and in situ analysis of EPS
constituents is still a challenge as the different types of polymers cannot be analysed by
using a simple and straightforward analytical approach. In fact the analysis is even more
difficult if environmental biofilms containing a huge variety of different cell types and
thus different EPS compounds have to be analysed. One part of the EPS matrix is
represented by glycoconjugates. It has been demonstrated that lectins are a very useful
probe for the in situ characterization of glycoconjugate fraction of the EPS by means of
fluorescence lectin-binding analysis (Neu and Lawrence, 2005; Neu et al., 2010). In
order to select the appropriate lectin or a selection thereof, a lectin screening of all
commercially available lectins (~70) is necessary usually in combination with a nucleic
acid counterstain. By means of this in situ technique, an estimate of EPS-specific
glycoconjugates can be made and even multiple types of glycoconjugates can be
differentiated (Neu et al., 2010). However extracellular matrix although mentioned, was
not measured since lectin approach is time consuming, especially when there are no
indications of the possible EPS composition, but most of all it requires
flushing/destaining which in our case would have changed or disturbed the sample
completely. In addition sample’s nature, which is in liquid form, and highly dispersed oil
droplets, which were difficult to either sample them or retain them especially after
flushing, made it difficult for us to further investigate the nature of EPS formed.
As observed dispersion of crude oil is promoted by both consortia exhibiting the
capability of mixed consortia over single species cultures to solubilize HCs. Substrate
preference by specific strains (Whyte et al., 1999; Pepi et al., 2005; Klein et al., 2008)
could be overcome by the combined application of mixed species inoculum that is able
to utilize substrates that other strains can’t. Therefore combined species consortia are
most preferable as they can use a broader range of substrates; besides in a real case
scenario of an accidental oil spill in the marine environment mixed populations of
indigenous bacteria confront the diverse compounds found in crude oil.
Furthermore as has been mentioned by Osterreicher-Ravid et al., 2000 and Olivera et al.,
2009 biopolymers produced by a single strain of mixed consortium can favor the rest
strains of the consortium to adapt faster and get into contact with the HCs. Specifically
Alasan, the exocellular polymeric emulsifier produced by Acinetobacter radioresistens
KA53, could bind to the surface of Sphingomonas paucimobilis EPA505 and
Acinetobacter calcoaceticus RAG-1, but not to Escherchia coli B, E. coli C600,
Staphlococcus albus and Seratia marsescens, the last of which has a high cell-surface
hydrophobicity. Despite Alasan’s specificity in binding to bacteria, this horizontal
transfer of exopolymers from one bacterial species to another could be highly significant
for natural mixed populations grown in close proximity, such as coaggregation and
biofilms. By an environmental aspect this transfer of amphipathic polymers between
cells has significant implications in oil biodegradation from natural microbial
communities by changing their surface properties, which subsequently could alter the
way of interaction between cells, their adherence or desorption from surfaces,
consumption of substrates, and resistance to bacteriophage infection and other
environmental factors (Osterreicher-Ravid et al., 2000).
The case where dispersion of oil is promoted by the use of commercial dispersants like
those used in accidental oil spills of the Mexico Gulf (Corexit) and the Galician coast of
Spain (S200) has been examined in the present study for their effect on microbial
communities response. It could be expected that since dispersants used promote the
Chapter 4 Experimental Results
118
dissolution of oil to droplets, bacteria would immediate associate to the oil droplets, on
the contrary bacteria population decreased due to dispersants possible toxicity as has
been already mentioned by other studies.
Seo and Bishop, 2007: It has been reported that nonionic surfactants like Triton X-100
and Tween 20 interfered with the biofilm structure due to hydrophobic interactions
affecting initial biofilm formation and enabling already established biofilm removal. It
could be assumed that surfactants interference is mainly caused by the prevention of
suspended cells flocculation and EPS bridging mechanisms and finally by EPS
dissolution (Seo and Bishop, 2007).
Martienssen et al., 2007 compared different conventional synthetic surfactants (Triton X
100, Tween 20, sodium dodecyl sulfonate) and the close-to-nature surfactant
composition (Bioversals FW) with respect to micelle formation and biocompatibility and
found that bacterial growth resulting in oil aggregates and their degradation was detected
only in the biosurfactant (Bioversals FW).
This manner of bacteria reaction to dispersants with an exception of Marichem
compared to Rhamnolipids has also been confirmed in this study. And as has also been
reported by Al-Tahhan et al., 2000, Rhamnolipids even at sub-CMC concentration
resulted in increased degradation rates of the hydrophobic substrates. Still it is surprising
the reaction of bacteria to Marichem dispersant that produced a more close to
biosurfactants biocompatibility, which implies that as more investigation is made on
creating structures more compatible to bacteria then degradation rates of hydrocarbons
would be favored even with the cheaper solution of the chemical dispersants.
Additionally in a recent study on a consortium enriched from deep, uncontaminated
waters of the Mexico Gulf with oil (Macondo MC252) and dispersant used during the
spill (COREXIT 9500) aggregates of bacteria on oil droplets forming flocs have been
observed, denoting the advantage of next generation dispersants to overcome possible
toxicity to indigenous marine bacteria (Bælum et al., 2012).
In this sense as has been already proved biosurfactants below cmc concentrations could
favor degradation rates of HCs with considerable reduced cost ought to the reduced
amounts of biosurfactants been applied.
Nonetheless biopolymers are a specific trait of microbial consortia to increase solubility
of less water-immiscible compounds and/or adhesion to hydrophobic surfaces.
The broad variety of substrates in crude oil intrigues different kinds of strains and
studies have shown (Pepi et al., 2005; Rodrigues et al., 2005; Osterreicher-Ravid et al.,
2000; Whyte et al., 1999; Olivera et al., 2009) that EPS or any biopolymers production
and physicochemical characteristics are highly influenced by the substrate type,
temperature, growth state, species variation and interaction to each other.
Moreover the advantage of combined species consortia over single species has been
proved in this study as they can been organized in a manner that through horizontal
genes and EPS transfer can metabolize a broader range of substrates; besides in a real
case scenario of an accidental oil spill to the marine environment mixed populations of
indigenous bacteria confront the diverse compounds found in crude oil.
Furthermore in a marine system that is highly influenced by environmental conditions
like tides, waves and currents it is extremely difficult and rare for indigenous
populations to form biofilms as has been believed till now over long periods on
hydrocarbons, it is more preferable for them to disperse oil into fine droplets by
producing biopolymers and then get organized into strands and coaggregates with the oil
droplets.
This new mechanism of mixed consortia on hydrocarbons utilization would provide a
new dimension for the study of coaggregation and biofilm microbial communities in the
Chapter 4 Experimental Results
119
marine ecosystem and needs further investigation in the sense of new improved
surfactants formulations or biosurfactans under different environmental conditions.
Understanding the interactions between oil-degrading microorganisms is essential, not
only when predicting the fate of hydrocarbons in the environment but also for the
development of successful bioremediation techniques. However EPS investigation and
characterization by the lectin approach remains a challenge, especially in such kind of
samples that are in liquid form and can be severly damaged or disturbed by this
approach, thus further work should be done in this regard that could help us better
understand and characterize the type of biofilm which is formed at the oil-water
interface.

Chapter 4 Experimental Results
120
4.7. General Conclusions
Thorough investigation through chemical, microbiological and kinetics analysis
(specific degradation rate, qs) has revealed that Seawater 1 experimental set in which
acclimated or not indigenous microorganisms were used performed far better than
Sand 1 experimental set in which degradation was induced only by indigenous
microbial populations and despite the fact that combined Rhamnolipids and lipophilic
nutrients were used still microbial response was not as strong as in Seawater 1
experimental set. Bioavailability of oil hydrocarbons is the critical factor that affects
the efficiency of bioremediation in oil contaminated environments and It can be
concluded that in Seawater 1 experimental set biosurfactants, in particular
rhamnolipids, accelerated the biodegradation of crude oil by making it more available
to microorganisms as expected in the two ABA treatments (ULRM & NPKMR) and
the biostimulation treatment (ULR).
On the other hand Sand 2 experimental set seemed more successful than Seawater 2
experimental set despite the fact that in both experimental sets, the same Eb8
consortium has been used. However it should be noted that despite the fact that
Rhamnolipids were added lipophilic nutrients were not included in Seawater 2
experimental set, which possibly had contributed to the less successful performance of
NPKMR treatment of Seawater 2 experimental set compared to ULRM treatment of
Sand 2 experimental set.
Combined application of Rhamnolipids and lipophilic nutrients could be beneficial in
liquid matrix (seawater), however when applied to solid matrix their performance is
modest compared to one in the liquid matrix. On the contrary inorganic nutrients
usually being washed out when applied in seawater perform better when applied to
sand almost equally to ULR combined performance. In addition other studies have
confirmed also that inorganic nutrients are more suitable to fine grained shorelines
rather than to coarse-grained shorelines that lipophilic nutrients could be more
efficient (Nikolopoulou and Kalogerakis, 2011). Inconsistent behaviour of ULR (Sand
1 experimental set) and ULRM (Sand 2 experimental set) treatments between the two
oil fractions (alkanes-PAHs) compared to NPK (Sand 1 experimental set) and NPKM
(Sand 2 experimental set) treatments respectively could support this conclusion. Still
overall ULR treatment performance suggests that the presence of biosurfactant could
possibly have contributed to utilization of lipophilic nutrients by making them more
available to soil microorganisms.
Nonetheless especially in the soil matrix (sand) bioavailability of hydrophobic
compounds is often the rate-limiting step in the process and the efficiency of
biosurfactants or other rate limiting co-substrates mainly could be attributed to the
interactions between target organic compounds, bacterial species, water content and
surfactants.
Chemical analysis results for all 4 experimental approaches has demonstrated the
preferred biodegradation of the more easily biodegradable substrates such as the
lower-molecular-weight PAHs and small chain length aliphatic hydrocarbons which
follows the pattern C15> C20> (Pristane, Phytane)>C25 > C30> C35 > (PAHs). Also
these results confirmed that although Pristane and Phytane were considered in the past
as conserved internal markers in biodegradation index yet they could not be used
anymore as biodegradation indexes.

Chapter 4 Experimental Results
121
So far alcanivorax strains are considered to be the dominant OHCB bacteria found in
any oil contaminated environment and in which have a primary role in oil
biodegradation. It needs to be stressed out that although Alcanivoracaceae as
investigaterd in the Seawater 1 experimental set is the dominant family in treatments
with inorganic nutrients, when biosurfactant is applied (rhamnolipids-treatments
NPKMR, ULR & ULRM) community shifts to the family of Pseudomonadaceae
(15.6%, 79.3% & 15.3% for NPKMR, ULR & ULRM treatments respectively).
Specifically for ULR treatment that lipophilic nutrients added to support indigenous
population, indigenous population shifts to consist mainly additionally to
Pseudomonadaceae family, Vibrionaceae family (12.6%). Nevertheless combination
of Alcanivoracaceae and Rhodospirillaceae (NPK, NPKM) is not regarded as the
strongest in terms of biodegradation rate at the particular time interval (30 days).
Pseudomonadaceae family was also the dominant family at the late stage (30 days) in
the Seawater 2 experimental set, whereas at early stage of the experiment
Alcanivoracaceae was the dominant family as well.
Alcanivorax species are known as hydrocarbonoclastic bacteria that oxidize C5-C16 n-
alkanes and branched alkanes. On the contrary Pseudomonas sp. are able to endure
and metabolize contaminants that are considered very toxic to other bacteria. Several
studies have proved that Pseudomonas sp. can utilize a vast range of contaminants
either naturally present or xenobiotic (Palleroni et al., 2010). Regarding the above,
Pseudomonas sp. can be considered as exceptional biocatalysts and can accelerate
bioremediation when other species stop. This is the case in the NPKM and most likely
in the NKPMR treatment, at the beginning of the experiment the community is
comprised by strains that can utilize hydrocarbons (alkanes and some aromatic
compounds) whereas by the end of the experiment where most of the hydrocarbons
have been consumed, pseudomonas strains take over utilizing either metabolic by-
products or other more recalcitrant hydrocarbons (Palleroni et al., 2010).
This proves that different type of amendments and consortia provoke different
structures in the resulting biodegradation communities and should be considered when
deciding for the suitable bioremediation strategy, however further investigation on the
composition of microbial communities with respect to time and interactions with oil
hydrocarbons under different conditions should be run in this regard.
The advantage of mixed consortia over single species consortia on hydrocarbons
degradation has been proved in this study which revealed alterations in consortia
species composition developing different degrading capabilities provoked by the
application of different amendments.
CLSM investigation has contributed into this and revealed that bacteria are organized
into clusters forming strings, star and grape like shapes of bacteria and fine oil
droplets bridging each other with EPS. Dispersion of crude oil is promoted by both
consortia exhibiting the capability of mixed consortia over single species cultures to
solubilize HCs. Moreover gradual dissolution of C20 droplet is encouraged in both
consortia (especially in the presence of rhamnolipids) but more intense in consortium
Eb8, in which a strong biofilm of bacteria with lots of EPS is formed minimizing
drastically the radius of the droplet resulting in a more rift form full of canyons and
openings. However it should be noted that contrary to what so far was proposed as
potential mechanism for the interaction between oil droplets and bacteria, biofilm was
not the preferred interaction between the tested consortia and the oil droplets.
This new organization and structure between oil and microbial consortia has brought
up a new perspective-mechanism in which mixed consortia utilize oil hydrocarbons
and could provide a new dimension for the study of coaggregation and biofilm

Chapter 4 Experimental Results
122
microbial communities in the marine ecosystem. In addition it could be expected that
since dispersants used promote the dissolution of oil to droplets, bacteria would
immediate associate to the oil droplets, on the contrary bacteria population decreased
due to dispersants possible toxicity as has been already mentioned by other studies
with an exception to Marichem dispersant which exhibited the same organization
between bacteria and oil droplets into clusters as when consortia have been tested
alone without any additional amendement only more intense.
Thus understanding the interactions between oil-degrading microorganisms is
essential, not only when predicting the fate of hydrocarbons in the environment but
also for the development of new improved surfactants formulations or biosurfactans
that can be used under different environmental conditions.
Still highly sensitive coastline environment and oil toxicity that fluctuates depending
on the amount released to the environment constitute the impact of an oil spill
exceptionally evident. Therefore immediate bioremediation is vital in order to
decrease oil concentration below critical level and by that diminish marine ecosystem
disturbance. Although biostimulation of the indigenous bacteria is often considered
the best bioremediation strategy, this may not always be very effective particularly if
time is of essence, namely, if we do not have the luxury to wait for the indigenous
hydrocarbon degraders to reach high densities. Thus, bioaugmentation coupled with
biostimulation is obviously beneficial over biostimulation alone under circumstances
in which quick response is required or pollutant toxicity or even the absence of
necessary consortia is of great importance. On the other hand, autochthonous
bioaugmentation (ABA) is advantageous over biostimulation coupled with
allochthonous bioaugmentation. Therefore, the best way to overcome the lag phase of
indigenous population adjustment and thus reduce the time needed for bioremediation
is to combine both techniques. Major determinants that restrain efficiency of oil
biodegradation and affect the population of hydrocarbon degraders have been stressed
out in the present work throughout different experimental sets conducted in both
seawater and sand matrix. Despite the fact that supplementation with nutrients leads
to very fast degradation of the saturated fraction which renders pointless any
additional supplementation with other biostimulants in the long run, biosurfactants
addition may play a significant part on oil degradation especially during the first
critical days in the event of an oil spill. Kinetics investigation of the specific
degradation rate (qs) support this conclusion since the specific degradation rate is not
only growth associated but is also enhanced by intermediate products or
biosurfactants activity that possibly affects metabolic pathway. However
biodegradation process efficiency in soil and the specific mechanism of rhamnolipid’s
action highly depend on substrates physicochemical interactions within certain matrix.
Hence further investigation should be done in this regard (response of HCB
communities) and more possible combinations of different types of nutrients and
biosurfactants on bioremediation of a variety of oil contaminated shorelines should be
tested.
This work has demonstrated that in the absence of essential nutrients, inoculation only
with autochthonous hydrocarbon degraders is not an effective treatment, however
when the needed nutrients or other biostimulants are supplemented the advantages of
such combination are obvious and result in accelerated hydrocarbon consumption by
the added autochthonous consortium. Thus we strongly believe that the combination
of autochthonous bioaugmentation and biostimulation is a promising strategy to speed
up bioremediation in cases where there is lack of both nutrients and indigenous

Chapter 4 Experimental Results
123
degraders. This technique has a number of advantages like shorter treatment time,
greater potential efficiency, lower impact on the environment, and relative ease in
obtaining public support. Thus future research that would define the carrying
capacities of various environments and the mechanisms that control them could be
fruitful in this regard.

Chapter 4 Experimental Results
124
125
References
Abalos A, Vinas M, Sabate J, Manresa MA and Solanas AM (2004) Enhanced
biodegradation of Casablanca crude oil by a microbial consortium in presence of a
rhamnolipid produced by Pseudomonas aeruginosa AT10. Biodegradation 15: 249–
260.
Aldrett S, Bonner JS, Mills MA, Autenrieth RL and Stephens FL (1997) Microbial
Degradation of Crude Oil in Marine Environments Tested in a Flask Experiment.
Water Research 31: 2840-2848.
Alzaga R, Montuori P, Ortiz L, Bayona JM, Albaigés J (2004) Fast solid-phase
extraction-gas chromatography-mass spectrometry procedure for oil fingerprinting.
Journal of Chromatography A, 1025: 133–138.
Al-Tahhan RA, Sandrin TR, Bodour AA, Maier RM (2000). Rhamnolipid-Induced
Removal of Lipopolysaccharide from Pseudomonas aeruginosa: Effect on Cell
Surface Properties and Interaction with Hydrophobic Substrates. Appl. Environ.
Microbiol. 66: 3262-3268.
ASTM D86, 1998. Standard Test Method for Distillation of Petroleum Products.
Atlas RM (1995) Bioremediation of petroleum pollutants. International
Biodeterioration & Biodegradation 35:317-327.
Bælum J, Borglin S, Chakraborty R, Fortney JL, Lamendella R, Mason OU, Auer M,
Zemla M, Bill M, Conrad ME, Malfatti SA, Tringe SG, Holman HY, Hazen TC,
Jansson JK (2012) Deep-sea bacteria enriched by oil and dispersant from the
Deepwater Horizon spill. Environmental Microbiology. 14: 2405–2416.
Baldi F, Ivosevic N, Minacci A, Pepi M, Fani R, Svetlicic VZ, Utic V (1999)
Adhesion of Acinetobacter venetianus to diesel fuel droplets studied with in situ
electrochemical and molecular probes. Appl Environ Microbiol. 65: 2041–2048.
Banat IM, Franzetti A, Gandolfi I, Bestetti G, Martinotti MG, Fracchia L, Smyth TJ,
Marchant R (2010) Microbial biosurfactants production, applications and future
potential. Applied Microbiology and Biotechnology. 87: 427–444.
Banat IM, Makkar RS, Cameotra SS (2000) Potential commercial applications of
microbial surfactants. Appl. Microbiol. Biotechnol. 53: 495–508.
Bastiaens L, Springael D, Wattiau P, Harms H, deWachter R, Verachtert H, Diels L
(2000) Isolation of adherent polycyclic aromatic hydrocarbon (PAH)-degrading
bacteria using PAH-sorbing carriers. Appl Environ Microbiol. 66, 1834–1843.
van Beilen JB, Li Z, Duetz WA, Smits THM, Witholt B (2003) Diversity of alkane
hydroxylase systems in the environment. Oil Gas Sci Technol. 4: 427–440.
van Beilen JB and Funhoff EG (2007) Alkane hydroxylases involved in microbial
alkane degradation. Appl Microbiol Biotechnol. 74:13–21.
Benito JM, Lovrich GA, Siρeriz F and Abate CM (2004) Isolation and Molecular
Characterization of Seawater Bacteria. In Spencer J and Ragout de Spencer A (eds.)

126
Environmental Microbiology Methods and Protocols. pp. 3-10., Totowa, New Jersey:
Humana Press Inc.
Berthe-Corti L, Nachtkamp M (2010) Bacterial Communities in Hydrocarbon-
Contaminated Marine Coastal Environments. Handbook of Hydrocarbon and Lipid
Microbiology, chapter 9, pp. 2521–2529, K. N. Timmis (ed.), Springer-Verlag Berlin
Heidelberg.
Besaltatpour A, Hajabbasi M, Khoshgoftarmanesh A and Dorostkar V (2011)
Landfarming process effects on biochemical properties of petroleum contaminated
soils. Soil and Sediment Contamination: An International Journal. 20: 234-248.
Button DK, Robertson BR, Lepp PW and Schmidt TM (1998) A small, dilute-
cytoplasm, high-affinity, novel bacterium isolated by extinction culture and having
kinetic constants compatible with growth at ambient concentrations of dissolved
nutrients in seawater. Appl Environ Microbiol. 64: 4467–4476.
Calvo C, Manzanera M, Silva-Castro GA, Uad I, González-López J (2009)
Application of bioemulsifiers in soil oil bioremediation processes. Future prospects.
Science of the Total Environment. 12: 3634–3640.
Caporaso JG, Kuczynski J, Stombaugh J, Bittinger K, Bushman FD, Costello EK,
Fierer N, Gonzalez A, Goodrich JK, Gordon JI, Huttley GA, Kelley ST, Knights D,
Koenig JE, Ley RE, Lozupone CA, McDonald D, Muegge BD, Pirrung M, Reeder J,
Sevinsky JR, Turnbaugh PJ, Walters WA, Widmann J, Yatsunenko T, Zaneveld J &
Knight R (2010) QIIME allows analysis of high-throughput community sequencing
data. Nature Methods. 7: 335-336.
CBE (Center for Biofilm Engineering) (2013), Montana State University (MSU)
http://www.biofilm.montana.edu/node/2390
Coulon F, McKew BA, Osborn AM, McGenity TJ and Timmis KN (2007) Effects of
temperature and biostimulation on oil-degrading microbial communities in temperate
estuarine waters. Environmental Microbiology 9:177–186.
Chun-jiang A, Guo-he H, Jia W, Hui Y (2011) Effect of short-chain organic acids on
the enhanced desorption of phenanthrene by rhamnolipid biosurfactant in soil-water
environment. water research. 45: 5501-5510.
Davidson CE and Lavine BK (2006) Classification and Pattern Recognition. In
Gemperline P (ed.) Practical Guide to Chemometrics. pp 339-374. CRC Press: Boca
Raton US.
Deppe U, Richnow HH, Michaelis W, Antranikian G (2005) Degradation of crude oil
by an arctic microbial consortium. Extremophiles. 9: 461–470.
Deschenes L, Lafrance P, Villeneuve J-P, Samson R (1996) Adding sodium dodecyl
sulphate and Pseudomonas aeruginosa UG2 biosurfactants inhibits polycyclic
aromatic hydrocarbon biodegradation in a weathered creosote-contaminated soil. Appl
Microbiol Biotechnol. 46: 638-646.
Dibble JT and Bartha R (1979) Effect of environmental parameters on the
biodegradation of oil sludge. Appl Environ Microbiol. 37: 729-39.

127
Díez S, Sabaté J, Viñas M, Bayona JM, Solanas AM and Albaigés J (2005) The
Prestige oil spill. I. Biodegradation of a heavy fuel oil under simulated conditions.
Environmental Toxicology and Chemistry 24:2203–2217.
Duran R (2010) Marinobacter. In Timmis KN (ed.) Handbook of Hydrocarbon and
Lipid Microbiology. pp. 1726–1735. Springer-Verlag Berlin Heidelberg.
Dyksterhouse SE, Gray JP, Herwig RP, Lara JC, Staley JT (1995) Cycloclasticus
pugetii gen. nov., sp. nov., an aromatic hydrocarbon-degrading bacterium from
marine sediments. Int J Syst Bacteriol. 45: 116–123.
Efroymson RA and Alexander M (1991) Biodegradation by an arthrobacter species of
hydrocarbons partitioned into an organic solvent. Appl Environ Microbiol. 57: 1441–
1447.
Englezos P and Kalogerakis N (2001) Applied Parameter Estimation for Chemical
Engineers, Marcel Dekker, New York, NY.
Eriksson M, Dalhammar G, Mohn WW (2002). Bacterial growth and biofilm
production on pyrene. FEMS Microbiol Ecol. 40: 21–27.
Evers KU, Jensen HV, Resby JM, Ramstad S, Singaas I, Dieckmann G and Gerdes B
(2004) State of the art report on oil weathering and on the effectiveness of response
alternatives. Growth Project GRD 2-2000-30112 “ARCOP” Report 4.2.1.1(a).
El Fantroussi S and Agathos SN (2005) Is bioaugmentation a feasible strategy for
pollutant removal and site remediation? Current Opinion in Microbiology 8: 268–275.
Fernandez-Alvarez P, Vila J, Garrido-Fernandez JM, Grifoll M and Lema JM (2006)
Trials of bioremediation on a beach affected by the heavy oil spill of the Prestige.
Journal of Hazardous Materials 137: 1523–1531.
Forster JC (1995) Determination of the gravimetric water content and soil dry mass.
In Alef K and Nannipieri P (eds.) Methods in Applied Soil Microbiology and
Biochemistry. pp. 105-106. London: Academic Press.
Garcia-Blanco S, Venosa AD, Suidan MT, Lee K, Cobanli S and Haines JR (2007)
Biostimulation for the treatment of an oil-contaminated coastal salt marsh.
Biodegradation. 18:1–15.
Gentry TJ, Josephson KL and Pepper IL (2004) Functional establishment of
introduced chlorobenzoate degraders following bioaugmentation with newly activated
soil. Biodegradation. 15:67–75.
Gertler C, Gerdts G, Timmis KN, Yakimov MM and Golyshin PN (2009) Populations
of heavy fuel oil-degrading marine microbial community in presence of oil sorbent
materials. Journal of Applied Microbiology. 107: 590–605
Goldstein RM, Mallory LM and Alexander M (1985) Reasons for possible failure of
inoculation to enhance biodegradation. Applied and Environmental Microbiology. 50:
977-983.
Golyshin PN, Chernikova TN, Abraham WR, Lunsdorf H, Timmis KN, Yakimov
MM (2002) Oleiphilaceae fam. Nov., to include Oleiphilus messinensis gen. Nov., sp.

128
Nov., a novel marine bacterium that obligately utilizes hydrocarbons. Int J Syst Evol
Microbiol. 52: 901–911.
Grimaud R (2010) Biofilm Development at Interfaces between Hydrophobic Organic
Compounds and Water. In Timmis KN (ed.) Handbook of Hydrocarbon and Lipid
Microbiology. pp. 1492–1499. Springer-Verlag: Berlin Heidelberg.
Haddock JD (2010) Aerobic Degradation of Aromatic Hydrocarbons: Enzyme
Structures and Catalytic Mechanisms. In Timmis KN (ed.) Handbook of Hydrocarbon
and Lipid Microbiology. pp. 1058–1069. Springer-Verlag Berlin Heidelberg.
Haines JR, Kleiner EJ, McClellan KA, Koran KM, Holder EL, King WD and Venosa
AD (2005) Laboratory evaluation of oil spill bioremediation products in salt and
freshwater systems. Journal of Industrial Microbiology & Biotechnology. 32: 171–
185.
Harayama S, Kasai Y, Hara A (2004) Microbial communities in oil-contaminated
seawater. Current Opinion in Biotechnology. 15: 205–214.
Harmsen J, Rulkens WH, Sims RC, Rijtema PE, Zweers AJ (2007) Theory and
Application of Landfarming to Remediate Polycyclic Aromatic Hydrocarbons and
Mineral Oil-Contaminated Sediments; Beneficial Reuse J. Environ. Qual. 36:1112–
1122.
Hosokawa R, Nagai M, Morikawa M and Okuyama H (2009) Autochthonous
bioaugmentation and its possible application to oil spills. World Journal of
Microbiology and Biotechnology. 25: 1519–1528.
Hozumi T, Tsutsumi H and Kono M (2000) Bioremediation on the shore after an oil
spill from the Nakhodka in the Sea of Japan. I. Chemistry and characteristics of the
heavy oil loaded on the Nakhodka and biodegradation tests on oil by a bioremediation
agent with microbial cultures in the laboratory. Marine Pollution Bulletin 40: 308-
314.
ITOPF – International Tanker Owners Pollution Federation (2013).
http://www.itopf.com/information-services/data-and-statistics/statistics/ (last accessed
on 18-June-2013).
Jiménez N, Viñas M, Sabaté J, Díez S, Bayona JM, Solanas AM and Albaiges J
(2006) The Prestige oil spill. II. Enhanced biodegradation of a heavy fuel oil by the
use of an oleophilic fertilizer under field conditions. Environmental Science and
Technology 40:2578–2585.
Jung J, Noh J, Park W (2011) Physiological and metabolic responses for hexadecane
degradation in Acinetobacter oleivorans DR1. The Journal of Microbiology. 49:, 208-
215.
Kalogerakis N (2005) Ex-situ Bioremediation of Contaminated Soils. In Liens P,
Grotenhuis T, Grzegorz M and Tabak H (eds.) Soil and Sediment Remediation. pp.
151-175. IWA Publishing.

129
Karpouzas DG and Singh BK (2010) Application of Fingerprinting Molecular
Methods in Bioremediation Studies. In Cummings SP (ed.), Bioremediation, Methods
in Molecular Biology. pp. 69-88. Humana Press.
Kasai Y, Kishira H, Sasaki T, Syutsubo K, Watanabe K and Harayama S (2002)
Predominant growth of Alcanivorax strains in oil-contaminated and nutrient-
supplemented sea water. Environmental Microbiology. 4:141–147.
Kennedy RS, Finnerty WR, Sudarsanan K, Young RA (1975) Microbial assimilation
of hydrocarbons. I. The fine structure of a hydrocarbon oxidizing Acinetobacter sp.
Arch Microbiol. 102: 75–83.
Khan FI, Husain T, Hejazi R (2004) An overview and analysis of site remediation
technologies. Journal of Environmental Management. 71: 95–122.
Kirby MF and Law RJ (2008) Oil spill treatment products approval: The UK
approach and potential application to the Gulf region. Marine Pollution Bulletin
56:1243–1247.
Klee AJ (1993) A computer program for the determination of most probable number
and its confidence limits Journal of Microbiological Methods. 18: 91-98.
Klein B, Grossi V, Bouriat P, Goulas P, Grimaud R (2008) Cytoplasmic wax ester
accumulation during biofilm driven substrate assimilation at the alkane-water
interface by Marinobacter hydrocarbonoclasticus SP17. Res Microbiol. 159: 137–144.
Kosaric N (2001) Biosurfactants and their application for soil bioremediation. Food
Technology and Biotechnology. 39: 295–304.
Kuczynski J, Lauber CL, Walters WA, Parfrey LW, Clemente JC, Gevers D & Knight
R (2012) Experimental and analytical tools for studying the human microbiome. Nat
Rev Genet. 13: 47-58.
Leahy JG and Colwell RR (1990) Microbial Degradation of hydrocarbons in the
environment. Microbial Reviews 53: 305-315.
Lee K and Levy EM (1987) Enhanced biodegradation of a light crude oil in sandy
beaches. Proceedings of 1987 Oil Spill Conference. pp 411–416. Washington, DC:
American Petroleum Institute.
Lee K and Levy EM (1989) Enhancement of the natural biodegradation of condensate
and crude oil on beaches of Atlantic Canada. Proceedings of 1989 Oil Spill
Conference. pp 479–486. Washington, DC: American Petroleum Institute.
Lee K and Trembley GH (1993), Bioremediation: Application of slow-release
fertilizers on low energy shorelines. Proceedings of the 1993 Oil Spill Conference. pp
449–454. Washington, DC: American Petroleum Institute.
Lee K, Siron R and Tremblay GH (1995a) Effectiveness of bioremediation in
reducing toxicity in oiled intertidal sediments. In Hinchee et al. (eds) Microbial
Processes for Bioremediation. pp 117–127. Columbus, OH: Battelle Press.
Lee K, Tremblay GH and Cobanli SE (1995b) Bioremediation of oiled beach
sediments: Assessment of inorganic and organic fertilizers. Proceedings of 1995 Oil
Spill Conference. pp 107–113. Washington, DC: American Petroleum Institute.

130
Lee K, Tremblay GH, Gauthier J, Cobanli SE and Griffin M (1997) Bioaugmentation
and biostimulation: a paradox between laboratory and field results. Proceedings of
1997 International Oil Spill Conference. pp697-705. Washington DC: American
Petroleum Institute.
Li G, Huang W, Lerner DN, Zhang X (2000) Enrichment of degrading microbes and
bioremediation of petrochemical contaminants in polluted soil. Water Research. 34:
3845–3853.
Macedo AJ, Kuhlicke U, Neu TR, Timmis KN, Abraham WR (2005) Three stages of
a biofilm community developing at the liquid-liquid interface between
polychlorinated biphenyls and water. Appl Environ Microbiol. 71: 7301–7309.
Maila MP and Cloete TE (2004) Bioremediation of petroleum hydrocarbons through
landfarming: Are simplicity and cost-effectiveness the only advantages? Reviews in
Environmental Science & Bio/Technology. 3: 349–360.
Maki H, Utsumi M, Koshikawa H, Hiwatari T, Kohata K, Uchiyama H, Suzuki M,
Noguchi T, Yamasaki T, Furuki M and Watanabe M (2002) Intrinsic biodegradation
of heavy oil from nakhodka and the effect of exogenous fertilization at a coastal area
of the sea of Japan. Water Air and Soil Pollution 145:123–138.
Maki H, Hirayama N, Hiwatari T, Kohata K, Uchiyama H, Watanabe M, Yamasaki F
and Furuki M (2003), Crude oil bioremediation field experiment in the Sea of Japan.
Marine Pollution Bulletin 47:74–77.
Margesin R and Schinner F (1999) Biological decontamination of oil spills in cold
environments. J. Chem. Technol. Biotechnol. 74:381-389.
Margesin R, Labbe D, Schinner F, Greer CW, Whyte LG (2003) Characterization of
hydrocarbon degrading microbial populations in contaminated and pristine Alpine
soils. Appl Environ Microbiol. 69:3085–3092.
Marin M, Pedregosa A, Laborda F (1996) Emulsifier production and microscopical
study of emulsions and biofilms formed by the hydrocarbon-utilizing bacteria
Acinetobacter calcoaceticus MM5. Appl Microbiol Biotechnol. 44: 660-667.
Martienssen M, Schirmer M (2007) Use of Surfactants to Improve the Biological
Degradation of Petroleum Hydrocarbons in a Field Site Study. Environmental
Technology. 28: 573-582.
Martins dos Santos V, Sabirova J, Timmis KN, Yakimov MM, Golyshin PN (2010)
Alcanivorax borkumensis. In Timmis KN (ed.) Handbook of Hydrocarbon and Lipid
Microbiology. pp. 1266–1288. Springer-Verlag: Berlin Heidelberg.
Mauro G and Wynne BJ (1990) Mega Borg Oil Spill: An Open Water Bioremediation
Test. Texas General Land Office Report, Austin, TX.
McKew BA, Coulon F, Yakimov M, Denaro R, Genovese M, Smith CJ, Osborn AM,
Timmis KN, McGenity TJ (2007) Efficacy of intervention strategies for
bioremediation of crude oil in marine systems and effects on indigenous
hydrocarbonoclastic bacteria. Environmental Microbiology 9:1562–1571.
131
Moore ERB, Arnscheidt A, Krüger A, Strömpl C and Mau M (1999) Simplified
protocols for the preparation of genomic DNA from bacterial cultures. In Akkermans
ADL, van Elsas JD and de Bruijn FJ (eds.) Molecular Microbial Ecology Manual, pp.
1–15. Kluwer Academic Press.
Mulder H, Breure AM, Van Honschooten D, Grotenhuis JTC, Van Andel JG, Rulkens
WH (1998) Effect of biofilm formation by Pseudomonas 8909n on the bioavailability
of solid naphthalene. Appl Microbiol Biotechnol. 50: 277–283.
Mulligan CN (2005) Environmental applications for biosurfactants. Environmental
Pollution 133:183–198.
Neu TR (1996) Significance of bacterial surface-active compounds in interaction of
bacteria with interfaces. Microb Rev. 60: 151-166.
Neu TR and Lawrence JR (2005) One-photon versus two-photon laser scanning
microscopy and digital image analysis of microbial biofilms. Methods in
Microbiology. 34: 89-136
Neu TR and Lawrence JR (2009) Extracellular polymeric substances in microbial
biofilms. In: Moran A, Brennan P, Holst O, von Itzstein M (eds) Microbial
glycobiology: Structures, relevance and applications. pp 735-758. Elsevier, San
Diego.
Neu TR and Lawrence JR (2010) Examination of microbial communities on
hydrocarbons by means of laser scanning microscopy. In Timmis KN (ed.) Handbook
of Hydrocarbon and Lipid Microbiology. pp. 4073-4084. Springer-Verlag Berlin
Heidelberg.
Neu TR, Manz B, Volke F, Dynes JJ, Hitchcock AP, Lawrence JR (2010) Advanced
imaging techniques for assessment of structure, composition and function in biofilm
systems. FEMS Microbiology Ecology. 72: 1-21
Nikolopoulou M, Pasadakis N and Kalogerakis N (2007) Enhanced bioremediation of
crude oil utilizing lipophilic fertilizers. Desalination. 211:286–295.
Nikolopoulou M and Kalogerakis N (2008) Enhanced Bioremediation of Crude Oil
Utilizing Lipophilic Fertilizers Combined with Biosurfactants and Molasses. Marine
Pollution Bulletin 56:1855–1861.
Nikolopoulou M and Kalogerakis N (2009) Biostimulation strategies for fresh and
chronically polluted marine environments with petroleum hydrocarbons. J Chem
Technol Biotechnol.84:802-807.
Nikolopoulou M and Kalogerakis N (2011) Petroleum Spill Control with Biological
Means. In Moo-Young M (ed.) Comprehensive Biotechnology. pp. 263–274. Elsevier
B.V.: Amsterdam The Netherlands.
Noordman WH, Wachter JHJ, de Boer GJ and Janssen DB (2002) The enhancement
by surfactants of hexadecane degradation by Pseudomonas aeruginosa varies with
substrate availability. J Biotechnol. 94: 195–212.

132
NRC Committee (1997) NRC Committee on Contaminated Marine Sediments,
Marine Board, Commission on Engineering and Technical Systems. Contaminated
Sediments in Ports and Waterways: Cleanup Strategies and Technologies. The
National Academy Press, Washington D.C.
Oh YS, Sim DS and Kim SJ (2001) Effects of nutrients on crude oil biodegradation in
the upper intertidal zone. Marine Pollution Bulletin. 42 1367–1372.
Olivera NL, Nievas ML, Lozada M, del Prado G, Dionisi HM, Sineriz F (2009)
Isolation and characterization of biosurfactant-producing Alcanivorax strains:
hydrocarbon accession strategies and alkane hydroxylase gene analysis. Research in
Microbiology. 160: 19-26.
Osterreicher-Ravid D, Ron EZ, Rosenberg E (2000) Horizontal transfer of an
exopolymer complex from one bacterial species to another. Environmental
Microbiology. 2: 366–372.
Palleroni NJ, Pieper DH, Moore ERB (2010) Microbiology of Hydrocarbon-
Degrading Pseudomonas. In Timmis KN (ed.) Handbook of Hydrocarbon and Lipid
Microbiology. pp. 2521–2529. Springer-Verlag Berlin Heidelberg.
Pepi M, Cesaro A, Liut G, Baldi F (2005) An antarctic psychrotrophic bacterium
Halomonas sp. ANT-3b, growing on n-hexadecane, produces a new emulsyfing
glycolipid. FEMS Microbiology Ecology. 53: 157–166.
Perfumo A, Banat IM, Canganella F and Marchant R (2006) Rhamnolipid production
by a novel thermophilic hydrocarbon-degrading Pseudomonas aeruginosa AP02-1.
Appllied Microbiology and Biotechnology. 72: 132–138.
Prince RC (1993) Petroleum spill bioremediation in marine environments. Critical
Reviews in Microbiology. 19: 217–242.
Prince RC, Elmendorf DL, Lute JR, Hsu CS, Haith CE, Senius JD, Dechert GJ,
Douglas GS and Butler EL (1994) 17α(H), 21β(H)-Hopane as a conserved internal
marker for estimating the biodegradation of crude oil. Environmental Science and
Technology. 28:142-145.
Prince RC, Garrett RM, Bare RE, Grossman MJ, Townsend T, Suflita JM, Lee K,
Owens EH, Sergy GA, Braddock JF, Lindstrom JE, Lessard RR (2003) The Roles of
Photooxidation and Biodegradation in Long-term Weathering of Crude and Heavy
Fuel Oils. Spill Science & Technology Bulletin. 8: 145–156.
Prince RC, Bare RE, Garrett RM, Grossman MJ, Haith CE, Keim LG, Lee K, Holtom
GJ, Lambert P, Sergy GA, Owens EH and Guenette CC (2003) Bioremediation of
Stranded Oil on an Arctic Shoreline. Spill Science & Technology Bulletin 8:303–312.
Prince RC, Gramain A and McGenity TJ (2010) Prokaryotic Hydrocarbon Degraders.
In Timmis KN (ed.) Handbook of Hydrocarbon and Lipid Microbiology. pp. 2521–
2529. Springer-Verlag Berlin Heidelberg.
Pritchard PH (1992). Use of inoculation in bioremediation. Current Opinion in
Biotechnology, 3:232-243

133
Pritchard PH, Mueller JG, Rogers JC, Kremer FV and Glaser JA (1992) Oil spill
bioremediation: experiences, lessons and results from the Exxon Valdez oil spill
Alaska. Biodegradation 3:109–132.
Rahman KSM, Rahman TJ, Kourkoutas Y, Petsas I, Marchant R and Banat IM (2003)
Enhanced bioremediation of n-alkane in petroleum sludge using bacterial consortium
amended with rhamnolipid and micronutrients. Bioresource Technology. 90:159–168.
Ramstad S and Sveum P (1995) Bioremediation of oil-contaminated shorelines:
Effects of different nitrogen sources. In: Hinchee RE et al. (eds) Applied
Bioremediation of Petroleum Hydrocarbons. pp 415-422. Columbus, OH: Battelle
Press.
Rodrigues AC, Brito AG, Wuertz S, Melo LF (2005) Fluorene and phenanthrene
uptake by Pseudomonas putida ATCC 17514: Kinetics and physiological aspects.
Biotechnol and Bioeng. 90: 281–289.
Roling WFM, Milner MG, Jones DM, Fratepietro F, Swannell RPJ, Daniel F and
Head IM (2004) Bacterial Community Dynamics and Hydrocarbon Degradation
during a Field-Scale Evaluation of Bioremediation on a Mudflat Beach Contaminated
with Buried Oil. Applied and Environmental Microbiology 70:2603–2613.
Ron E and Rosenberg E (2002) Biosurfactants and oil bioremediation. Current
Opinion in Biotechnology. 13: 249–252.
Ron E and Rosenberg E (2010) Role of Biosurfactants. In Timmis KN (ed.)
Handbook of Hydrocarbon and Lipid Microbiology. pp. 2521–2529. Springer-Verlag
Berlin Heidelberg.
Rosenberg E, Lagmann R, Kushmaro A, Taube R, Adler R and Ron EZ (1992)
Petroleum bioremediation—a multiphase problem. Biodegradation. 3: 337-350.
Rulkens WH and Bruning H (2005) Cleanup technologies for dredged fine sediments:
review and future challenges. In Proceedings of the third international conference on
remediation of contaminated sediments. New Orleans, La, USA. Columbus, OH:
Batelle Press.
Saeki H, Sasaki M, Komatsu K, Miura A and Matsuda H (2009) Oil spill remediation
by using the remediation agent JE1058BS that contains a biosurfactant produced by
Gordonia sp. strain JE-1058. Bioresource Technology. 100:572–577.
Santas R and Santas P (2000) Effects of wave action on the bioremediation of crude
oil saturated hydrocarbons. Marine Pollution Bulletin. 40:434-439.
Schneiker S, Martins dos Santos VAP, Bartels D, Bekel T, Brecht M, Buhrmester J
(2006) Insights into marine oil-degradation: the genome sequence of Alcanivorax
borkumensis, a cosmopolitan and efficient hydrocarbon-degrading bacterium. Nat
Biotechnol. 24: 997–1004.
Seo Y and Bishop PL (2007) Influence of Nonionic Surfactant on Attached Biofilm
Formation and Phenanthrene Bioavailability during Simulated Surfactant Enhanced
Bioremediation. Environ. Sci. Technol. 41: 7107–7113.

134
Simon M, Autenrieth RL, McDonald TJ and Bonner JS (1999) Evaluation of
bioaugmentation for remediation of petroleum in a wetland. Proceedings of 1999
International Oil Spill Conference. Washington DC: American Petroleum Institute.
Simon MA, Bonner JS, Page CA, Townsend RT, Mueller DC, Fullera CB and
Autenrieth RL (2004) Evaluation of two commercial bioaugmentation products for
enhanced removal of petroleum from a wetland. Ecological Engineering 22: 263–277.
Sipos R, Szekely A, Revesz S, and Marialigeti K (2010) Addressing PCR Biases in
Environmental Microbiology Studies. In Cummings SP (ed.) Bioremediation,
Methods in Molecular Biology. pp. 37-58. Humana Press.
Smith CJ, Nedwell DB, Dong LF, and Osborn AM (2006) Evaluation of quantitative
polymerase chain reaction based approaches for determining gene copy and gene
transcript numbers in environmental samples. Environ Microbiol. 8: 804–815.
Southam G, Whitney M, Knickerbocker C (2001) Structural characterization of the
hydrocarbon degrading bacteria–oil interface: implications for bioremediation.
International Biodeterioration & Biodegradation. 47: 197–201.
Speight JG and Arjoon KK (2012) Bioremediation of Petroleum and Petroleum
Products. co-published by John Wiley & Sons, Inc. Hoboken, New Jersey, and
Scrivener Publishing LLC, Salem, Massachusetts.
Stach JEM and Burns RG (2002) Enrichment versus biofilm culture: A functional and
phylogenetic comparison of polycyclic aromatic hydrocarbon-degrading microbial
communities. Environ Microbiol. 4: 169–182.
Staley JT (2010) Cycloclasticus: A Genus of Marine Polycyclic Aromatic
Hydrocarbon Degrading Bacteria. In Timmis KN (ed.) Handbook of Hydrocarbon
and Lipid Microbiology. pp. 1782–1786. Springer-Verlag Berlin Heidelberg.
Stenuit B, Eyers L, Schuler L, George I and Agathos SN (2009) Molecular Tools for
Monitoring and Validating Bioremediation. In Singh A et al. (eds.) Advances in
Applied Bioremediation, Soil Biology. pp 339-353. Springer-Verlag Berlin
Heidelberg.
Sveum P, Faksness LG and Ramstad S. (1994) Bioremediation and of oil-
contaminated shorelines: the role of carbon in fertilizers. In: Hinchee RE et al. (eds.)
Hydrocarbon Bioremediation. pp. 163-174. Boca Raton, FL: Lewis Publishers
Sveum P and Ramstad S (1995) Bioremediation of oil-contaminated shorelines with
organic and inorganic nutrients. In: Hinchee, RE et al. (eds) Applied Bioremediation
of Petroleum Hydrocarbons. pp 201-217. Columbus, OH: Battelle Press.
Swannell RPJ, Lee K and McDonagh M (1996) Field evaluations of marine oil spill
bioremediation. Microbiological Reviews. 60:342-365.
Swannell RPJ, Croft BC, Grant AL and Lee K (1995) Evaluation of bioremediation
agent in beach microcosms. Spill Science & Technology Bulletin. 2:151-159.
Tagger S, Bianchi A, Julliard M, Le Petit J and Roux B (1983) Effect of microbial
seeding of crude oil in seawater in a model system. Marine Biology. 78: 13-20.

135
Tamura K, Dudley J, Nei M & Kumar S (2007) MEGA4: Molecular Evolutionary
Genetics Analysis (MEGA) software version 4.0. Molecular Biology and Evolution.
24:1596-1599.
Tanaka D, Tanaka S, Yamashiro Y and Nakamura S (2008) Distribution of Oil-
Degrading Bacteria in Coastal Seawater, Toyama Bay, Japan. Environmental
Toxicology. 23: 563-569.
Thavasi R, Jayalakshmi S, Banat IM (2011) Effect of biosurfactant and fertilizer on
biodegradation of crude oil by marine isolates of Bacillus megaterium,
Corynebacterium kutscheri and Pseudomonas aeruginosa. Bioresource Technology.
102: 772–778.
Tsutsumi H, Kono M, Takai K and Manabe T (2000) Bioremediation on the shore
after an oil spill from the Nakhodka in the Sea of Japan. III. Field test of a
bioremediation agent with microbiological cultures for the treatment of an oil spill.
Marine Pollution Bulletin. 40: 320-324.
Ueno A, Ito Y, Yumoto I and Okuyama H (2007) Isolation and characterization of
bacteria from soil contaminated with diesel oil and the possible use of these in
autochthonous bioaugmentation. World Journal of Microbiology and Biotechnology.
23:1739–1745.
US Environmental Protection Agency (2003) Swirling flask dispersant effectiveness
test, revised standard dispersant toxicity test and bioremediation agent effectiveness
test. 40 CFR Part 300 Appendix C.
US EPA (2012) Assessment and Remediation of Contaminated Sediments (ARCS)
Program. http://www.epa.gov/greatlakes/arcs/citizen/citizen.html#Dredging
US EPA (2004) Chapter V (Landfarming) of OUST's publication: How to Evaluate
Alternative Cleanup Technologies for Underground Storage Tank Sites: A Guide for
Corrective Action Plan Reviewers. (EPA 510-B-95-007).
http://www.epa.gov/swerust1/pubs/tums.htm.
US FRTR (2007) Remediation Technologies Screening Matrix and Reference Guide,
Version 4.0. URL: http://www.frtr.gov/matrix2/top_page.html
van Veen JA, van Overbeek LS and van Elsas JD (1997) Fate and activity of
microorganisms introduced into soil. Microbiology and Molecular Biology Reviews
67:121–135.
Vinas M, Grifoll M, Sabate J and Solanas AM (2002) Biodegradation of a crude oil
by three microbial consortia of different origins and metabolic capabilities. Journal of
Industrial Microbiology & Biotechnology. 28: 252 – 260.
Venosa AD, Haines JR, Nisamaneepong W, Govind R, Pradhan S and Siddique B
(1991) Protocol for testing bioremediation products against weathered Alaskan crude
oil. Proceedings of 1991 International Oil Spill Conference. pp563-570. Washington
DC: American Petroleum Institute.

136
Venosa AD, Haines JR and Allen DM (1992) Efficacy of commercial inocula in
enhancing biodegradation of crude oil contaminating a Prince William Sound beach.
Journal of Industrial Microbiology. 10: 1-11.
Vogel TM (1996) Bioaugmentation as a soil bioremediation approach. Current
Opinion in Biotechnology. 7:311–316.
Venosa AD, Suidan MT, Wrenn BA, Strohmeier KL, Haines JR, Eberhart BL, King
DW and Holder E (1996) Bioremediation of experimental oil spill on the shoreline of
Delaware Bay. Environmental Science and Technology. 30:1764-1775.
Wang Z and Stout SA (2007) Oil Spill Environmental Forensics-Fingerprinting and
Source Identification. Elsevier Inc.
Wang Q, Garrity GM, Tiedje JM and Cole James R (2007) Naïve Bayesian Classifier
for Rapid Assignment of rRNA. Sequences into the New Bacterial Taxonomy.
Applied and Environmental Microbiology. 73: 5261-5267.
Ward OP (2010) Microbial Biosurfactants and Biodegradation. In Ramkrishna S (ed.)
Advances in Experimental Medicine and Biology Volume 672, Biosurfactants. pp. 65-
74. Landes Bioscience and Springer Science &Business Media.
Whyte LG, Slagman SJ, Pietrantonio F, Bourbonniere L, Koval SF, Lawrence JR,
Inniss WE, Greer CW (1999) Physiological adaptations involved in alkane
assimilation at a low temperature by Rhodococcus sp. Strain Q15. Appl Environ
Microbiol. 65: 2961–2968.
Wick LY, Pasche N, Bernasconi SM, Pelz O, Harms H (2003) Characterization of
multiple-substrate utilization by anthracene-degradingMycobacterium
frederiksbergense LB501T. Appl Environ Microbiol. 69: 6133–6142.
Wilke BM (2005) Determination of Chemical and Physical Soil Properties. In
Margesin R and Schinner F (Eds.) Soil Biology, Volume 5 Manual for Soil Analysis
p.44 -95. Springer-Verlag Berlin Heidelberg.
Willison JC (2004) Isolation and characterization of a novel sphingomonad capable of
growth with chrysene as sole carbon and energy source. FEMS Microbiol Lett. 241:
143–150.
Wrabel ML and Peckol P (2000) Effects of Bioremediation on Toxicity and Chemical
Composition of No. 2 Fuel Oil Growth Responses of the Brown Alga Fucus
vesiculosus. Marine Pollution Bulletin. 40:135-139.
Wrenn BA, Haines JR, Venosa AD, Kadkhodayan M and Suidan MT (1994) Effects
of nitrogen source on crude oil biodegradation. Journal of Industrial Microbiology.
13:279-286.
Wrenn A and Venosa AD (1996) Selective enumeration of aromatic and aliphatic
hydrocarbon degrading bacteria by a most-probable number procedure. Can. J.
Microbiol. 42: 252-258.
Wright AL and Weaver RW (2004) Fertilization and bioaugmentation for oil
biodegradation in saltmarsh mesocosms. Water, Air, and Soil Pollution. 156: 229–
240.

137
Xia WX, Li JC, Zheng XL, Bi XJ and Shao JL (2006) Enhanced Biodegradation of
Diesel Oil in Seawater Supplemented with Nutrients. Engineering in Life Sciences
6:80-85.
Xu, R, Obbard JP and Tay ETC (2003) Optimization of slow-release fertilizer dosage
for bioremediation of oil-contaminated beach sediment in a tropical environment.
World Journal of Microbiology and Biotechnology. 19: 719–725.
Xu R, Lau ANL and Obbard JP (2004) Application of a slow-release fertilizer for
indigenous petroleum hydrocarbon biodegradation in an oil-contaminated beach
sediment. Journal of Environmental Quality 33: 1210– 1216.
Xu R, Yong LC, Lim YL and Obbard JP (2005a) Use of slow-release fertilizer and
biopolymers for stimulating hydrocarbon biodegradation in oil-contaminated beach
sediments. Marine Pollution Bulletin 51: 1101–1110.
Xu R, Lau ANL, Lim YL and Obbard JP (2005b) Bioremediation of oil contaminated
sediments on an intertidal shoreline using a slow-release fertilizer and chitosan.
Marine Pollution Bulletin 51: 1062–1070.
Yakimov MM, Golyshin PN, Lang S, Moore ERB, Abraham WR, Lünsdorf H &
Timmis KN (1998). Alcanivorax borkumensis gen. nov., sp. nov., a new,
hydrocarbon-degrading and surfactant producing marine bacterium. Int J Syst
Bacteriol. 48: 339–348.
Yakimov M, Giuliano L, Denaro R, Crisafi E, Chernikova T, Abraham WR,
Luensdorf H, Timmis K and Golyshin P (2004) Thalassolituus oleivorans gen. nov.,
sp. nov., a novel marine bacterium that obligately utilizes hydrocarbons. International
Journal of Systematic and Evolutionary Microbiology. 54: 141–148.
Yakimov M, Timmis K and Golyshin P (2007) Obligate oil-degrading marine
bacteria. Current Opinion in Biotechnology. 18: 257–266.
Zrafi-Nouira I, Guermazi S, Chouari R, Safi NMD, Pelletier E, Bakhrouf A, Saidane-
Mosbahi D and Sghir A (2009) Molecular diversity analysis and bacterial population
dynamics of an adapted seawater microbiota during the degradation of Tunisian
zarzatine oil. Biodegradation. 20: 467–486.
Zhang G, Wu Y, Qian X and Meng Q (2005) Biodegradation of crude oil by
Pseudomonas aeruginosa in the presence of rhamnolipids. Journal of Zhejiang
University SCIENCE 8: 725-730.
Zilber Kirschner I, Rosenberg E and Gutnick D (1980) Incorporation of 32P and
growth of pseudomonad UP-2 on n-tetracosane. Appl Environ Microbiol. 40: 1086–
1093.
Zhu X, Venosa AD, Suidan MT and Lee K (2001) Guidelines for the Bioremediation
of Marine Shorelines and Freshwater Wetlands. US Environmental Protection
Agency.

138
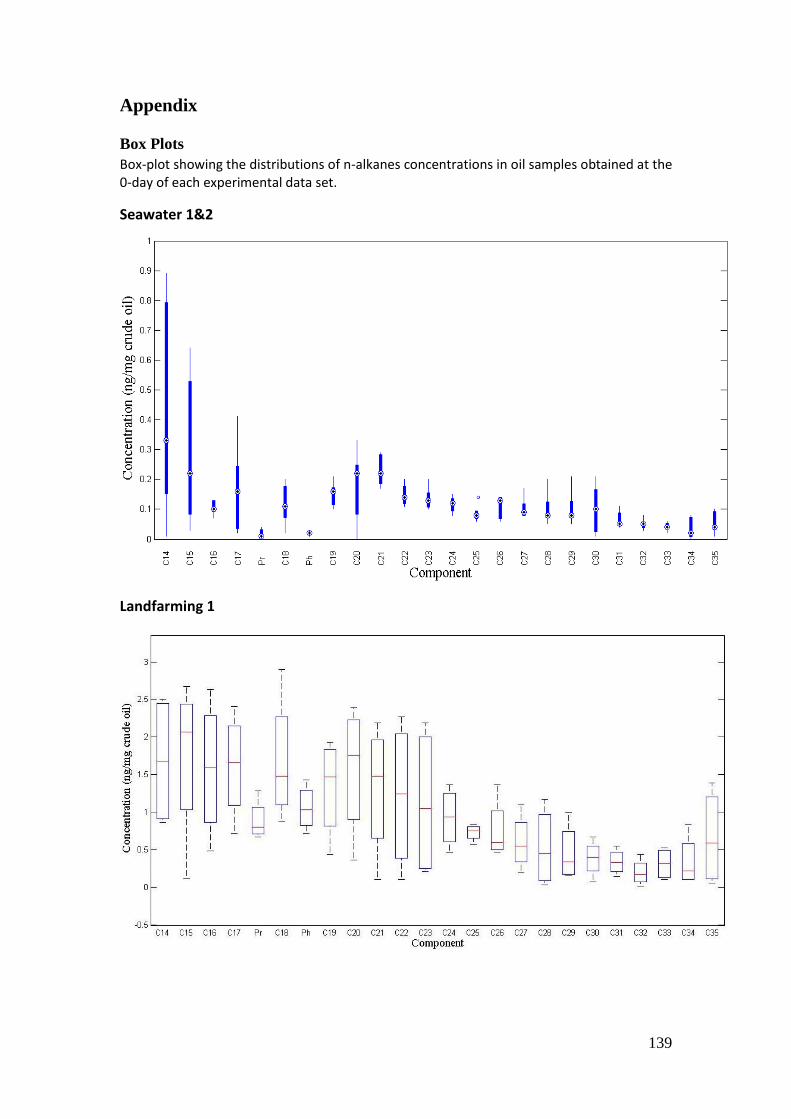
139
Appendix
Box Plots
Box-plot showing the distributions of n-alkanes concentrations in oil samples obtained at the 0-day of each experimental data set.
Seawater 1&2
Landfarming 1

140
Landfarming 2

141
Standard curves and Melting curves of RT-PCR analysis
Standard curve for A.borkumensis
S: -3.118 R2: 0.991 Y: 18.963

142

143
Standard curve for T. Oleivorans.
S: -3.052 R2: 0.99 Y: 20.328
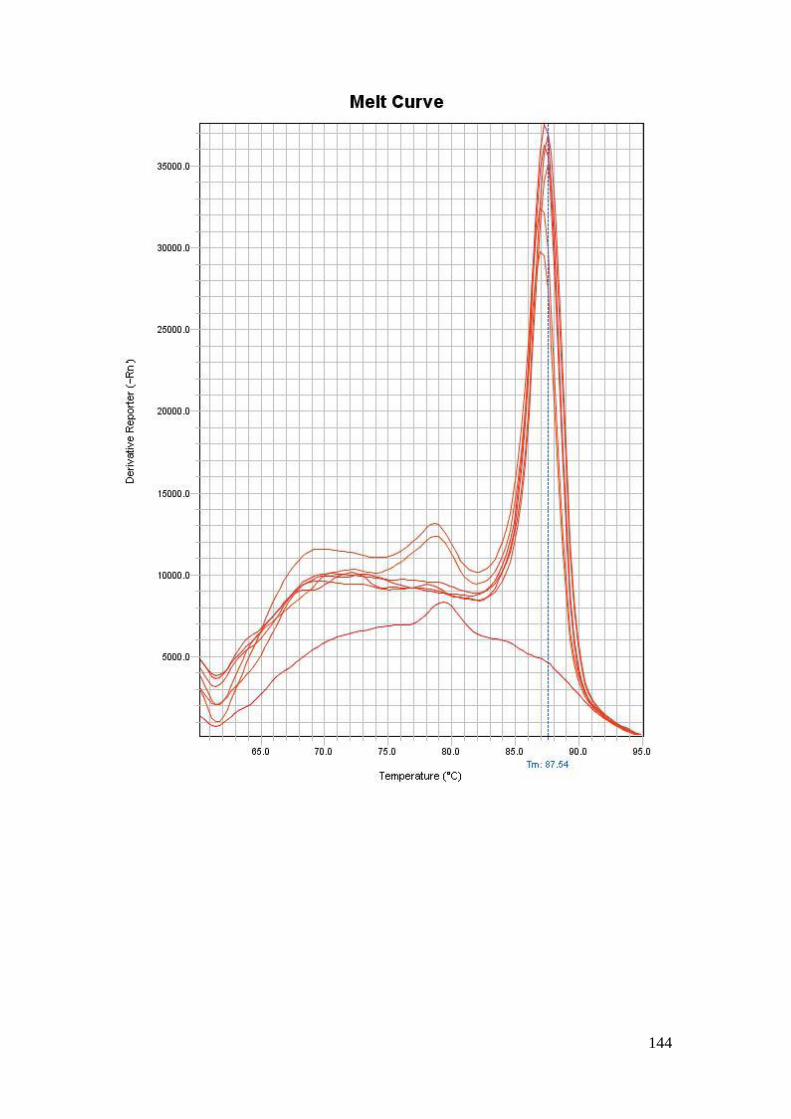
144

145
Standard curve for Cycloclasticus.
S: -3.352 R2: 0.992 Y: 27.54
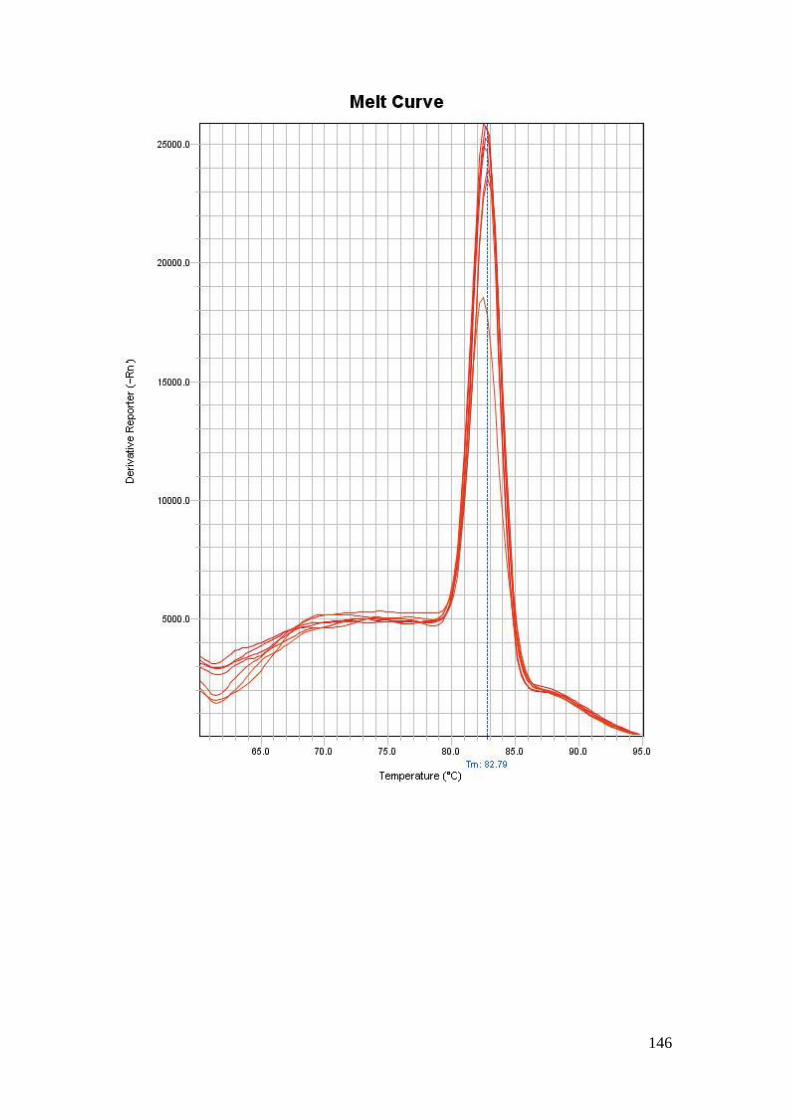
146

147
Rarefaction curves
After the removal of "noisy" and chimeric sequences, we ended up with a total of
84,529 sequences. The number of sequences per sample varied from 9,000 to 19,949.
In order to have comparable sample sizes, we rarefied the OTU table at the lowest
sample size depth, i.e. 9,000. This rarefied OTU table was used for all subsequent
community screening analyses. Rarefaction curves were very close to reaching the
horizontal asymptote, indicating that sampling was enough to capture the largest
fraction of bacterial diversity within samples.
Rarefaction curves of the 97% OTUs for different samples of the 16S rRNA molecule
Noise filtering (using the AmpliconNoise package), chimera removal (using the
PerseusD algorithm), Operational Taxonomic Unit (OTU) clustering (at 97%
similarity), OTU table construction, phylogenetic assignments using the RDP naïve
Bayesian classifier [3] and heatmap analysis were performed using QIIME v1.4 [4].
For the creation of rarefaction curves, the OTU table was rarefied from 100 to 9,000
sequences (the lowest number of clean reads per sample) with a step of 100 sequences
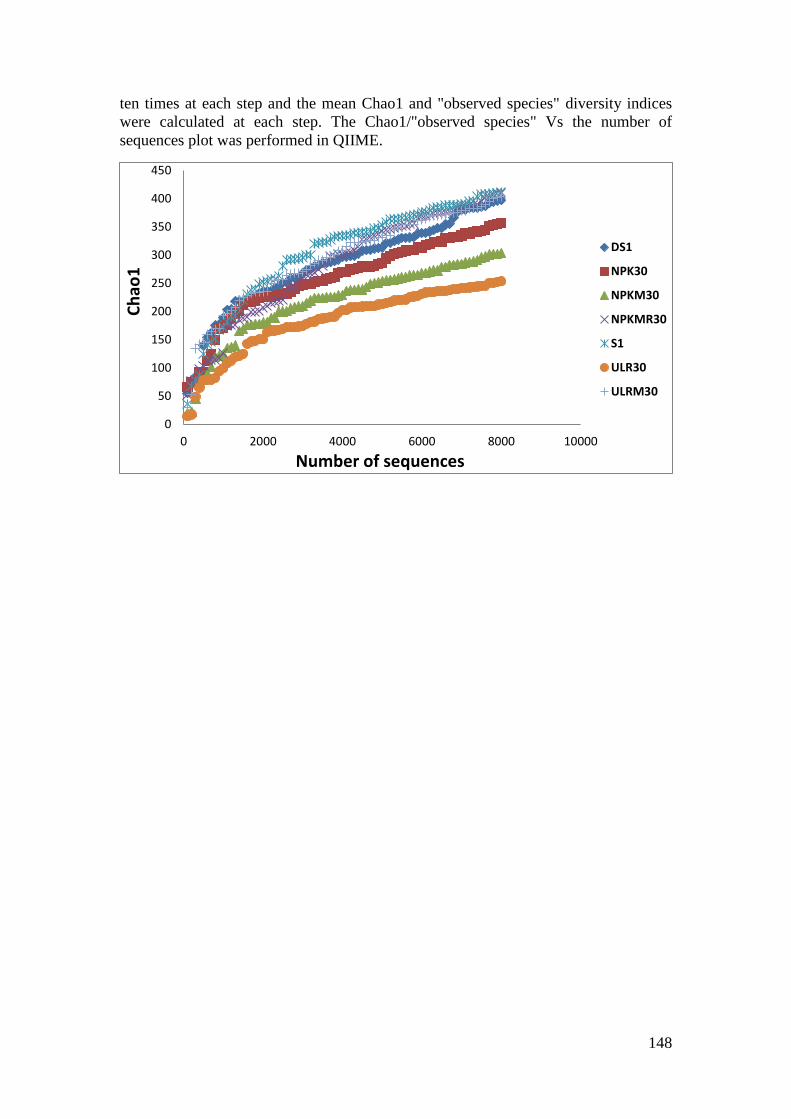
148
ten times at each step and the mean Chao1 and "observed species" diversity indices
were calculated at each step. The Chao1/"observed species" Vs the number of
sequences plot was performed in QIIME.
0
50
100
150
200
250
300
350
400
450
0 2000 4000 6000 8000 10000
Ch
ao1
Number of sequences
DS1
NPK30
NPKM30
NPKMR30
S1
ULR30
ULRM30


![Journal of Bioremediation & Biodegradation...Enhanced Degradation of Benzo[α]Pyrene in Coal Tar Contaminated Soils Using Biodiesel Oriaku TO1* and Jones DM2 1Nigerian Petroleum Development](https://static.fdocument.org/doc/165x107/5ff7fa65c39bfc5a947db0b8/journal-of-bioremediation-biodegradation-enhanced-degradation-of-benzopyrene.jpg)