
of electronic communications & postal services
100
of electronic communications & postal services
Transcript of of electronic communications & postal services

Hellenic RepublicHellenic Telecommunications & Post Commission
60 Kifissias Ave., 151 25 Μaroussi, GreeceΤ +30 210 6151000 • F +30 210 6105049
W www.eett.gr • E [email protected]
o f e l e c t r o n i c c o m m u n i c a t i o n s& p o s t a l s e r v i c e s

This report was prepared by EETT,
presenting statistical data and information regarding
the course of the electronic communications and
postal services markets for the year 2015 in Greece.
Summary 6
1. Electronic communications 8
1.1. Trends in the electronic communications market 8
1.1.1 Globally 8
1.1.2 Europe 8
1.1.3 Greece 9
1.2. Progress of the main financials in the electronic communications market 14
1.2.1 Financial data 14
1.2.2 Fixed telecommunications 21
1.2.3 Mobile communications 29
1.2.4 Comparing fixed telephony to mobile telephony 40
1.2.5 Bundled offers 42
1.2.6 Broadband 47
1.2.7 Domain names in [.gr] 55
1.2.8 Premium Rate Services (PRS) and Directory services 56
1.2.9 Greek and European market indicators 56
2. Postal Services 68
2.1 The course of the postal market 68
2.1.1 Globally 68
2.1.2 Europe 71
2.1.3 Greece 77
2.2 Evolution of the key financial figures in the postal services market 78
2.2.1 Financial data from the published financial statements 78
2.2.2 Postal volume and revenue (EETT statistics) 81
2.3 Competition in the postal market 84
2.3.1 Market shares 84
2.3.2 The Universal Service sector 85
2.3.3 The courier sector 89
Annex 94
Index of Charts and Tables 94
4

5MARKET REVIEW 2015
Summary(a) Electronic communicati ons
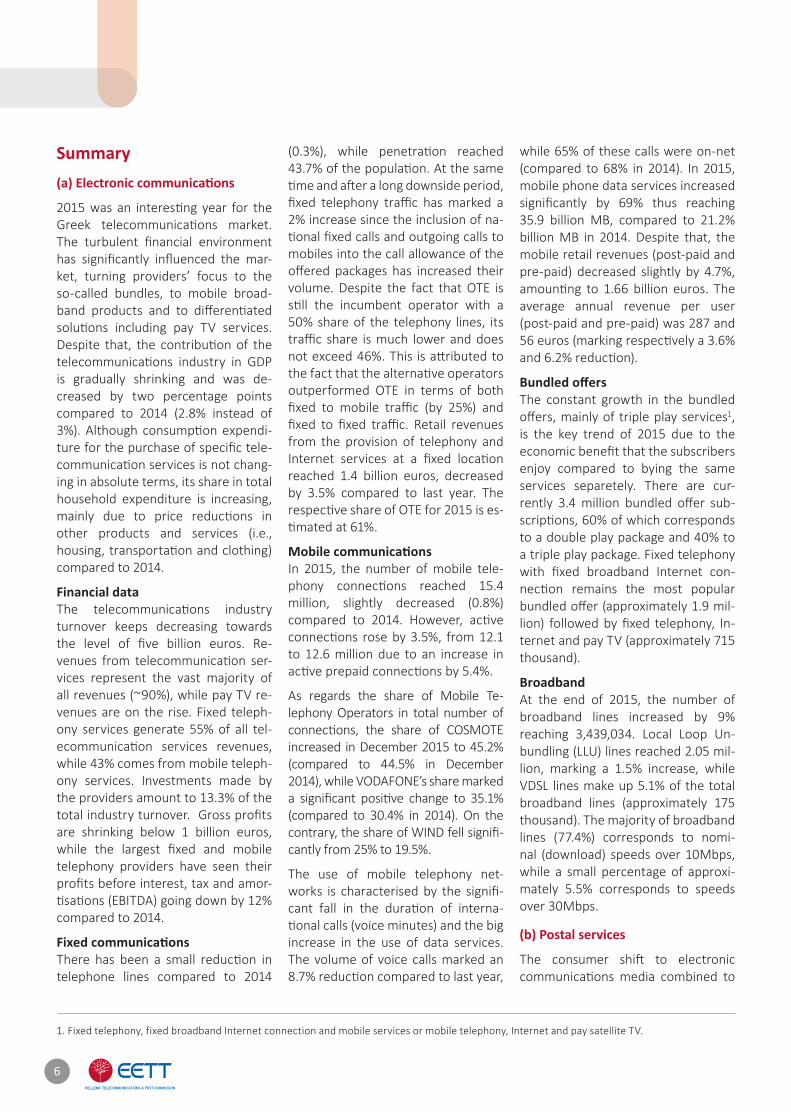
2015 was an interesti ng year for the Greek telecommunicati ons market. The turbulent fi nancial environment has signifi cantly infl uenced the mar-ket, turning providers’ focus to the so-called bundles, to mobile broad-band products and to diff erenti ated soluti ons including pay TV services. Despite that, the contributi on of the telecommunicati ons industry in GDP is gradually shrinking and was de-creased by two percentage points compared to 2014 (2.8% instead of 3%). Although consumpti on expendi-ture for the purchase of specifi c tele-communicati on services is not chang-ing in absolute terms, its share in total household expenditure is increasing, mainly due to price reducti ons in other products and services (i.e., housing, transportati on and clothing) compared to 2014.
Financial dataThe telecommunicati ons industry turnover keeps decreasing towards the level of fi ve billion euros. Re-venues from telecommunicati on ser-vices represent the vast majority of all revenues (~90%), while pay TV re-venues are on the rise. Fixed teleph-ony services generate 55% of all tel-ecommunicati on services revenues, while 43% comes from mobile teleph-ony services. Investments made by the providers amount to 13.3% of the total industry turnover. Gross profi ts are shrinking below 1 billion euros, while the largest fi xed and mobile telephony providers have seen their profi ts before interest, tax and amor-ti sati ons (EBITDA) going down by 12% compared to 2014.
Fixed communicati onsThere has been a small reducti on in telephone lines compared to 2014
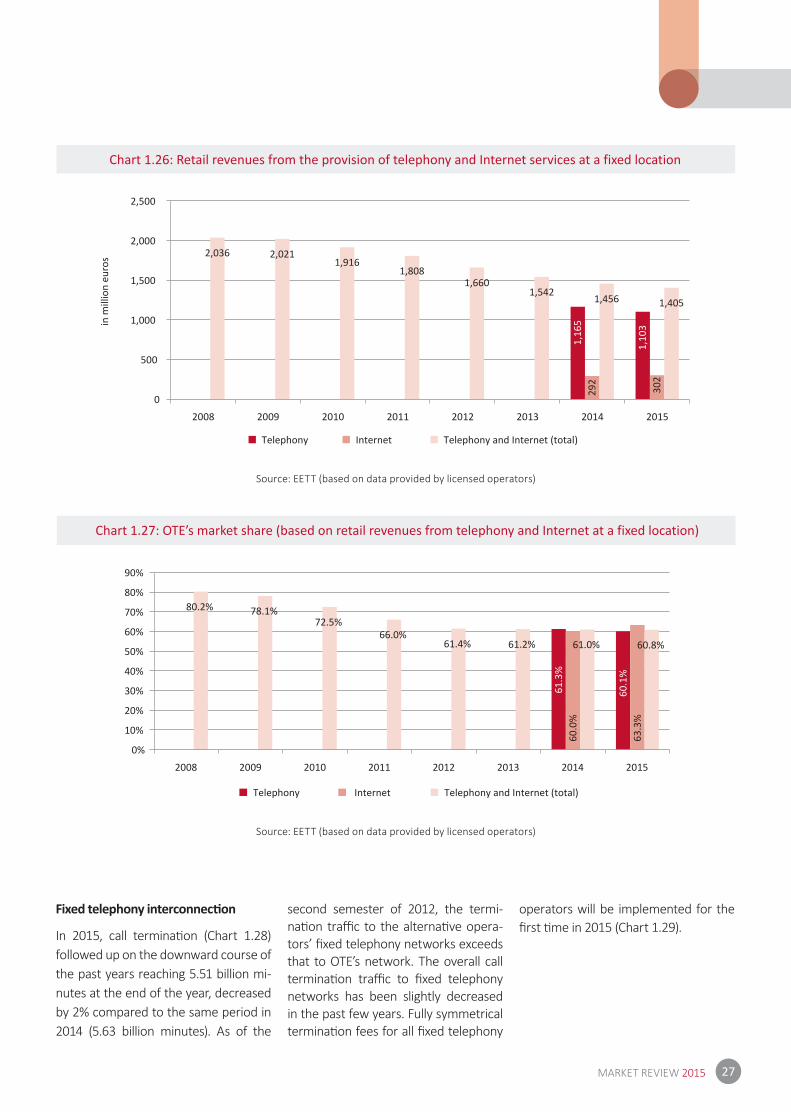
(0.3%), while penetrati on reached 43.7% of the populati on. At the same ti me and aft er a long downside period, fi xed telephony traffi c has marked a 2% increase since the inclusion of na-ti onal fi xed calls and outgoing calls to mobiles into the call allowance of the off ered packages has increased their volume. Despite the fact that OTE is sti ll the incumbent operator with a 50% share of the telephony lines, its traffi c share is much lower and does not exceed 46%. This is att ributed to the fact that the alternati ve operators outperformed OTE in terms of both fi xed to mobile traffi c (by 25%) and fi xed to fi xed traffi c. Retail revenues from the provision of telephony and Internet services at a fi xed locati on reached 1.4 billion euros, decreased by 3.5% compared to last year. The respecti ve share of OTE for 2015 is es-ti mated at 61%.
Mobile communicati ons In 2015, the number of mobile tele-phony connecti ons reached 15.4 million, slightly decreased (0.8%) compared to 2014. However, acti ve connecti ons rose by 3.5%, from 12.1 to 12.6 million due to an increase in acti ve prepaid connecti ons by 5.4%.
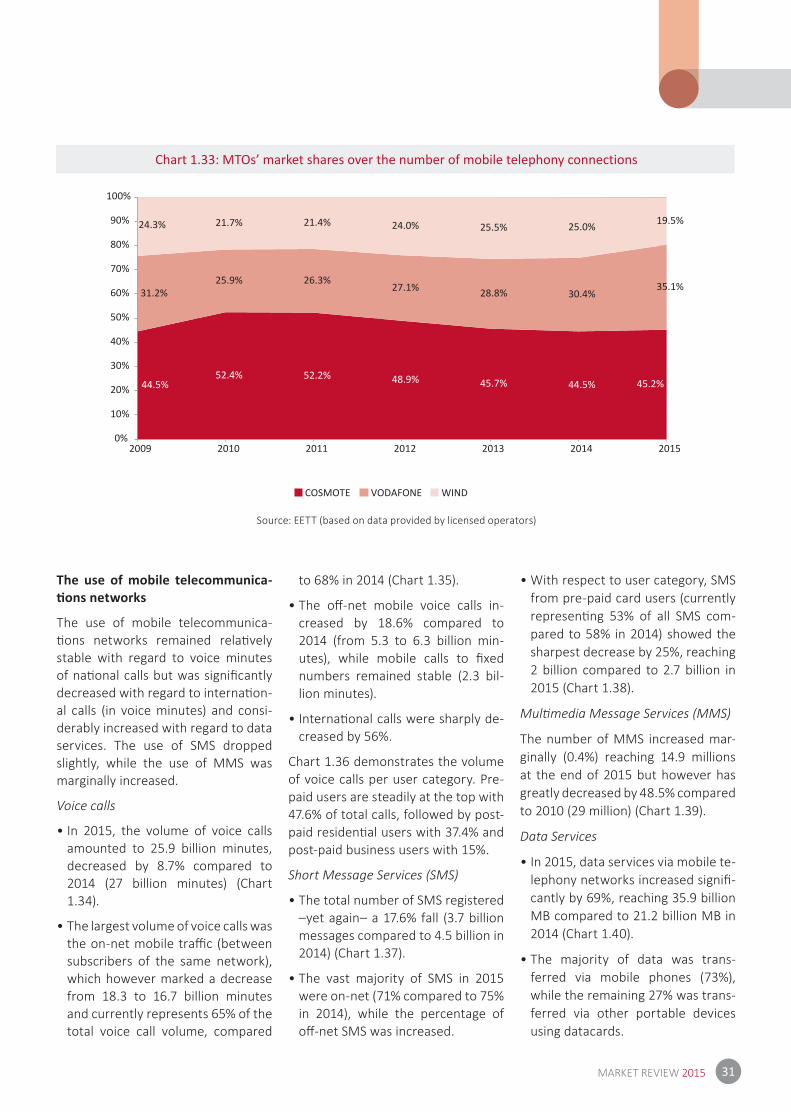
As regards the share of Mobile Te-lephony Operators in total number of connecti ons, the share of COSMOTE increased in December 2015 to 45.2% (compared to 44.5% in December 2014), while VODAFONE’s share marked a signifi cant positi ve change to 35.1% (compared to 30.4% in 2014). On the contrary, the share of WIND fell signifi -cantly from 25% to 19.5%.
The use of mobile telephony net-works is characterised by the signifi -cant fall in the durati on of interna-ti onal calls (voice minutes) and the big increase in the use of data services. The volume of voice calls marked an 8.7% reducti on compared to last year,
while 65% of these calls were on-net (compared to 68% in 2014). In 2015, mobile phone data services increased signifi cantly by 69% thus reaching 35.9 billion MB, compared to 21.2% billion MB in 2014. Despite that, the mobile retail revenues (post-paid and pre-paid) decreased slightly by 4.7%, amounti ng to 1.66 billion euros. The average annual revenue per user (post-paid and pre-paid) was 287 and 56 euros (marking respecti vely a 3.6% and 6.2% reducti on).
Bundled off ersThe constant growth in the bundled off ers, mainly of triple play services1, is the key trend of 2015 due to the economic benefi t that the subscri bers enjoy compared to bying the same services separetely. There are cur-rently 3.4 million bundled off er sub-scripti ons, 60% of which corresponds to a double play package and 40% to a triple play package. Fixed telephony with fi xed broadband Internet con-necti on remains the most popular bundled off er (approximately 1.9 mil-lion) followed by fi xed telephony, In-ternet and pay TV (approximately 715 thousand).
BroadbandAt the end of 2015, the number of broadband lines increased by 9% reaching 3,439,034. Local Loop Un-bundling (LLU) lines reached 2.05 mil-lion, marking a 1.5% increase, while VDSL lines make up 5.1% of the total broadband lines (approximately 175 thousand). The majority of broadband lines (77.4%) corresponds to nomi-nal (download) speeds over 10Mbps, while a small percentage of approxi-mately 5.5% corresponds to speeds over 30Mbps.
(b) Postal services
The consumer shift to electronic communicati ons media combined to
1. Fixed telephony, fixed broadband Internet connection and mobile services or mobile telephony, Internet and pay satellite TV.
6
the global expansion of e-commerce call for changes in the existi ng postal business model. At the same ti me, increased competi ti on and the con-ti nued substi tuti on of traditi onal cor-respondence pose a pressing need in the postal industry for new services and new growth possibiliti es.
In 2015, the postal market in Greece showed signs of recession, contrary to 2014, where stability trends prevailed. In fact, revenues were decreased by 8.1% compared to 2014; a total of 542 million euros was collected for the transportati on of 400 million items or 17.2% less than in 2014.
The Universal Service Provider’s (USP) revenue share fell in 2015 to 42% (compared to 46% in 2014), while at the same ti me, the share of courier operators went up to 55%. Despite the fact that lett ers conti nue to ac-count for the lion’s share of the mar-ket, both in volume (91%) and in reve-nues (59%), the share of parcels/small parcels was increased in 2015, mainly due to an increase in e-commerce and to the substi tuti on of lett er mail by e-mail.
In 2015, in additi on to the USP, there were 13 operators with Individual Li-cense, handling 8% of the total num-ber of items of the Universal Service market. As regards the courier mar-ket, the number of operators under General Authorizati on was 447 or 72 more than in 2014. Nowadays, postal services in Greece, including the USP, are focusing on technology-based, customer-centric strategies and in the development of innovati ve products and services in their att empt to reach a higher market share.
7MARKET REVIEW 2015
1.1. Trends in the electronic communicati ons market
1.1.1. GloballyAccording to ITU’s “Measuring Infor-mati on Society Report 2015”2, in 2015, the internati onal electronic commu-nicati ons market was characterised by mixed trends. Fixed telephony and Internet penetrati on in the general populati on remains stable or decreases while mobile telephony shows strong increasing trends (especially 3G and 4G/LTE services), due to the conti nuing development of new networks, price reducti ons and the ever expanding use of smartphones and tablets. Overall in 2015, more than 45% of all households in the world and more than 80% of all developed country households had In-ternet access. This percentage is how-ever signifi cantly smaller in less develo-ped countries, where a mere 7% of all households has Internet access. Simi-larly, mobile telephony subscripti ons exceeded 7 billion.
Signifi cant variati ons conti nue to per-
sist both between developed and de-veloping countries and between urban and rural areas. As an example, in 2015, 3G network populati on coverage is es-ti mated at 89% in urban areas and only at 29% in rural areas.
Cloud computi ng is also dynamically growing, mainly driven by the vast da-ta-storage capaciti es and the relevant services provided by apps and devices. The so-called Internet of Things (IoT) is now a reality driven by the conti nuing reducti on of the price of IoT devices, the expansion of the use of IPv6 and a set of key innovati ons such as the Wire-less Sensor Networks, the System on Chip, etc. It is esti mated that, by 2020, the IoT eco-system will include 100 bil-lion devices.
1.1.2. EuropeGeneral trendsIn Europe, the key features of 2015 were the conti nuing development of ultra-fast broadband access (focused on op-ti c fi bre networks) and the increasing demand for mobile broadband services
(especially in 4G/LTE networks). There is however an overall market contra-cti on, which in 2015 amounted to 216 billion euros compared to 237 billion euros in 2012, according to the Euro-pean Commission’s annual report en-ti tled «Europe’s Digital Progress Report 2016»3. Consumers conti nue to favour bundled service packages considerably since 50% of European households en-joy such services (Europe’s Digital Pro-gress Report 2016).
According to GSMA’s report on mobile telephony4 “data is helping recurring (service) revenues return to growth at the regional level for the fi rst ti me this decade, with growth forecast from 2017 at an annual rate of around 1% to 2020”. Although profi t margins have been negati vely impacted by competi -ti on and market regulati on, they tend to stabilize. Investments in 4G networks, spectrum licensing and network expan-sion have raised capital expenditure levels from 15% at the beginning of the decade to 20% in recent years. Despite these stabilizing trends, cash fl ow mar-gins remain below the historical avera-
2. http://www.itu.int/en/ITU-D/Statistics/Pages/publications/mis2015.aspx3. https://ec.europa.eu/digital-single-market/en/download-scoreboard-reports4. http://www.gsma.com/mobileeconomy/europe/
8
ges. This may raise questi ons over the industry’s ability to fi nance the next phase of investment in 5G technologies.
The provision of Internet communica-ti on services (Over the Top) has been acquiring an ever increasing impor-tance in the market, thus att racti ng the interest of the Body of European Regu-lators for Electronic Communicati ons (BEREC) that has recently published a relevant study (BEREC Report on OTT services5).
Mergers and acquisiti ons2015 was a year of intense acti vity in the fi eld of mergers and acquisiti ons, whose worth exceeded 45 billion euros. Currently, the major market trend is the concentrati on of the mobile market in countries where there are four major mobile operators. It seems that the predominant practi ce is the so-called footprint-expanding merger & acquisi-ti ons6, since these deals are approved faster and with fewer and less onerous conditi ons att ached (i.e., the acquisi-ti on of cable operators in Germany and
Spain by VODAFONE, the NUMERICA-BLE-SFR merger in France, etc.)
At the same ti me, similar deals have occurred in the United Kingdom (the HUTCHISON’s proposed purchase of TELEFONICA’s mobile telephony sub-sidiary in the UK), in Italy (the joint ven-ture deal between HUTCHISON and VIMPELCOM) and in France (the off ers by ALTICE and later by ORANGE for the acquisiti on of BOUYGUES TELE COM). The largest acquisiti on to date has taken place in the UK and it involves a convergence of fi xed and mobile te-lephony: BRITISH TELECOM purchased the mobile telephony operator EVE-RYTHING EVERYWHERE, which was a joint venture of DEUTSCHE TELEKOM and ORANGE. This acquisiti on has been approved without any remedies by the Directorate-General for Competi ti on of the European Commission.
European initi ati vesThe European Commission’s initi ati ve for the establishment of a Digital Sin-gle Market is sti ll in progress. Currently
the Commission is examining issues related to the operati on of electronic communicati ons market with parti cu-lar emphasis on the European Regula-tory Framework, as well as issues of wider interest such as digital intellec-tual rights, security issues, net neutrali-ty and roaming issues (Roam Like at Home) etc. It is expected that by the end of 2016, the European Commission will noti fy its recommendati ons on the review of the Regulatory Framework and consult with the other European insti tuti ons (the European Parliament and the European Council).
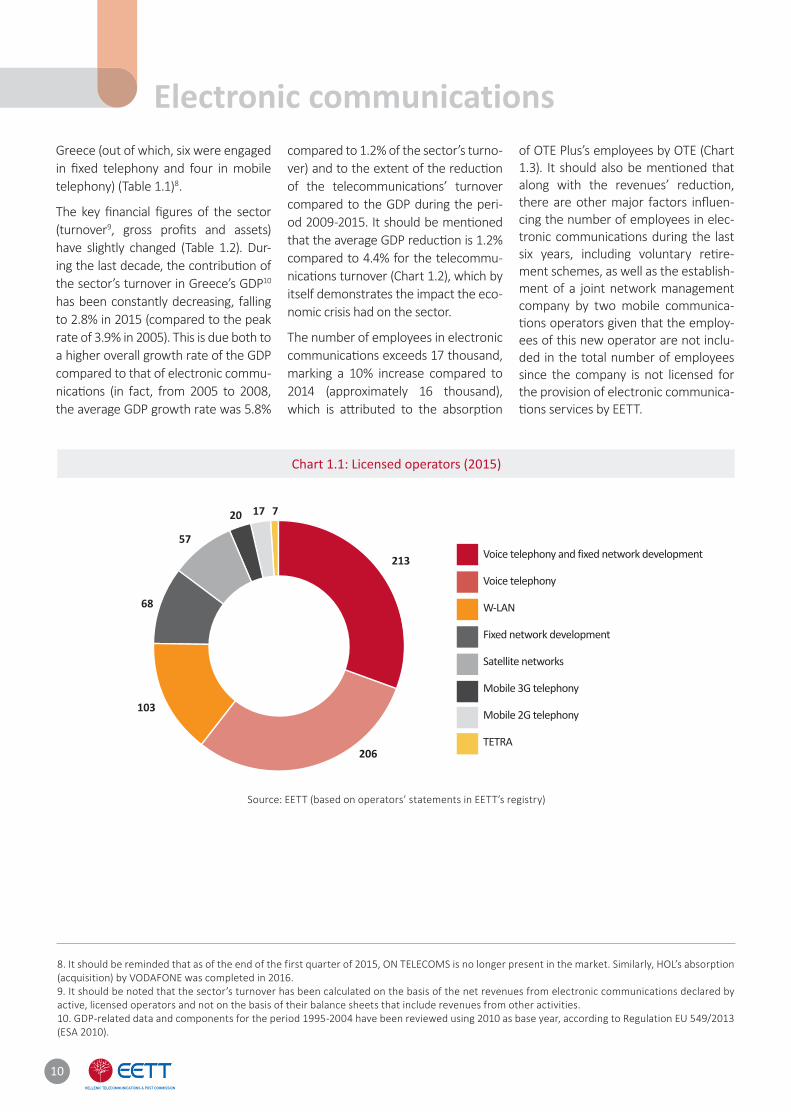
1.1.3. GreeceIn 2015, the number of licensed opera-tors in the major electronic communi-cati ons market sectors remained stable (691 compared to 633 in 2014) (Chart 1.1). The majority of these operators (70%) was off ering services in the fi elds of voice telephony and fi xed network development. As of the second quar-ter of 2015 there have been eight7 mo-bile and fi xed telephony operators in
5. http://berec.europa.eu/eng/document_register/subject_matter/berec/reports/5751-berec-report-on-ott-services6. http://www.gsma.com/mobileeconomy/europe/7. As of 2009 (following the acquisition of TELLAS), WIND is operating both in fixed and mobile telephony and therefore, the company is counted in both categories. The same is true for CYTA as of 2014, since the latter is also operating as Virtual Mobile Network Operator (VMNO).
9MARKET REVIEW 2015
10
Chart 1.1: Licensed operators (2015)
213
206
103
68
57
20 17 7
Voice telephony and fixed network development
Voice telephony
W-LAN
Fixed network development
Satellite networks
Mobile 3G telephony
Mobile 2G telephony
TETRA
Source: ΕΕΤΤ (based on operators’ statements in EETT’s registry)
Electronic communicationsGreece (out of which, six were engaged in fi xed telephony and four in mobile telephony) (Table 1.1)8.
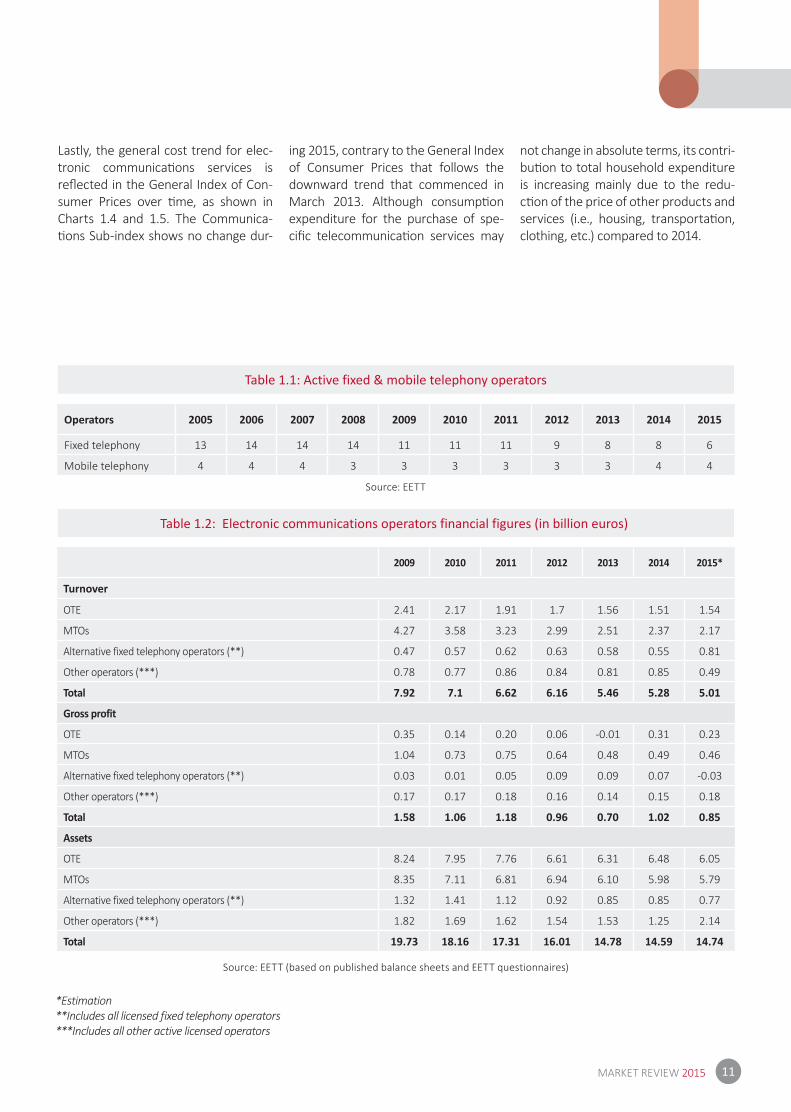
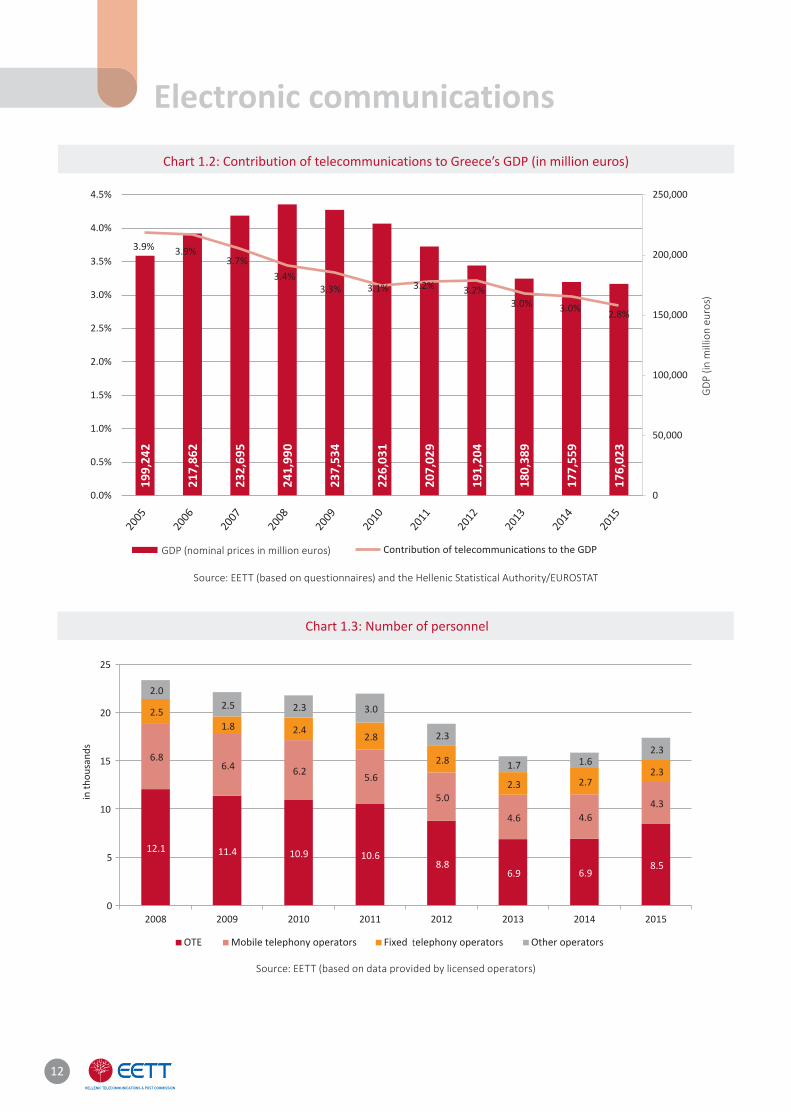
The key fi nancial fi gures of the sector (turnover9, gross profi ts and assets) have slightly changed (Table 1.2). Dur-ing the last decade, the contributi on of the sector’s turnover in Greece’s GDP10
has been constantly decreasing, falling to 2.8% in 2015 (compared to the peak rate of 3.9% in 2005). This is due both to a higher overall growth rate of the GDP compared to that of electronic commu-nicati ons (in fact, from 2005 to 2008, the average GDP growth rate was 5.8%
compared to 1.2% of the sector’s turno-ver) and to the extent of the reducti on of the telecommunicati ons’ turnover compared to the GDP during the peri-od 2009-2015. It should be menti oned that the average GDP reducti on is 1.2% compared to 4.4% for the telecommu-nicati ons turnover (Chart 1.2), which by itself demonstrates the impact the eco-nomic crisis had on the sector.
The number of employees in electronic communicati ons exceeds 17 thousand, marking a 10% increase compared to 2014 (approximately 16 thousand), which is att ributed to the absorpti on
of OTE Plus’s employees by OTE (Chart 1.3). It should also be menti oned that along with the revenues’ reducti on, there are other major factors infl uen-cing the number of employees in elec-tronic communicati ons during the last six years, including voluntary reti re-ment schemes, as well as the establish-ment of a joint network management company by two mobile communica-ti ons operators given that the employ-ees of this new operator are not inclu-ded in the total number of employees since the company is not licensed for the provision of electronic communica-ti ons services by EETT.
8. It should be reminded that as of the end of the first quarter of 2015, ON TELECOMS is no longer present in the market. Similarly, HOL’s absorption (acquisition) by VODAFONE was completed in 2016.9. It should be noted that the sector’s turnover has been calculated on the basis of the net revenues from electronic communications declared by active, licensed operators and not on the basis of their balance sheets that include revenues from other activities.10. GDP-related data and components for the period 1995-2004 have been reviewed using 2010 as base year, according to Regulation EU 549/2013 (ESA 2010).
11MARKET REVIEW 2015
Table 1.1: Active fixed & mobile telephony operators
Source: EETT
Operators 2005 2006 2007 2008 2009 2010 2011 2012 2013 2014 2015
Fixed telephony 13 14 14 14 11 11 11 9 8 8 6
Mobile telephony 4 4 4 3 3 3 3 3 3 4 4
Table 1.2: Electronic communications operators financial figures (in billion euros)
Source: EETT (based on published balance sheets and EETT questionnaires)
2009 2010 2011 2012 2013 2014 2015*
Turnover
OTE 2.41 2.17 1.91 1.7 1.56 1.51 1.54
MTOs 4.27 3.58 3.23 2.99 2.51 2.37 2.17
Alternative fixed telephony operators (**) 0.47 0.57 0.62 0.63 0.58 0.55 0.81
Other operators (***) 0.78 0.77 0.86 0.84 0.81 0.85 0.49
Total 7.92 7.1 6.62 6.16 5.46 5.28 5.01
Gross profit
OTE 0.35 0.14 0.20 0.06 -0.01 0.31 0.23
MTOs 1.04 0.73 0.75 0.64 0.48 0.49 0.46
Alternative fixed telephony operators (**) 0.03 0.01 0.05 0.09 0.09 0.07 -0.03
Other operators (***) 0.17 0.17 0.18 0.16 0.14 0.15 0.18
Total 1.58 1.06 1.18 0.96 0.70 1.02 0.85
Assets
OTE 8.24 7.95 7.76 6.61 6.31 6.48 6.05
MTOs 8.35 7.11 6.81 6.94 6.10 5.98 5.79
Alternative fixed telephony operators (**) 1.32 1.41 1.12 0.92 0.85 0.85 0.77
Other operators (***) 1.82 1.69 1.62 1.54 1.53 1.25 2.14
Total 19.73 18.16 17.31 16.01 14.78 14.59 14.74
*Estimation**Includes all licensed fixed telephony operators***Includes all other active licensed operators
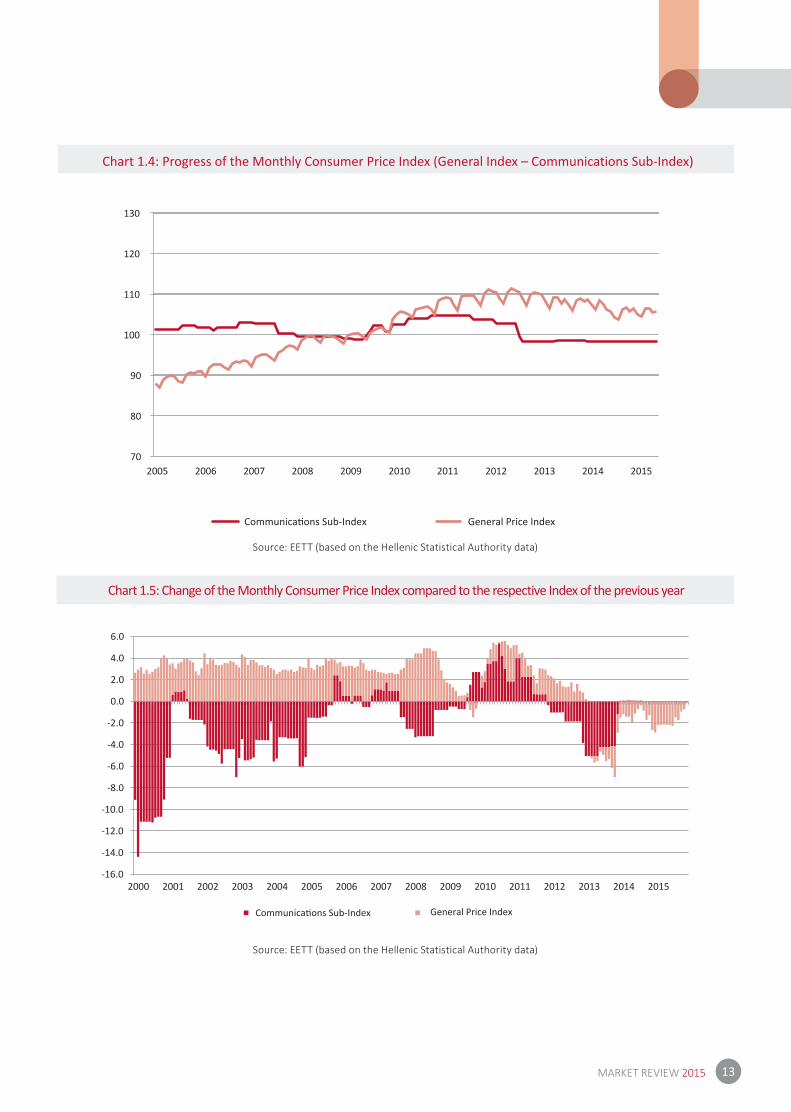
Lastly, the general cost trend for elec-tronic communicati ons services is refl ected in the General Index of Con-sumer Prices over ti me, as shown in Charts 1.4 and 1.5. The Communica-ti ons Sub-index shows no change dur-
ing 2015, contrary to the General Index of Consumer Prices that follows the downward trend that commenced in March 2013. Although consumpti on expenditure for the purchase of spe-cifi c telecommunicati on services may
not change in absolute terms, its contri-buti on to total household expenditure is increasing mainly due to the redu-cti on of the price of other products and services (i.e., housing, transportati on, clothing, etc.) compared to 2014.
12
Chart 1.2: Contribution of telecommunications to Greece’s GDP (in million euros)
Chart 1.3: Number of personnel
Source: EETT (based on questionnaires) and the Hellenic Statistical Authority/EUROSTAT
Source: EETT (based on data provided by licensed operators)
GD
P (in
mill
ion
euro
s)
GDP (nominal prices in million euros)
Electronic communications19
9,24
2
217,
862
232,
695
241,
990
237,
534
226,
031
207,
029
191,
204
180,
389
177,
559
176,
023
3.9% 3.9%3.7%
3.4%3.3% 3.1% 3.2% 3.2%
3.0% 3.0% 2.8%
0
50,000
100,000
150,000
200,000
250,000
0.0%
0.5%
1.0%
1.5%
2.0%
2.5%
3.0%
3.5%
4.0%
4.5%
12.1 11.4 10.9 10.68.8
6.9 6.98.5
6.86.4 6.2 5.6
5.0
4.6 4.64.3
2.51.8 2.4
2.8
2.8
2.3 2.72.3
2.02.5 2.3 3.0
2.3
1.7 1.62.3
0
5
10
15
20
25
2008 2009 2010 2011 2012 2013 2014 2015
in th
ousa
nds
Mobile telephony operators Fixed Telephony operators Other operators
13MARKET REVIEW 2015
Chart 1.4: Progress of the Monthly Consumer Price Index (General Index – Communications Sub-Index)
Chart 1.5: Change of the Monthly Consumer Price Index compared to the respective Index of the previous year
Source: EETT (based on the Hellenic Statistical Authority data)
Source: EETT (based on the Hellenic Statistical Authority data)
70
80
90
100
110
120
130
2005 2006 2007 2008 2009 2010 2011 2012 2013 2014 2015
General Price Index
General Price Index
-16.0
-14.0
-12.0
-10.0
-8.0
-6.0
-4.0
-2.0
0.0
2.0
4.0
6.0
2000 2001 2002 2003 2004 2005 2006 2007 2008 2009 2010 2011 2012 2013 2014 2015
14
1.2. Progress of the main fi nancials in the electronic communicati ons market 1.2.1. Financial dataThis secti on presents the main fi nan-cials of the electronic communica-ti ons market based on data gathered by EETT from licensed operators, on a semi-annually basis, regarding their turnover, investments, etc. In this context, the listed revenues relate to fi xed and mobile communicati ons, telecommunicati ons equipment and pay TV services provided by acti ve, licensed operators with an annual turnover over 150,000 euros.
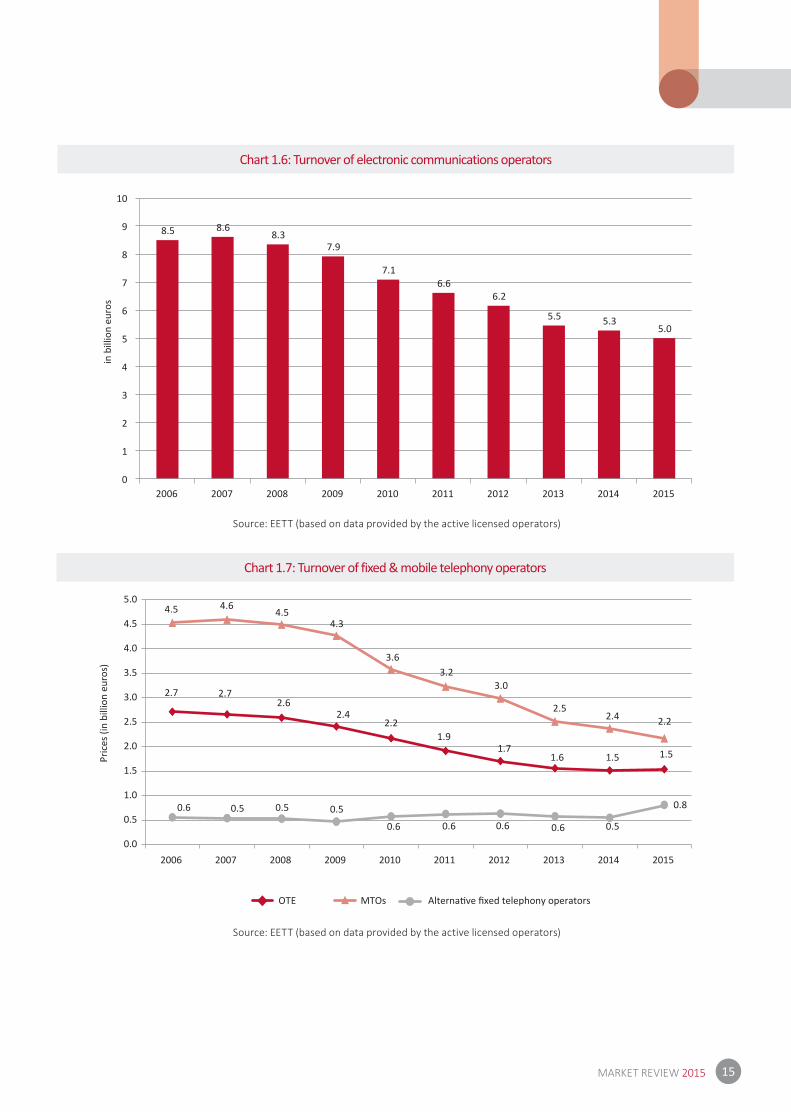
• In 2015, the telecommunicati ons industry turnover exceeded 5 billion euros (Chart 1.6). OTE’s turnover has increased by 1.6% due to an increase of the revenues from fi xed and mo-bile telephony services (Chart 1.7).
• Revenues from telecommunica-ti ons services account for the vast majority of the turnover (~90%). Re-venues from pay TV services are also on the rise (Chart 1.9), mainly due to a signifi cant increase of the subscri-ber base. It should be menti oned that in 2015, satellite TV subscribers were increased by approximately 170,000 (Chart 1.9).
• Revenues from fi xed telephony ser-vices represent approximately 55% of the revenues from telecommuni-cati ons services (Chart 1.10) and are generated by the provision of retail (telephony and Internet, including access to the telephone network, leased lines etc.) and wholesale tele-communicati ons services (i.e. inter-connecti on, wholesale access – LLU). Similarly, revenues from mobile te-lephony services include retail re-venues from mobile telephony voice and data services, as well as whole-
sale interconnecti on, roaming and other revenues.
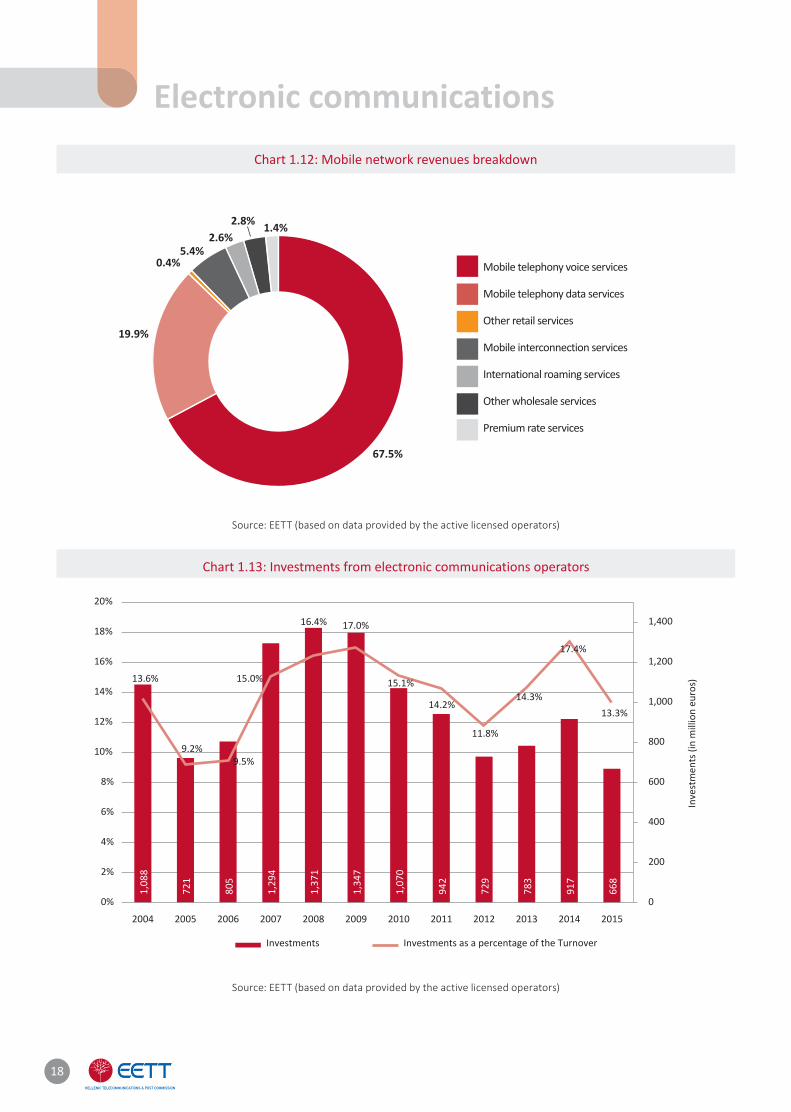
• Retail revenues from telephony and Internet services represent 73% of the total fi xed networks’ revenues, followed by the wholesale access services’ revenues (10% of total re-venues) (Chart 1.11). As regards mo-bile networks and services, retail re-venues from voice and data services represent the vast majority of total revenues at 67% and 20% respecti ve-ly (Chart 1.12).
• The total investments made by electronic communicati ons operators (Chart 1.13) have decreased by 27%, representi ng 13.3% of the total sec-tor’s turnover. This is mainly due to the increased investments by MTOs in 2014 as a result of the radio fre-quency spectrum licensing. In 2015, investments are equally distributed between fi xed and mobile telephony operators (49.2% and 50.8% respec-ti vely).
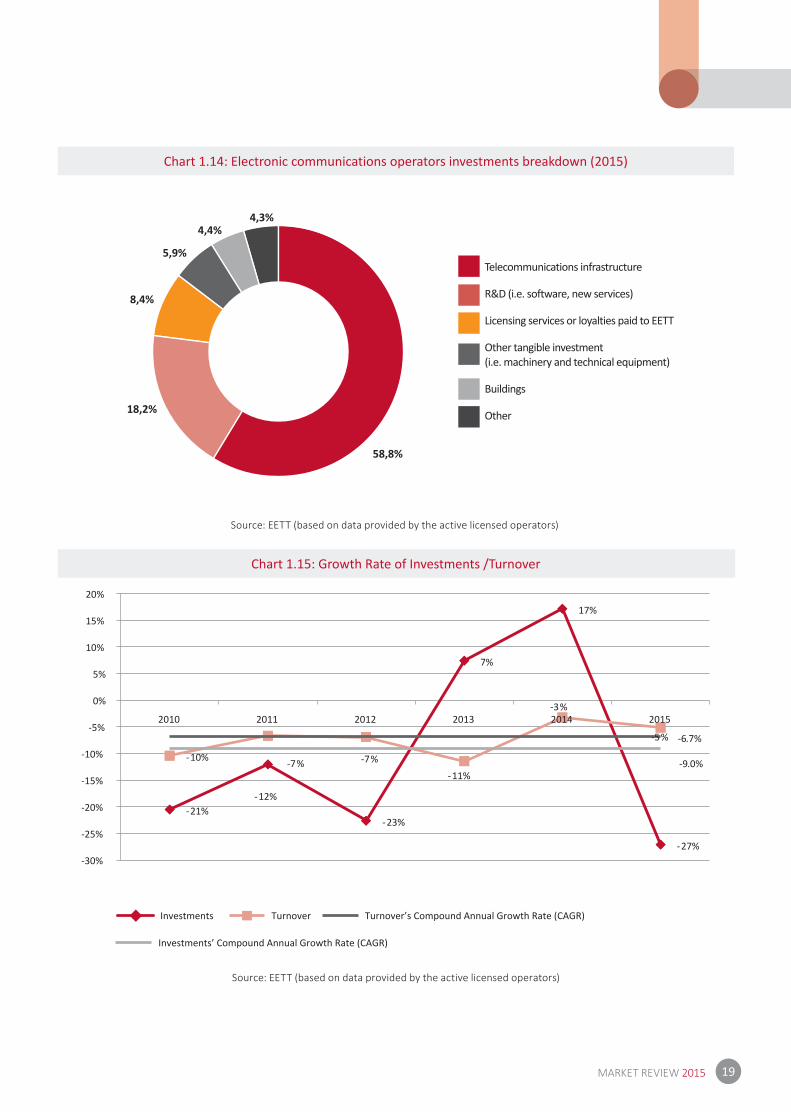
• In 2015, most of the investments made by electronic communicati ons operators (Chart 1.14) were directed towards telecommunicati ons’ infra-structure and research and develop-ment (i.e., soft ware, new services, etc.).
• The weighted average turnover’s decrease of the period 2010-2015 is lower than the decrease in invest-ments during the same period. This fact is also partly due to periodic radio frequency spectrum licensing (Chart 1.15). During the same pe-riod, things are diff erent for each of the operators: OTE may have lost, on average, 6.7% of its revenues but has increased its investments by 1.8%.
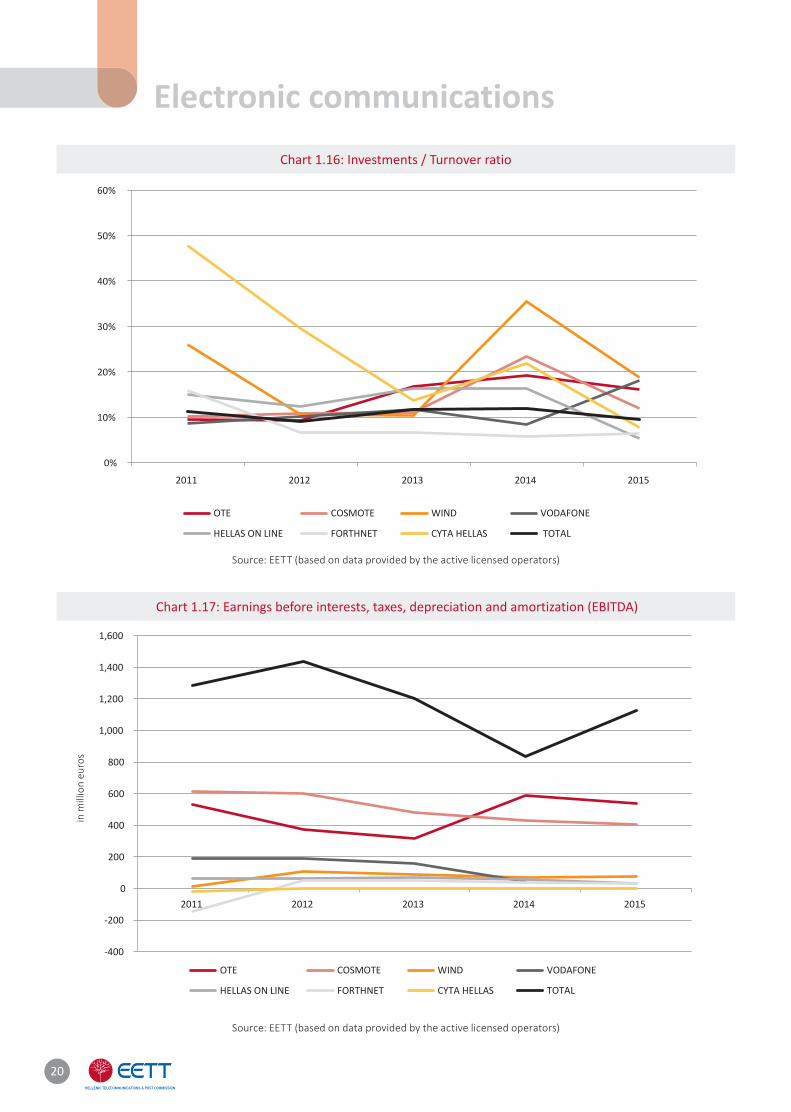
• Regarding the largest fi xed and mo-bile telephony operators, their invest-ments represent 5% to 20% of the
value of their total revenues11 (Chart 1.16).
• The profi ts before interest, tax and amorti sati ons (EBITDA) of the major fi xed and mobile telephony operators have decreased by 12% compared to 2014. It is worth menti oning that compared to 2008 and taking into ac-count the outcome of mergers and acquisiti ons, the EBITDA profi tability index was decreased almost by half, from approximately 2 to 1.1 billion euros (Chart 1.17).
11. Based on the financial statements/balance sheets of the electronic communications providers.
Electronic communications
15MARKET REVIEW 2015
Chart 1.6: Turnover of electronic communications operators
Chart 1.7: Turnover of fixed & mobile telephony operators
Source: EETT (based on data provided by the active licensed operators)
Source: EETT (based on data provided by the active licensed operators)
8.5 8.68.3
7.9
7.16.6
6.2
5.5 5.35.0
0
1
2
3
4
5
6
7
8
9
10
2006 2007 2008 2009 2010 2011 2012 2013 2014 2015
in b
illio
n eu
ros
2.7 2.72.6
2.42.2
1.91.7
1.6 1.5 1.5
4.5 4.64.5
4.3
3.63.2
3.0
2.52.4 2.2
0.6 0.5 0.5 0.5
0.6 0.6 0.6 0.6 0.5
0.8
0.0
0.5
1.0
1.5
2.0
2.5
3.0
3.5
4.0
4.5
5.0
2006 2007 2008 2009 2010 2011 2012 2013 2014 2015
Pric
es (i
n bi
llion
eur
os)
MTOs

16
Chart 1.8: Turnover breakdown
Chart 1.9: Progress of Pay TV subscriptions
Source: EETT (based on data provided by the active licensed operators)
Source: EETT (based on data provided by the active licensed operators)
87.7%
7.2%5.0%
Telecommunications services
Equipment
Television
Electronic communications
68 77 88 87
371
493
730
902
0
100
200
300
400
500
600
700
800
900
1,000
2012 2013 2014 2015
in th
ousa
nds
IPTV Satellite

17MARKET REVIEW 2015
Chart 1.10: Telecommunication services breakdown
Chart 1.11: Fixed network revenues breakdown
Source: EETT (based on data provided by the active licensed operators)
Source: EETT (based on data provided by the active licensed operators)
54.3%
73%
5.1%
2%
10.2%
3.8%3.6% 1.6%
0.5%0.2%
42.7%
0.4% 2.5%
Fixed networks
Mobile networks
Satellite
Others
Telephony & Internet services (incl. access)
Leased lines & retail data services
Other retail services
Wholesale access services (i.e. LLU)
Leased lines & wholesale data services
Fixed interconnection services
Premium rate services
Other wholesale services
18
Chart 1.12: Mobile network revenues breakdown
Chart 1.13: Investments from electronic communications operators
Source: EETT (based on data provided by the active licensed operators)
Source: EETT (based on data provided by the active licensed operators)
Mobile telephony voice services
Mobile telephony data services
Other retail services
Mobile interconnection services
International roaming services
Other wholesale services
Premium rate services
67.5%
19.9%
0.4%5.4%
2.6%2.8% 1.4%
Electronic communications1,
088
721
805
1,29
4
1,37
1
1,34
7
1,07
0
942
729
783
917
668
13.6%
9.2%9.5%
15.0%
16.4% 17.0%
15.1%
14.2%
11.8%
14.3%
17.4%
13.3%
0
200
400
600
800
1,000
1,200
1,400
0%
2%
4%
6%
8%
10%
12%
14%
16%
18%
20%
2004 2005 2006 2007 2008 2009 2010 2011 2012 2013 2014 2015
Inve
stm
ents
(in
mill
ion
euro
s)
Investments Investments as a percentage of the Turnover
19MARKET REVIEW 2015
Chart 1.14: Electronic communications operators investments breakdown (2015)
Chart 1.15: Growth Rate of Investments /Turnover
Source: EETT (based on data provided by the active licensed operators)
Source: EETT (based on data provided by the active licensed operators)
Telecommunications infrastructure
R&D (i.e. software, new services)
Licensing services or loyalties paid to EETT
Other tangible investment(i.e. machinery and technical equipment)
Buildings
Other
58,8%
18,2%
8,4%
5,9%
4,4%4,3%
-21%-12%
-23%
7%
17%
-27%
-10% -7% -7%-11%
-3%
-5% -6.7%
-9.0%
-30%
-25%
-20%
-15%
-10%
-5%
0%
5%
10%
15%
20%
2010 2011 2012 2013 2014 2015
Investments Turnover Turnover’s Compound Annual Growth Rate (CAGR)
Investments’ Compound Annual Growth Rate (CAGR)
20
Chart 1.16: Investments / Turnover ratio
Chart 1.17: Earnings before interests, taxes, depreciation and amortization (EBITDA)
Source: EETT (based on data provided by the active licensed operators)
in m
illio
n eu
ros
Source: EETT (based on data provided by the active licensed operators)
0%
10%
20%
30%
40%
50%
60%
2011 2012 2013 2014 2015
OTE COSMOTE WIND VODAFONE
HELLAS ON LINE FORTHNET CYTA HELLAS
Electronic communications
TOTAL
OTE COSMOTE WIND VODAFONE
TOTALHELLAS ON LINE FORTHNET CYTA HELLAS
-400
-200
0
200
400
600
800
1,000
1,200
1,400
1,600
2011 2012 2013 2014 2015
21MARKET REVIEW 2015
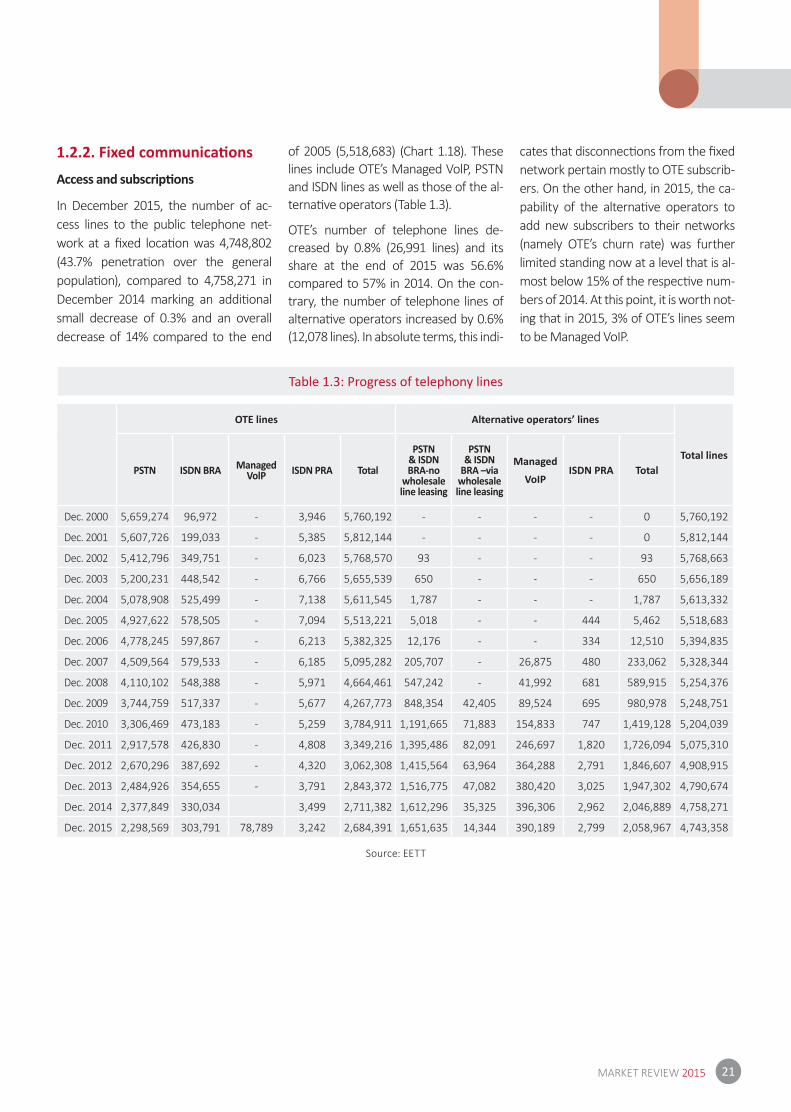
Table 1.3: Progress of telephony lines
Source: EETT
1.2.2. Fixed communicati ons
Access and subscripti ons
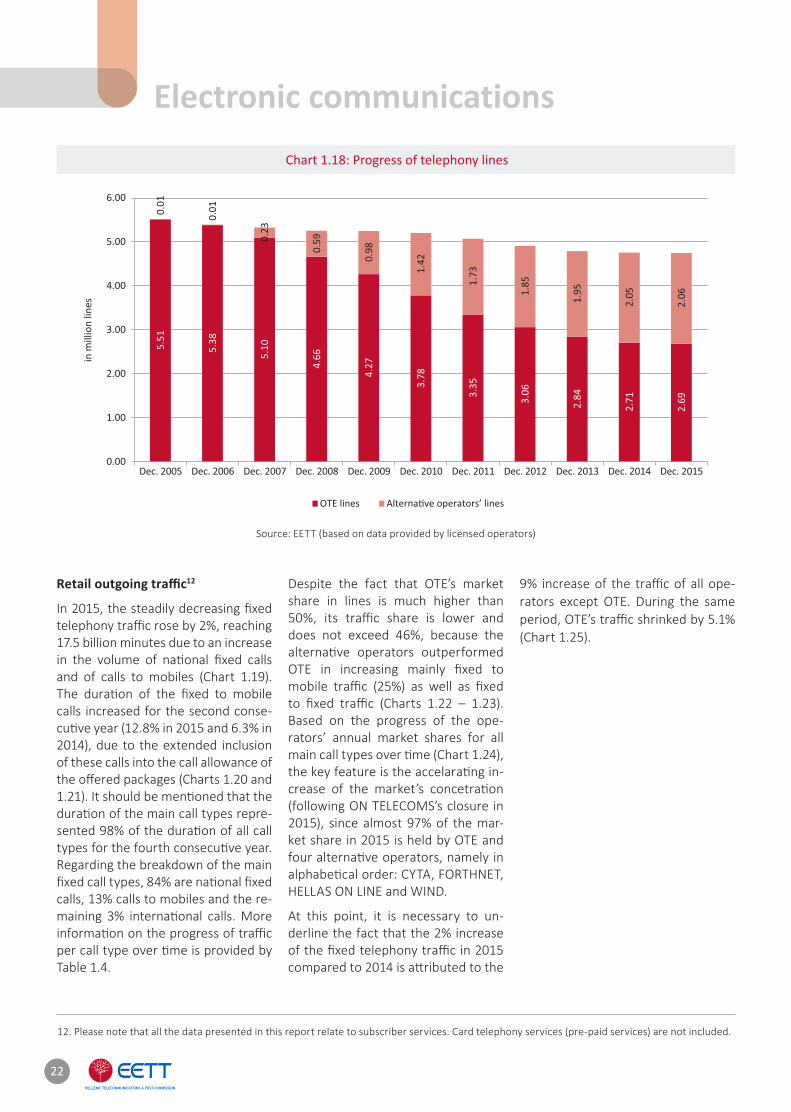
In December 2015, the number of ac-cess lines to the public telephone net-work at a fi xed locati on was 4,748,802 (43.7% penetrati on over the general populati on), compared to 4,758,271 in December 2014 marking an additi onal small decrease of 0.3% and an overall decrease of 14% compared to the end
of 2005 (5,518,683) (Chart 1.18). These lines include OTE’s Managed VolP, PSTN and ISDN lines as well as those of the al-ternati ve operators (Table 1.3).
OTE’s number of telephone lines de-creased by 0.8% (26,991 lines) and its share at the end of 2015 was 56.6% compared to 57% in 2014. On the con-trary, the number of telephone lines of alternati ve operators increased by 0.6% (12,078 lines). In absolute terms, this indi-
cates that disconnecti ons from the fi xed network pertain mostly to OTE subscrib-ers. On the other hand, in 2015, the ca-pability of the alternati ve operators to add new subscribers to their networks (namely OTE’s churn rate) was further limited standing now at a level that is al-most below 15% of the respecti ve num-bers of 2014. At this point, it is worth not-ing that in 2015, 3% of OTE’s lines seem to be Managed VoIP.
OTE lines Alternative operators’ lines
Total linesPSTN ISDN BRA Managed
VolP ISDN PRA Total
PSTN & ISDN BRA-no
wholesale line leasing
PSTN & ISDN
BRA –via wholesale line leasing
Managed
VoIPISDN PRA Total
Dec. 2000 5,659,274 96,972 - 3,946 5,760,192 - - - - 0 5,760,192
Dec. 2001 5,607,726 199,033 - 5,385 5,812,144 - - - - 0 5,812,144
Dec. 2002 5,412,796 349,751 - 6,023 5,768,570 93 - - - 93 5,768,663
Dec. 2003 5,200,231 448,542 - 6,766 5,655,539 650 - - - 650 5,656,189
Dec. 2004 5,078,908 525,499 - 7,138 5,611,545 1,787 - - - 1,787 5,613,332
Dec. 2005 4,927,622 578,505 - 7,094 5,513,221 5,018 - - 444 5,462 5,518,683
Dec. 2006 4,778,245 597,867 - 6,213 5,382,325 12,176 - - 334 12,510 5,394,835
Dec. 2007 4,509,564 579,533 - 6,185 5,095,282 205,707 - 26,875 480 233,062 5,328,344
Dec. 2008 4,110,102 548,388 - 5,971 4,664,461 547,242 - 41,992 681 589,915 5,254,376
Dec. 2009 3,744,759 517,337 - 5,677 4,267,773 848,354 42,405 89,524 695 980,978 5,248,751
Dec. 2010 3,306,469 473,183 - 5,259 3,784,911 1,191,665 71,883 154,833 747 1,419,128 5,204,039
Dec. 2011 2,917,578 426,830 - 4,808 3,349,216 1,395,486 82,091 246,697 1,820 1,726,094 5,075,310
Dec. 2012 2,670,296 387,692 - 4,320 3,062,308 1,415,564 63,964 364,288 2,791 1,846,607 4,908,915
Dec. 2013 2,484,926 354,655 - 3,791 2,843,372 1,516,775 47,082 380,420 3,025 1,947,302 4,790,674
Dec. 2014 2,377,849 330,034 3,499 2,711,382 1,612,296 35,325 396,306 2,962 2,046,889 4,758,271
Dec. 2015 2,298,569 303,791 78,789 3,242 2,684,391 1,651,635 14,344 390,189 2,799 2,058,967 4,743,358
22
Chart 1.18: Progress of telephony lines
Source: EETT (based on data provided by licensed operators)
Retail outgoing traffi c12
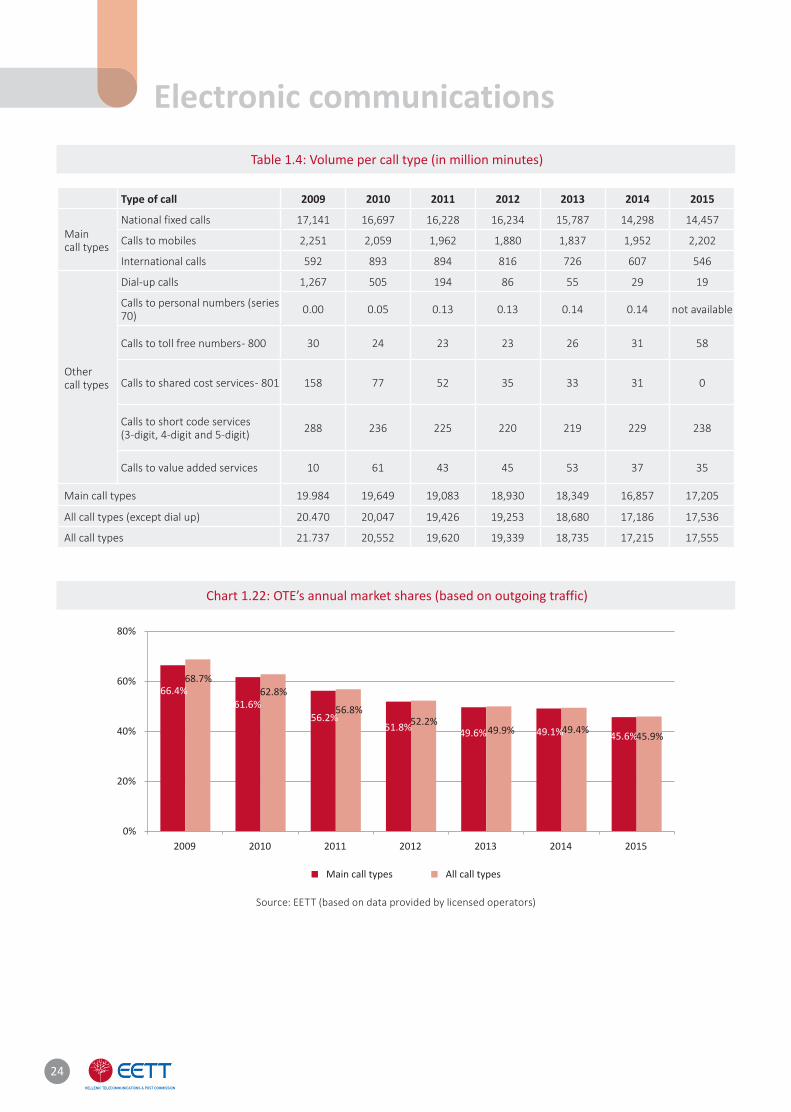
In 2015, the steadily decreasing fi xed telephony traffi c rose by 2%, reaching 17.5 billion minutes due to an increase in the volume of nati onal fi xed calls and of calls to mobiles (Chart 1.19). The durati on of the fi xed to mobile calls increased for the second conse-cuti ve year (12.8% in 2015 and 6.3% in 2014), due to the extended inclusion of these calls into the call allowance of the off ered packages (Charts 1.20 and 1.21). It should be menti oned that the durati on of the main call types repre-sented 98% of the durati on of all call types for the fourth consecuti ve year. Regarding the breakdown of the main fi xed call types, 84% are nati onal fi xed calls, 13% calls to mobiles and the re-maining 3% internati onal calls. More informati on on the progress of traffi c per call type over ti me is provided by Table 1.4.
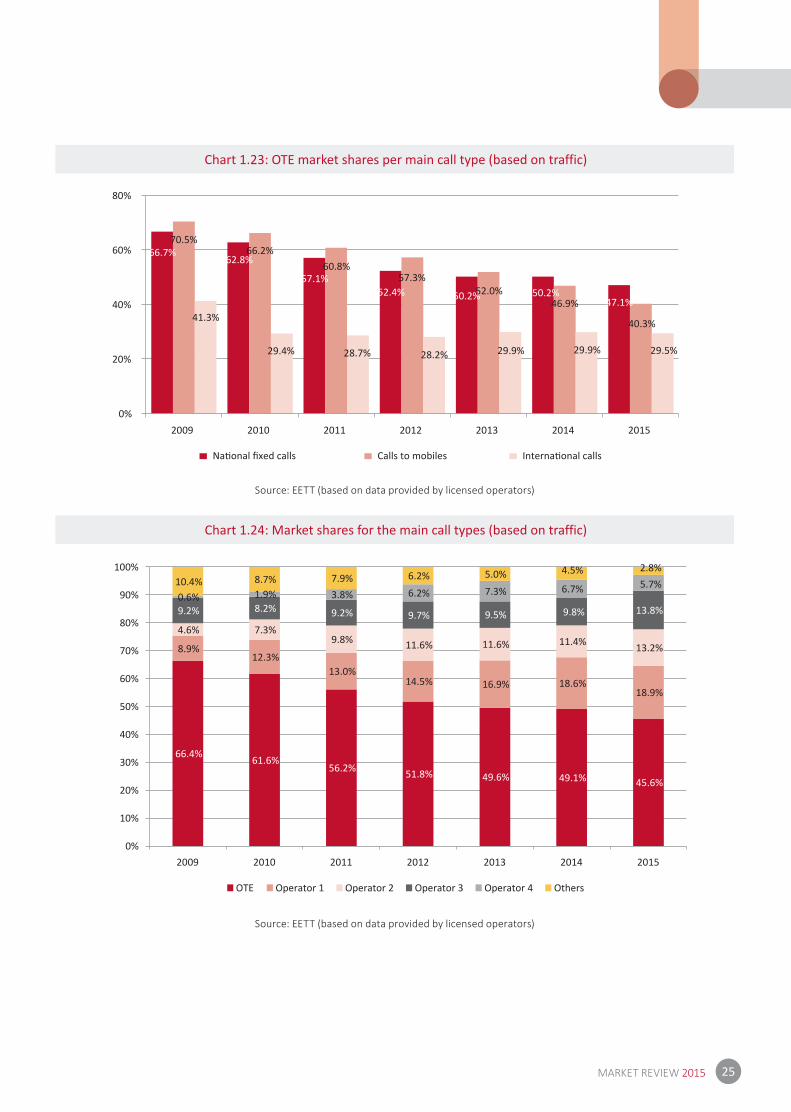
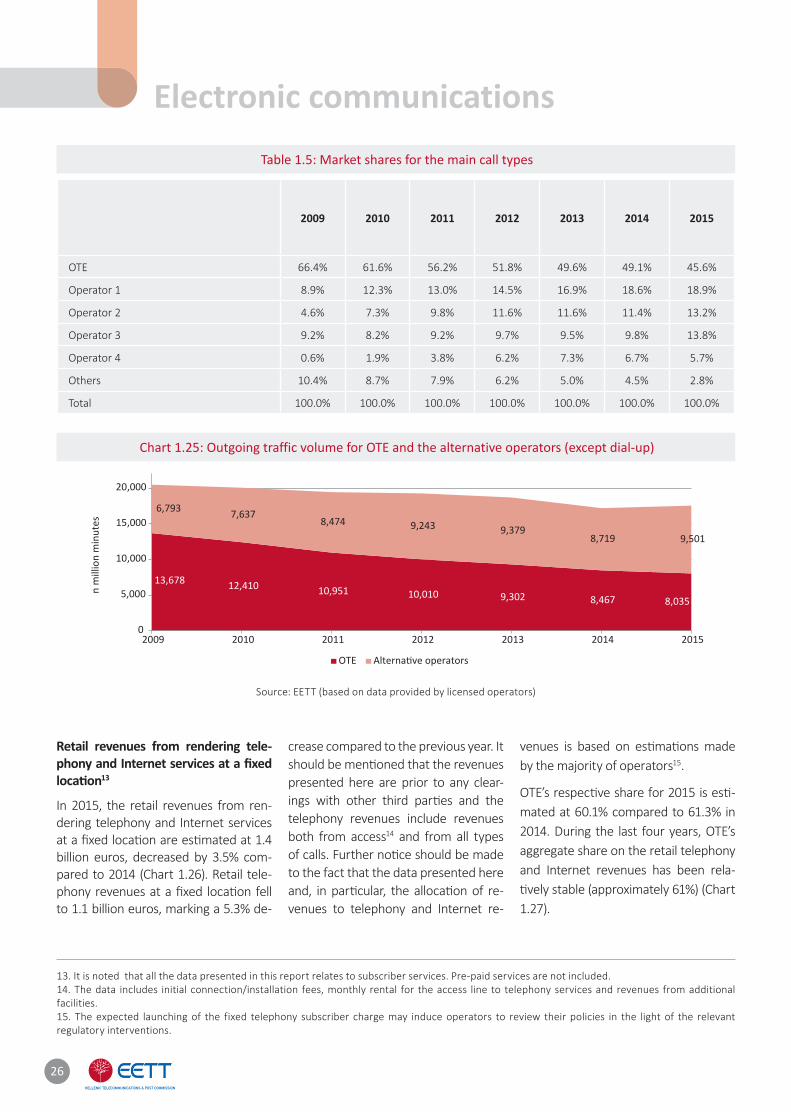
Despite the fact that OTE’s market share in lines is much higher than 50%, its traffi c share is lower and does not exceed 46%, because the alternati ve operators outperformed OTE in increasing mainly fi xed to mobile traffi c (25%) as well as fi xed to fi xed traffi c (Charts 1.22 – 1.23). Based on the progress of the ope-rators’ annual market shares for all main call types over ti me (Chart 1.24), the key feature is the accelarati ng in-crease of the market’s concetrati on (following ON TELECOMS’s closure in 2015), since almost 97% of the mar-ket share in 2015 is held by OTE and four alternati ve operators, namely in alphabeti cal order: CYTA, FORTHNET, HELLAS ON LINE and WIND.
At this point, it is necessary to un-derline the fact that the 2% increase of the fi xed telephony traffi c in 2015 compared to 2014 is att ributed to the
9% increase of the traffi c of all ope-rators except OTE. During the same period, OTE’s traffi c shrinked by 5.1% (Chart 1.25).
12. Please note that all the data presented in this report relate to subscriber services. Card telephony services (pre-paid services) are not included.
Electronic communications

23MARKET REVIEW 2015
Chart 1.19: Progress of the fixed outgoing traffic
Chart 1.20: Fixed outgoing traffic for the main call types
Chart 1.21: Annual change of fixed outgoing traffic volume
Source: EETT (based on data provided by licensed operators)
Source: EETT ((based on data provided by licensed operators)
Source: EETT ((based on data provided by licensed operators)
Main call types All call types, except dial-up All call types
19,9
84
19,6
49
19,0
83
18,9
30
18,3
49
16,8
57
17,2
0520,4
70
20,0
47
19,4
26
19,2
53
18,6
80
17,1
86
17,5
3621,7
37
20,5
52
19,6
20
19,3
39
18,7
35
17,2
15
17,5
55
0
5,000
10,000
15,000
20,000
25,000
2009 2010 2011 2012 2013 2014 2015
17,141 16,697 16,228 16,234 15,78714,298 14,457
2,251 2,059 1,962 1,880 1,837 1,952 2,202
592 893 894 816 726 607 5460
2,000
4,000
6,000
8,000
10,000
12,000
14,000
16,000
18,000
20,000
2009 2010 2011 2012 2013 2014 2015
Calls to mobiles
1.0%
-2.6% -2.8%
0.0%
-2.8%-9.4%
1.1%
-7.7% -8.5%-4.7% -4.1%
-2.3%
6.3%
12.8%
21.5%
50.8%
0.1%
-8.7% -11.0%-16.4%
-10.0%-20%
-10%
0%
10%
20%
30%
40%
50%
60%
2009/2008 2010/2009 2011/2010 2012/2011 2013/2012 2014/2013 2015/2014
Calls to mobiles
in m
illio
n m
inut
esn
mill
ion
min
utes
24
Table 1.4: Volume per call type (in million minutes)
Chart 1.22: OTE’s annual market shares (based on outgoing traffic)
Type of call 2009 2010 2011 2012 2013 2014 2015
Maincall types
National fixed calls 17,141 16,697 16,228 16,234 15,787 14,298 14,457
Calls to mobiles 2,251 2,059 1,962 1,880 1,837 1,952 2,202
International calls 592 893 894 816 726 607 546
Othercall types
Dial-up calls 1,267 505 194 86 55 29 19
Calls to personal numbers (series 70) 0.00 0.05 0.13 0.13 0.14 0.14 not available
Calls to toll free numbers - 800 30 24 23 23 26 31 58
Calls to shared cost services - 801 158 77 52 35 33 31 0
Calls to short code services (3-digit, 4-digit and 5-digit) 288 236 225 220 219 229 238
Calls to value added services 10 61 43 45 53 37 35
Main call types 19.984 19,649 19,083 18,930 18,349 16,857 17,205
All call types (except dial up) 20.470 20,047 19,426 19,253 18,680 17,186 17,536
All call types 21.737 20,552 19,620 19,339 18,735 17,215 17,555
Source: EETT (based on data provided by licensed operators)
Electronic communications
66.4%61.6%
56.2%51.8% 49.6% 49.1% 45.6%
68.7%62.8%
56.8%52.2%
49.9% 49.4% 45.9%
0%
20%
40%
60%
80%
2009 2010 2011 2012 2013 2014 2015
Main call types All call types
25MARKET REVIEW 2015
Chart 1.23: OTE market shares per main call type (based on traffic)
Chart 1.24: Market shares for the main call types (based on traffic)
Source: EETT (based on data provided by licensed operators)
Source: EETT (based on data provided by licensed operators)
Calls to mobiles
66.7%62.8%
57.1%52.4% 50.2% 50.2%
47.1%
70.5%66.2%
60.8%57.3%
52.0%46.9%
40.3%41.3%
29.4% 28.7% 28.2% 29.9% 29.9% 29.5%
0%
20%
40%
60%
80%
2009 2010 2011 2012 2013 2014 2015
66.4% 61.6%56.2% 51.8% 49.6% 49.1% 45.6%
8.9%12.3%
13.0%14.5% 16.9% 18.6%
18.9%
4.6% 7.3%9.8% 11.6% 11.6% 11.4% 13.2%
9.2% 8.2% 9.2% 9.7% 9.5% 9.8% 13.8%0.6% 1.9% 3.8% 6.2% 7.3% 6.7% 5.7%10.4% 8.7% 7.9% 6.2% 5.0% 4.5% 2.8%
0%
10%
20%
30%
40%
50%
60%
70%
80%
90%
100%
2009 2010 2011 2012 2013 2014 2015
Operator 1 Operator 2 Operator 3 Operator 4 Others
26
Table 1.5: Market shares for the main call types
Chart 1.25: Outgoing traffic volume for OTE and the alternative operators (except dial-up)
Source: EETT (based on data provided by licensed operators)
Retail revenues from rendering tele-phony and Internet services at a fi xed locati on13
In 2015, the retail revenues from ren-dering telephony and Internet services at a fi xed locati on are esti mated at 1.4 billion euros, decreased by 3.5% com-pared to 2014 (Chart 1.26). Retail tele-phony revenues at a fi xed locati on fell to 1.1 billion euros, marking a 5.3% de-
crease compared to the previous year. It should be menti oned that the revenues presented here are prior to any clear-ings with other third parti es and the telephony revenues include revenues both from access14 and from all types of calls. Further noti ce should be made to the fact that the data presented here and, in parti cular, the allocati on of re-venues to telephony and Internet re-
venues is based on esti mati ons made by the majority of operators15.
OTE’s respecti ve share for 2015 is esti -mated at 60.1% compared to 61.3% in 2014. During the last four years, OTE’s aggregate share on the retail telephony and Internet revenues has been rela-ti vely stable (approximately 61%) (Chart 1.27).
13. It is noted that all the data presented in this report relates to subscriber services. Pre-paid services are not included. 14. The data includes initial connection/installation fees, monthly rental for the access line to telephony services and revenues from additional facilities. 15. The expected launching of the fixed telephony subscriber charge may induce operators to review their policies in the light of the relevant regulatory interventions.
2009 2010 2011 2012 2013 2014 2015
OTE 66.4% 61.6% 56.2% 51.8% 49.6% 49.1% 45.6%
Operator 1 8.9% 12.3% 13.0% 14.5% 16.9% 18.6% 18.9%
Operator 2 4.6% 7.3% 9.8% 11.6% 11.6% 11.4% 13.2%
Operator 3 9.2% 8.2% 9.2% 9.7% 9.5% 9.8% 13.8%
Operator 4 0.6% 1.9% 3.8% 6.2% 7.3% 6.7% 5.7%
Others 10.4% 8.7% 7.9% 6.2% 5.0% 4.5% 2.8%
Total 100.0% 100.0% 100.0% 100.0% 100.0% 100.0% 100.0%
Electronic communications
13,678 12,410 10,951 10,010 9,302 8,467 8,035
6,793 7,6378,474 9,243 9,379
8,719 9,501
0
5,000
10,000
15,000
20,000
2009 2010 2011 2012 2013 2014 2015
n m
illio
n m
inut
es
27MARKET REVIEW 2015
Chart 1.26: Retail revenues from the provision of telephony and Internet services at a fixed location
Chart 1.27: OTE’s market share (based on retail revenues from telephony and Internet at a fixed location)
Source: EETT (based on data provided by licensed operators)
Source: EETT (based on data provided by licensed operators)
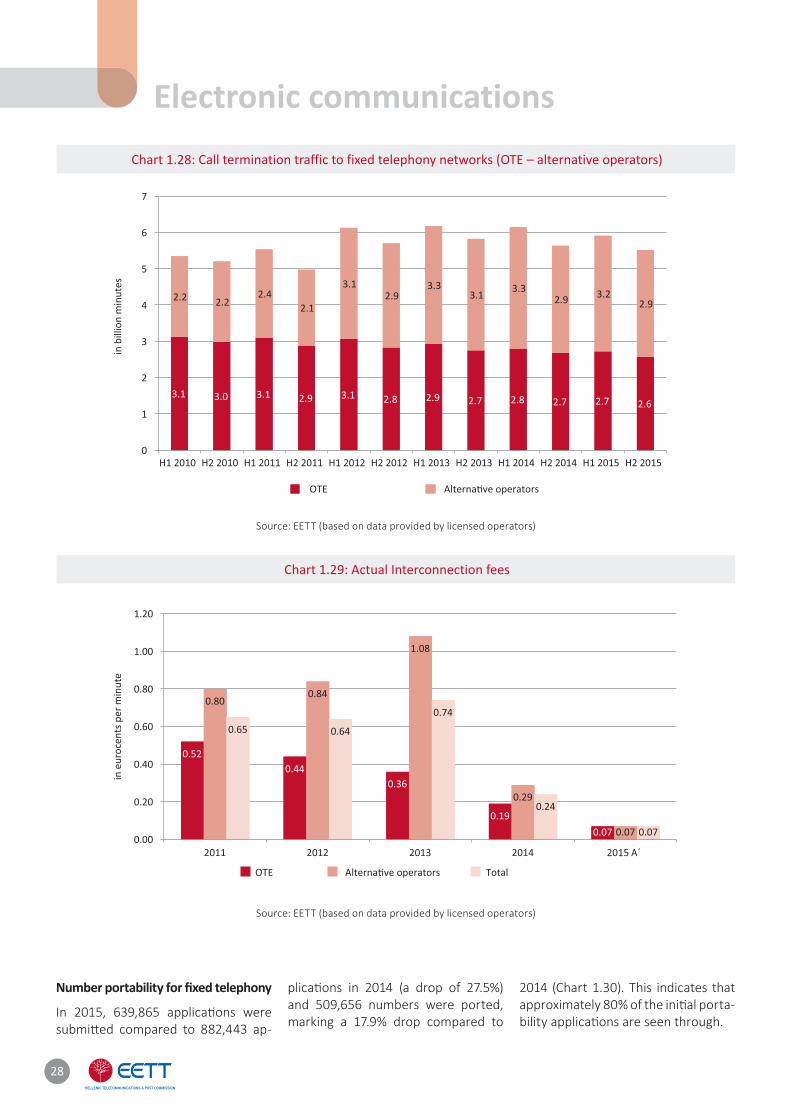
Fixed telephony interconnecti on
In 2015, call terminati on (Chart 1.28) followed up on the downward course of the past years reaching 5.51 billion mi-nutes at the end of the year, decreased by 2% compared to the same period in 2014 (5.63 billion minutes). As of the
second semester of 2012, the termi-nati on traffi c to the alternati ve opera-tors’ fi xed telephony networks exceeds that to OTE’s network. The overall call terminati on traffi c to fi xed telephony networks has been slightly decreased in the past few years. Fully symmetrical terminati on fees for all fi xed telephony
operators will be implemented for the fi rst ti me in 2015 (Chart 1.29).
1,16
5
1,10
3
292
302
2,036 2,0211,916
1,8081,660
1,542 1,456 1,405
0
500
1,000
1,500
2,000
2,500
2008 2009 2010 2011 2012 2013 2014 2015
in m
illio
n eu
ros
Telephony Internet Telephony and Internet (total)
61.3
%
60.1
%
60.0
%
63.3
%
80.2% 78.1%72.5%
66.0%61.4% 61.2% 61.0% 60.8%
0%
10%
20%
30%
40%
50%
60%
70%
80%
90%
2008 2009 2010 2011 2012 2013 2014 2015
Telephony Internet Telephony and Internet (total)
28
Chart 1.28: Call termination traffic to fixed telephony networks (OTE – alternative operators)
Chart 1.29: Actual Interconnection fees
Source: EETT (based on data provided by licensed operators)
Source: EETT (based on data provided by licensed operators)
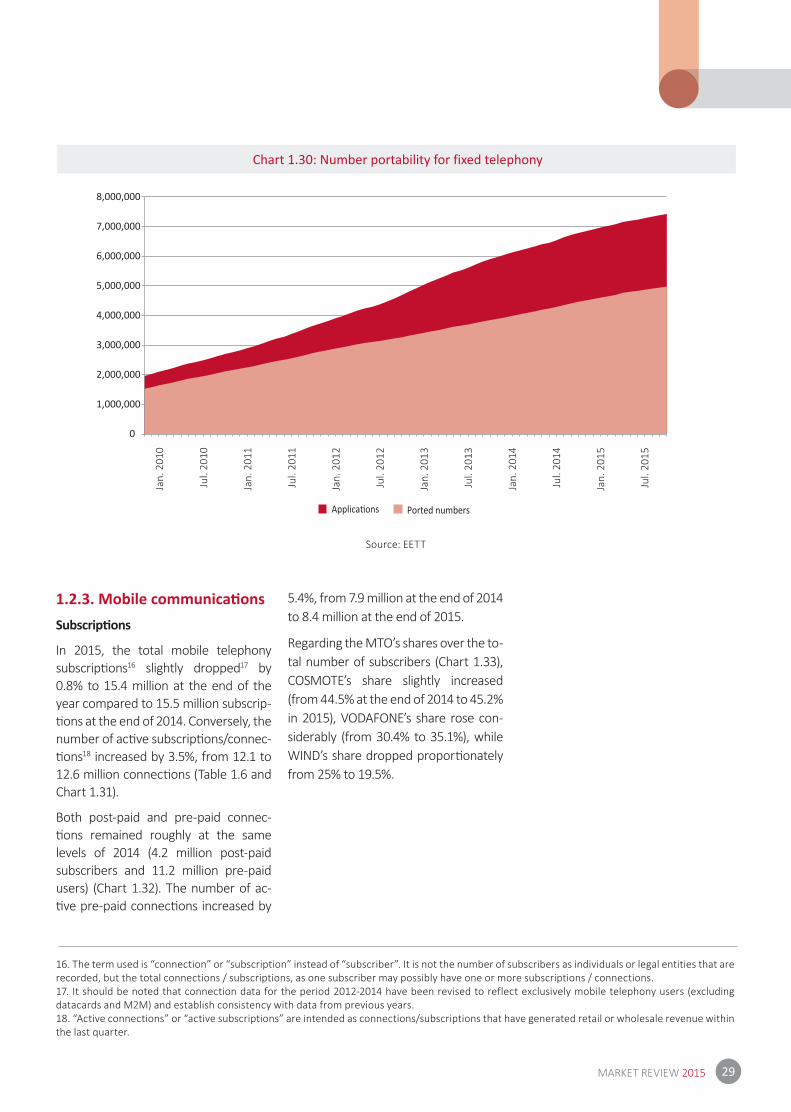
Number portability for fi xed telephony
In 2015, 639,865 applicati ons were submitt ed compared to 882,443 ap-
plicati ons in 2014 (a drop of 27.5%) and 509,656 numbers were ported, marking a 17.9% drop compared to
2014 (Chart 1.30). This indicates that approximately 80% of the initi al porta-bility applicati ons are seen through.
Electronic communications
3.1 3.0 3.1 2.9 3.1 2.8 2.9 2.7 2.8 2.7 2.7 2.6
2.2 2.22.4
2.1
3.12.9
3.33.1 3.3
2.9 3.22.9
0
1
2
3
4
5
6
7
0.520.44
0.36
0.190.07
0.800.84
1.08
0.29
0.07
0.65 0.64
0.74
0.24
0.070.00
0.20
0.40
0.60
0.80
1.00
1.20
2011 2012 2013 2014
in e
uroc
ents
per
min
ute
Total
in b
illio
n m
inut
es
29MARKET REVIEW 2015
Chart 1.30: Number portability for fixed telephony
Source: EETT
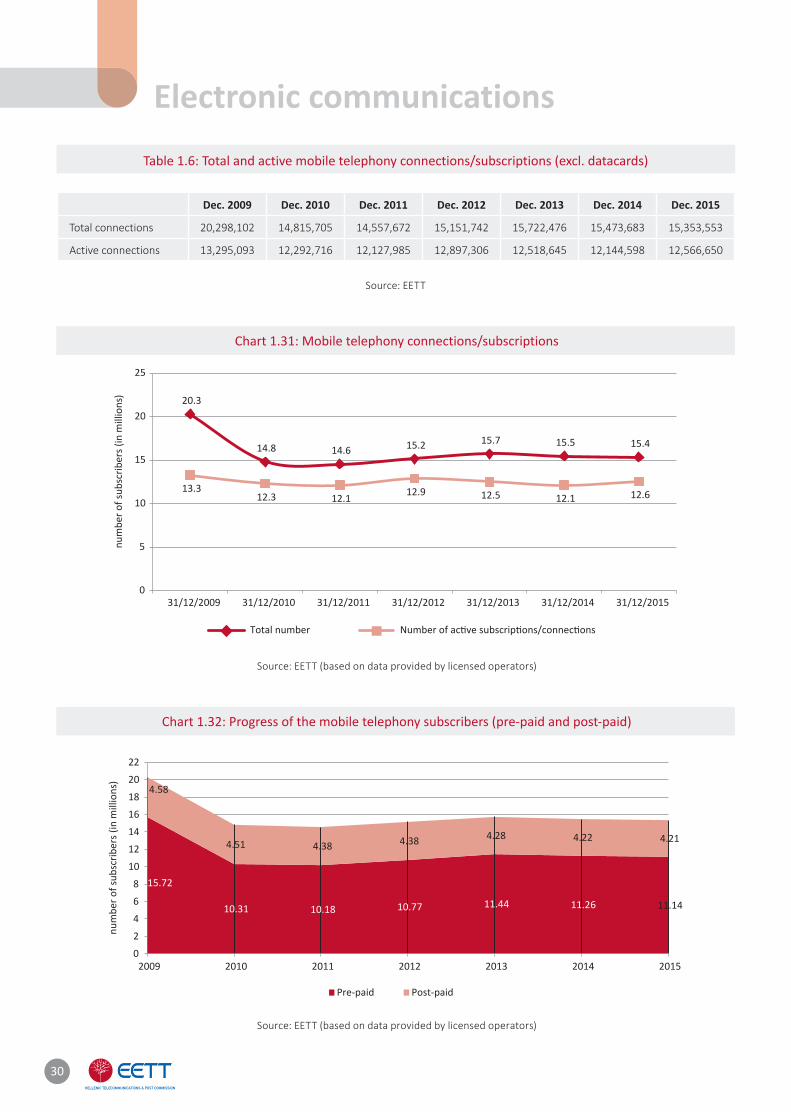
1.2.3. Mobile communicati ons Subscripti ons
In 2015, the total mobile telephony subscripti ons16 slightly dropped17 by 0.8% to 15.4 million at the end of the year compared to 15.5 million subscrip-ti ons at the end of 2014. Conversely, the number of acti ve subscripti ons/connec-ti ons18 increased by 3.5%, from 12.1 to 12.6 million connecti ons (Table 1.6 and Chart 1.31).
Both post-paid and pre-paid connec-ti ons remained roughly at the same levels of 2014 (4.2 million post-paid subscribers and 11.2 million pre-paid users) (Chart 1.32). The number of ac-ti ve pre-paid connecti ons increased by
5.4%, from 7.9 million at the end of 2014 to 8.4 million at the end of 2015.
Regarding the MTO’s shares over the to-tal number of subscribers (Chart 1.33), COSMOTE’s share slightly increased (from 44.5% at the end of 2014 to 45.2% in 2015), VODAFONE’s share rose con-siderably (from 30.4% to 35.1%), while WIND’s share dropped proporti onately from 25% to 19.5%.
16. The term used is “connection” or “subscription” instead of “subscriber”. It is not the number of subscribers as individuals or legal entities that are recorded, but the total connections / subscriptions, as one subscriber may possibly have one or more subscriptions / connections.17. It should be noted that connection data for the period 2012-2014 have been revised to reflect exclusively mobile telephony users (excluding datacards and M2M) and establish consistency with data from previous years.18. “Active connections” or “active subscriptions” are intended as connections/subscriptions that have generated retail or wholesale revenue within the last quarter.
Jan.
201
0
Jul.
2010
Jan.
201
1
Jul.
2011
Jan.
201
2
Jul.
2012
Jan.
201
3
Jul.
2013
Jan.
201
4
Jul.
2014
Jan.
201
5
Jul.
2015
0
1,000,000
2,000,000
3,000,000
4,000,000
5,000,000
6,000,000
7,000,000
8,000,000
Ported numbers
30
Table 1.6: Total and active mobile telephony connections/subscriptions (excl. datacards)
Chart 1.31: Mobile telephony connections/subscriptions
Chart 1.32: Progress of the mobile telephony subscribers (pre-paid and post-paid)
Source: EETT
Source: EETT (based on data provided by licensed operators)
Source: EETT (based on data provided by licensed operators)
Dec. 2009 Dec. 2010 Dec. 2011 Dec. 2012 Dec. 2013 Dec. 2014 Dec. 2015
Total connections 20,298,102 14,815,705 14,557,672 15,151,742 15,722,476 15,473,683 15,353,553
Active connections 13,295,093 12,292,716 12,127,985 12,897,306 12,518,645 12,144,598 12,566,650
Electronic communications
20.3
14.8 14.6 15.2 15.7 15.5 15.4
13.312.3 12.1 12.9 12.5 12.1 12.6
0
5
10
15
20
25
31/12/2009 31/12/2010 31/12/2011 31/12/2012 31/12/2013 31/12/2014 31/12/2015
num
ber o
f sub
scrib
ers (
in m
illio
ns)
Total number
15.72
10.31 10.18 10.77 11.44 11.26 11.14
4.58
4.51 4.38 4.38 4.28 4.22 4.21
0
2
4
6
8
10
12
14
16
18
20
22
2009 2010 2011 2012 2013 2014 2015
num
ber o
f sub
scrib
ers (
in m
illio
ns)
Pre-paid Post-paid
31MARKET REVIEW 2015
Chart 1.33: MTOs’ market shares over the number of mobile telephony connections
Source: EETT (based on data provided by licensed operators)
The use of mobile telecommunica-ti ons networks
The use of mobile telecommunica-ti ons networks remained relati vely stable with regard to voice minutes of nati onal calls but was signifi cantly decreased with regard to internati on-al calls (in voice minutes) and consi-derably increased with regard to data services. The use of SMS dropped slightly, while the use of MMS was marginally increased.
Voice calls
• In 2015, the volume of voice calls amounted to 25.9 billion minutes, decreased by 8.7% compared to 2014 (27 billion minutes) (Chart 1.34).
• The largest volume of voice calls was the on-net mobile traffi c (between subscribers of the same network), which however marked a decrease from 18.3 to 16.7 billion minutes and currently represents 65% of the total voice call volume, compared
to 68% in 2014 (Chart 1.35).
• The off -net mobile voice calls in-creased by 18.6% compared to 2014 (from 5.3 to 6.3 billion min-utes), while mobile calls to fi xed numbers remained stable (2.3 bil-lion minutes).
• Internati onal calls were sharply de-creased by 56%.
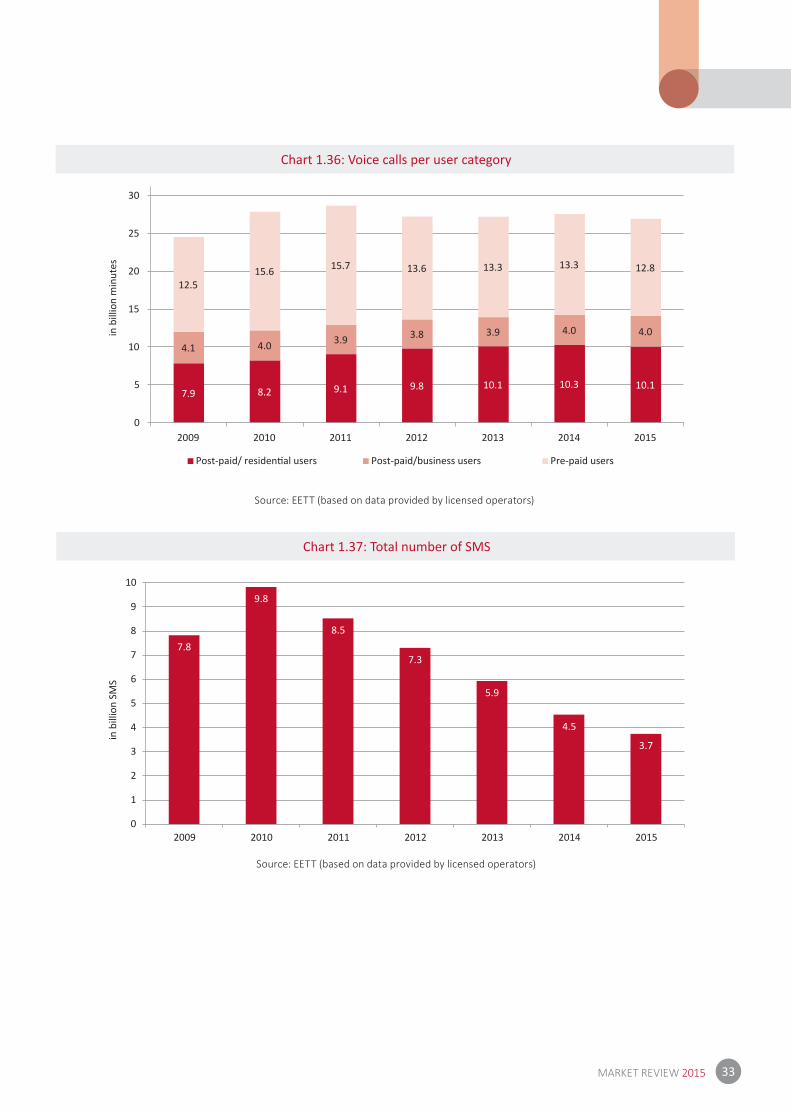
Chart 1.36 demonstrates the volume of voice calls per user category. Pre-paid users are steadily at the top with 47.6% of total calls, followed by post-paid residenti al users with 37.4% and post-paid business users with 15%.
Short Message Services (SMS)
• The total number of SMS registered –yet again– a 17.6% fall (3.7 billion messages compared to 4.5 billion in 2014) (Chart 1.37).
• The vast majority of SMS in 2015 were on-net (71% compared to 75% in 2014), while the percentage of off -net SMS was increased.
• With respect to user category, SMS from pre-paid card users (currently representi ng 53% of all SMS com-pared to 58% in 2014) showed the sharpest decrease by 25%, reaching 2 billion compared to 2.7 billion in 2015 (Chart 1.38).
Multi media Message Services (MMS)
The number of MMS increased mar-ginally (0.4%) reaching 14.9 millions at the end of 2015 but however has greatly decreased by 48.5% compared to 2010 (29 million) (Chart 1.39).
Data Services
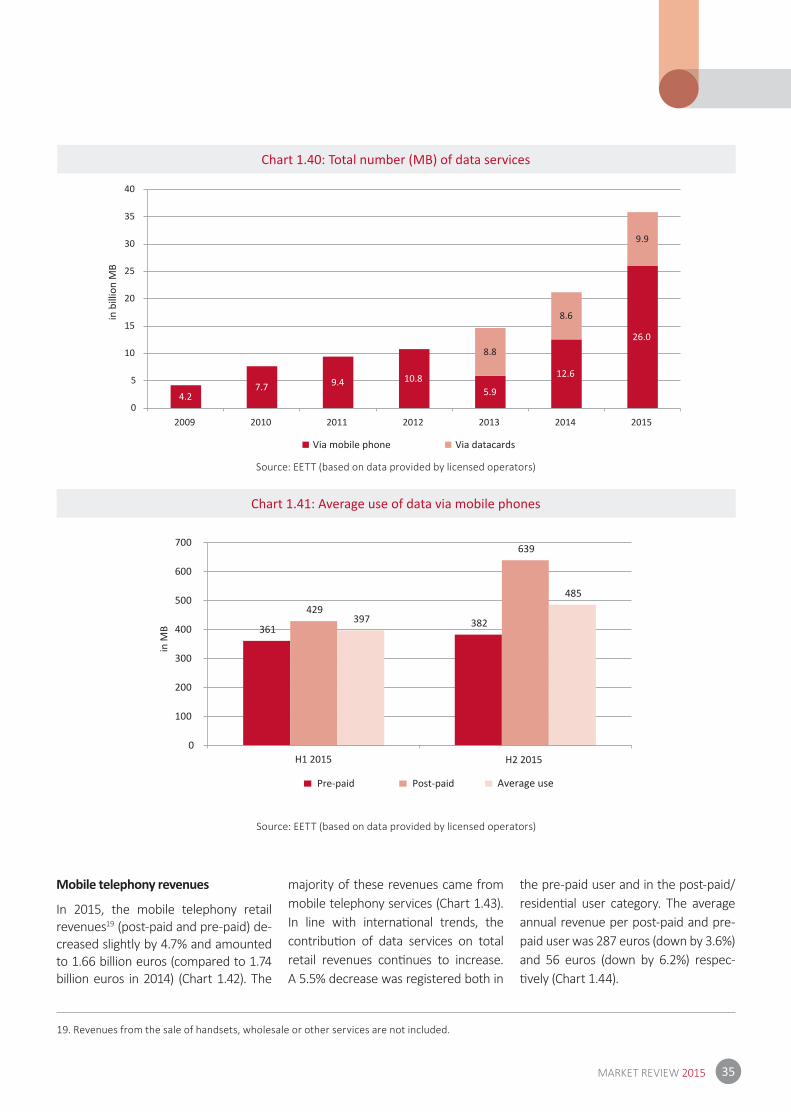
• In 2015, data services via mobile te-lephony networks increased signifi -cantly by 69%, reaching 35.9 billion MB compared to 21.2 billion MB in 2014 (Chart 1.40).
• The majority of data was trans-ferred via mobile phones (73%), while the remaining 27% was trans-ferred via other portable devices using datacards.
44.5%52.4% 52.2% 48.9% 45.7% 44.5% 45.2%
31.2%25.9% 26.3%
27.1% 28.8% 30.4%35.1%
24.3% 21.7% 21.4% 24.0% 25.5% 25.0% 19.5%
0%
10%
20%
30%
40%
50%
60%
70%
80%
90%
100%
2009 2010 2011 2012 2013 2014 2015
COSMOTE VODAFONE WIND

32
Chart 1.41 demonstrates the ave-rage use of data services from mo-bile phones in 2015 which jumped
to 500MB per month during the se-cond semester of the year compared to 400MB per month that was in the
fi rst one.
Chart 1.34: Volume of voice calls originating from mobile phones
Chart 1.35: Voice calls per category (% of the total)
Source: EETT (based on data provided by licensed operators)
Source: EETT (based on data provided by licensed operators)
Electronic communications
24.0
27.2
28.0
26.7 26.727.0
25.9
21
22
23
24
25
26
27
28
29
2009 2010 2011 2012 2013 2014 2015
65%73% 75% 75% 72% 68% 65%
20%15% 13% 13% 15% 20% 25%
11% 9% 8% 8% 8% 8% 9%4% 3% 3% 5% 4% 4% 2%
0%
10%
20%
30%
40%
50%
60%
70%
80%
90%
100%
2009 2010 2011 2012 2013 2014 2015
On-net mobile calls
in b
illio
n m
inut
es
33MARKET REVIEW 2015
Chart 1.36: Voice calls per user category
Chart 1.37: Total number of SMS
Source: EETT (based on data provided by licensed operators)
Source: EETT (based on data provided by licensed operators)
7.9 8.2 9.1 9.8 10.1 10.3 10.1
4.1 4.0 3.9 3.8 3.9 4.0 4.0
12.515.6 15.7 13.6 13.3 13.3 12.8
0
5
10
15
20
25
30
2009 2010 2011 2012 2013 2014 2015
Post-paid/business users Pre-paid users
7.8
9.8
8.5
7.3
5.9
4.5
3.7
0
1
2
3
4
5
6
7
8
9
10
2009 2010 2011 2012 2013 2014 2015
in b
illio
n m
inut
esin
bill
ion
SMS

34
Chart 1.38: SMS per user category
Chart 1.39: Total number of MMS
Source: EETT (based on data provided by licensed operators)
Source: EETT (based on data provided by licensed operators)
Electronic communications
1.0 1.1 1.3 1.6 1.7 1.6 1.40.4 0.3 0.3
0.3 0.3 0.3 0.3
6.4
8.46.9
5.33.9
2.62.0
0
1
2
3
4
5
6
7
8
9
10
2009 2010 2011 2012 2013 2014 2015
Post-paid/business users Pre-paid
29.329.0
24.9
20.316.8 14.9 14.9
0.0
5.0
10.0
15.0
20.0
25.0
30.0
2009 2010 2011 2012 2013 2014 2015
in b
illio
n SM
S
in b
illio
n SM
Sin
mill
ion
MM
S
35MARKET REVIEW 2015
Chart 1.40: Total number (MB) of data services
Chart 1.41: Average use of data via mobile phones
Source: EETT (based on data provided by licensed operators)
Source: EETT (based on data provided by licensed operators)
Mobile telephony revenues
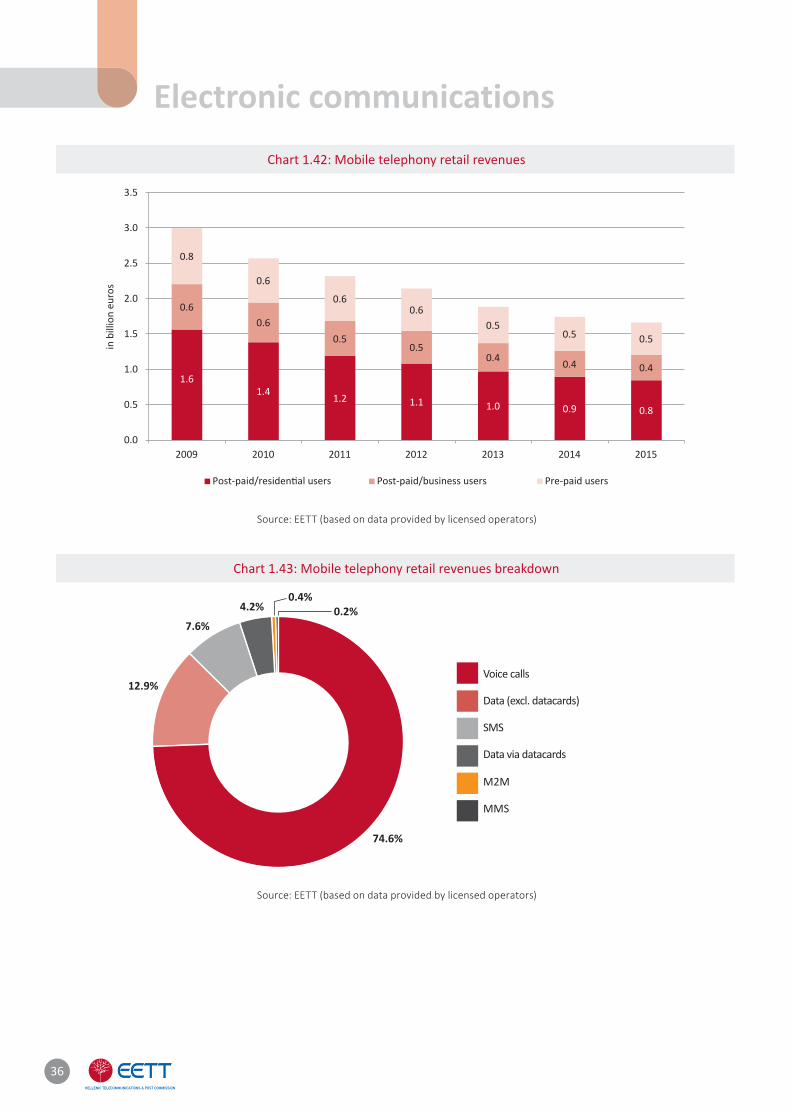
In 2015, the mobile telephony retail revenues19 (post-paid and pre-paid) de-creased slightly by 4.7% and amounted to 1.66 billion euros (compared to 1.74 billion euros in 2014) (Chart 1.42). The
majority of these revenues came from mobile telephony services (Chart 1.43). In line with internati onal trends, the contributi on of data services on total retail revenues conti nues to increase. A 5.5% decrease was registered both in
the pre-paid user and in the post-paid/residenti al user category. The average annual revenue per post-paid and pre-paid user was 287 euros (down by 3.6%) and 56 euros (down by 6.2%) respec-ti vely (Chart 1.44).
19. Revenues from the sale of handsets, wholesale or other services are not included.
4.27.7 9.4 10.8
5.9
12.6
26.08.8
8.6
9.9
0
5
10
15
20
25
30
35
40
2009 2010 2011 2012 2013 2014 2015
in b
illio
n M
B
Via mobile phone Via datacards
361 382 429
639
397
485
0
100
200
300
400
500
600
700
H1 2015 H2 2015
Pre-paid Post-paid Average use
36
Chart 1.42: Mobile telephony retail revenues
Chart 1.43: Mobile telephony retail revenues breakdown
Source: EETT (based on data provided by licensed operators)
Source: EETT (based on data provided by licensed operators)
Voice calls
Data (excl. datacards)
SMS
Data via datacards
Μ2Μ
MMS
74.6%
12.9%
7.6%
4.2%0.4%
0.2%
Electronic communications
1.61.4 1.2 1.1 1.0 0.9 0.8
0.60.6
0.50.5
0.4 0.4 0.4
0.8
0.6
0.60.6
0.50.5 0.5
0.0
0.5
1.0
1.5
2.0
2.5
3.0
3.5
2009 2010 2011 2012 2013 2014 2015
Post-paid/business users Pre-paid users
in b
illio
n eu
ros

37MARKET REVIEW 2015
Chart 1.44: Average revenue per mobile user
Chart 1.45: Mobile telephony operators interconnection traffic
Source: EETT (based on data provided by licensed operators)
Source: EETT (based on data provided by OLOs)
Mobile telephony interconnecti on
The interconnecti on traffi c for MTOs in 2015 increased, as shown in Chart 1.45, which presents the nati onal and internati onal interconnecti on (inco-
ming and outgoing) traffi c for the three MTOs and one Mobile Virtual Net Operator (MVNO). Compared to 2014, the overall rise was 9%, namely a total annual increase of approxi-mately 1.55 billion minutes. Both na-
ti onal outgoing and incoming traffi c were signifi cantly increased by 14%.
Chart 1.46 demonstrates the on-net traffi c for the three MTOs and the one MVNO, which in 2015 was approxi-
in e
uros
82 7461 59 56
379353
316297
287
0
50
100
150
200
250
300
350
400
2011 2012 2013 2014 2015
Pre-paid Post-paid
7.2
6.3
5.7
5.4
6.1
7.7
8.8
7.3
6.6
5.9
5.5
6.2
7.6
8.7
0.5
0.5
0.5
0.4
0.4
0.6
0.7
0.9
0.8
1.0 1.3
1.2
1.1
0.5
0
1
2
3
4
5
6
7
8
9
10
2009 2010 2011 2012 2013 2014 2015
in b
illio
n m
inut
es
38
15.7
19.821.1
19.9 19.318.3
16.7
50%
58%62% 61%
58%
52%47%
0%
10%
20%
30%
40%
50%
60%
70%
0.0
5.0
10.0
15.0
20.0
25.0
2009 2010 2011 2012 2013 2014 2015
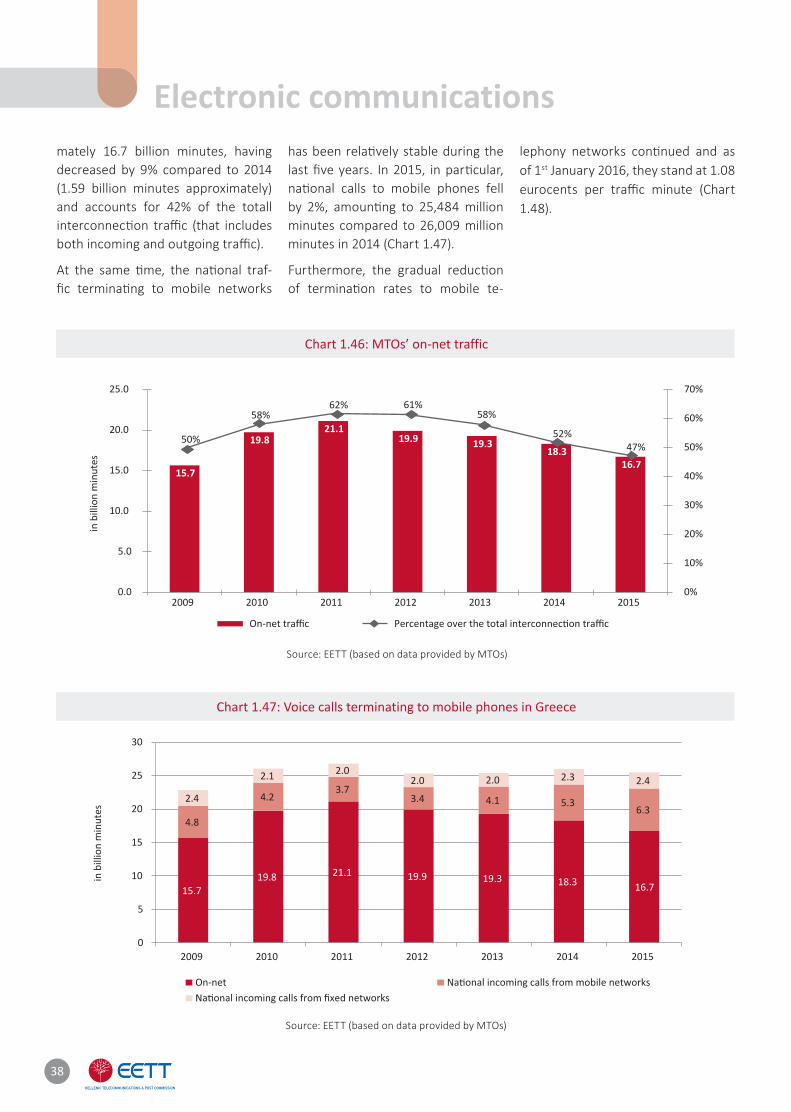
mately 16.7 billion minutes, having decreased by 9% compared to 2014 (1.59 billion minutes approximately) and accounts for 42% of the totall interconnecti on traffi c (that includes both incoming and outgoing traffi c).
At the same ti me, the nati onal traf-fi c terminati ng to mobile networks
has been relati vely stable during the last fi ve years. In 2015, in parti cular, nati onal calls to mobile phones fell by 2%, amounti ng to 25,484 million minutes compared to 26,009 million minutes in 2014 (Chart 1.47).
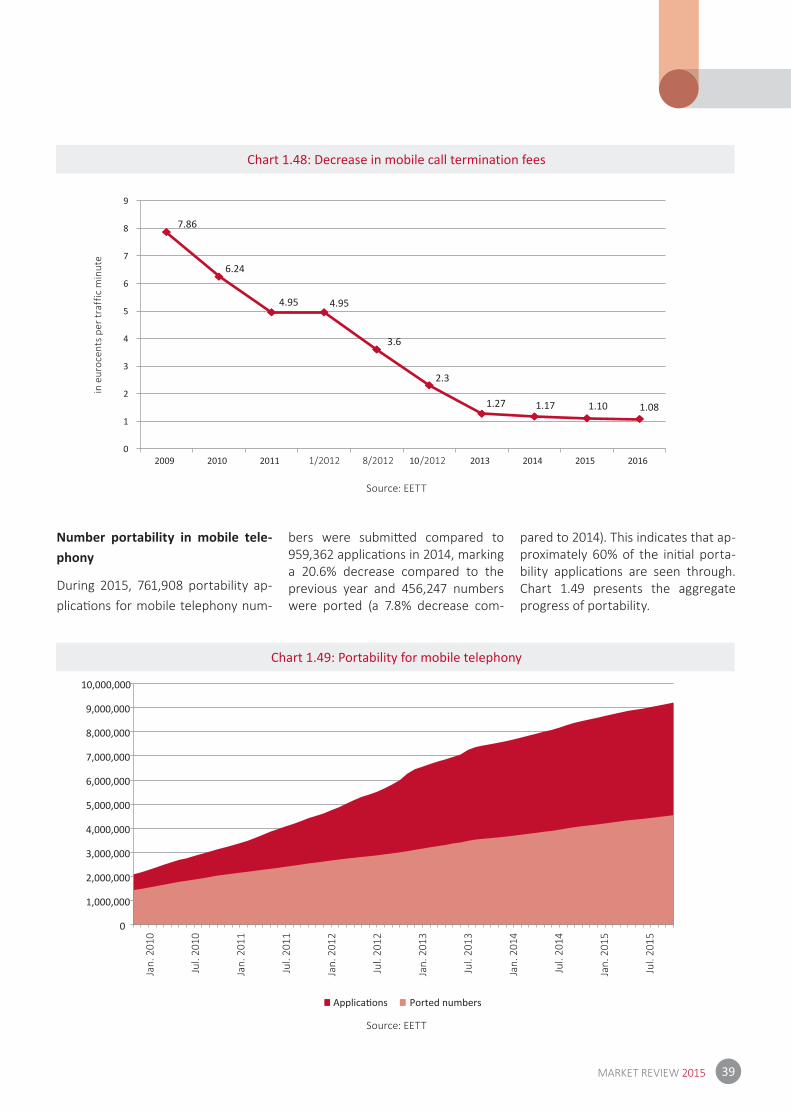
Furthermore, the gradual redu cti on of terminati on rates to mobile te-
lephony networks conti nued and as of 1st January 2016, they stand at 1.08 eurocents per traffi c minute (Chart 1.48).
Chart 1.47: Voice calls terminating to mobile phones in Greece
Source: EETT (based on data provided by MTOs)
Chart 1.46: MTOs’ on-net traffic
Source: EETT (based on data provided by MTOs)
Electronic communications
15.719.8 21.1 19.9 19.3 18.3 16.7
4.8
4.23.7
3.4 4.1 5.36.3
2.4
2.1 2.02.0 2.0 2.3 2.4
0
5
10
15
20
25
30
2009 2010 2011 2012 2013 2014 2015
in b
illio
n m
inut
esin
bill
ion
min
utes
On-net
39MARKET REVIEW 2015
Chart 1.48: Decrease in mobile call termination fees
Chart 1.49: Portability for mobile telephony
Source: EETT
Source: EETT
Number portability in mobile tele-phony
During 2015, 761,908 portability ap-plicati ons for mobile telephony num-
bers were submitt ed compared to 959,362 applicati ons in 2014, marking a 20.6% decrease compared to the previous year and 456,247 numbers were ported (a 7.8% decrease com-
pared to 2014). This indicates that ap-proximately 60% of the initi al porta-bility applicati ons are seen through. Chart 1.49 presents the aggregate progress of portability.
in e
uroc
ents
per
traf
fic m
inut
e
Jan.
201
0
Jul.
2010
Jan.
201
1
Jul.
2011
Jan.
201
2
Jul.
2012
Jan.
201
3
Jul.
2013
Jan.
201
4
Jul.
2014
Jan.
201
5
Jul.
2015
7.86
6.24
4.95 4.95
3.6
2.3
1.27 1.17 1.10 1.08
0
1
2
3
4
5
6
7
8
9
0
1,000,000
2,000,000
3,000,000
4,000,000
5,000,000
6,000,000
7,000,000
8,000,000
9,000,000
10,000,000
Ported numbers
40
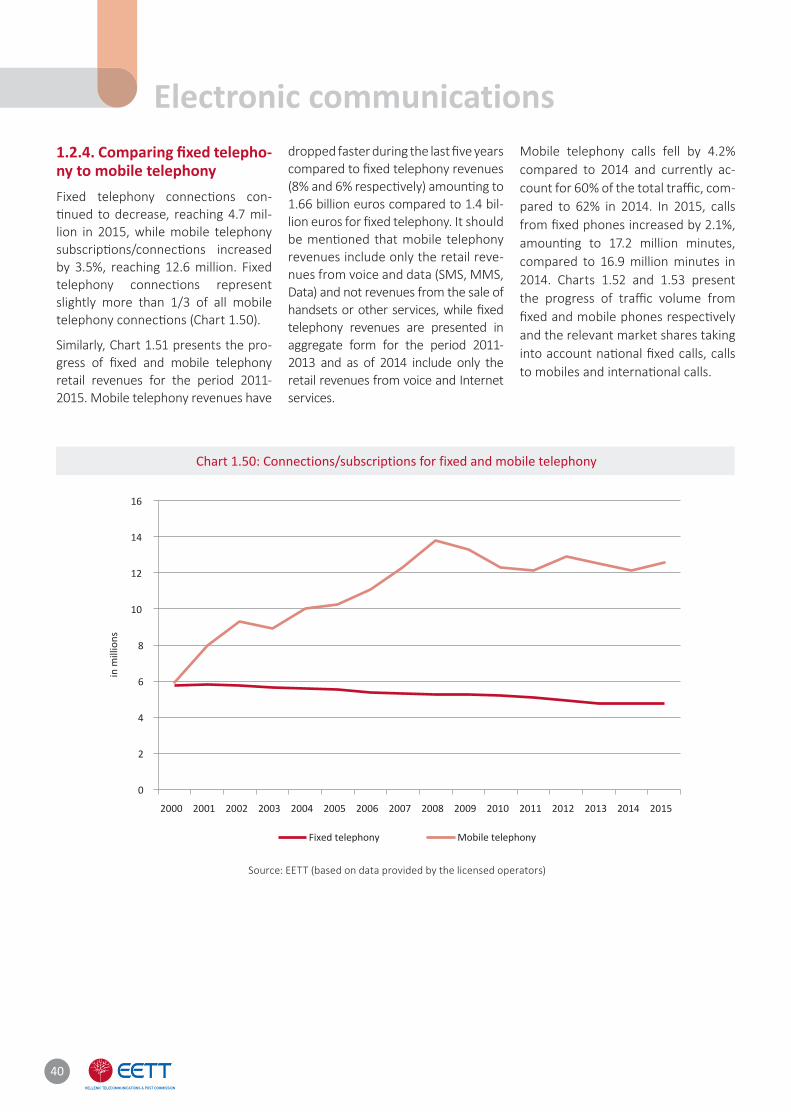
1.2.4. Comparing fi xed telepho-ny to mobile telephonyFixed telephony connecti ons con-ti nued to decrease, reaching 4.7 mil-lion in 2015, while mobile telephony subscripti ons/connecti ons increased by 3.5%, reaching 12.6 million. Fixed telephony connecti ons represent slightly more than 1/3 of all mobile telephony connecti ons (Chart 1.50).
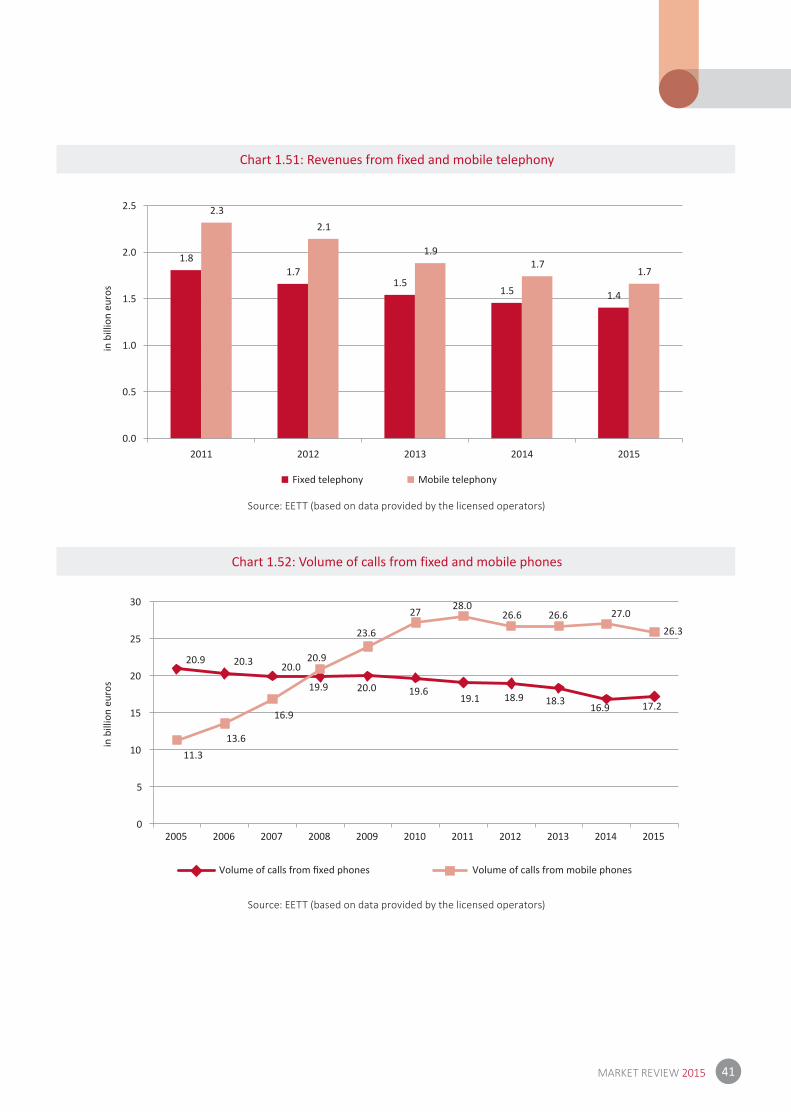
Similarly, Chart 1.51 presents the pro-gress of fi xed and mobile telephony retail revenues for the period 2011-2015. Mobile telephony revenues have
dropped faster during the last fi ve years compared to fi xed telephony revenues (8% and 6% respecti vely) amounti ng to 1.66 billion euros compared to 1.4 bil-lion euros for fi xed telephony. It should be menti oned that mobile telephony revenues include only the retail reve-nues from voice and data (SMS, MMS, Data) and not revenues from the sale of handsets or other services, while fi xed telephony revenues are presented in aggregate form for the period 2011-2013 and as of 2014 include only the retail revenues from voice and Internet services.
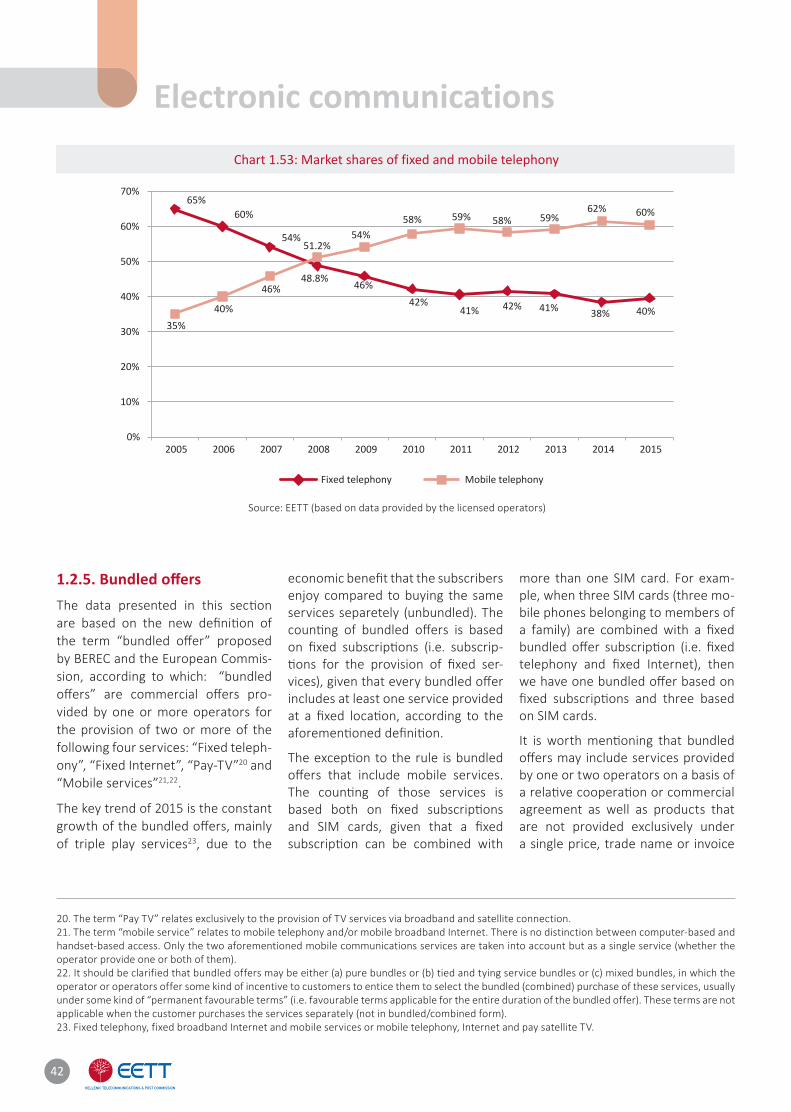
Mobile telephony calls fell by 4.2% compared to 2014 and currently ac-count for 60% of the total traffi c, com-pared to 62% in 2014. In 2015, calls from fi xed phones increased by 2.1%, amounti ng to 17.2 million minutes, compared to 16.9 million minutes in 2014. Charts 1.52 and 1.53 present the progress of traffi c volume from fi xed and mobile phones respecti vely and the relevant market shares taking into account nati onal fi xed calls, calls to mobiles and internati onal calls.
Chart 1.50: Connections/subscriptions for fixed and mobile telephony
Source: EETT (based on data provided by the licensed operators)
Electronic communications
0
2
4
6
8
10
12
14
16
2000 2001 2002 2003 2004 2005 2006 2007 2008 2009 2010 2011 2012 2013 2014 2015
in m
illio
ns
Fixed telephony Mobile telephony
41MARKET REVIEW 2015
Chart 1.51: Revenues from fixed and mobile telephony
Chart 1.52: Volume of calls from fixed and mobile phones
Source: EETT (based on data provided by the licensed operators)
Source: EETT (based on data provided by the licensed operators)
1.81.7
1.51.5 1.4
2.32.1
1.91.7
1.7
0.0
0.5
1.0
1.5
2.0
2.5
2011 2012 2013 2014 2015
Fixed telephony Mobile telephony
20.9 20.3 20.0
19.9 20.0 19.619.1 18.9 18.3 16.9 17.2
11.313.6
16.9
20.9
28.027.0
0
5
10
15
20
25
30
2005 2006 2007 2008 2009 2010 2011 2012 2013 2014 2015
23.6
26.6 26.626.3
27
Volume of calls from mobile phones
42
Chart 1.53: Market shares of fixed and mobile telephony
Source: EETT (based on data provided by the licensed operators)
1.2.5. Bundled off ers The data presented in this secti on are based on the new defi niti on of the term “bundled off er” proposed by BEREC and the European Commis-sion, according to which: “bundled off ers” are commercial off ers pro-vided by one or more operators for the provision of two or more of the following four services: “Fixed teleph-ony”, “Fixed Internet”, “Pay-TV”20 and “Mobile services”21,22.
The key trend of 2015 is the constant growth of the bundled off ers, mainly of triple play services23, due to the
economic benefi t that the subscribers enjoy compared to buying the same services separetely (unbundled). The counti ng of bundled off ers is based on fi xed subscripti ons (i.e. subscrip-ti ons for the provision of fi xed ser-vices), given that every bundled off er includes at least one service provided at a fi xed locati on, according to the aforementi oned defi niti on.
The excepti on to the rule is bundled off ers that include mobile services. The counti ng of those services is based both on fi xed subscripti ons and SIM cards, given that a fi xed subscripti on can be combined with
more than one SIM card. For exam-ple, when three SIM cards (three mo-bile phones belonging to members of a family) are combined with a fi xed bundled off er subscripti on (i.e. fi xed telephony and fi xed Internet), then we have one bundled off er based on fi xed subscripti ons and three based on SIM cards.
It is worth menti oning that bundled off ers may include services provided by one or two operators on a basis of a relati ve cooperati on or commercial agreement as well as products that are not provided exclusively under a single price, trade name or invoice
20. The term “Pay TV” relates exclusively to the provision of TV services via broadband and satellite connection.21. The term “mobile service” relates to mobile telephony and/or mobile broadband Internet. There is no distinction between computer-based and handset-based access. Only the two aforementioned mobile communications services are taken into account but as a single service (whether the operator provide one or both of them).22. It should be clarified that bundled offers may be either (a) pure bundles or (b) tied and tying service bundles or (c) mixed bundles, in which the operator or operators offer some kind of incentive to customers to entice them to select the bundled (combined) purchase of these services, usually under some kind of “permanent favourable terms” (i.e. favourable terms applicable for the entire duration of the bundled offer). These terms are not applicable when the customer purchases the services separately (not in bundled/combined form).23. Fixed telephony, fixed broadband Internet and mobile services or mobile telephony, Internet and pay satellite TV.
Electronic communications
65%60%
54%
48.8% 46%42%
41% 42% 41% 38% 40%35%
40%
46%
51.2%54%
58% 59% 58% 59%62% 60%
0%
10%
20%
30%
40%
50%
60%
70%
2005 2006 2007 2008 2009 2010 2011 2012 2013 2014 2015
Fixed telephony Mobile telephony
43MARKET REVIEW 2015
form. Furthermore, a subscriber may enjoy services that fall within one or/and more bundled catego-ries, for example a bundled off er for fi xed telephony and Internet services provi ded by an operator plus an un-bundled TV service by another opera-tor (in which case, the fi rst one falls within the double play category (fi xed telephony and Internet), while the second one within the unbundled pay TV category).
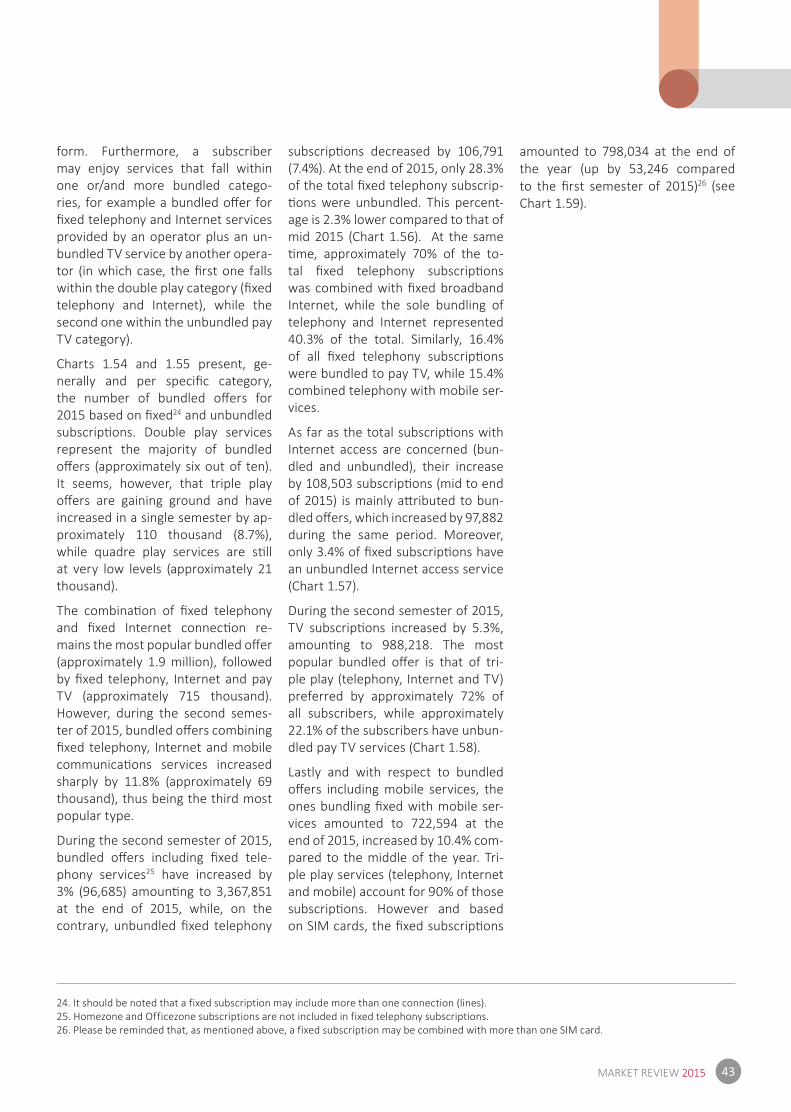
Charts 1.54 and 1.55 present, ge-nerally and per specifi c category, the number of bundled off ers for 2015 based on fi xed24 and unbundled subscripti ons. Double play services represent the majority of bundled off ers (approximately six out of ten). It seems, however, that triple play off ers are gaining ground and have increased in a single semester by ap-proximately 110 thousand (8.7%), while quadre play services are sti ll at very low levels (approximately 21 thousand).
The combinati on of fi xed telephony and fi xed Internet connecti on re-mains the most popular bundled off er (approximately 1.9 million), followed by fi xed telephony, Internet and pay TV (approximately 715 thousand). However, during the second semes-ter of 2015, bundled off ers combining fi xed telephony, Internet and mobile communicati ons services increased sharply by 11.8% (approximately 69 thousand), thus being the third most popular type.
During the second semester of 2015, bundled off ers including fi xed tele-phony services25 have increased by 3% (96,685) amounti ng to 3,367,851 at the end of 2015, while, on the contrary, unbundled fi xed telephony
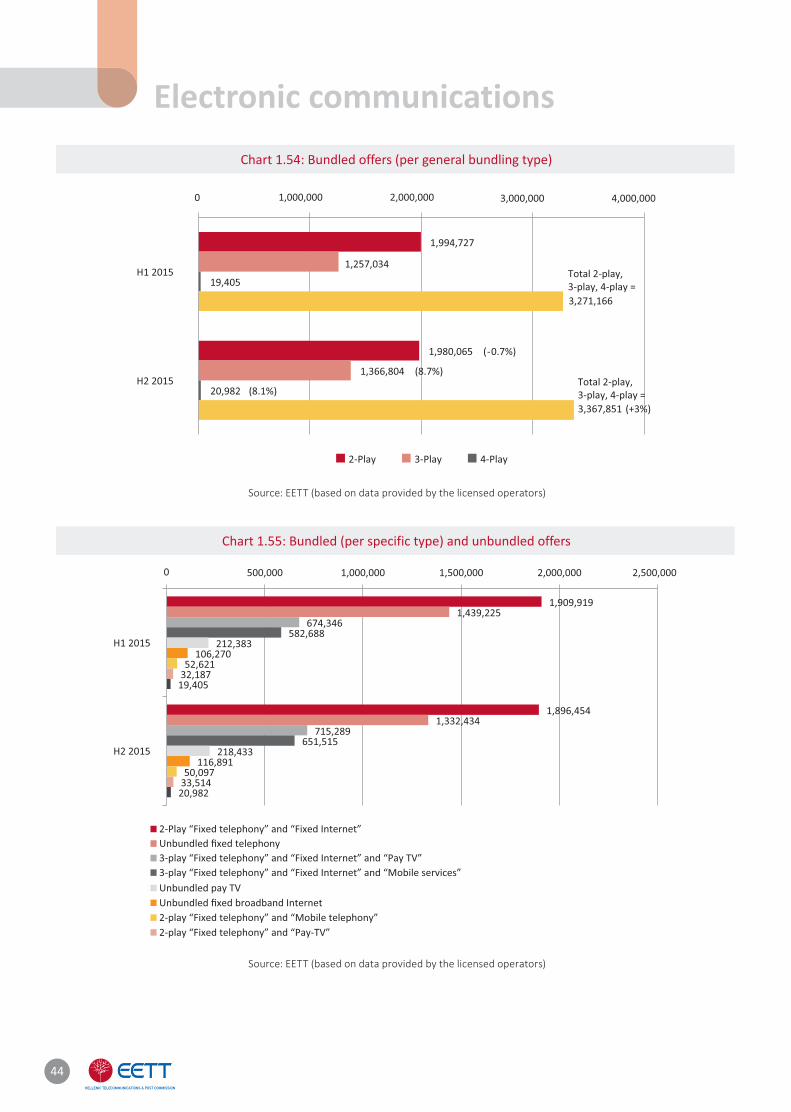
subscripti ons decreased by 106,791 (7.4%). At the end of 2015, only 28.3% of the total fi xed telephony subscrip-ti ons were unbundled. This percent-age is 2.3% lower compared to that of mid 2015 (Chart 1.56). At the same ti me, approximately 70% of the to-tal fi xed telephony subscripti ons was combined with fi xed broadband Internet, while the sole bundling of telephony and Internet represented 40.3% of the total. Similarly, 16.4% of all fi xed telephony subscripti ons were bundled to pay TV, while 15.4% combined telephony with mobile ser-vices.
As far as the total subscripti ons with Internet access are concerned (bun-dled and unbundled), their increase by 108,503 subscripti ons (mid to end of 2015) is mainly att ributed to bun-dled off ers, which increased by 97,882 during the same period. Moreover, only 3.4% of fi xed subscripti ons have an unbundled Internet access service (Chart 1.57).
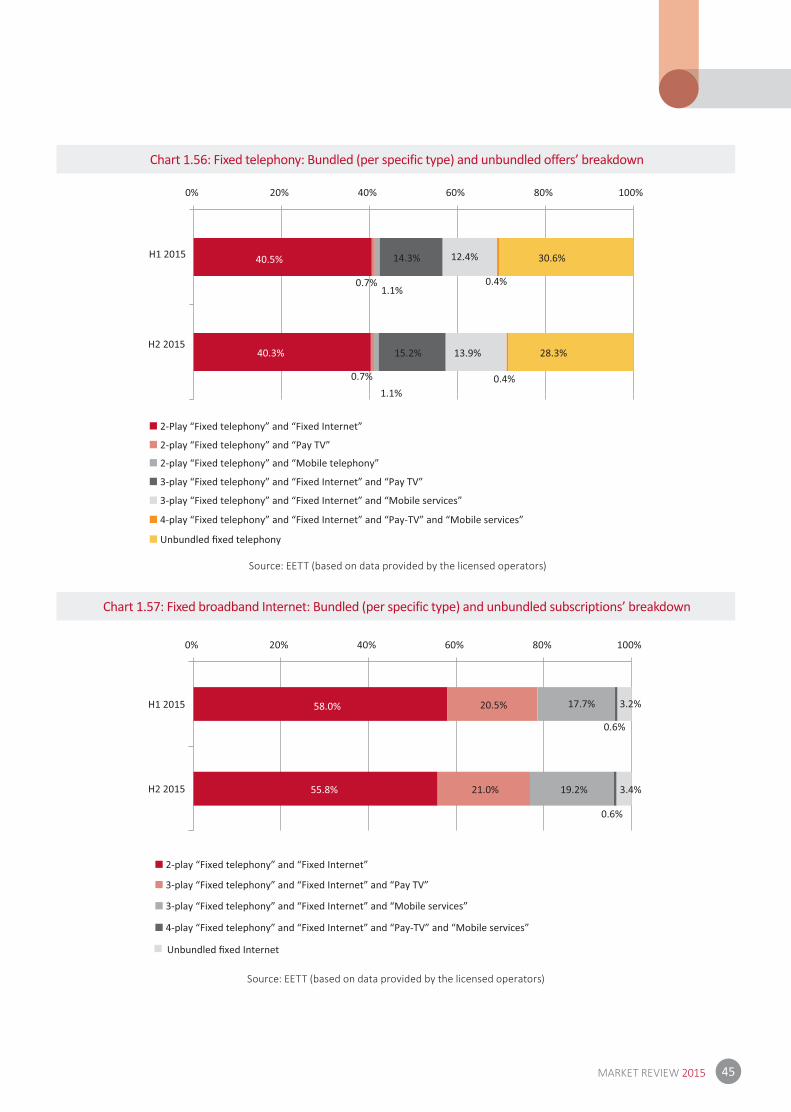
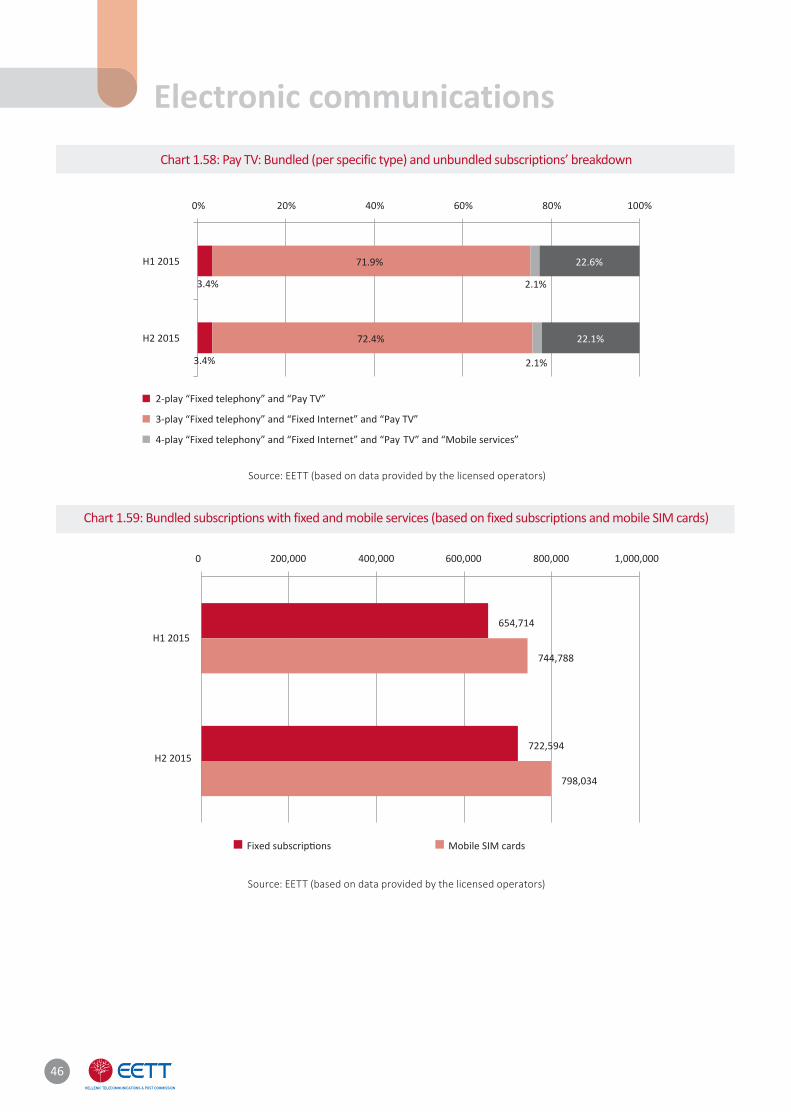
During the second semester of 2015, TV subscripti ons increased by 5.3%, amounti ng to 988,218. The most popular bundled off er is that of tri-ple play (telephony, Internet and TV) preferred by approximately 72% of all subscribers, while approximately 22.1% of the subscribers have unbun-dled pay TV services (Chart 1.58).
Lastly and with respect to bundled off ers including mobile services, the ones bundling fi xed with mobile ser-vices amounted to 722,594 at the end of 2015, increased by 10.4% com-pared to the middle of the year. Tri-ple play services (telephony, Internet and mobile) account for 90% of those subscripti ons. However and based on SIM cards, the fi xed subscripti ons
amounted to 798,034 at the end of the year (up by 53,246 compared to the fi rst semester of 2015)26 (see Chart 1.59).
24. It should be noted that a fixed subscription may include more than one connection (lines).25. Homezone and Officezone subscriptions are not included in fixed telephony subscriptions.26. Please be reminded that, as mentioned above, a fixed subscription may be combined with more than one SIM card.
44
Chart 1.54: Bundled offers (per general bundling type)
Chart 1.55: Bundled (per specific type) and unbundled offers
Source: EETT (based on data provided by the licensed operators)
Source: EETT (based on data provided by the licensed operators)
Electronic communications
45MARKET REVIEW 2015
Chart 1.56: Fixed telephony: Bundled (per specific type) and unbundled offers’ breakdown
Chart 1.57: Fixed broadband Internet: Bundled (per specific type) and unbundled subscriptions’ breakdown
Source: EETT (based on data provided by the licensed operators)
Source: EETT (based on data provided by the licensed operators)
46
Chart 1.58: Pay TV: Bundled (per specific type) and unbundled subscriptions’ breakdown
Chart 1.59: Bundled subscriptions with fixed and mobile services (based on fixed subscriptions and mobile SIM cards)
Source: EETT (based on data provided by the licensed operators)
Source: EETT (based on data provided by the licensed operators)
Electronic communications
3.4%
3.4%
71.9%
72.4%
2.1%
2.1%
22.6%
22.1%
H1 2015
H2 2015
2-play “Fixed telephony” and “Pay TV”
3-play “Fixed telephony” and “Fixed Internet” and “Pay TV”
4-play “Fixed telephony” and “Fixed Internet” and “Pay-TV” and “Mobile services”
654,714
200,000 400,000 600,000 800,000 1,000,000
722,594
744,788
798,034
H1 2015
H2 2015
Mobile SIM cards

47MARKET REVIEW 2015
Table 1.7: Number of bundled offers and unbundled subscriptions
A, Fixed services provider’s perspective (based on fixed subscriptions) H1 2015 H2 2015
Bundled offers
Double play “Fixed telephony” and “Fixed Internet” 1,909,919 1,896,454
“Fixed telephony” and “Pay TV” 32,187 33,514
«Fixed telephony» and «Mobile services» 52,621 50,097
Total double play 1,994,727 1,980,065
Triple play “Fixed telephony” and “Fixed Internet” and “Pay TV” 674,346 715,289
“Fixed telephony” and “Fixed Internet” and “Mobile services” 582,688 651,515
Total triple play 1,257,034 1,366,804
Quadre play “Fixed telephony” and “Fixed Internet” and“Pay TV” and “Mobile services” 19,405 20,982
Total quadre play 19,405 20,982
Total double play, triple play, quadre play 3,271,166 3,367,851
Bundled offerswith one of these services (a)
“Fixed telephony” 3,271,166 3,367,851
“Fixed Internet” 3,186,358 3,284,240
“Pay TV” 725,938 769,785
“Mobile services” 654,714 722,594
Unbundledsubscriptionsper service (b)
“Fixed telephony” 1,439,225 1,332,434
“Fixed Internet” 106,270 116,891
“Pay TV” 212,383 218,433
Subscriptions with each of these services (aggregate, i,e, (a)+(b))
“Fixed telephony” 4,710,391 4,700,285
“Fixed Internet” 3,292,628 3,401,131
“Pay TV” 938,321 988,218
B, Mobile services provider’s perspective (i,e, based on mobile SIM cards) H1 2015 H2 2015
Number of SIM cards combined with mobile telephony and/or mobile Internet services rendered as a bundledoffer with at least one fixed service,
744,788 798,034
1.2.6. BroadbandProgress of broadband lines
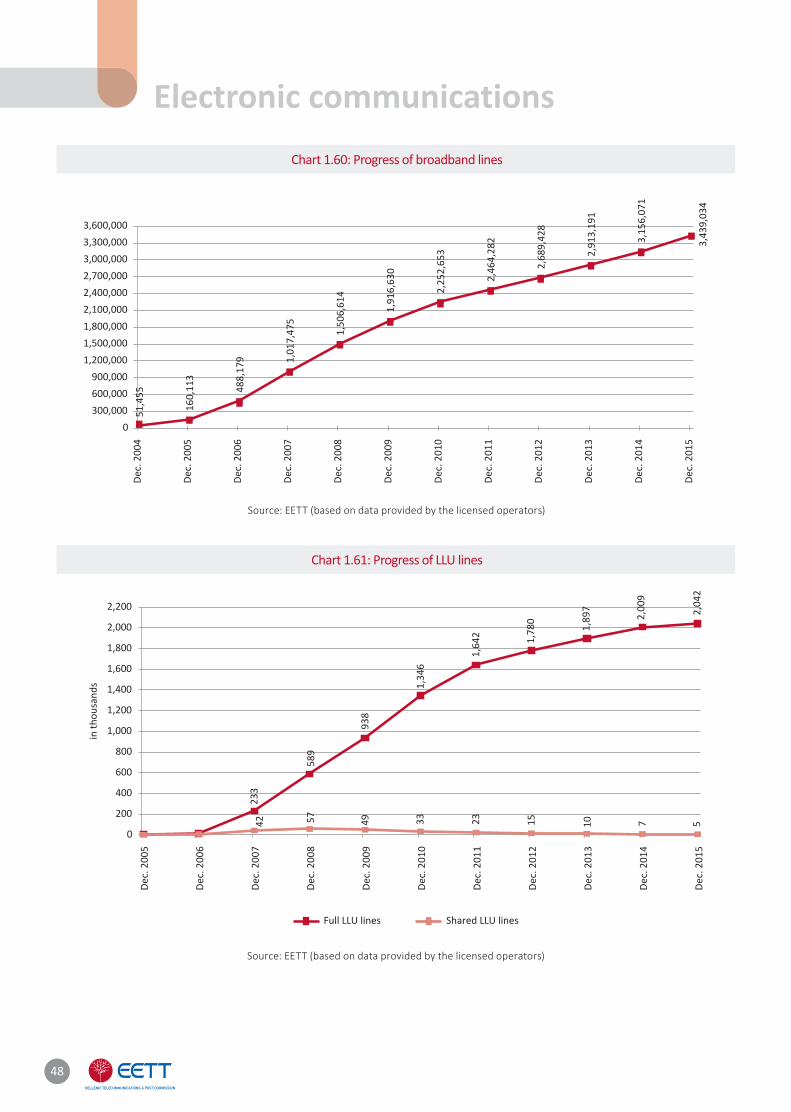
At the end of 2015, broadband con-necti ons amounted to 3,439,034 com-pared to 3,156,071 at the end of 2014, registering an annual increase of 8.9% (Chart 1.60) comparable to that of last year (8.3%). Broadband penetrati on in
Greece reached 31.67% in the popula-ti on compared to 28.7% in 2014.
Local Loop Unbundling (LLU)
LLU conti nued to increase in 2015 (Chart 1.61) reaching 2.047.268 at the end of the year, compared to 2.015.940 at the end of 2014 (1.5% compared to 5.7% in 2014)27. This increase is enti rely att ribu-
ted to the full LLU lines that amounted to 2,041,824 at the end of the year, com-pared to 2,008,602 at the end of 2014 (1.65% increase) as opposed to shared LLU lines, whose number conti nued to drop (5,444 lines at the end of the year compared to 7,338 at the end of 2014).
27. The access lines via LLU are a superset of broadband lines via LLU, since they also include telephony only lines.
48
Chart 1.60: Progress of broadband lines
Chart 1.61: Progress of LLU lines
Source: EETT (based on data provided by the licensed operators)
Source: EETT (based on data provided by the licensed operators)
Electronic communications51
,455
160,
113
488,
179 1,
017,
475
1,50
6,61
4
1,91
6,63
0
2,25
2,65
3
2,46
4,28
2
2,68
9,42
8
2,91
3,19
1
3,15
6,07
1
3,43
9,03
4
0300,000600,000900,000
1,200,0001,500,0001,800,0002,100,0002,400,0002,700,0003,000,0003,300,0003,600,000
Dec.
200
4
Dec.
200
5
Dec.
200
6
Dec.
200
7
Dec.
200
8
Dec.
200
9
Dec.
201
0
Dec.
201
1
Dec.
201
2
Dec.
201
3
Dec.
201
4
Dec.
201
5
233
589
938
1,34
6
1,64
2 1,78
0
1,89
7
2,00
9
2,04
2
42 57 49 33 23 15 10 7 5
0
200
400
600
800
1,000
1,200
1,400
1,600
1,800
2,000
2,200
in th
ousa
nds
Full LLU lines Shared LLU lines
Dec.
200
5
Dec.
200
6
Dec.
200
7
Dec.
200
8
Dec.
200
9
Dec.
201
0
Dec.
201
1
Dec.
201
2
Dec.
201
3
Dec.
201
4
Dec.
201
5
49MARKET REVIEW 2015
Source: EETT (based on data provided by the licensed operators)
ADSL / VDSL lines
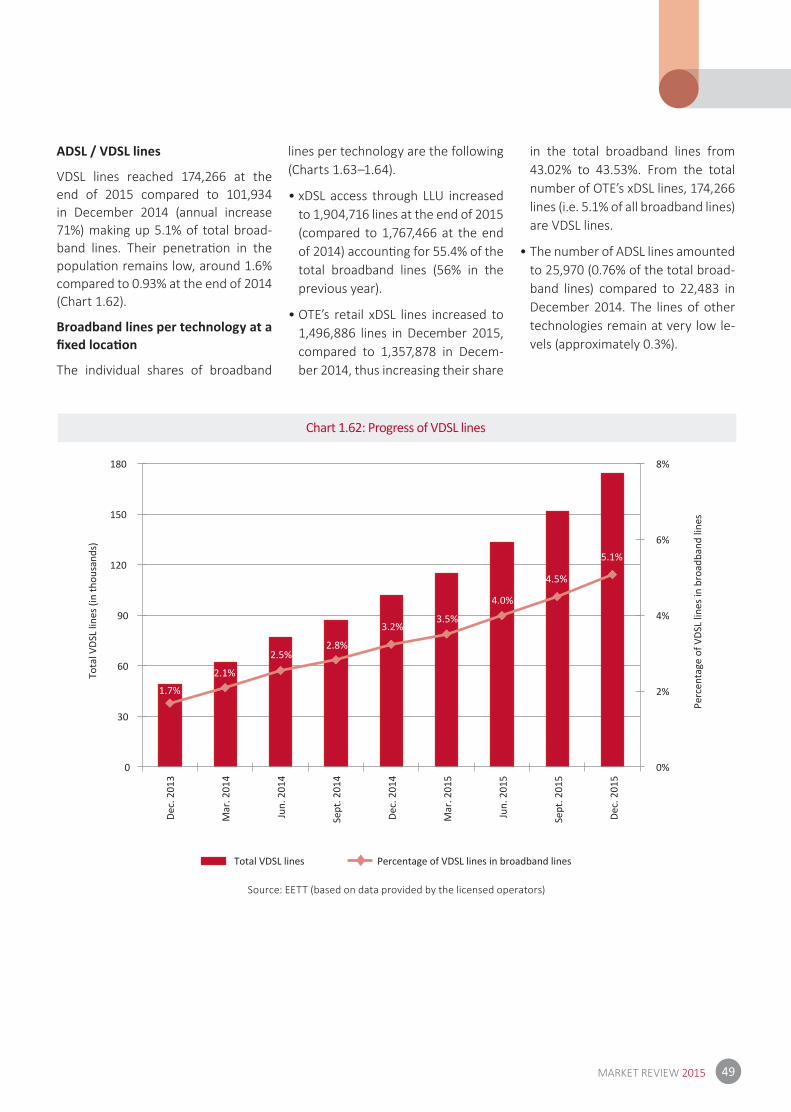
VDSL lines reached 174,266 at the end of 2015 compared to 101,934 in December 2014 (annual increase 71%) making up 5.1% of total broad-band lines. Their penetrati on in the populati on remains low, around 1.6% compared to 0.93% at the end of 2014 (Chart 1.62).
Broadband lines per technology at a fi xed locati on
The individual shares of broadband
lines per technology are the following (Charts 1.63–1.64).
• xDSL access through LLU increased to 1,904,716 lines at the end of 2015 (compared to 1,767,466 at the end of 2014) accounti ng for 55.4% of the total broadband lines (56% in the previous year).
• OTE’s retail xDSL lines increased to 1,496,886 lines in December 2015, compared to 1,357,878 in Decem-ber 2014, thus increasing their share
in the total broadband lines from 43.02% to 43.53%. From the total number of OTE’s xDSL lines, 174,266 lines (i.e. 5.1% of all broadband lines) are VDSL lines.
• The number of ADSL lines amounted to 25,970 (0.76% of the total broad-band lines) compared to 22,483 in December 2014. The lines of other technologies remain at very low le-vels (approximately 0.3%).
Chart 1.62: Progress of VDSL lines
1.7%
2.1%
2.5%2.8%
3.2%3.5%
4.0%
4.5%
5.1%
0%
2%
4%
6%
8%
0
30
60
90
120
150
180
Perc
enta
ge o
f VDS
L lin
es in
bro
adba
nd li
nes
Tota
l VDS
L lin
es (i
n th
ousa
nds)
Total VDSL lines Percentage of VDSL lines in broadband lines
Dec.
201
3
Mar
. 201
4
Jun.
201
4
Sept
. 201
4
Dec.
201
4
Mar
. 201
5
Jun.
201
5
Sept
. 201
5
Dec.
201
5
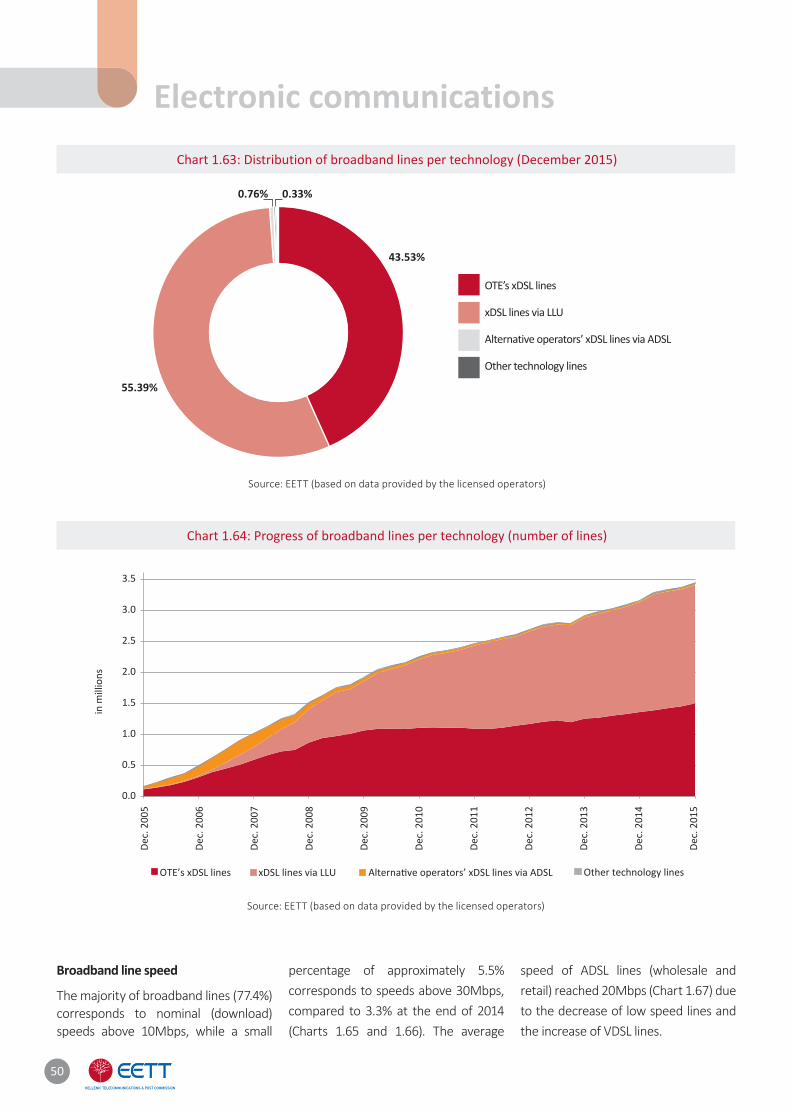
50
Chart 1.63: Distribution of broadband lines per technology (December 2015)
Chart 1.64: Progress of broadband lines per technology (number of lines)
Source: EETT (based on data provided by the licensed operators)
Source: EETT (based on data provided by the licensed operators)
Broadband line speed
The majority of broadband lines (77.4%) corresponds to nominal (download) speeds above 10Mbps, while a small
percentage of approximately 5.5% corresponds to speeds above 30Mbps, compared to 3.3% at the end of 2014 (Charts 1.65 and 1.66). The average
speed of ADSL lines (wholesale and retail) reached 20Mbps (Chart 1.67) due to the decrease of low speed lines and the increase of VDSL lines.
OTE’s xDSL lines
xDSL lines via LLU
Alternative operators’ xDSL lines via ADSL
Other technology lines
43.53%
55.39%
0.76% 0.33%
Electronic communications
0.0
0.5
1.0
1.5
2.0
2.5
3.0
3.5
in m
illio
ns
OTE’s xDSL lines xDSL lines via LLU Other technology lines
Dec.
200
5
Dec.
200
6
Dec.
200
7
Dec.
200
8
Dec
. 200
9
Dec.
201
0
Dec.
201
1
Dec.
201
2
Dec.
201
3
Dec.
201
4
Dec.
201
5
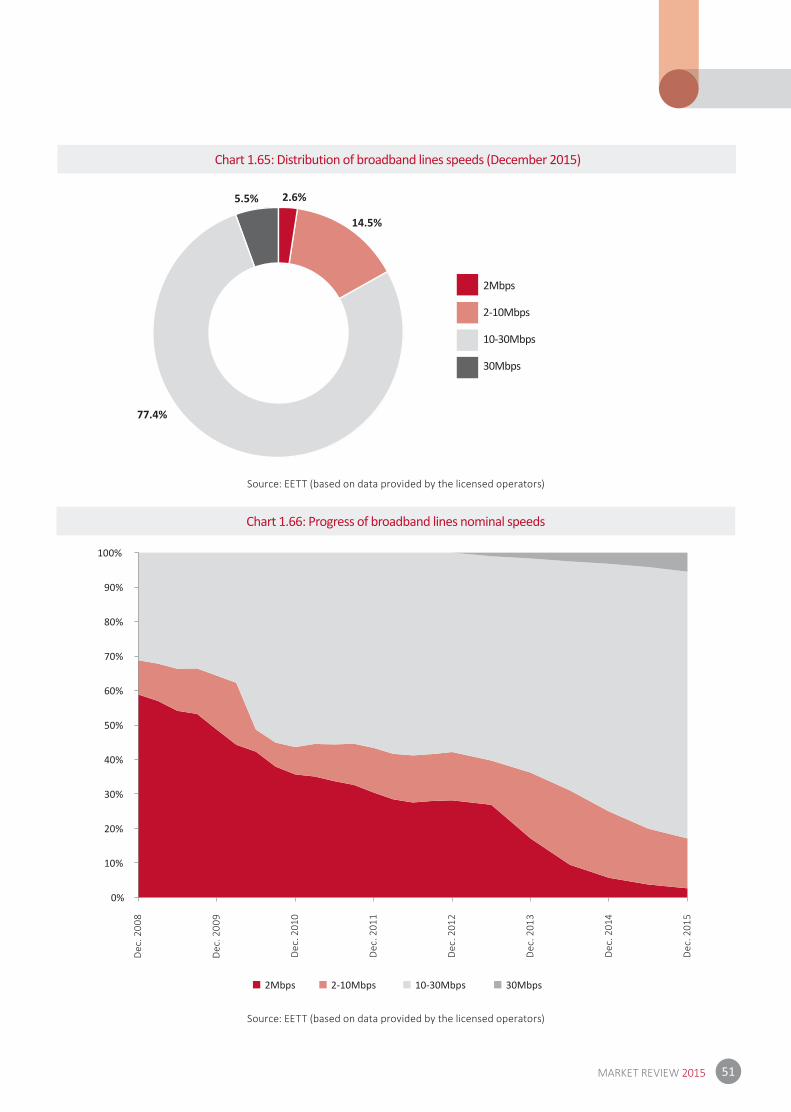
51MARKET REVIEW 2015
Chart 1.65: Distribution of broadband lines speeds (December 2015)
Chart 1.66: Progress of broadband lines nominal speeds
Source: EETT (based on data provided by the licensed operators)
Source: EETT (based on data provided by the licensed operators)
2Mbps
2-10Mbps
10-30Mbps
30Mbps
2.6%
14.5%
77.4%
5.5%
0%
10%
20%
30%
40%
50%
60%
70%
80%
90%
100%
2Mbps 2-10Mbps 10-30Mbps 30Mbps
Dec
. 200
8
Dec
. 200
9
Dec
. 201
0
Dec
. 201
1
Dec
. 201
2
Dec
. 201
3
Dec
. 201
4
Dec
. 201
5
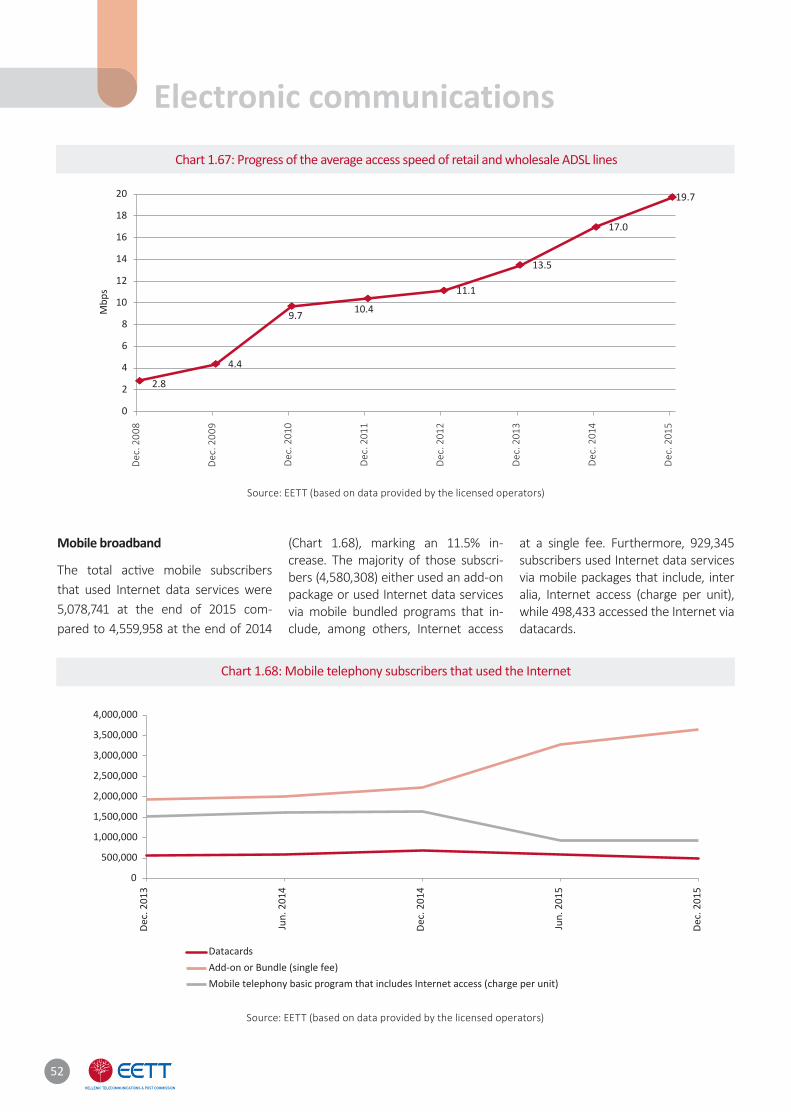
52
Chart 1.67: Progress of the average access speed of retail and wholesale ADSL lines
Chart 1.68: Mobile telephony subscribers that used the Internet
Source: EETT (based on data provided by the licensed operators)
Source: EETT (based on data provided by the licensed operators)
Mobile broadband
The total acti ve mobile subscribers that used Internet data services were 5,078,741 at the end of 2015 com-pared to 4,559,958 at the end of 2014
(Chart 1.68), marking an 11.5% in-crease. The majority of those subscri-bers (4,580,308) either used an add-on package or used Internet data services via mobile bundled programs that in-clude, among others, Internet access
at a single fee. Furthermore, 929,345 subscribers used Internet data services via mobile packages that include, inter alia, Internet access (charge per unit), while 498,433 accessed the Internet via datacards.
Electronic communicationsD
ec. 2
008
Dec
. 200
9
Dec
. 201
0
Dec
. 201
1
Dec
. 201
2
Dec
. 201
3
Dec
. 201
4
Dec
. 201
5
2.8
4.4
9.7 10.4
11.1
13.5
17.0
19.7
0
2
4
6
8
10
12
14
16
18
20
Mbp
s
0
500,000
1,000,000
1,500,000
2,000,000
2,500,000
3,000,000
3,500,000
4,000,000
DatacardsAdd-on or Bundle (single fee)
Mobile telephony basic program that includes Internet access (charge per unit)
Dec.
201
3
Jun.
201
4
Dec.
201
4
Jun.
201
5
Dec.
201
5
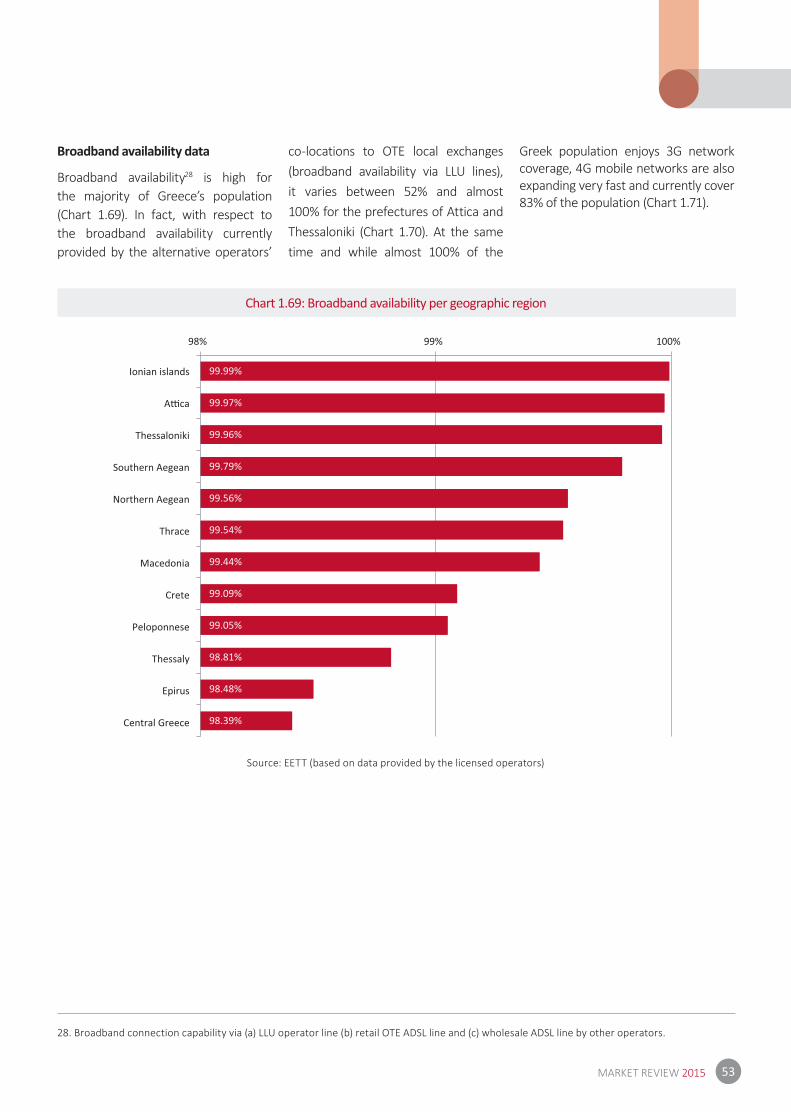
53MARKET REVIEW 2015
Chart 1.69: Broadband availability per geographic region
Source: EETT (based on data provided by the licensed operators)
Broadband availability data
Broadband availability28 is high for the majority of Greece’s population (Chart 1.69). In fact, with respect to the broadband availability currently provided by the alternative operators’
co-locations to OTE local exchanges (broadband availability via LLU lines), it varies between 52% and almost 100% for the prefectures of Attica and Thessaloniki (Chart 1.70). At the same time and while almost 100% of the
Greek population enjoys 3G network coverage, 4G mobile networks are also expanding very fast and currently cover 83% of the population (Chart 1.71).
28. Broadband connection capability via (a) LLU operator line (b) retail OTE ADSL line and (c) wholesale ADSL line by other operators.
99.99%
99.97%
99.96%
99.79%
99.56%
99.54%
99.44%
99.09%
99.05%
98.81%
98.48%
98.39%
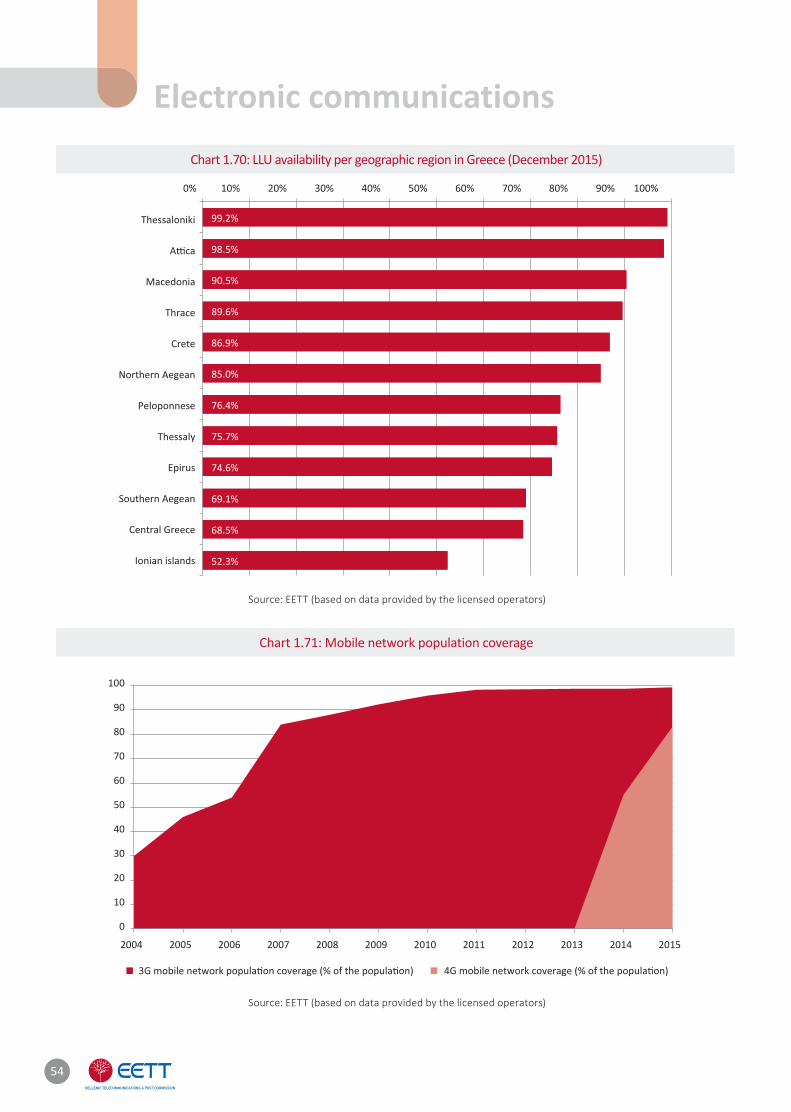
54
Chart 1.70: LLU availability per geographic region in Greece (December 2015)
Chart 1.71: Mobile network population coverage
Source: EETT (based on data provided by the licensed operators)
Source: EETT (based on data provided by the licensed operators)
0
10
20
30
40
50
60
70
80
90
100
2004 2005 2006 2007 2008 2009 2010 2011 2012 2013 2014 2015
Electronic communications
99.2%
98.5%
90.5%
89.6%
86.9%
85.0%
76.4%
75.7%
74.6%
69.1%
68.5%
52.3%
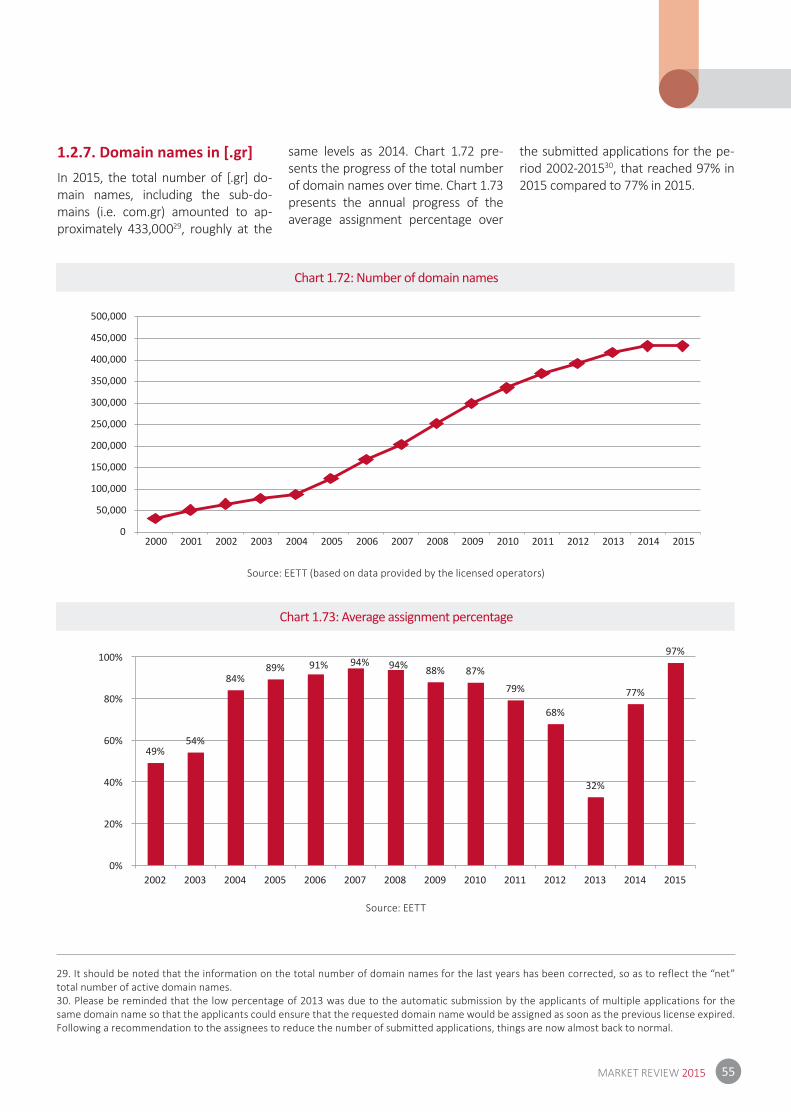
55MARKET REVIEW 2015
Chart 1.72: Number of domain names
Chart 1.73: Average assignment percentage
Source: EETT (based on data provided by the licensed operators)
Source: EETT
1.2.7. Domain names in [.gr]In 2015, the total number of [.gr] do-main names, including the sub-do-mains (i.e. com.gr) amounted to ap-proximately 433,00029, roughly at the
same levels as 2014. Chart 1.72 pre-sents the progress of the total number of domain names over ti me. Chart 1.73 presents the annual progress of the ave rage assignment percentage over
the submitt ed applicati ons for the pe-riod 2002-201530, that reached 97% in 2015 compared to 77% in 2015.
29. It should be noted that the information on the total number of domain names for the last years has been corrected, so as to reflect the “net” total number of active domain names.30. Please be reminded that the low percentage of 2013 was due to the automatic submission by the applicants of multiple applications for the same domain name so that the applicants could ensure that the requested domain name would be assigned as soon as the previous license expired. Following a recommendation to the assignees to reduce the number of submitted applications, things are now almost back to normal.
49%54%
84%89% 91% 94% 94% 88% 87%
79%
68%
32%
77%
97%
0%
20%
40%
60%
80%
100%
2002 2003 2004 2005 2006 2007 2008 2009 2010 2011 2012 2013 2014 2015
0
50,000
100,000
150,000
200,000
250,000
300,000
350,000
400,000
450,000
500,000
2000 2001 2002 2003 2004 2005 2006 2007 2008 2009 2010 2011 2012 2013 2014 2015
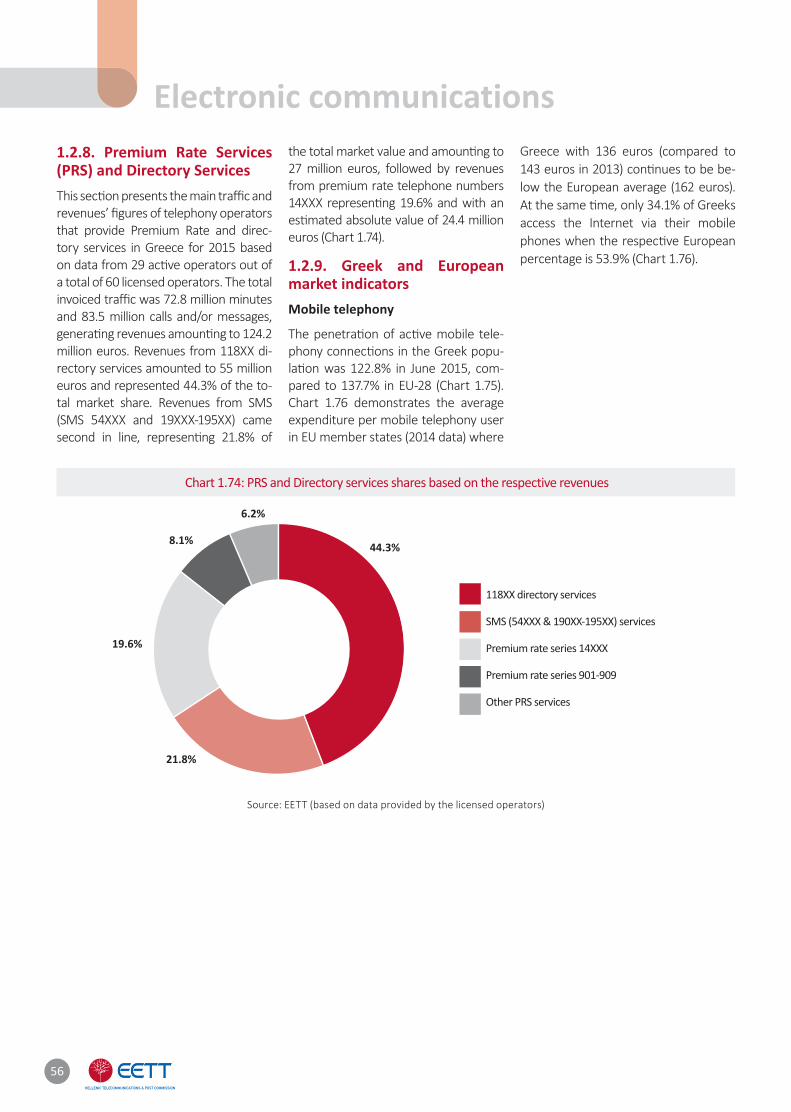
56
1.2.8. Premium Rate Services (PRS) and Directory Services This secti on presents the main traffi c and revenues’ fi gures of telephony operators that provide Premium Rate and direc-tory services in Greece for 2015 based on data from 29 acti ve operators out of a total of 60 licensed operators. The total invoiced traffi c was 72.8 million minutes and 83.5 million calls and/or messages, generati ng revenues amounti ng to 124.2 million euros. Revenues from 118XX di-rectory services amounted to 55 million euros and represented 44.3% of the to-tal market share. Revenues from SMS (SMS 54XXX and 19XXX-195XX) came second in line, representi ng 21.8% of
the total market value and amounti ng to 27 million euros, followed by revenues from premium rate telephone numbers 14XXX representi ng 19.6% and with an esti mated absolute value of 24.4 million euros (Chart 1.74).
1.2.9. Greek and European market indicatorsMobile telephony
The penetrati on of acti ve mobile tele-phony connecti ons in the Greek popu-lati on was 122.8% in June 2015, com-pared to 137.7% in EU-28 (Chart 1.75). Chart 1.76 demonstrates the average expenditure per mobile telephony user in EU member states (2014 data) where
Greece with 136 euros (compared to 143 euros in 2013) conti nues to be be-low the European average (162 euros). At the same ti me, only 34.1% of Greeks access the Internet via their mobile phones when the respecti ve European percentage is 53.9% (Chart 1.76).
Chart 1.74: PRS and Directory services shares based on the respective revenues
Source: EETT (based on data provided by the licensed operators)
118XX directory services
SMS (54XXX & 190XX-195XX) services
Premium rate series 14XXX
Premium rate series 901-909
Other PRS services
44.3%
21.8%
19.6%
8.1%
6.2%
Electronic communications
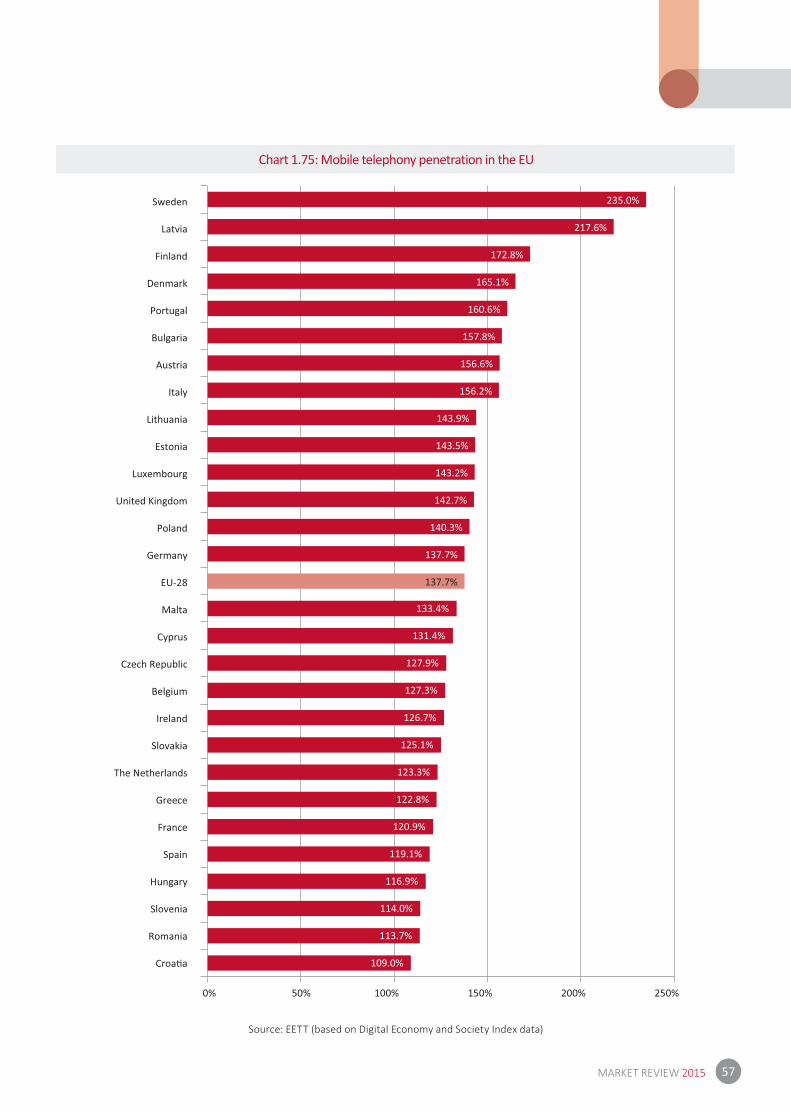
57MARKET REVIEW 2015
Chart 1.75: Mobile telephony penetration in the EU
Source: EETT (based on Digital Economy and Society Index data)
109.0%
113.7%
114.0%
116.9%
119.1%
120.9%
122.8%
123.3%
125.1%
126.7%
127.3%
127.9%
131.4%
133.4%
137.7%
137.7%
140.3%
142.7%
143.2%
143.5%
143.9%
156.2%
156.6%
157.8%
160.6%
165.1%
172.8%
217.6%
235.0%
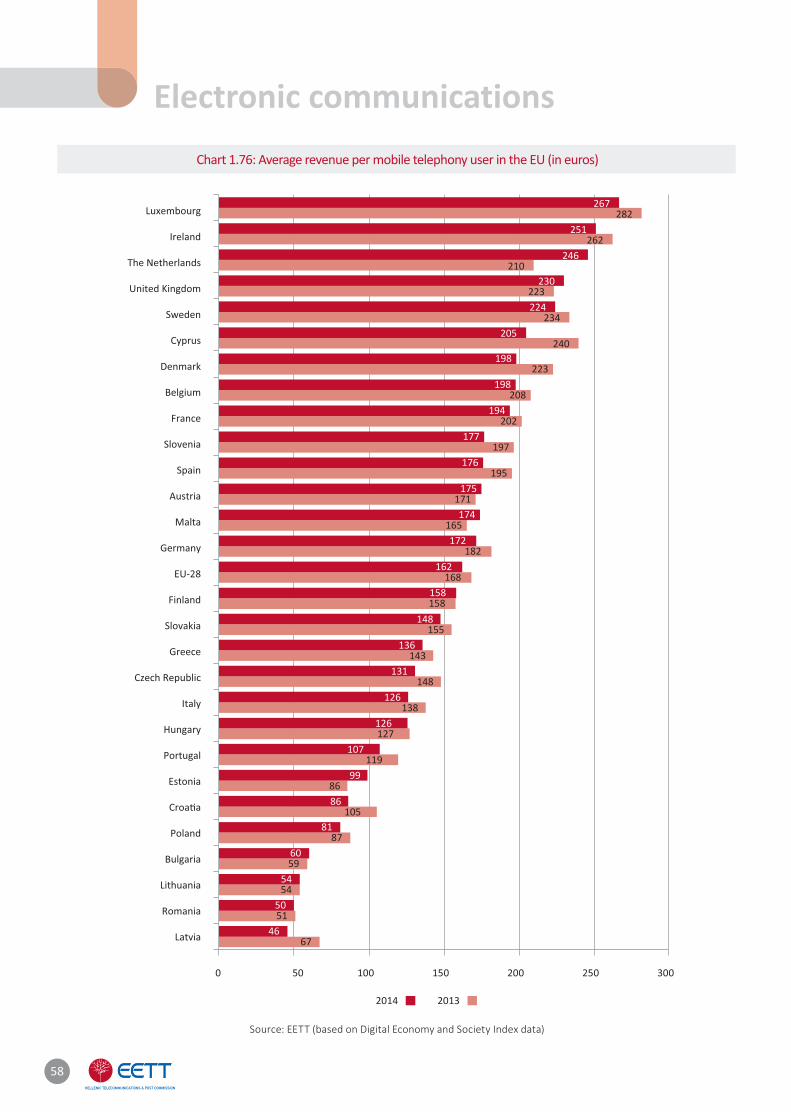
58
Chart 1.76: Average revenue per mobile telephony user in the EU (in euros)
Source: EETT (based on Digital Economy and Society Index data)
Electronic communications
67
51
54
59
87
105
86
119
127
138
148
143
155
158
168
182
165
171
195
197
202
208
223
240
234
223
210
262
282
46
50
54
60
81
86
99
107
126
126
131
136
148
158
162
172
174
175
176
177
194
198
198
205
224
230
246
251
267
2014 2013
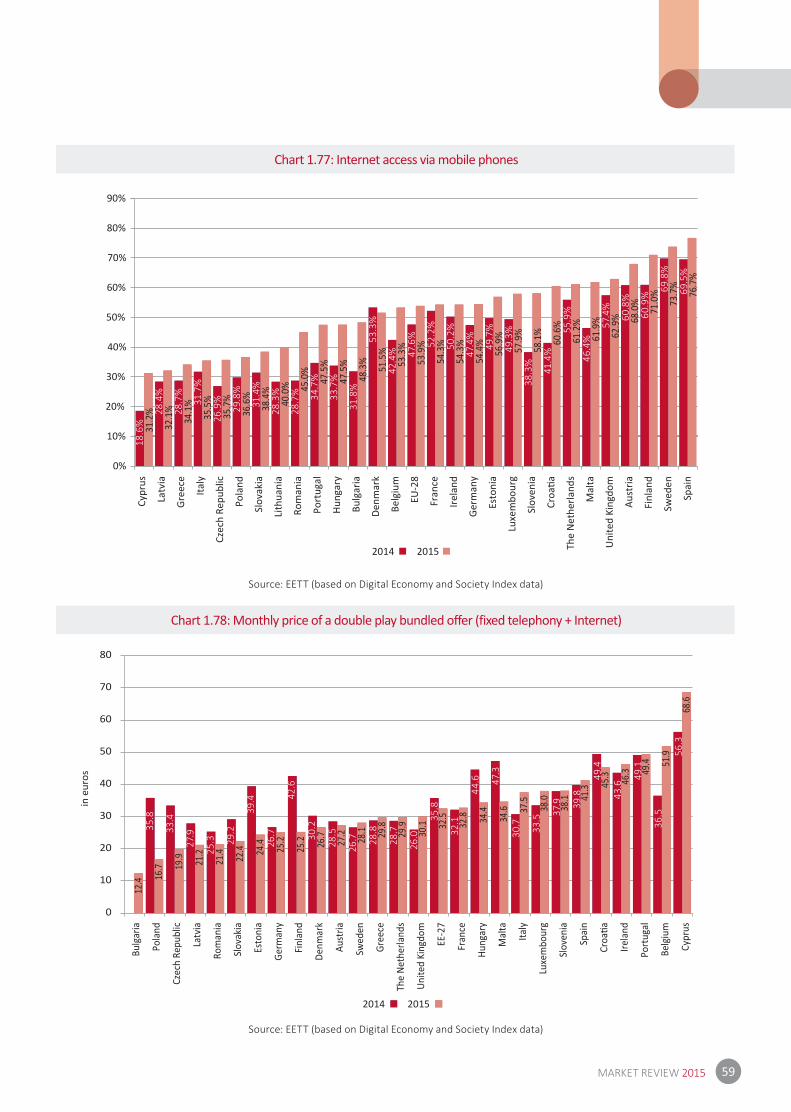
59MARKET REVIEW 2015
2014 2015
12.4 16
.7 19.9 21
.2
21.4 22.4 24
.4 25.2
25.2 26
.7
27.2 28.1 29
.8
29.9
30.1 32
.5
32.8 34
.4
34.6 37
.5
38.0
38.1 41
.3 45.3 46.3 49
.4 51.9
68.6
0
10
20
30
40
50
60
70
80
in e
uros
31.2
%
32.1
%
34.1
%
35.5
%
35.7
%
36.6
%
38.4
%
40.0
% 45.0
%
47.5
%
47.5
%
48.3
%
51.5
%
53.3
%
53.9
%
54.3
%
54.3
%
54.4
%
56.9
%
57.9
%
58.1
%
60.6
%
61.2
%
61.9
%
62.9
% 68.0
%
71.0
%
73.7
%
76.7
%
0%
10%
20%
30%
40%
50%
60%
70%
80%
90%
2014 2015
Chart 1.77: Internet access via mobile phones
Chart 1.78: Monthly price of a double play bundled offer (fixed telephony + Internet)
Source: EETT (based on Digital Economy and Society Index data)
Source: EETT (based on Digital Economy and Society Index data)
18.6
%
28.
4%
28.
7%
3
1.7%
2
6.9%
29.
8%
3
1.4%
28.
3%
28.
7%
34.
7%
33.
7%
31
.8%
53.
3%
42.4
%
47.
6%
5
2.2%
5
0.2%
47.
4%
4
9.7%
49
.3%
38.
3%
41.4
%
5
5.9%
4
6.4%
57.
4%
6
0.8%
6
0.9%
6
9.8%
69
.5%
35.
8
33.4
27.9
25
.3
29.
2
39.
4
26.7
42.
6
30
.2
28.5
2
6.7
28.
8
28.
7
2
6.0
3
5.8
3
2.1
4
4.6
47.
3
3
0.7
33.5
37.
9
3
9.8
4
9.4
43.
6
4
9.1
36.
5
56.
3
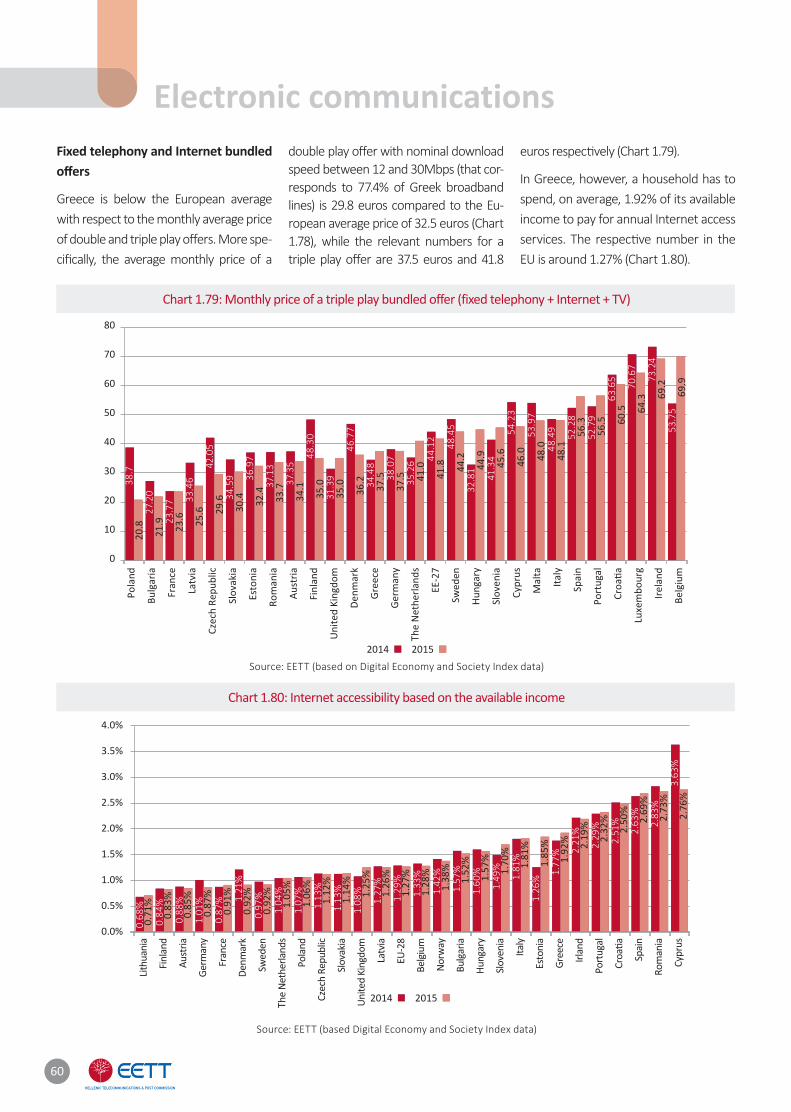
60
2014 2015
0.71
%
0.83
%
0.85
%
0.87
%
0.91
%
0.92
%
0.92
%
1.05
%
1.06
%
1.12
%
1.14
%
1.25
%
1.26
%
1.27
%
1.28
%
1.38
%
1.52
%
1.57
%
1.70
%
1.81
%
1.85
%
1.92
% 2.19
%
2.32
%
2.50
%
2.69
%
2.73
%
2.76
%
0.0%
0.5%
1.0%
1.5%
2.0%
2.5%
3.0%
3.5%
4.0%
2014 2015
20.8
21.9 23
.6 25.6 29
.6
30.4 32
.4
33.7
34.1
35.0
35.0
36.2
37.5
37.5 41
.0
41.8 44
.2
44.9
45.6
46.0 48
.0
48.1
56.3
56.5 60
.5 64.3 69
.2
69.9
0
10
20
30
40
50
60
70
80
Fixed telephony and Internet bundled off ers
Greece is below the European average with respect to the monthly average price of double and triple play off ers. More spe-cifi cally, the average monthly price of a
double play off er with nominal download speed between 12 and 30Mbps (that cor-responds to 77.4% of Greek broadband lines) is 29.8 euros compared to the Eu-ropean average price of 32.5 euros (Chart 1.78), while the relevant numbers for a triple play off er are 37.5 euros and 41.8
euros respecti vely (Chart 1.79).
In Greece, however, a household has to spend, on average, 1.92% of its available income to pay for annual Internet access services. The respecti ve number in the EU is around 1.27% (Chart 1.80).
Chart 1.79: Monthly price of a triple play bundled offer (fixed telephony + Internet + TV)
Chart 1.80: Internet accessibility based on the available income
Source: EETT (based on Digital Economy and Society Index data)
Source: EETT (based Digital Economy and Society Index data)
Electronic communications
3
8.7
27.
20
23
.77
33.4
6
42.
05
34.
59
36
.97
37.1
3
37.
35
48.3
0
31.
39
46
.77
34.4
8
38
.07
35.
26
4
4.12
4
8.45
3
2.81
41
.34
5
4.23
53
.97
48
.49
52.
28
52.
79
63.6
5
7
0.67
73.
24
5
3.75
0.6
8%
0.
84%
0
.88%
1
.01%
0
.87%
1.2
1%
0.97
%
1.0
4%
1.0
7%
1
.13%
1.
13%
1.0
8%
1.27
%
1.2
9%
1.
33%
1
.42%
1
.57%
1
.60%
1.49
%
1
.81%
1.2
6%
1.77
%
2.
21%
2
.29%
2.5
1%
2
.63%
2.8
3%
3.6
3%
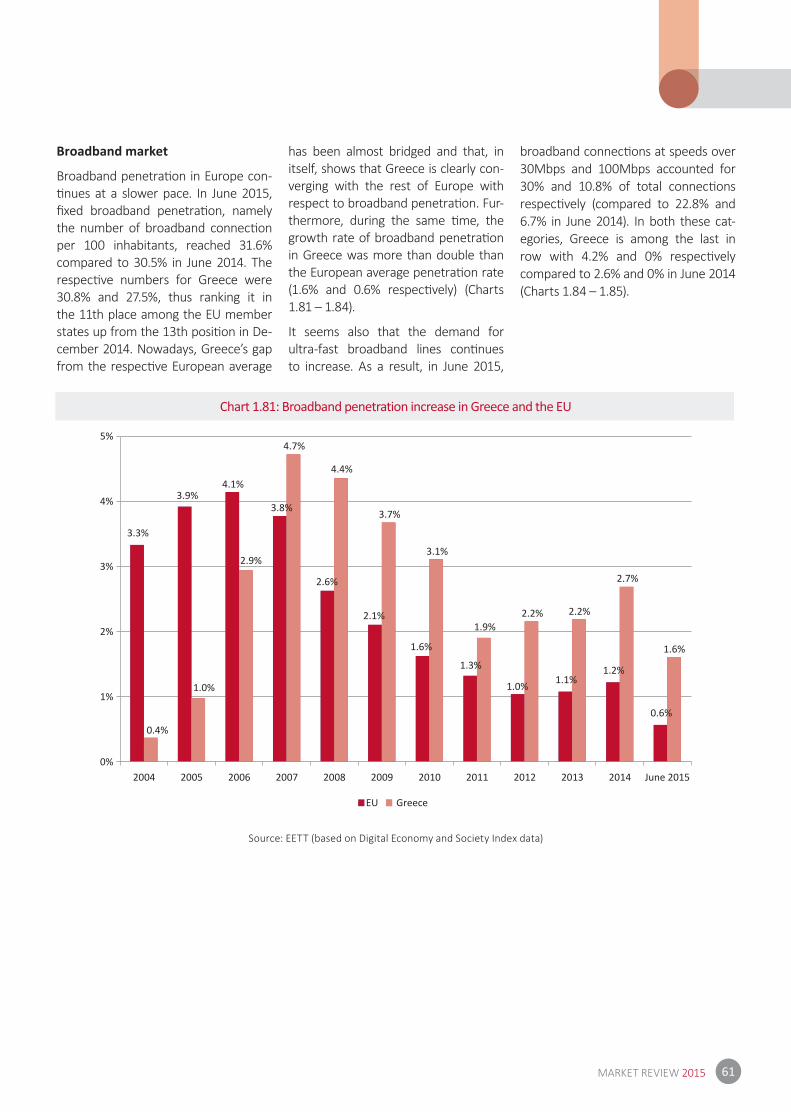
61MARKET REVIEW 2015
Broadband market
Broadband penetrati on in Europe con-ti nues at a slower pace. In June 2015, fi xed broadband penetrati on, namely the number of broadband connecti on per 100 inhabitants, reached 31.6% compared to 30.5% in June 2014. The respecti ve numbers for Greece were 30.8% and 27.5%, thus ranking it in the 11th place among the EU member states up from the 13th positi on in De-cember 2014. Nowadays, Greece’s gap from the respecti ve European average
has been almost bridged and that, in itself, shows that Greece is clearly con-verging with the rest of Europe with respect to broadband penetrati on. Fur-thermore, during the same ti me, the growth rate of broadband penetrati on in Greece was more than double than the European average penetrati on rate (1.6% and 0.6% respecti vely) (Charts 1.81 – 1.84).
It seems also that the demand for ultra-fast broadband lines conti nues to increase. As a result, in June 2015,
broadband connecti ons at speeds over 30Mbps and 100Mbps accounted for 30% and 10.8% of total connecti ons respecti vely (compared to 22.8% and 6.7% in June 2014). In both these cat-egories, Greece is among the last in row with 4.2% and 0% respecti vely compared to 2.6% and 0% in June 2014 (Charts 1.84 – 1.85).
Chart 1.81: Broadband penetration increase in Greece and the EU
Source: EETT (based on Digital Economy and Society Index data)
3.3%
3.9%4.1%
3.8%
2.6%
2.1%
1.6%
1.3%
1.0% 1.1%1.2%
0.6%0.4%
1.0%
2.9%
4.7%
4.4%
3.7%
3.1%
1.9%2.2% 2.2%
2.7%
1.6%
0%
1%
2%
3%
4%
5%
2004 2005 2006 2007 2008 2009 2010 2011 2012 2013 2014 June 2015
Greece
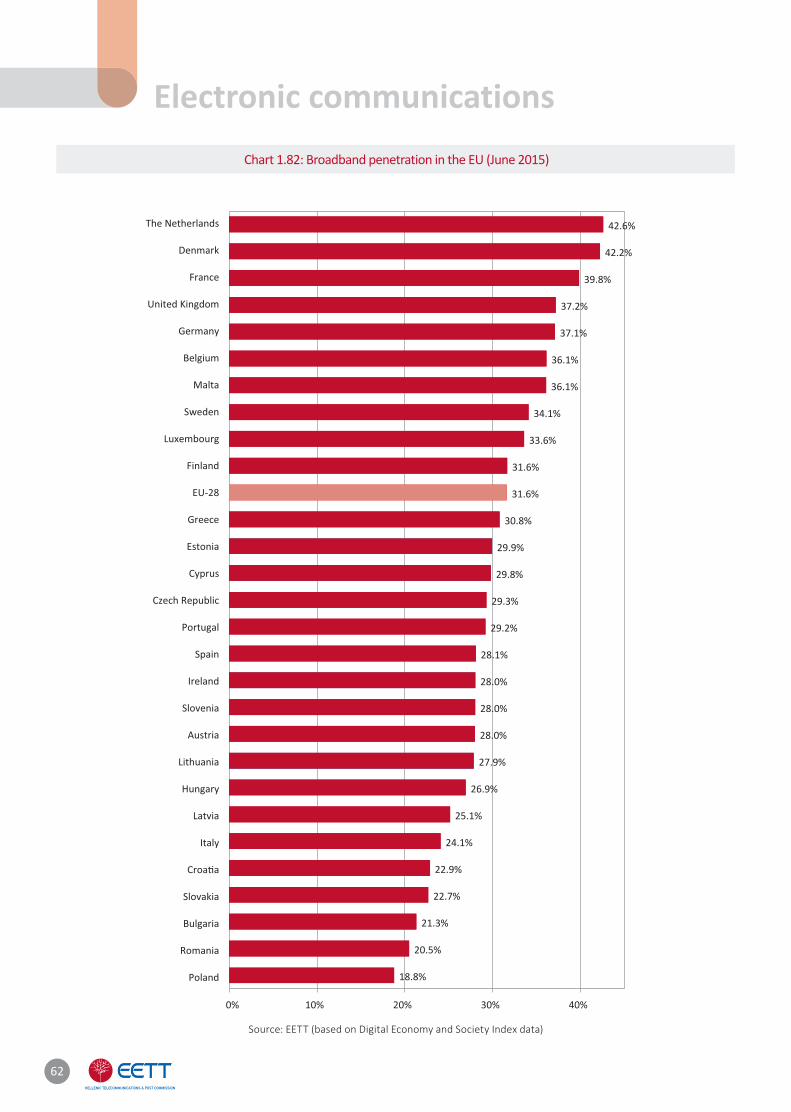
62
Chart 1.82: Broadband penetration in the EU (June 2015)
Source: EETT (based on Digital Economy and Society Index data)
Electronic communications
18.8%
20.5%
21.3%
22.7%
22.9%
24.1%
25.1%
26.9%
27.9%
28.0%
28.0%
28.0%
28.1%
29.2%
29.3%
29.8%
29.9%
30.8%
31.6%
31.6%
33.6%
34.1%
36.1%
36.1%
37.1%
37.2%
39.8%
42.2%
42.6%
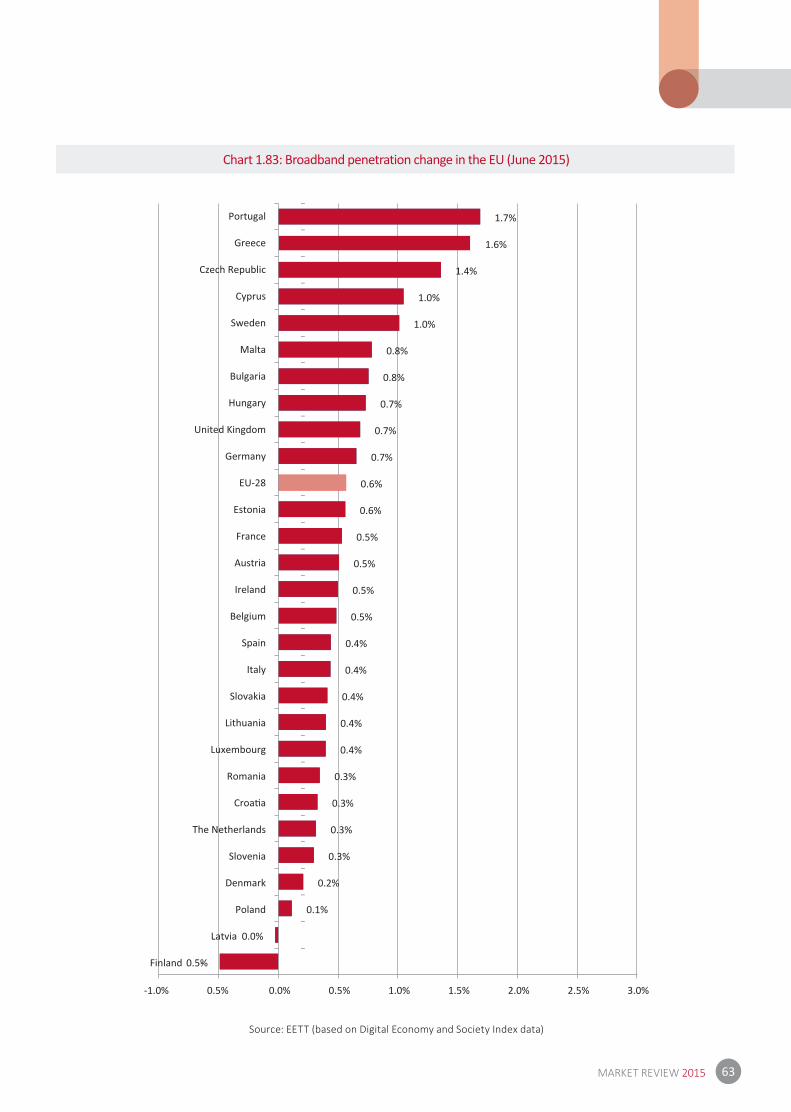
63MARKET REVIEW 2015
Chart 1.83: Broadband penetration change in the EU (June 2015)
Source: EETT (based on Digital Economy and Society Index data)
-0.5%
0.0%
0.1%
0.2%
0.3%
0.3%
0.3%
0.3%
0.4%
0.4%
0.4%
0.4%
0.4%
0.5%
0.5%
0.5%
0.5%
0.6%
0.6%
0.7%
0.7%
0.7%
0.8%
0.8%
1.0%
1.0%
1.4%
1.6%
1.7%
-1.0%- 0.5% 0.0% 0.5% 1.0% 1.5% 2.0% 2.5% 3.0%
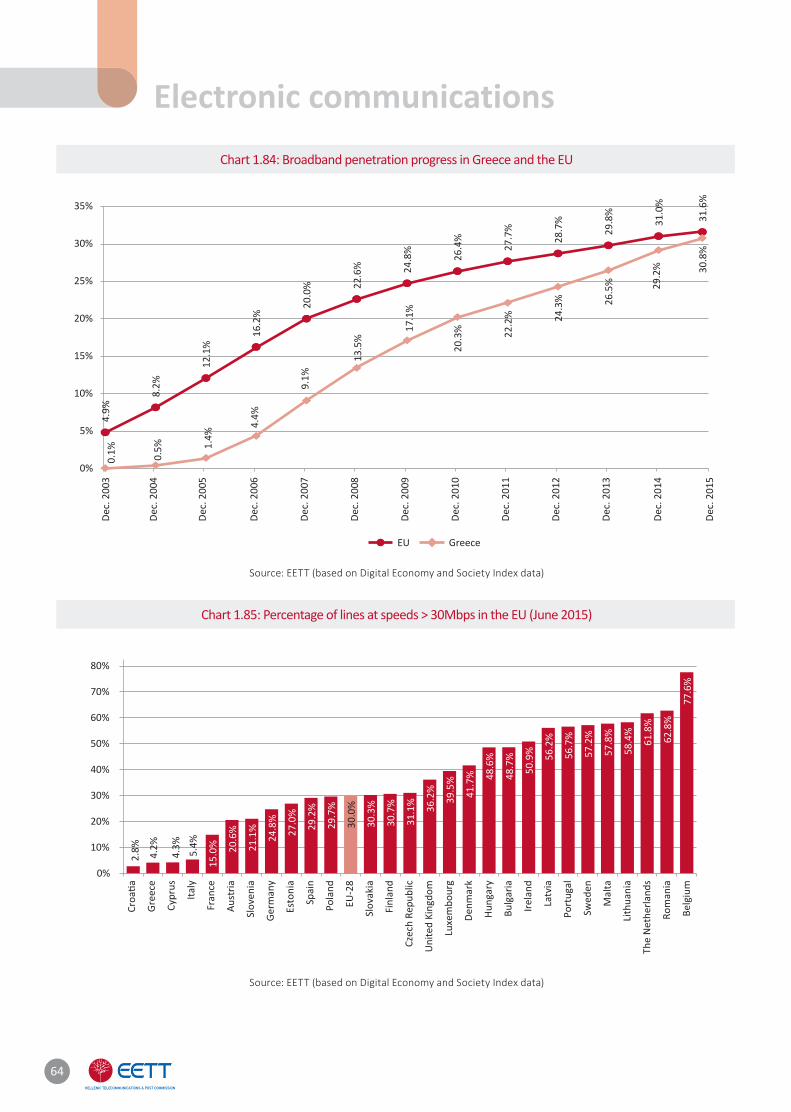
64
Chart 1.84: Broadband penetration progress in Greece and the EU
Chart 1.85: Percentage of lines at speeds > 30Mbps in the EU (June 2015)
Source: EETT (based on Digital Economy and Society Index data)
Source: EETT (based on Digital Economy and Society Index data)
Electronic communications4.
9%
8.2%
12.1
%
16.2
%
20.0
% 22.6
% 24.8
%
26.4
%
27.7
%
28.7
%
29.8
%
31.0
%
31.6
%
0.1% 0.5% 1.
4%
4.4%
9.1%
13.5
%
17.1
%
20.3
% 22.2
% 24.3
% 26.5
% 29.2
% 30.8
%
0%
5%
10%
15%
20%
25%
30%
35%
Dec.
200
3
Dec.
200
4
Dec.
200
5
Dec.
200
6
Dec.
200
7
Dec.
200
8
Dec.
200
9
Dec.
201
0
Dec.
201
1
Dec.
201
2
Dec.
201
3
Dec.
201
4
Dec.
201
5
EU Greece
2.8% 4.2%
4.3% 5.4%
15.0
% 20.6
%
21.1
%
24.8
%
27.0
%
29.2
%
29.7
%
30.0
%
30.3
%
30.7
%
31.1
% 36.2
%
39.5
%
41.7
% 48.6
%
48.7
%
50.9
% 56.2
%
56.7
%
57.2
%
57.8
%
58.4
%
61.8
%
62.8
%
77.6
%
0%
10%
20%
30%
40%
50%
60%
70%
80%
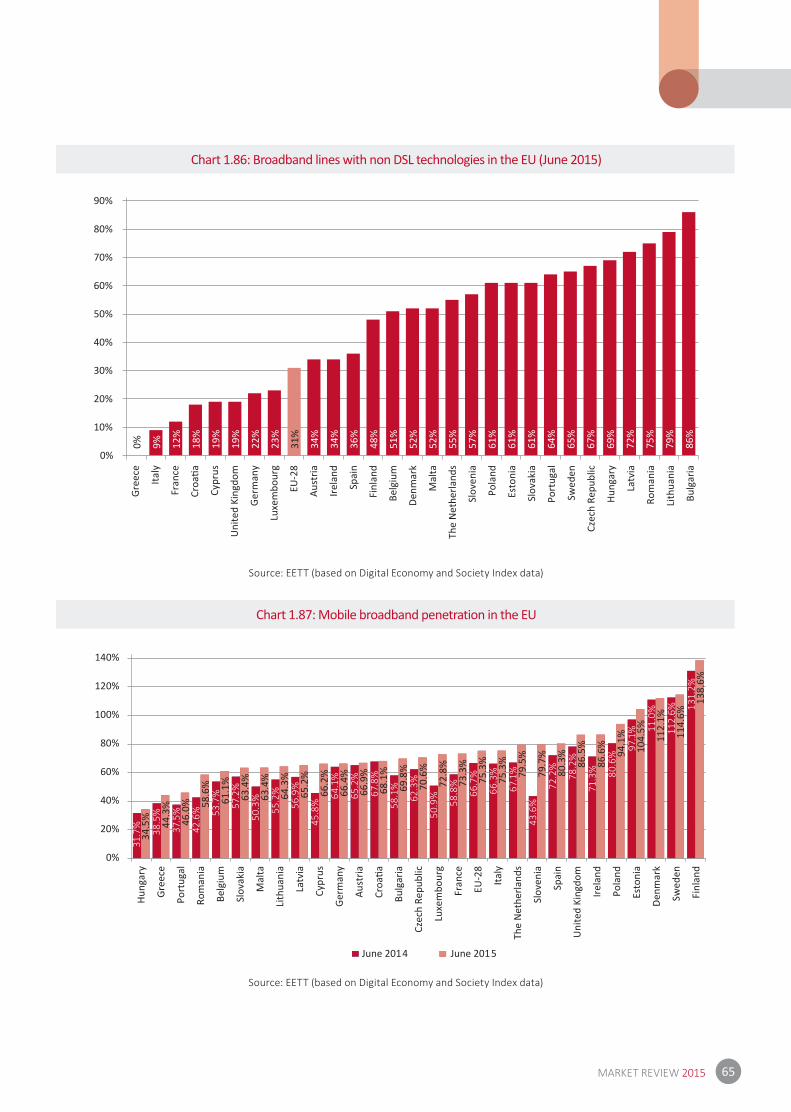
65MARKET REVIEW 2015
34.5
%
44.3
%
46.0
% 58.6
%
61.1
%
63.4
%
63.4
%
64.3
%
65.2
%
66.2
%
66.4
%
66.9
%
68.1
%
69.8
%
70.6
%
72.8
%
73.3
%
75.3
%
75.3
%
79.5
%
79.7
%
80.3
%
86.5
%
86.6
%
94.1
%
104.
5%
112.
1%
114.
6%
138.
6%
0%
20%
40%
60%
80%
100%
120%
140%
June 2015June 2014
Chart 1.86: Broadband lines with non DSL technologies in the EU (June 2015)
Chart 1.87: Mobile broadband penetration in the EU
Source: EETT (based on Digital Economy and Society Index data)
Source: EETT (based on Digital Economy and Society Index data)
0% 9% 12%
18%
19%
19%
22%
23%
31%
34%
34%
36%
48%
51%
52%
52%
55%
57%
61%
61%
61%
64%
65%
67%
69%
72%
75%
79%
86%
0%
10%
20%
30%
40%
50%
60%
70%
80%
90%
3
1.7%
38
.5%
3
7.5%
4
2.6%
5
3.7%
57.
2%
50
.3%
55.2
%
56.
9%
45.
8%
64.1
%
65.2
%
67.
8%
58.
1%
6
2.3%
5
0.9%
58
.8%
66.
7%
66.
3%
67
.1%
43.
6%
7
2.2%
78.
2%
71
.3%
80
.6%
97.
1%
1
1.0%
11
2.6%
131
.2%
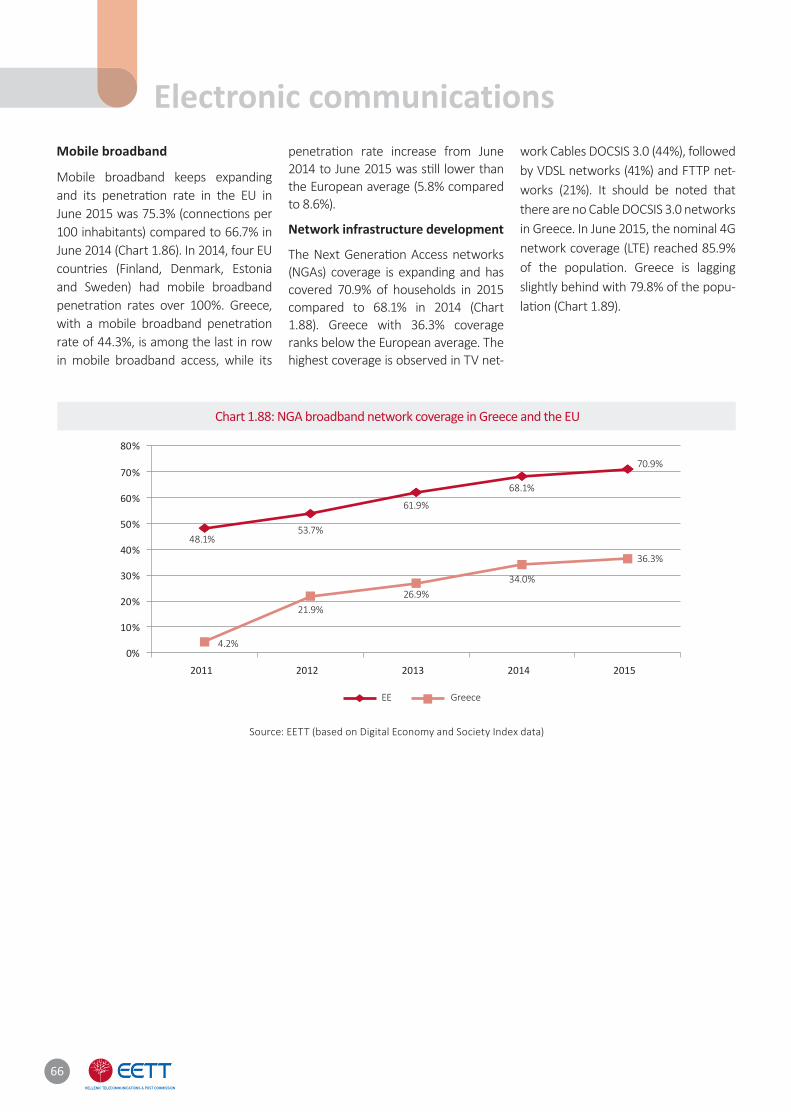
66
Mobile broadband
Mobile broadband keeps expanding and its penetrati on rate in the EU in June 2015 was 75.3% (connecti ons per 100 inhabitants) compared to 66.7% in June 2014 (Chart 1.86). In 2014, four EU countries (Finland, Denmark, Estonia and Sweden) had mobile broadband penetrati on rates over 100%. Greece, with a mobile broadband penetrati on rate of 44.3%, is among the last in row in mobile broadband access, while its
penetrati on rate increase from June 2014 to June 2015 was sti ll lower than the European average (5.8% compared to 8.6%).
Network infrastructure development
The Next Generati on Access networks (NGAs) coverage is expanding and has covered 70.9% of households in 2015 compared to 68.1% in 2014 (Chart 1.88). Greece with 36.3% coverage ranks below the European average. The highest coverage is observed in TV net-
work Cables DOCSIS 3.0 (44%), followed by VDSL networks (41%) and FTTP net-works (21%). It should be noted that there are no Cable DOCSIS 3.0 networks in Greece. In June 2015, the nominal 4G network coverage (LTE) reached 85.9% of the populati on. Greece is lagging slightly behind with 79.8% of the popu-lati on (Chart 1.89).
Chart 1.88: NGA broadband network coverage in Greece and the EU
Source: EETT (based on Digital Economy and Society Index data)
2011 2012 2013 2014 2015
Electronic communications
0%
10%
20%
30%
40%
50%
60%
70%
80%
48.1%53.7%
61.9%
68.1%
70.9%
4.2%
21.9%
EE Greece
26.9%34.0%
36.3%
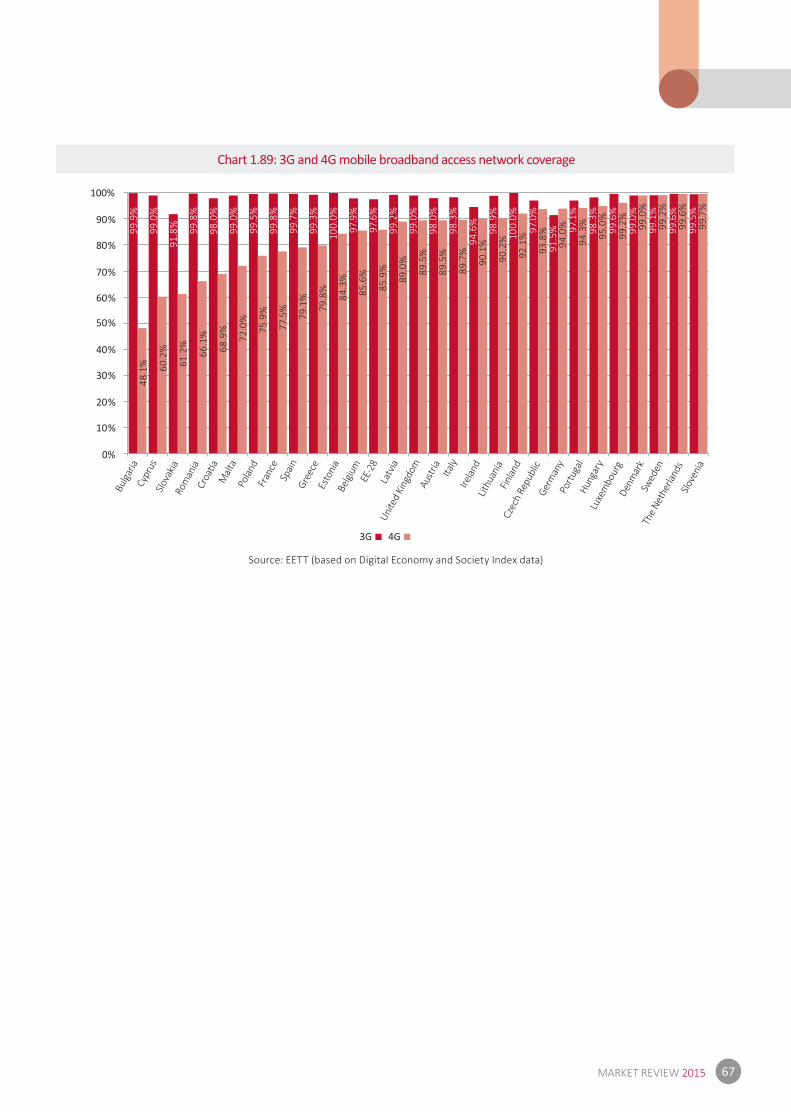
67MARKET REVIEW 2015
Chart 1.89: 3G and 4G mobile broadband access network coverage
Source: EETT (based on Digital Economy and Society Index data)
3G 4G
0%
10%
20%
30%
40%
50%
60%
70%
80%
90%
100%
4
8.1%
6
0.2%
61.2
%
6
6.1%
68.9
%
72.0
%
75.
9%
77
.5%
79.1
%
79.
8%
8
4.3%
85.
6%
85.9
%
89.
0%
89.
5%
89.
5%
89.
7%
90
.1%
90.2
%
92
.1%
93.
8%
94.0
%
94.
3%
95.
0%
99.
2% 99.0
%
99.2
%
99.6
%
99.7
%
99.9
%
99.0
%
9
1.8% 99
.8%
98.0
%
99.0
%
99.5
%
99.8
%
99.7
%
99.3
%
100.
0%
97.9
%
97.6
%
99.2
%
99.0
%
98.0
%
98.3
%
94.
6% 98.9
%
100.
0%
97.0
%
91.
5% 97.1
%
98.3
%
99.6
%
99.0
%
99.1
%
99.6
%
99.5
%
2.1. The course of the postal market
2.1.1. GloballyKey fi nancial fi guresThe conti nuing global trend towards e-commerce and electronic means of communicati on and informati on has “revoluti onized” the postal mar-ket, changing the way that postal ser-vice providers cooperate, as well as the way that they interact with their customers. The common objecti ve of postal service providers is to diff eren-ti ate their sources of revenues by de-veloping new business acti viti es and entering new geographic markets. At the same ti me, due to increased com-peti ti on and the conti nuous electro-nic substi tuti on of lett er mail, postal service providers focus more on im-proving their operati onal effi ciency, to help cut costs and sustain their profi ts. The fi rst results for 201531 demonstrate a conti nuous growth of the global postal market. Revenues increased by 2.5%, year-on-year. De-spite the decline of mail volume, mail
revenue grew by 0.9%, while parcel and express revenue grew by 4.7% year-on-year, thanks to the conti nu-ous growth of e-commerce. Despite this positi ve trend, the postal market growth slowed down com-pared to previous years. In 2014, the global postal market revenue totalled 435.6 billion euros, with an average growth rate of 2.8% and an average EBIT margin of 4.8%32. This increase was driven mainly by the parcel and courier acti viti es of postal services providers and less by lett er mail, logis-ti cs and freight acti viti es. Despite the conti nuous fall of the total mail volume, this segment remained strong, representi ng 44.8% of the to-tal market revenue, mainly thanks to cost reducti on and innovati on eff orts. It is worth noti ng that despite a 3.9% fall in the total mail volume in 2014, revenue increased by 1.5% year-on-year. The primary driver of the de-cline in mail volume is the e-substi -tuti on of mail, which aff ects strongly the sectors of corporate adverti sing and government administrati on. The
postal products that declined the most compared to the previous year, were priority lett ers (6.5%) and non-priority lett ers (4.6%). In response to the negati ve performance of this seg-ment, postal services providers are currently launching new, innovati ve services, including digital mailboxes, postal apps, digital stamps and post-cards, etc. The increase in e-commerce, the global economic growth33, the acqui-siti ons among postal providers and the use by consumers of new pro-ducts and services were the main drivers of growth in the parcels sec-tor. Parcels and express volumes have grown by more than 5% annually over the last three years. In fact, in 2014, the growth rate increased to 6.3%. Furthermore, revenues increased by 6.7%, although at a slower pace com-pared to last year. The main cause of this slowdown is the intensive compe-ti ti on that aff ects prices and operator profi tability.
Trends in the global postal marketThe current changes in the postal in-
31. IPC Preliminary Results 2015.32. IPC, “Global Postal Industry Report” (November 2015)33. In 2014, the world GDP increased by 3.4% (IPC, “Global Postal Industry Report”, November 2015)..
68
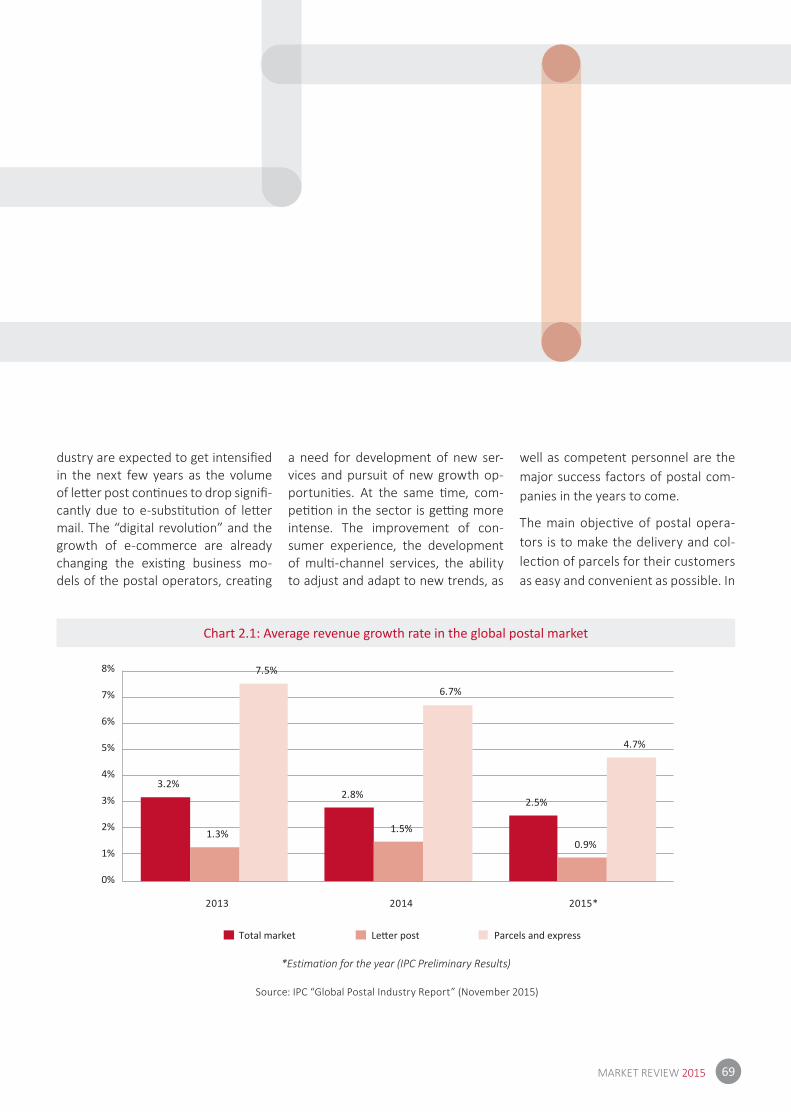
69MARKET REVIEW 2015
dustry are expected to get intensifi ed in the next few years as the volume of lett er post conti nues to drop signifi -cantly due to e-substi tuti on of lett er mail. The “digital revoluti on” and the growth of e-commerce are already changing the existi ng business mo-dels of the postal operators, creati ng
a need for development of new ser-vices and pursuit of new growth op-portuniti es. At the same ti me, com-peti ti on in the sector is getti ng more intense. The improvement of con-sumer experience, the development of multi -channel services, the ability to adjust and adapt to new trends, as
well as competent personnel are the major success factors of postal com-panies in the years to come.
The main objecti ve of postal opera-tors is to make the delivery and col-lecti on of parcels for their customers as easy and convenient as possible. In
Chart 2.1: Average revenue growth rate in the global postal market
Source: IPC “Global Postal Industry Report” (November 2015)
*Estimation for the year (IPC Preliminary Results)
3.2%2.8%
2.5%
1.3% 1.5%0.9%
7.5%
6.7%
4.7%
0%
1%
2%
3%
4%
5%
6%
7%
8%
Total market Parcels and express
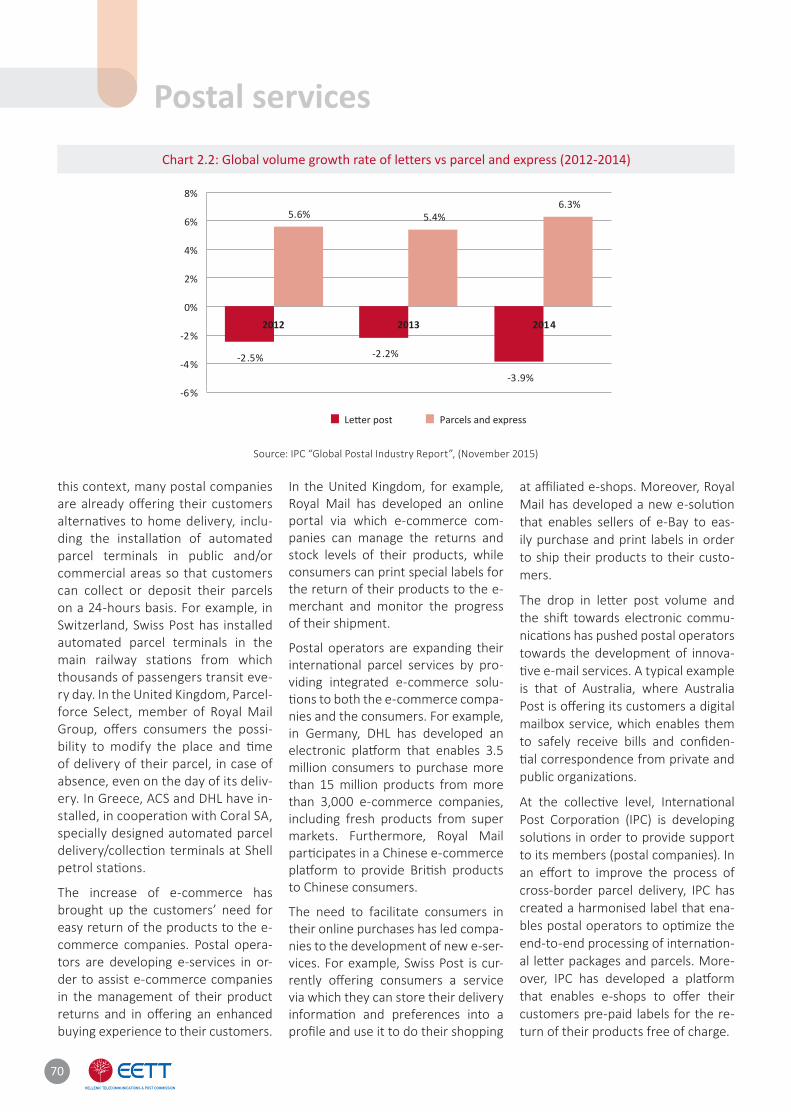
Chart 2.2: Global volume growth rate of letters vs parcel and express (2012-2014)
Postal services
Source: IPC “Global Postal Industry Report”, (November 2015)
this context, many postal companies are already off ering their customers alternati ves to home delivery, inclu-ding the installati on of automated parcel terminals in public and/or commercial areas so that customers can collect or deposit their parcels on a 24-hours basis. For example, in Switzerland, Swiss Post has installed automated parcel terminals in the main railway stati ons from which thousands of passengers transit eve-ry day. In the United Kingdom, Parcel-force Select, member of Royal Mail Group, off ers consumers the possi-bility to modify the place and ti me of delivery of their parcel, in case of absence, even on the day of its deliv-ery. In Greece, ACS and DHL have in-stalled, in cooperati on with Coral SA, specially designed automated parcel delivery/collecti on terminals at Shell petrol stati ons.
The increase of e-commerce has brought up the customers’ need for easy return of the products to the e-commerce companies. Postal opera-tors are developing e-services in or-der to assist e-commerce companies in the management of their product returns and in off ering an enhanced buying experience to their customers.
In the United Kingdom, for example, Royal Mail has developed an online portal via which e-commerce com-panies can manage the returns and stock levels of their products, while consumers can print special labels for the return of their products to the e-merchant and monitor the progress of their shipment.
Postal operators are expanding their internati onal parcel services by pro-viding integrated e-commerce solu-ti ons to both the e-commerce compa-nies and the consumers. For example, in Germany, DHL has developed an electronic platf orm that enables 3.5 million consumers to purchase more than 15 million products from more than 3,000 e-commerce companies, including fresh products from super markets. Furthermore, Royal Mail parti cipates in a Chinese e-commerce platf orm to provide Briti sh products to Chinese consumers.
The need to facilitate consumers in their online purchases has led compa-nies to the development of new e-ser-vices. For example, Swiss Post is cur-rently off ering consumers a service via which they can store their delivery informati on and preferences into a profi le and use it to do their shopping
at affi liated e-shops. Moreover, Royal Mail has developed a new e-soluti on that enables sellers of e-Bay to eas-ily purchase and print labels in order to ship their products to their custo-mers.
The drop in lett er post volume and the shift towards electronic commu-nicati ons has pushed postal operators towards the development of innova-ti ve e-mail services. A typical example is that of Australia, where Australia Post is off ering its customers a digital mailbox service, which enables them to safely receive bills and confi den-ti al correspondence from private and public organizati ons.
At the collecti ve level, Internati onal Post Corporati on (IPC) is developing soluti ons in order to provide support to its members (postal companies). In an eff ort to improve the process of cross-border parcel delivery, IPC has created a harmonised label that ena-bles postal operators to opti mize the end-to-end processing of internati on-al lett er packages and parcels. More-over, IPC has developed a platf orm that enables e-shops to off er their customers pre-paid labels for the re-turn of their products free of charge.
70
-2.5% -2.2%
-3.9%
5.6% 5.4%6.3%
-6%
-4%
-2%
0%
2%
4%
6%
8%
2012 2013 2014
Parcels and express
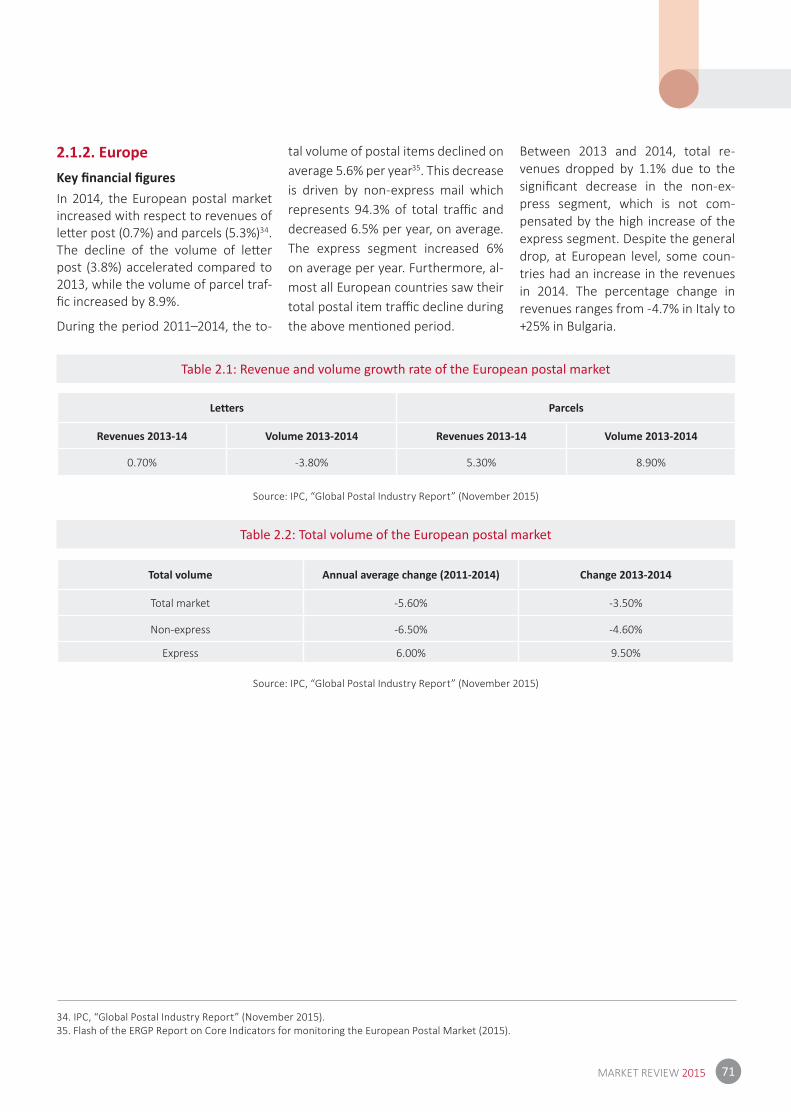
71MARKET REVIEW 2015
Source: IPC, “Global Postal Industry Report” (November 2015)
Source: IPC, “Global Postal Industry Report” (November 2015)
2.1.2. EuropeKey fi nancial fi guresIn 2014, the European postal market increased with respect to revenues of lett er post (0.7%) and parcels (5.3%)34. The decline of the volume of lett er post (3.8%) accelerated compared to 2013, while the volume of parcel traf-fi c increased by 8.9%.
During the period 2011–2014, the to-
tal volume of postal items declined on average 5.6% per year35. This decrease is driven by non-express mail which represents 94.3% of total traffi c and decreased 6.5% per year, on average. The express segment increased 6% on average per year. Furthermore, al-most all European countries saw their total postal item traffi c decline during the above menti oned period.
Between 2013 and 2014, total re-venues dropped by 1.1% due to the signifi cant decrease in the non-ex-press segment, which is not com-pensated by the high increase of the express segment. Despite the general drop, at European level, some coun-tries had an increase in the revenues in 2014. The percentage change in revenues ranges from -4.7% in Italy to +25% in Bulgaria.
Table 2.1: Revenue and volume growth rate of the European postal market
Table 2.2: Total volume of the European postal market
34. IPC, “Global Postal Industry Report” (November 2015).35. Flash of the ERGP Report on Core Indicators for monitoring the European Postal Market (2015).
Letters Parcels
Revenues 2013-14 Volume 2013-2014 Revenues 2013-14 Volume 2013-2014
0.70% -3.80% 5.30% 8.90%
Total volume Annual average change (2011-2014) Change 2013-2014
Total market -5.60% -3.50%
Non-express -6.50% -4.60%
Express 6.00% 9.50%
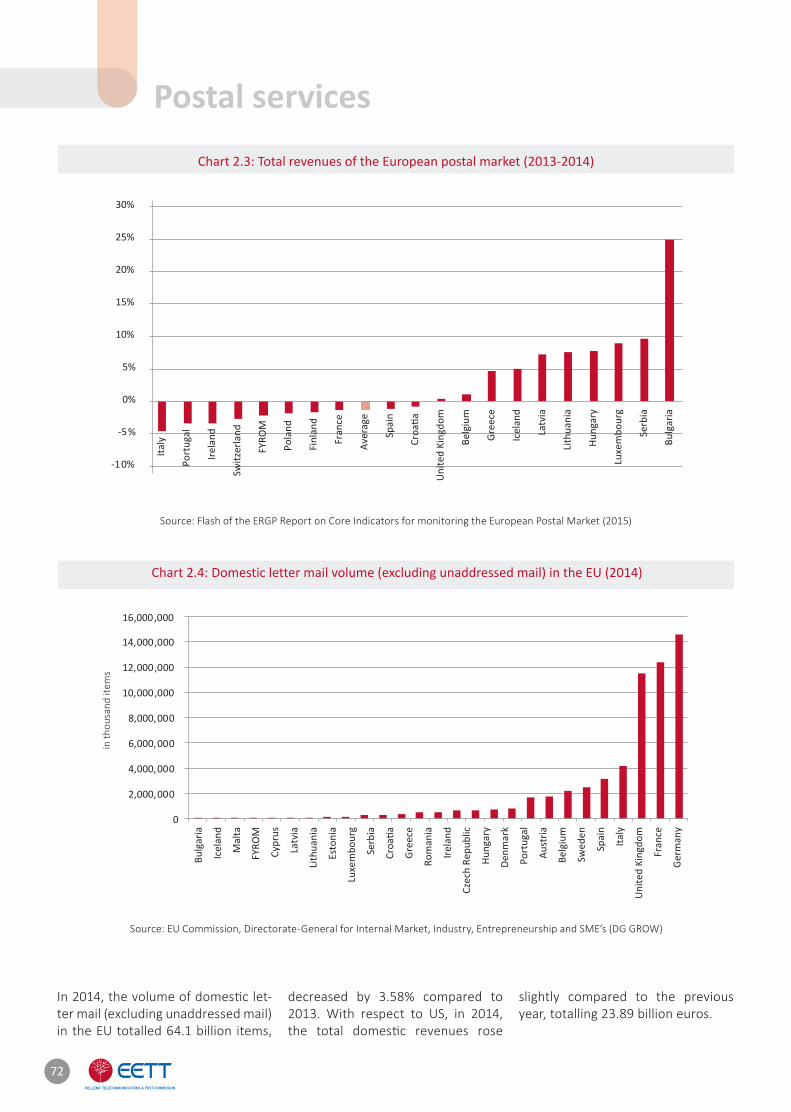
Chart 2.3: Total revenues of the European postal market (2013-2014)
Chart 2.4: Domestic letter mail volume (excluding unaddressed mail) in the EU (2014)
Source: Flash of the ERGP Report on Core Indicators for monitoring the European Postal Market (2015)
Source: EU Commission, Directorate-General for Internal Market, Industry, Entrepreneurship and SME’s (DG GROW)
in th
ousa
nd it
ems
In 2014, the volume of domesti c let-ter mail (excluding unaddressed mail) in the EU totalled 64.1 billion items,
decreased by 3.58% compared to 2013. With respect to US, in 2014, the total domesti c revenues rose
slightly compared to the previous year, totalling 23.89 billion euros.
Postal services
72
-10%
-5%
0%
5%
10%
15%
20%
25%
30%
0
2,000,000
4,000,000
6,000,000
8,000,000
10,000,000
12,000,000
14,000,000
16,000,000

73MARKET REVIEW 2015
Chart 2.5: Total domestic US revenue per country (2014)
Table 2.3: Herfindahl-Hirschman Index (HHI) (2013 & 2014)
Source: EU Commission, Directorate-General for Internal Market, Industry, Entrepreneurship and SME’s (DG GROW)
Source: Flash of the ERGP Report on Core Indicators for monitoring the European Postal Market (2015)
in m
illio
n eu
ros
HHI - Volumes HHI - Revenues
2013 2014 Trend 2013 2014 Trend
Austria 7,200 7,200 Stable 6,200 6,200 Stable
Belgium N/A N/A - 4,705 4,539 Decrease
Bulgaria N/A N/A - 5,691 5,230 Decrease
Croatia 5,424 5,196 Decrease 4,969 4,796 Decrease
Czech Republic 9,503 8,964 Decrease 8,978 7,692 Decrease
Estonia 5,243 5,244 Stable 3,372 3,312 Decrease
France 9,801 9,796 Decrease 9,707 9,607 Decrease
FYROM 8,998 8,694 Decrease 4,553 4,257 Decrease
Greece 7,648 6,871 Decrease 2,836 2,465 Decrease
Hungary 2,655 9,156 Increase 4,766 4,380 Decrease
Latvia 1,897 2,441 Increase 3,036 3,488 Increase
Lithuania 5,236 5,007 Decrease 2,263 2,544 Increase
Malta 9,600 9,500 Decrease 4,600 4,600 Stable
Portugal 8,977 8,942 Decrease 4,694 4,968 Decrease
Romania 4,783 3,578 Decrease N/A 1,226 -
Serbia 9,463 9,357 Decrease 4,603 4,518 Decrease
Slovakia 6,833 6,772 Decrease 3,209 3,125 Decrease
Spain 7,777 7,766 Decrease 8,465 8,490 Increase
Sweden 7,590 7,420 Decrease 8,640 8,560 Decrease
The Netherlands 6,678 N/A - 7,826 N/A -
United Kingdom 9,913 9,752 Decrease 9,236 9,126 Decrease
0
500
1,000
1,500
2,000
2,500
3,000
3,500
4,000
4,500

Competi ti on The European postal market is highly concentrated, as indicated by both the Herfi ndahl-Hirschman Index (HHI) and the number of postal operators with market share over 1%36. Between 2013 and 2014 however, the level of con-centrati on of the market decreased (or stabilised) in the majority of the coun-tries, both in terms of volumes and re-venues.
Despite the liberalizati on of the post-al market in the European countries, competi ti on levels sti ll remain very low, since 52% of postal items are han-dled by countries, where the compe-
ti ti on represents less than 5% of the market37. Countries with higher com-peti ti on levels handle 36% of postal items.
In 2014, the Universal Service Provi-ders (USPs) maintained a high market share in non-express mail (approxi-mately 87%), while in express mail their market share was signifi cantly lower, approximately around 16%.
The European parcel market is com-peti ti ve and characterized by a wide range of business models and owner-ship structures38. This market is served by a combinati on of integrators39 (such as UPS that purchased TNT, DHL and
FedEx), nati onal postal services provid-ers (i.e. Royal Mail, La Poste, Deutsche Post, bpost, Poste Italiane, Correos, PostNL), some of which are operati ng within European networks (DHL, DPD and GLS) and independent (mainly lo-cal) parcel delivery companies (i.e. UKMail, Yodel, MRW, BRT, TIPSA, Hermes). Furthermore, certain road transportati on networks (i.e. Eurodis, Net Express) are operati ng as partners among the nati onal postal services providers, thus enabling them to in-clude internati onal delivery in their service portf olios.
36. Flash of the ERGP Report on Core Indicators for monitoring the European Postal Market (2015).37. PostNL, “European postal markets, 2016 an overview” (February 2015).38. Apex Insight Ltd, “ European Parcels Market Insight Report 2016”.39. Integrators is a term used for companies that control an integrated air and road network for delivering small parcels within and out of Europe and are capable to provide the widest possible range of postal services.40. It should be noted that in 2015, competition in Greece reached 8% and that this would give our country the orange colour.
Chart 2.6: Postal market liberalization in Europe (2015)40
Source: PostNL, “European postal markets, 2016 an overview” (February 2015)
Postal services
74
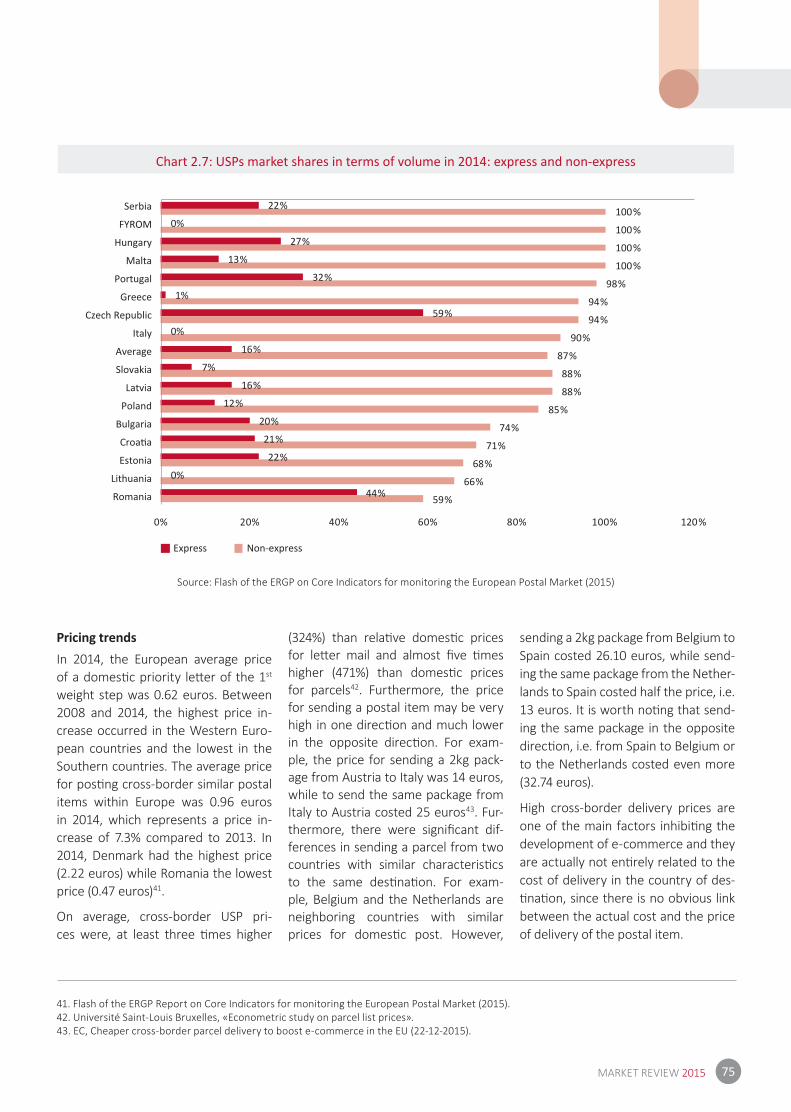
75MARKET REVIEW 2015
41. Flash of the ERGP Report on Core Indicators for monitoring the European Postal Market (2015).42. Université Saint-Louis Bruxelles, «Econometric study on parcel list prices».43. EC, Cheaper cross-border parcel delivery to boost e-commerce in the EU (22-12-2015).
Source: Flash of the ERGP on Core Indicators for monitoring the European Postal Market (2015)
Chart 2.7: USPs market shares in terms of volume in 2014: express and non-express
Pricing trendsIn 2014, the European average price of a domesti c priority lett er of the 1st
weight step was 0.62 euros. Between 2008 and 2014, the highest price in-crease occurred in the Western Euro-pean countries and the lowest in the Southern countries. The average price for posti ng cross-border similar postal items within Europe was 0.96 euros in 2014, which represents a price in-crease of 7.3% compared to 2013. In 2014, Denmark had the highest price (2.22 euros) while Romania the lowest price (0.47 euros)41.
On average, cross-border USP pri-ces were, at least three ti mes higher
(324%) than relati ve domesti c prices for lett er mail and almost fi ve ti mes higher (471%) than domesti c prices for parcels42. Furthermore, the price for sending a postal item may be very high in one directi on and much lower in the opposite directi on. For exam-ple, the price for sending a 2kg pack-age from Austria to Italy was 14 euros, while to send the same package from Italy to Austria costed 25 euros43. Fur-thermore, there were signifi cant dif-ferences in sending a parcel from two countries with similar characteristi cs to the same desti nati on. For exam-ple, Belgium and the Netherlands are neighboring countries with similar prices for domesti c post. However,
sending a 2kg package from Belgium to Spain costed 26.10 euros, while send-ing the same package from the Nether-lands to Spain costed half the price, i.e. 13 euros. It is worth noti ng that send-ing the same package in the opposite directi on, i.e. from Spain to Belgium or to the Netherlands costed even more (32.74 euros).
High cross-border delivery prices are one of the main factors inhibiti ng the development of e-commerce and they are actually not enti rely related to the cost of delivery in the country of des-ti nati on, since there is no obvious link between the actual cost and the price of delivery of the postal item.
22%
0%
27%
13%
32%
1%
59%
0%
16%
7%
16%
12%
20%
21%
22%
0%
44%
100%
100%
100%
100%
98%
94%
94%
90%
87%
88%
88%
85%
74%
71%
68%
66%
59%
120%
Express Non-express
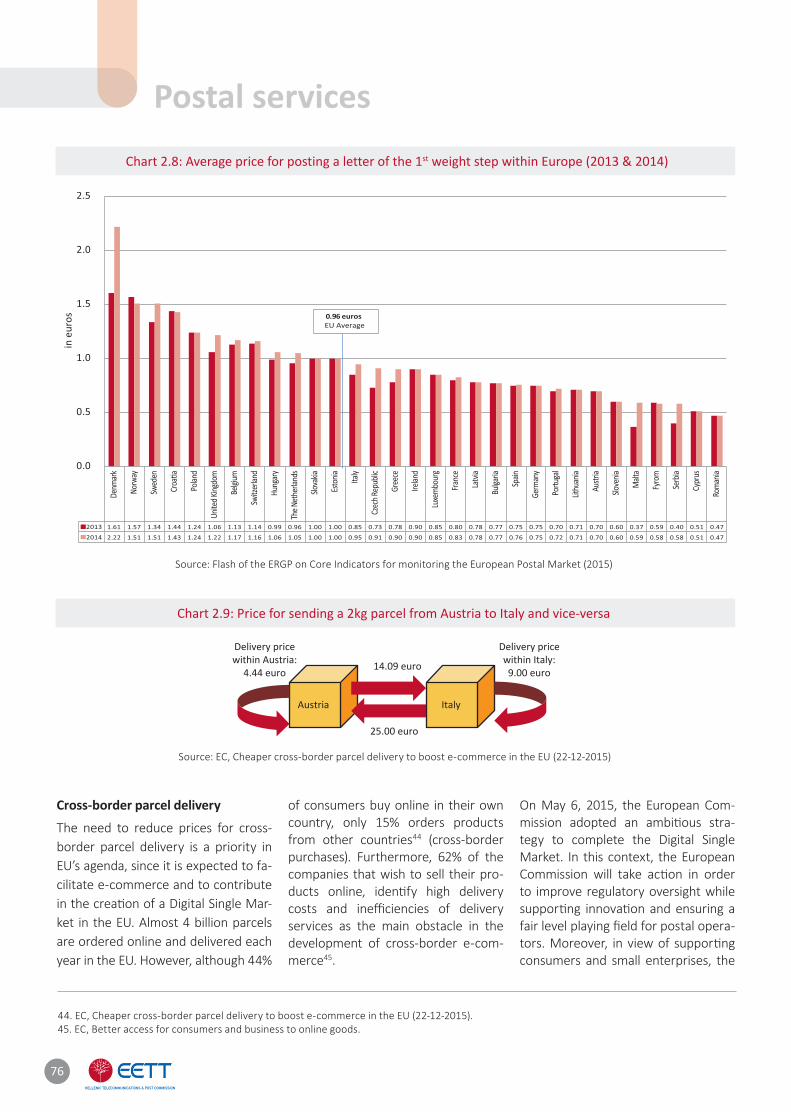
Chart 2.8: Average price for posting a letter of the 1st weight step within Europe (2013 & 2014)
Chart 2.9: Price for sending a 2kg parcel from Austria to Italy and vice-versa
Source: Flash of the ERGP on Core Indicators for monitoring the European Postal Market (2015)
Source: EC, Cheaper cross-border parcel delivery to boost e-commerce in the EU (22-12-2015)
Cross-border parcel delivery
The need to reduce prices for cross-border parcel delivery is a priority in EU’s agenda, since it is expected to fa-cilitate e-commerce and to contribute in the creati on of a Digital Single Mar-ket in the EU. Almost 4 billion parcels are ordered online and delivered each year in the EU. However, although 44%
of consumers buy online in their own country, only 15% orders products from other countries44 (cross-border purchases). Furthermore, 62% of the companies that wish to sell their pro-ducts online, identi fy high delivery costs and ineffi ciencies of delivery services as the main obstacle in the development of cross-border e-com-merce45.
On May 6, 2015, the European Com-mission adopted an ambiti ous stra-tegy to complete the Digital Single Market. In this context, the European Commission will take acti on in order to improve regulatory oversight while supporti ng innovati on and ensuring a fair level playing fi eld for postal opera-tors. Moreover, in view of supporti ng consumers and small enterprises, the
44. EC, Cheaper cross-border parcel delivery to boost e-commerce in the EU (22-12-2015).45. EC, Better access for consumers and business to online goods.
Postal services
76
Austria Italy
14.09 euro
25.00 euro
Delivery pricewithin Austria:
4.44 euro
Delivery pricewithin Italy:
9.00 euro
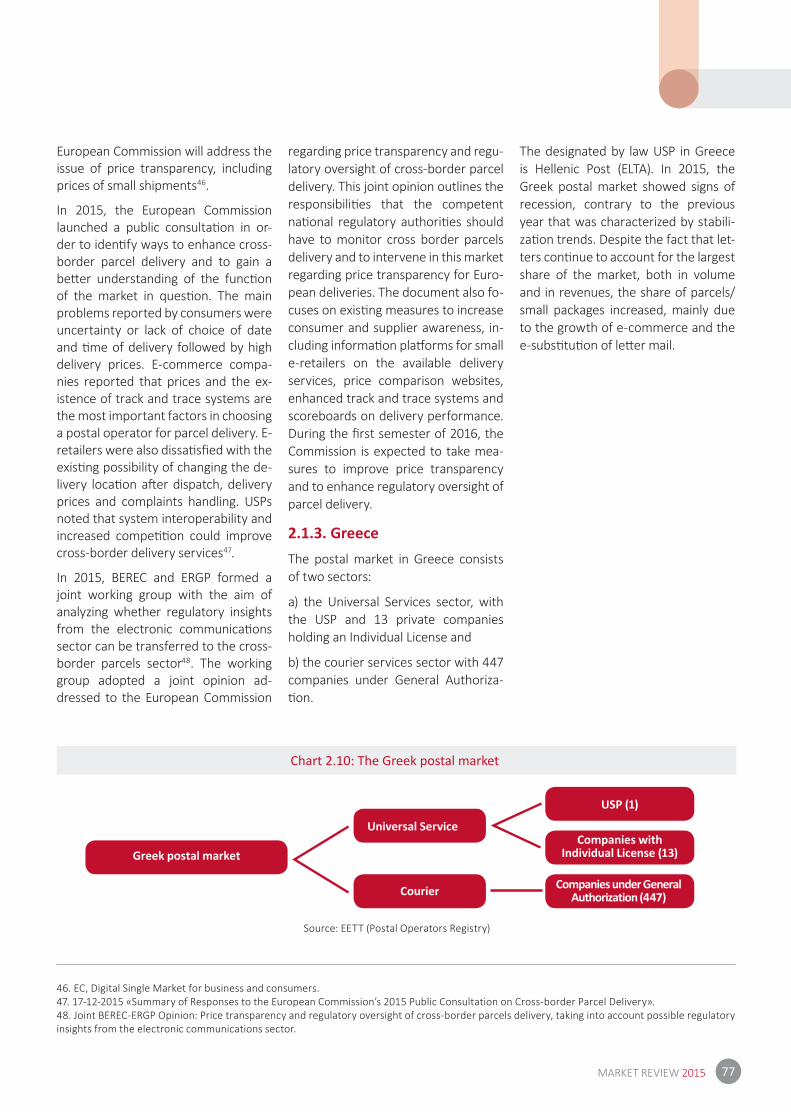
77MARKET REVIEW 2015
46. EC, Digital Single Market for business and consumers.47. 17-12-2015 «Summary of Responses to the European Commission’s 2015 Public Consultation on Cross-border Parcel Delivery».48. Joint BEREC-ERGP Opinion: Price transparency and regulatory oversight of cross-border parcels delivery, taking into account possible regulatory insights from the electronic communications sector.
European Commission will address the issue of price transparency, including prices of small shipments46.
In 2015, the European Commission launched a public consultati on in or-der to identi fy ways to enhance cross-border parcel delivery and to gain a bett er understanding of the functi on of the market in questi on. The main problems reported by consumers were uncertainty or lack of choice of date and ti me of delivery followed by high delivery prices. E-commerce compa-nies reported that prices and the ex-istence of track and trace systems are the most important factors in choosing a postal operator for parcel delivery. E-retailers were also dissati sfi ed with the existi ng possibility of changing the de-livery locati on aft er dispatch, delivery prices and complaints handling. USPs noted that system interoperability and increased competi ti on could improve cross-border delivery services47.
In 2015, BEREC and ERGP formed a joint working group with the aim of analyzing whether regulatory insights from the electronic communicati ons sector can be transferred to the cross-border parcels sector48. The working group adopted a joint opinion ad-dressed to the European Commission
regarding price transparency and regu-latory oversight of cross-border parcel delivery. This joint opinion outlines the responsibiliti es that the competent nati onal regulatory authoriti es should have to monitor cross border parcels delivery and to intervene in this market regarding price transparency for Euro-pean deliveries. The document also fo-cuses on existi ng measures to increase consumer and supplier awareness, in-cluding informati on platf orms for small e-retailers on the available delivery services, price comparison websites, enhanced track and trace systems and scoreboards on delivery performance. During the fi rst semester of 2016, the Commission is expected to take mea-sures to improve price transparency and to enhance regulatory oversight of parcel delivery.
2.1.3. GreeceThe postal market in Greece consists of two sectors:
a) the Universal Services sector, with the USP and 13 private companies holding an Individual License and
b) the courier services sector with 447 companies under General Authoriza-ti on.
The designated by law USP in Greece is Hellenic Post (ELTA). In 2015, the Greek postal market showed signs of recession, contrary to the previous year that was characterized by stabili-zati on trends. Despite the fact that let-ters conti nue to account for the largest share of the market, both in volume and in revenues, the share of parcels/small packages increased, mainly due to the growth of e-commerce and the e-substi tuti on of lett er mail.
Chart 2.10: The Greek postal market
Source: EETT (Postal Operators Registry)
Greek postal market
Universal Service
Courier
USP (1)
Companies with Individual License (13)
Companies under General Authorization (447)

2.2. Evoluti on of the key fi -nancial fi gures in the postal services market
2.2.1. Financial data from the published fi nancial statements The following secti on presents the key fi nancial fi gures of the companies operati ng in the postal market, ac-cording to the fi nancial statements of the licensed operators in 2015. With respect to Universal Service, in addi-ti on to the US, in 2015 seven other companies with Individual License were acti ve, three of which operated exclusively in the fi eld of postal servi-ces. Given, however, that these three companies operate mainly in the courier sector rather than in the US sector, the fi nancial analysis of their consolidated statements is classifi ed in the courier sector. With respect to companies under General Authorisa-ti on, the fi gures provided in this report have been based on the largest com-
panies of the sector, as the majority of the courier companies are not obliged to publish fi nancial statements, since they are sole proprietorship.
Turnover
The postal market followed the same negati ve trend, which is prevalent in almost all sectors of the economy, de-spite the stabilizati on of the previous year, as shown in Chart 2.11.
Chart 2.12 demonstrates the postal market turnover. In 2015, the turn-over of postal companies under Ge-neral Authorizati on decreased by 8% compared to the previous year, while the USP’s turnover decreased by 4%.
It should be noted that the turnover of these companies may include en-tries from non postal acti viti es. Con-sequently, there are diff erences in the revenues presented in detail in the following paragraphs and that are exclusively derived from postal acti vi-ti es.
Profi tability
Table 2.4 presents the key fi nancials concerning the postal service provi-ders’ profi tability. It is clear that de-spite the increased turnover, the gross profi t margin was relati vely low for postal operators, and especially for the USP.
Balance sheet analysis
Chart 2.13 presents assets allocati on for the USP and companies under General Authorizati on. The latt er hold the majority of their capital (85%) in liquid assets (current assets), while the USP hold 59% of its capital in cur-rent assets and the remaining 41% in fi xed assets.
Chart 2.11: Evolution of the postal market turnover index (base year 2010)
Source: HELLASTAT, Evolution of the turnover index in the service sector (September 2016)
Postal services
78
95.6
80.9 77.9 77.9 75.3
0
50
100
150
2011 2012 2013 2014 2015
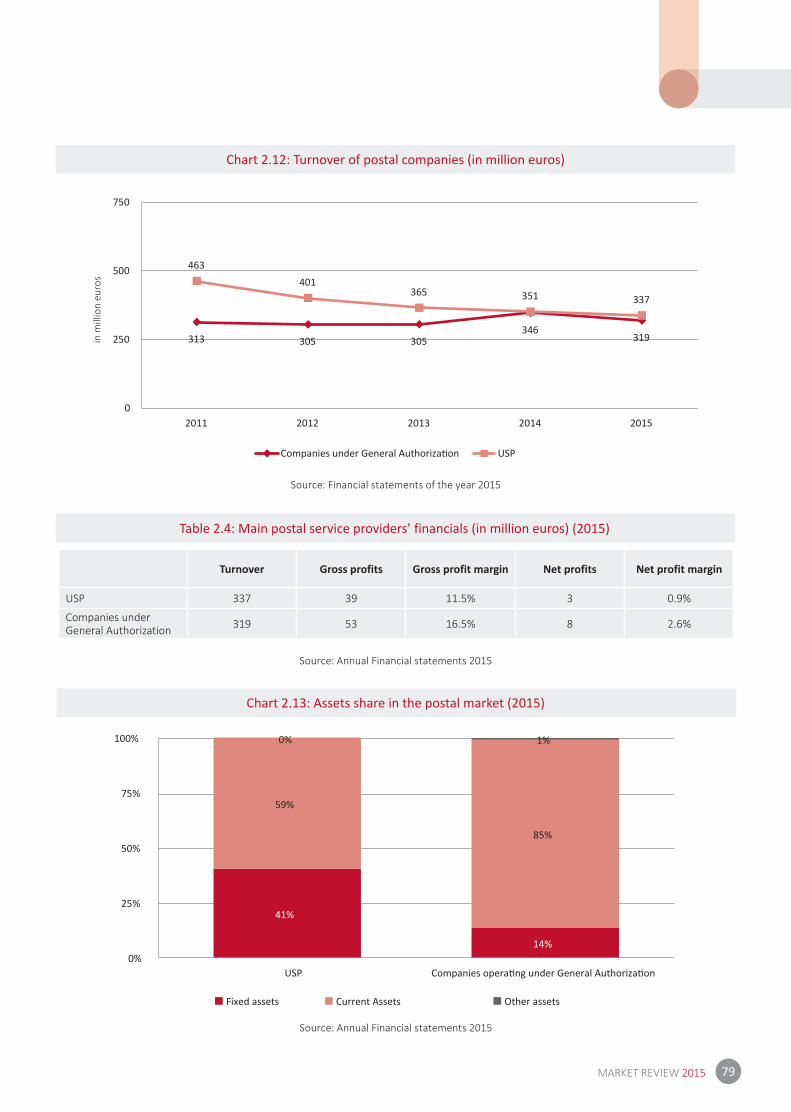
79MARKET REVIEW 2015
Chart 2.12: Turnover of postal companies (in million euros)
Table 2.4: Main postal service providers’ financials (in million euros) (2015)
Chart 2.13: Assets share in the postal market (2015)
Source: Financial statements of the year 2015
Source: Annual Financial statements 2015
Source: Annual Financial statements 2015
Turnover Gross profits Gross profit margin Net profits Net profit margin
USP 337 39 11.5% 3 0.9%
Companies under General Authorization 319 53 16.5% 8 2.6%
313 305 305346
319
463401
365 351 337
0
250
500
750
2011 2012 2013 2014 2015
USP
41%
14%
59%
85%
0% 1%
0%
25%
50%
75%
100%
USP
Fixed assets Current Assets Other assets
in m
illio
n eu
ros
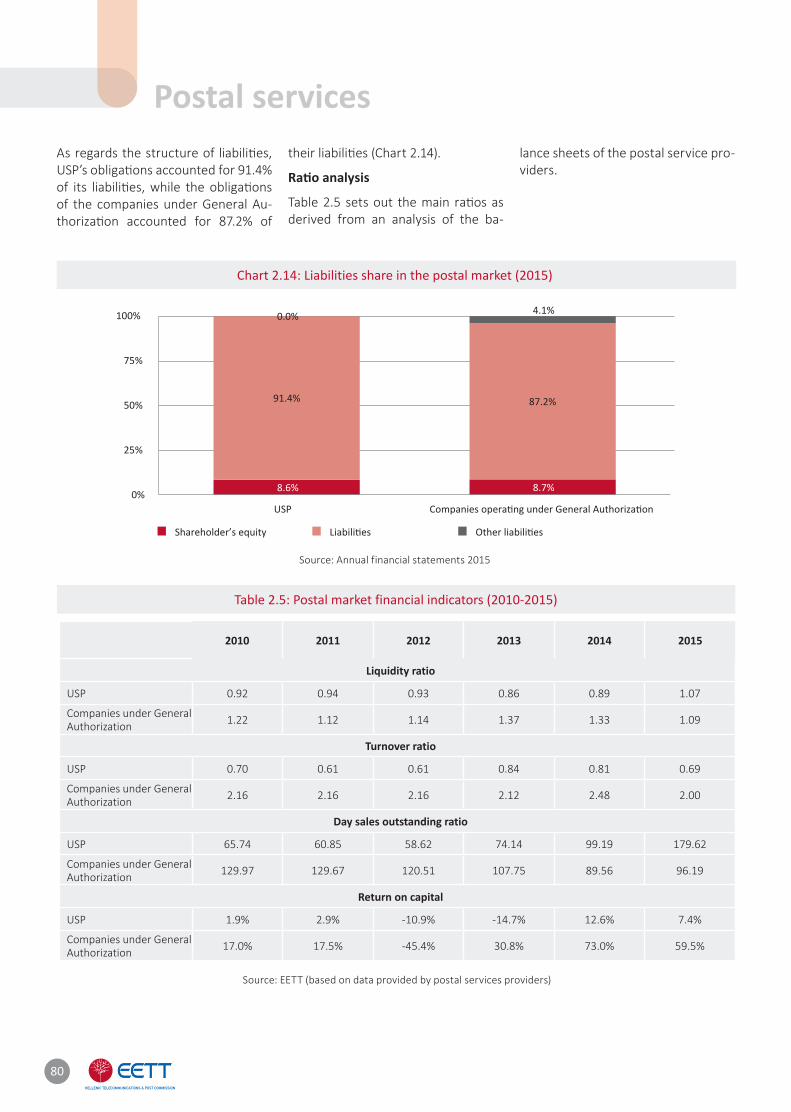
As regards the structure of liabiliti es, USP’s obligati ons accounted for 91.4% of its liabiliti es, while the obligati ons of the companies under General Au-thorizati on accounted for 87.2% of
their liabiliti es (Chart 2.14).
Rati o analysis
Table 2.5 sets out the main rati os as derived from an analysis of the ba-
lance sheets of the postal service pro-viders.
Chart 2.14: Liabilities share in the postal market (2015)
Table 2.5: Postal market financial indicators (2010-2015)
Source: Annual financial statements 2015
Source: EETT (based on data provided by postal services providers)
Postal services
2010 2011 2012 2013 2014 2015
Liquidity ratio
USP 0.92 0.94 0.93 0.86 0.89 1.07
Companies under General Authorization 1.22 1.12 1.14 1.37 1.33 1.09
Turnover ratio
USP 0.70 0.61 0.61 0.84 0.81 0.69
Companies under General Authorization 2.16 2.16 2.16 2.12 2.48 2.00
Day sales outstanding ratio
USP 65.74 60.85 58.62 74.14 99.19 179.62
Companies under General Authorization 129.97 129.67 120.51 107.75 89.56 96.19
Return on capital
USP 1.9% 2.9% -10.9% -14.7% 12.6% 7.4%
Companies under General Authorization 17.0% 17.5% -45.4% 30.8% 73.0% 59.5%
80
8.6% 8.7%
91.4% 87.2%
0.0% 4.1%
0%
25%
50%
75%
100%
USP
Shareholder’s equity
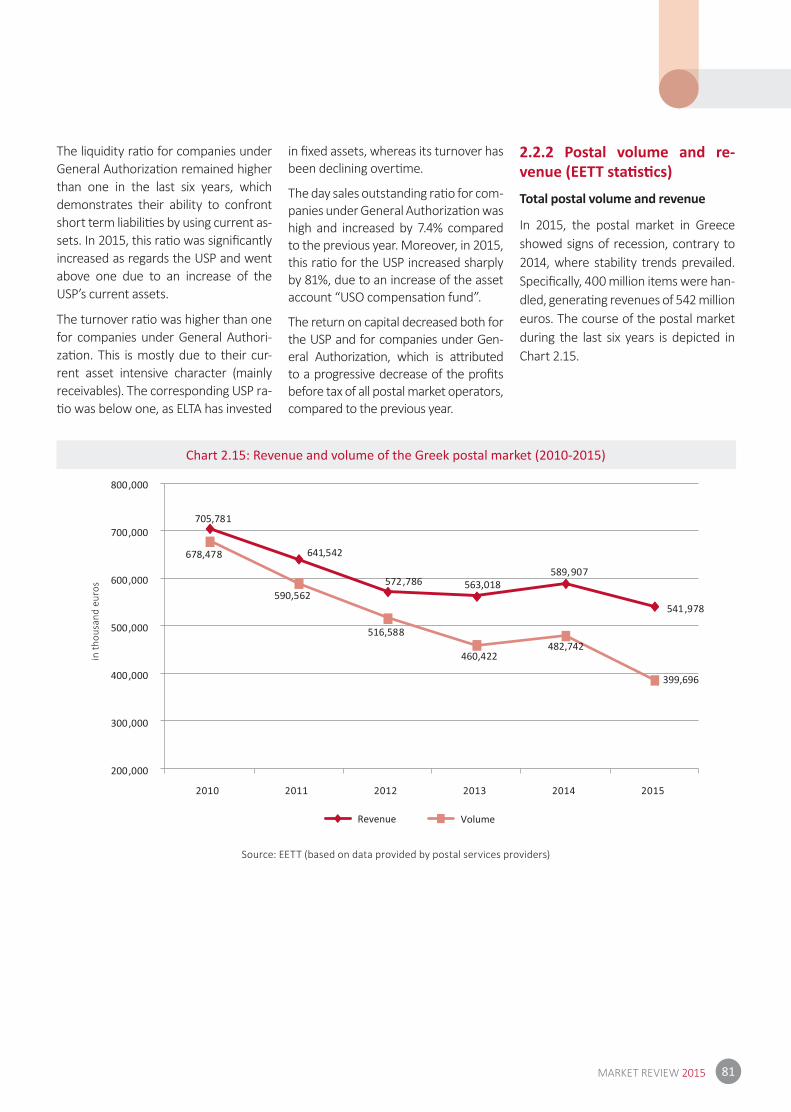
81MARKET REVIEW 2015
Chart 2.15: Revenue and volume of the Greek postal market (2010-2015)
Source: EETT (based on data provided by postal services providers)
The liquidity rati o for companies under General Authorizati on remained higher than one in the last six years, which demonstrates their ability to confront short term liabiliti es by using current as-sets. In 2015, this rati o was signifi cantly increased as regards the USP and went above one due to an increase of the USP’s current assets.
The turnover rati o was higher than one for companies under General Authori-zati on. This is mostly due to their cur-rent asset intensive character (mainly receivables). The corresponding USP ra-ti o was below one, as ELTA has invested
in fi xed assets, whereas its turnover has been declining overti me.
The day sales outstanding rati o for com-panies under General Authorizati on was high and increased by 7.4% compared to the previous year. Moreover, in 2015, this rati o for the USP increased sharply by 81%, due to an increase of the asset account “USO compensati on fund”.
The return on capital decreased both for the USP and for companies under Gen-eral Authorizati on, which is att ributed to a progressive decrease of the profi ts before tax of all postal market operators, compared to the previous year.
2.2.2 Postal volume and re-venue (EETT stati sti cs)
Total postal volume and revenue
In 2015, the postal market in Greece showed signs of recession, contrary to 2014, where stability trends prevailed. Specifi cally, 400 million items were han-dled, generati ng revenues of 542 million euros. The course of the postal market during the last six years is depicted in Chart 2.15.
705,781
641,542
572,786 563,018589,907
541,978
678,478
590,562
516,588
460,422482,742
399,696
200,000
300,000
400,000
500,000
600,000
700,000
800,000
Revenue Volume
in th
ousa
nd e
uros
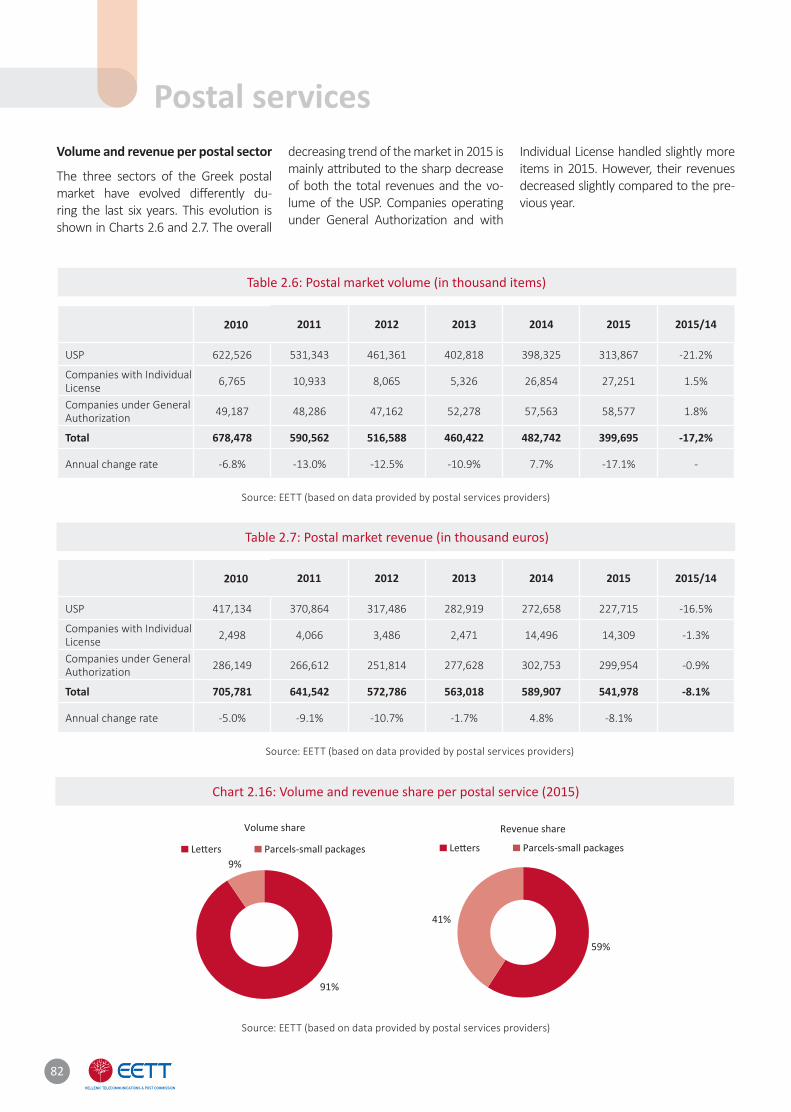
Table 2.6: Postal market volume (in thousand items)
Chart 2.16: Volume and revenue share per postal service (2015)
Table 2.7: Postal market revenue (in thousand euros)
Source: EETT (based on data provided by postal services providers)
Source: EETT (based on data provided by postal services providers)
Source: EETT (based on data provided by postal services providers)
Volume and revenue per postal sector
The three sectors of the Greek postal market have evolved diff erently du-ring the last six years. This evoluti on is shown in Charts 2.6 and 2.7. The overall
decrea sing trend of the market in 2015 is mainly att ributed to the sharp decrease of both the total revenues and the vo-lume of the USP. Companies operati ng under Ge neral Authorizati on and with
Individual License handled slightly more items in 2015. However, their revenues decreased slightly compared to the pre-vious year.
Postal services
2010 2011 2012 2013 2014 2015 2015/14
USP 622,526 531,343 461,361 402,818 398,325 313,867 -21.2%
Companies with Individual License 6,765 10,933 8,065 5,326 26,854 27,251 1.5%
Companies under General Authorization 49,187 48,286 47,162 52,278 57,563 58,577 1.8%
Total 678,478 590,562 516,588 460,422 482,742 399,695 -17,2%
Annual change rate -6.8% -13.0% -12.5% -10.9% 7.7% -17.1% -
2010 2011 2012 2013 2014 2015 2015/14
USP 417,134 370,864 317,486 282,919 272,658 227,715 -16.5%
Companies with Individual License 2,498 4,066 3,486 2,471 14,496 14,309 -1.3%
Companies under General Authorization 286,149 266,612 251,814 277,628 302,753 299,954 -0.9%
Total 705,781 641,542 572,786 563,018 589,907 541,978 -8.1%
Annual change rate -5.0% -9.1% -10.7% -1.7% 4.8% -8.1%
82
91%
9%
59%
41%
Volume share
Parcels-small packages Parcels-small packages
Revenue share
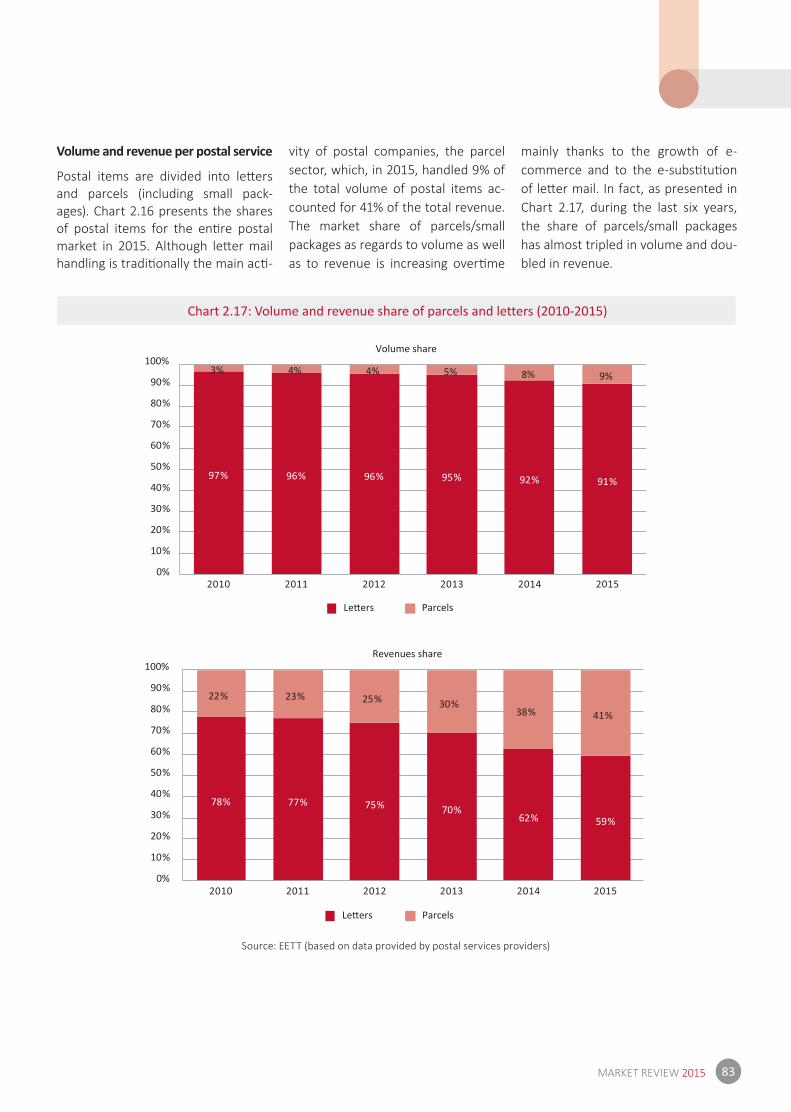
83MARKET REVIEW 2015
Chart 2.17: Volume and revenue share of parcels and letters (2010-2015)
Source: EETT (based on data provided by postal services providers)
Volume and revenue per postal service
Postal items are divided into lett ers and parcels (including small pack-ages). Chart 2.16 presents the shares of postal items for the enti re postal market in 2015. Although lett er mail handling is traditi onally the main acti -
vity of postal companies, the parcel sector, which, in 2015, handled 9% of the total volume of postal items ac-counted for 41% of the total revenue. The market share of parcels/small packages as regards to volume as well as to revenue is increasing overti me
mainly thanks to the growth of e-commerce and to the e-substi tuti on of lett er mail. In fact, as presented in Chart 2.17, during the last six years, the share of parcels/small packages has almost tripled in volume and dou-bled in revenue.
97% 96% 96% 95% 92% 91%
3% 4% 4% 5% 8% 9%
Volume share
Parcels
78% 77% 75% 70%62% 59%
22% 23% 25% 30%38% 41%
Revenues share
Parcels
0%
10%
20%
30%
40%
50%
60%
70%
80%
90%
100%
0%
10%
20%
30%
40%
50%
60%
70%
80%
90%
100%
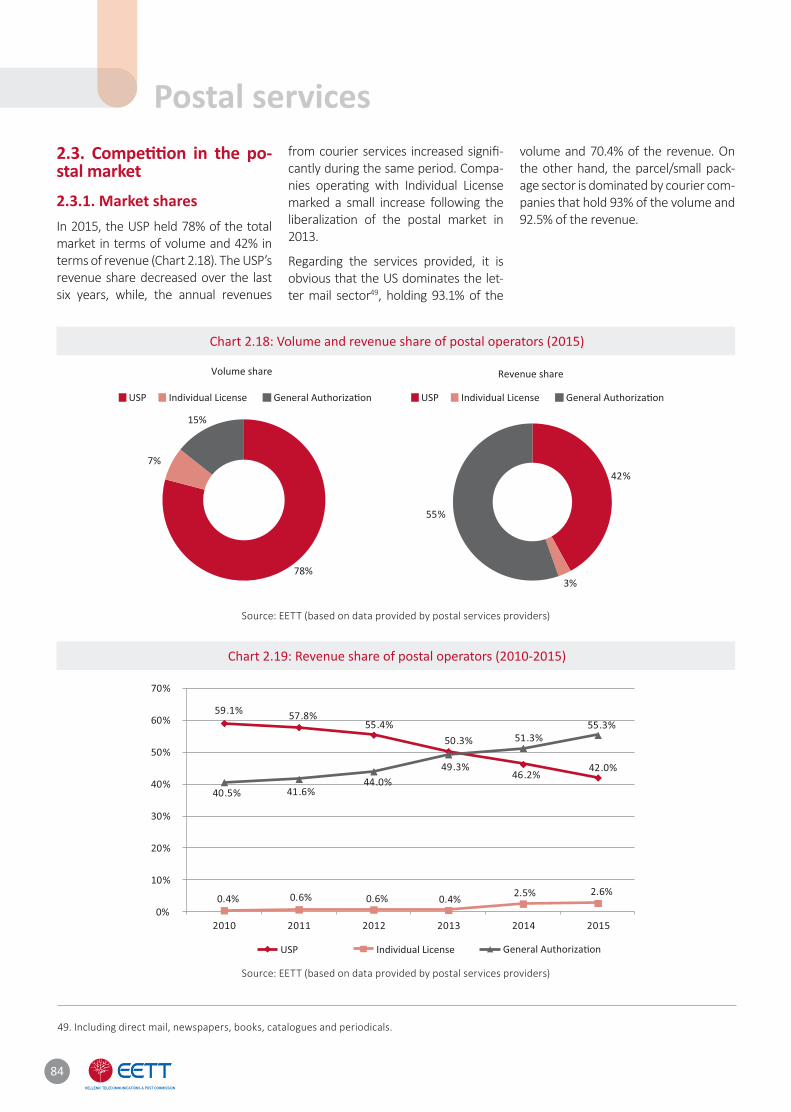
2.3. Competi ti on in the po-stal market 2.3.1. Market sharesIn 2015, the USP held 78% of the total market in terms of volume and 42% in terms of revenue (Chart 2.18). The USP’s revenue share decreased over the last six years, while, the annual revenues
from courier services increased signifi -cantly during the same period. Compa-nies operati ng with Individual License marked a small increase following the liberalizati on of the postal market in 2013.
Regarding the services provided, it is obvious that the US dominates the let-ter mail sector49, holding 93.1% of the
volume and 70.4% of the revenue. On the other hand, the parcel/small pack-age sector is dominated by courier com-panies that hold 93% of the volume and 92.5% of the revenue.
Chart 2.18: Volume and revenue share of postal operators (2015)
Chart 2.19: Revenue share of postal operators (2010-2015)
Source: EETT (based on data provided by postal services providers)
Source: EETT (based on data provided by postal services providers)
49. Including direct mail, newspapers, books, catalogues and periodicals.
Postal services
84
eRevenue shar
%55
3%
%42
Individual License PUSIndividual License USP
eVolume shar
7%
15%
78%
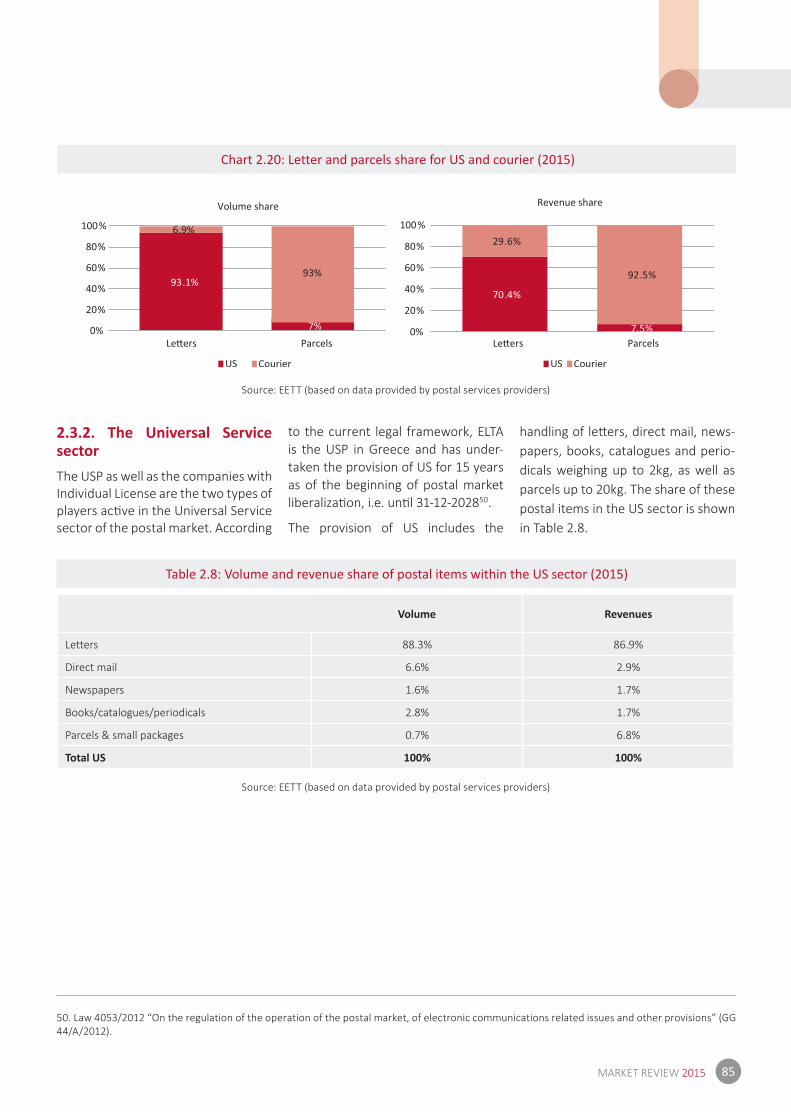
85MARKET REVIEW 2015
Chart 2.20: Letter and parcels share for US and courier (2015)
Table 2.8: Volume and revenue share of postal items within the US sector (2015)
Source: EETT (based on data provided by postal services providers)
Source: EETT (based on data provided by postal services providers)
50. Law 4053/2012 “On the regulation of the operation of the postal market, of electronic communications related issues and other provisions” (GG 44/A/2012).
2.3.2. The Universal Service sectorThe USP as well as the companies with Individual License are the two types of players acti ve in the Universal Service sector of the postal market. According
to the current legal framework, ELTA is the USP in Greece and has under-taken the provision of US for 15 years as of the beginning of postal market liberalizati on, i.e. unti l 31-12-202850.
The provision of US includes the
hand ling of lett ers, direct mail, news-papers, books, catalogues and perio-dicals weighing up to 2kg, as well as parcels up to 20kg. The share of these postal items in the US sector is shown in Table 2.8.
Volume Revenues
Letters 88.3% 86.9%
Direct mail 6.6% 2.9%
Newspapers 1.6% 1.7%
Books/catalogues/periodicals 2.8% 1.7%
Parcels & small packages 0.7% 6.8%
Total US 100% 100%
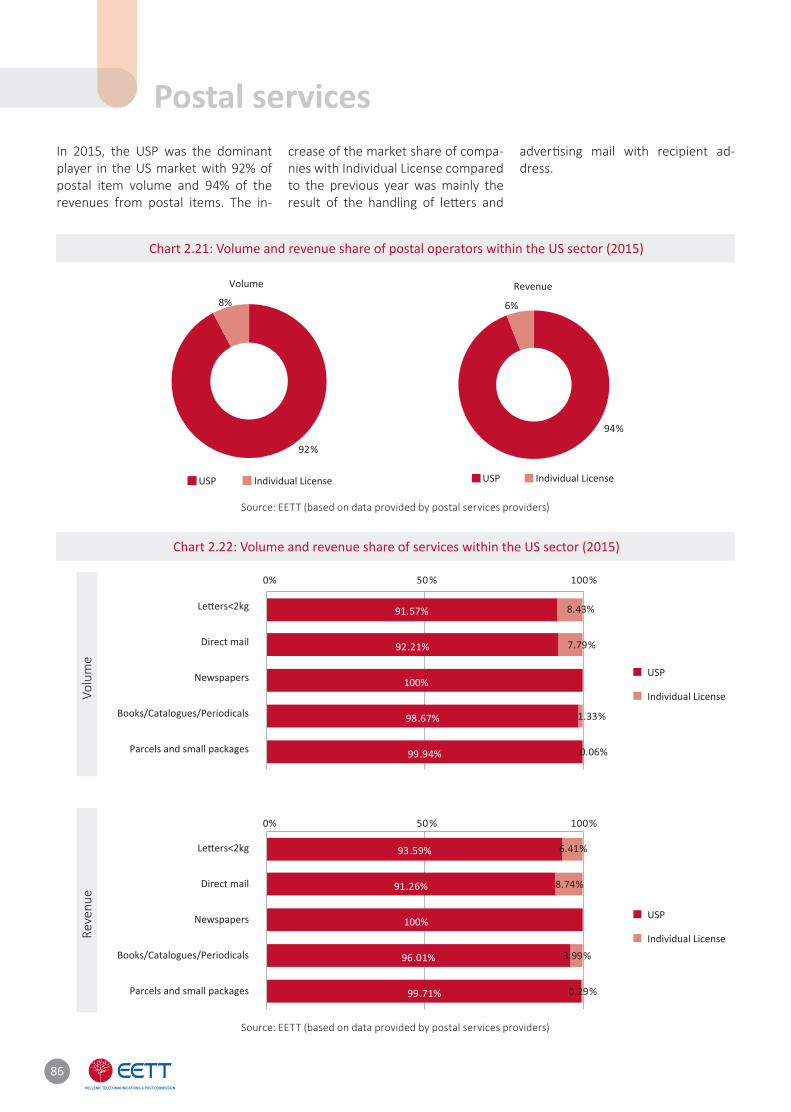
In 2015, the USP was the dominant player in the US market with 92% of postal item volume and 94% of the revenues from postal items. The in-
crease of the market share of compa-nies with Individual License compared to the previous year was mainly the result of the handling of lett ers and
adverti sing mail with recipient ad-dress.
Chart 2.21: Volume and revenue share of postal operators within the US sector (2015)
Chart 2.22: Volume and revenue share of services within the US sector (2015)
Source: EETT (based on data provided by postal services providers)
Source: EETT (based on data provided by postal services providers)
Postal servicesRe
venu
eVo
lum
e
86
92%
8%
Volume
USP Individual License
94%
6%
Revenue
USP Individual License
USP
Individual License
USP
Individual License
93.59%
91.26%
100%
96.01%
99.71%
6.41%
8.74%
3.99%
0.29%
91.57%
92.21%
100%
98.67%
99.94%
8.43%
7.79%
1.33%
0.06%
Direct mail
Newspapers
Books/Catalogues/Periodicals
Parcels and small packages
Direct mail
Newspapers
Books/Catalogues/Periodicals
Parcels and small packages
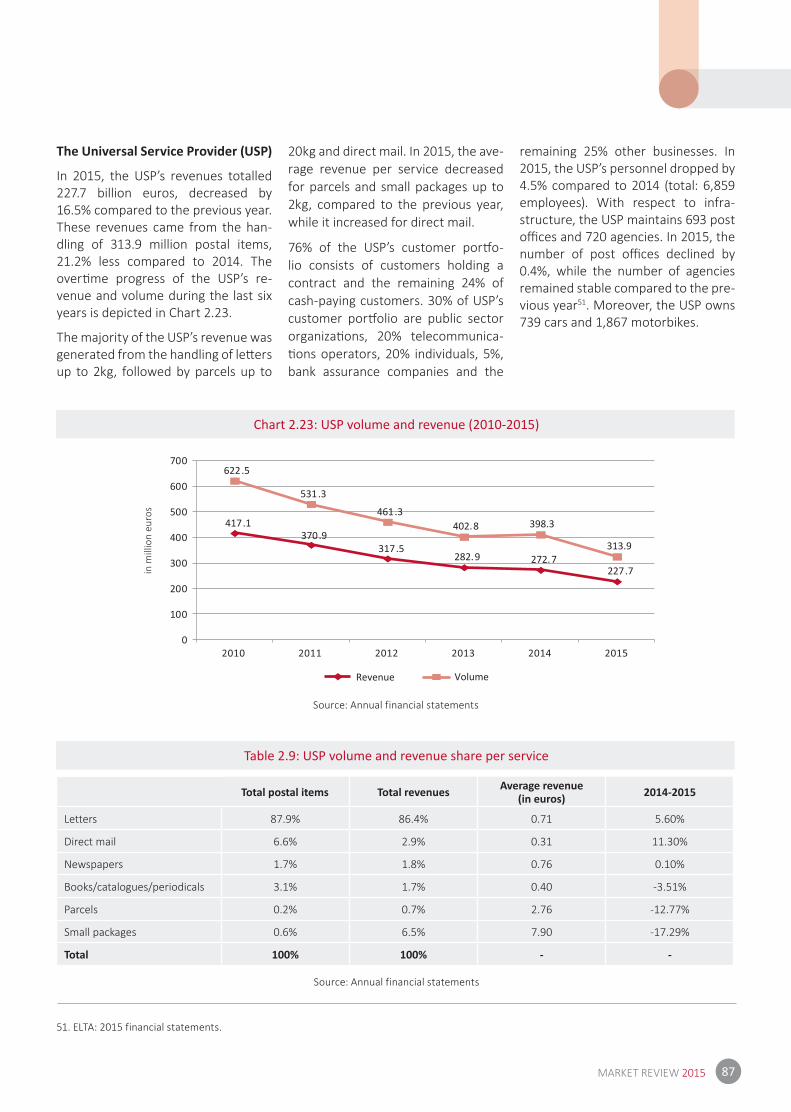
87MARKET REVIEW 2015
Chart 2.23: USP volume and revenue (2010-2015)
Table 2.9: USP volume and revenue share per service
Source: Annual financial statements
Source: Annual financial statements
The Universal Service Provider (USP)
In 2015, the USP’s revenues totalled 227.7 billion euros, decreased by 16.5% compared to the previous year. These revenues came from the han-dling of 313.9 million postal items, 21.2% less compared to 2014. The overti me progress of the USP’s re-venue and volume during the last six years is depicted in Chart 2.23.
The majority of the USP’s revenue was generated from the handling of lett ers up to 2kg, followed by parcels up to
20kg and direct mail. In 2015, the ave-rage revenue per service decreased for parcels and small packages up to 2kg, compared to the previous year, while it increased for direct mail.
76% of the USP’s customer portf o-lio consists of customers holding a contract and the remaining 24% of cash-paying customers. 30% of USP’s customer portf olio are public sector organizati ons, 20% telecommunica-ti ons operators, 20% individuals, 5%, bank assurance companies and the
remaining 25% other businesses. In 2015, the USP’s personnel dropped by 4.5% compared to 2014 (total: 6,859 employees). With respect to infra-structure, the USP maintains 693 post offi ces and 720 agencies. In 2015, the number of post offi ces declined by 0.4%, while the number of agencies remained stable compared to the pre-vious year51. Moreover, the USP owns 739 cars and 1,867 motorbikes.
51. ELTA: 2015 financial statements.
Total postal items Total revenues Average revenue(in euros) 2014-2015
Letters 87.9% 86.4% 0.71 5.60%
Direct mail 6.6% 2.9% 0.31 11.30%
Newspapers 1.7% 1.8% 0.76 0.10%
Books/catalogues/periodicals 3.1% 1.7% 0.40 -3.51%
Parcels 0.2% 0.7% 2.76 -12.77%
Small packages 0.6% 6.5% 7.90 -17.29%
Total 100% 100% - -
417.1370.9
317.5282.9 272.7
227.7
622.5
531.3
461.3402.8 398.3
313.9
0
100
200
300
400
500
600
700
Revenue Volume
in m
illio
n eu
ros
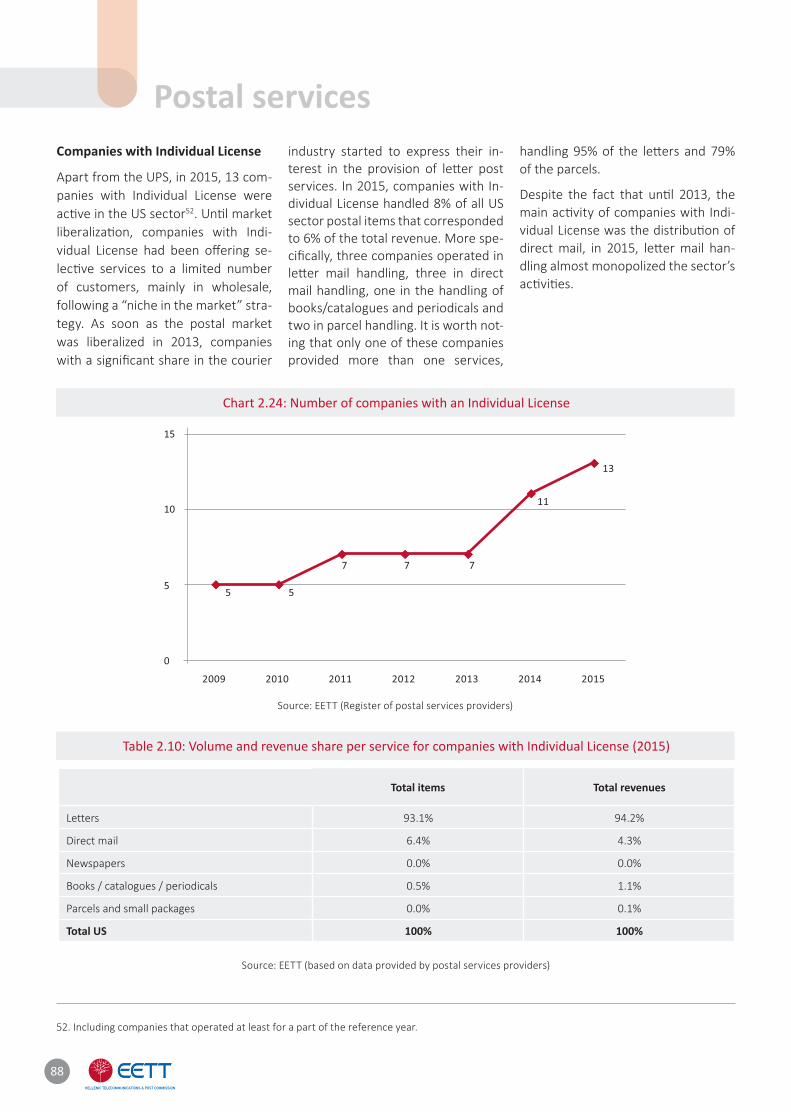
Companies with Individual License
Apart from the UPS, in 2015, 13 com-panies with Individual License were acti ve in the US sector52. Unti l market liberalizati on, companies with Indi-vidual License had been off ering se-lecti ve services to a limited number of customers, mainly in wholesale, following a “niche in the market” stra-tegy. As soon as the postal market was liberalized in 2013, companies with a signifi cant share in the courier
industry started to express their in-terest in the provision of lett er post services. In 2015, companies with In-dividual License handled 8% of all US sector postal items that corresponded to 6% of the total revenue. More spe-cifi cally, three companies operated in lett er mail handling, three in direct mail handling, one in the handling of books/catalogues and periodicals and two in parcel handling. It is worth not-ing that only one of these companies provided more than one services,
handling 95% of the lett ers and 79% of the parcels.
Despite the fact that unti l 2013, the main acti vity of companies with Indi-vidual License was the distributi on of direct mail, in 2015, lett er mail han-dling almost monopolized the sector’s acti viti es.
Chart 2.24: Number of companies with an Individual License
Table 2.10: Volume and revenue share per service for companies with Individual License (2015)
Source: EETT (Register of postal services providers)
Source: ΕΕΤΤ (based on data provided by postal services providers)
52. Including companies that operated at least for a part of the reference year.
Postal services
Total items Total revenues
Letters 93.1% 94.2%
Direct mail 6.4% 4.3%
Newspapers 0.0% 0.0%
Books / catalogues / periodicals 0.5% 1.1%
Parcels and small packages 0.0% 0.1%
Total US 100% 100%
88
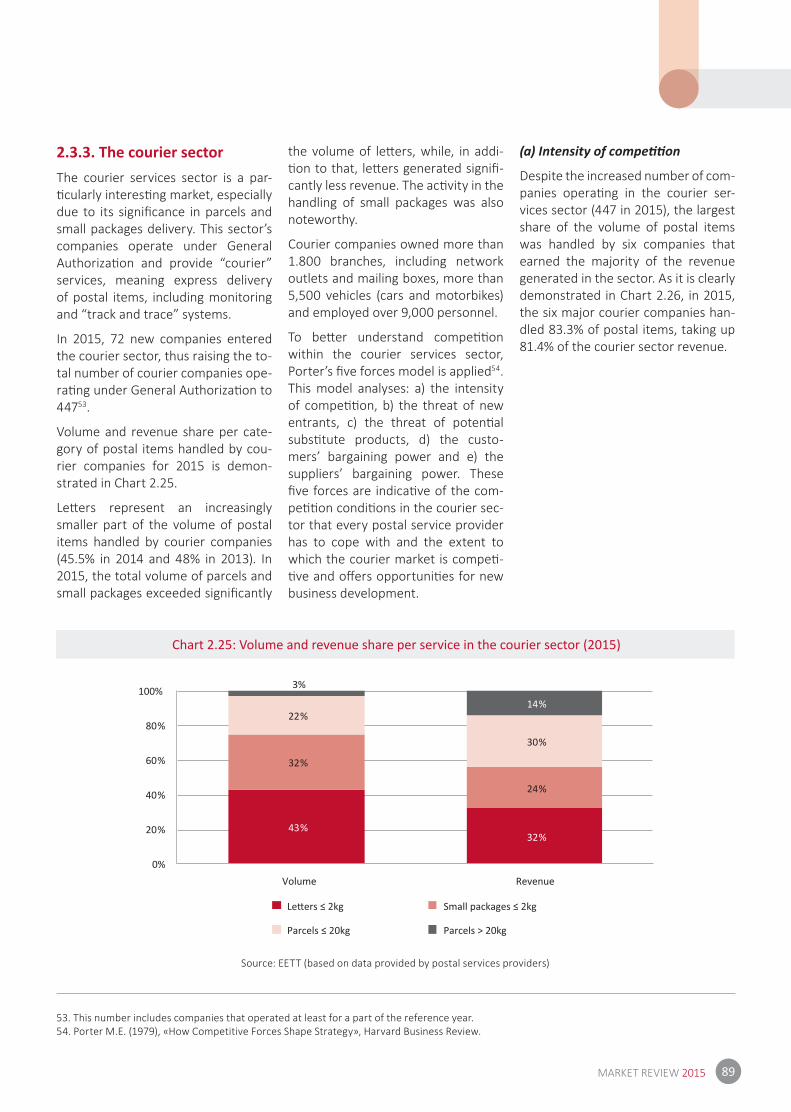
89MARKET REVIEW 2015
Chart 2.25: Volume and revenue share per service in the courier sector (2015)
Source: EETT (based on data provided by postal services providers)
53. This number includes companies that operated at least for a part of the reference year.54. Porter M.E. (1979), «How Competitive Forces Shape Strategy», Harvard Business Review.
2.3.3. The courier sectorThe courier services sector is a par-ti cularly interesti ng market, especially due to its signifi cance in parcels and small packages delivery. This sector’s companies operate under General Authorizati on and provide “courier” services, meaning express delivery of postal items, including monitoring and “track and trace” systems.
In 2015, 72 new companies entered the courier sector, thus raising the to-tal number of courier companies ope-rati ng under General Authorizati on to 44753.
Volume and revenue share per cate-gory of postal items handled by cou-rier companies for 2015 is demon-strated in Chart 2.25.
Lett ers represent an increasingly smaller part of the volume of postal items handled by courier companies (45.5% in 2014 and 48% in 2013). In 2015, the total volume of parcels and small packages exceeded signifi cantly
the volume of lett ers, while, in addi-ti on to that, lett ers generated signifi -cantly less revenue. The acti vity in the handling of small packages was also noteworthy.
Courier companies owned more than 1.800 branches, including network outlets and mailing boxes, more than 5,500 vehicles (cars and motorbikes) and employed over 9,000 personnel.
To bett er understand competi ti on within the courier services sector, Porter’s fi ve forces model is applied54. This model analyses: a) the intensity of competi ti on, b) the threat of new entrants, c) the threat of potenti al substi tute products, d) the custo-mers’ bargaining power and e) the suppliers’ bargaining power. These fi ve forces are indicati ve of the com-peti ti on conditi ons in the courier sec-tor that every postal service provider has to cope with and the extent to which the courier market is competi -ti ve and off ers opportuniti es for new business development.
(a) Intensity of competi ti on
Despite the increased number of com-panies operati ng in the courier ser-vices sector (447 in 2015), the largest share of the volume of postal items was handled by six companies that earned the majority of the revenue generated in the sector. As it is clearly demonstrated in Chart 2.26, in 2015, the six major courier companies han-dled 83.3% of postal items, taking up 81.4% of the courier sector revenue.
43%32%
32%
24%
22%
30%
3%
14%
0%
20%
40%
60%
80%
100%
Volume Revenue
Parcels > 20kg
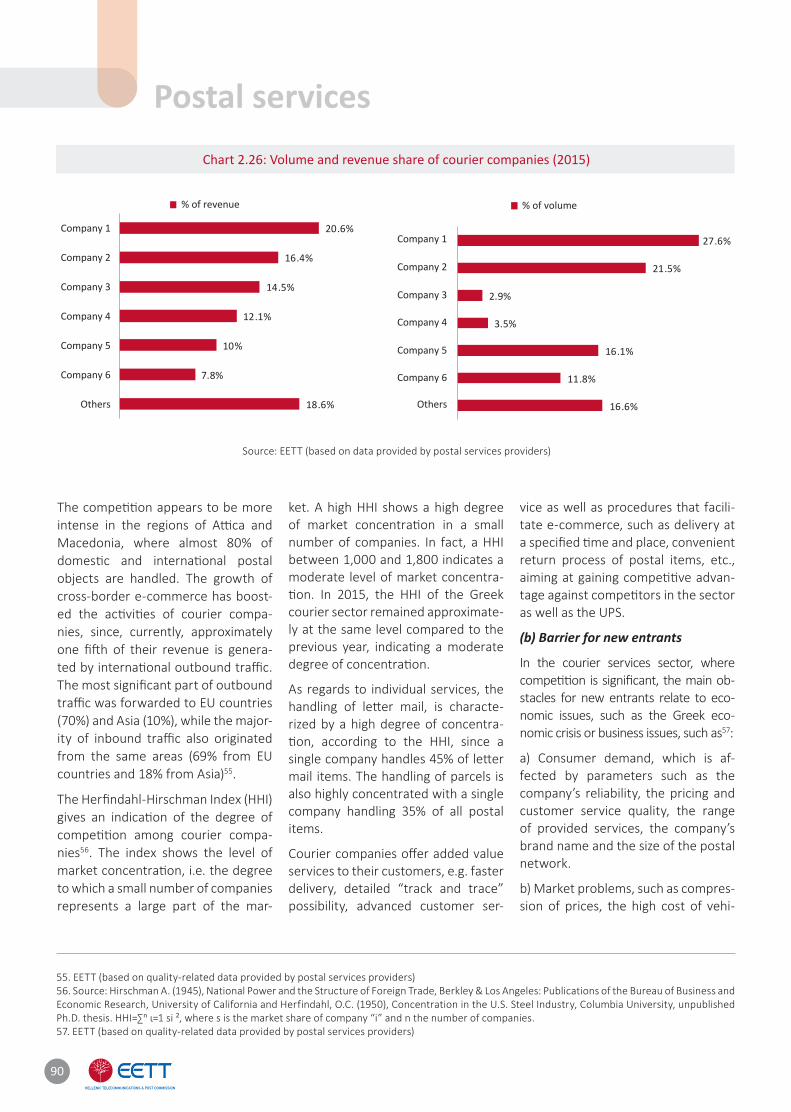
Chart 2.26: Volume and revenue share of courier companies (2015)
Source: EETT (based on data provided by postal services providers)
The competi ti on appears to be more intense in the regions of Atti ca and Macedonia, where almost 80% of domesti c and internati onal postal objects are handled. The growth of cross-border e-commerce has boost-ed the acti viti es of courier compa-nies, since, currently, approximately one fi ft h of their revenue is genera-ted by internati onal outbound traffi c. The most signifi cant part of outbound traffi c was forwarded to EU countries (70%) and Asia (10%), while the major-ity of inbound traffi c also originated from the same areas (69% from EU countries and 18% from Asia)55.
The Herfi ndahl-Hirschman Index (HHI) gives an indicati on of the degree of competi ti on among courier compa-nies56. The index shows the level of market concentrati on, i.e. the degree to which a small number of companies represents a large part of the mar-
ket. A high HHI shows a high degree of market concentrati on in a small number of companies. In fact, a HHI between 1,000 and 1,800 indicates a moderate level of market concentra-ti on. In 2015, the HHI of the Greek courier sector remained approximate-ly at the same level compared to the previous year, indicati ng a moderate degree of concentrati on.
As regards to individual services, the handling of lett er mail, is characte-rized by a high degree of concentra-ti on, according to the HHI, since a single company handles 45% of lett er mail items. The handling of parcels is also highly concentrated with a single company handling 35% of all postal items.
Courier companies off er added value services to their customers, e.g. faster delivery, detailed “track and trace” possibility, advanced customer ser-
vice as well as procedures that facili-tate e-commerce, such as delivery at a specifi ed ti me and place, convenient return process of postal items, etc., aiming at gaining competi ti ve advan-tage against competi tors in the sector as well as the UPS.
(b) Barrier for new entrants
In the courier services sector, where competi ti on is signifi cant, the main ob-stacles for new entrants relate to eco-nomic issues, such as the Greek eco-nomic crisis or business issues, such as57:
a) Consumer demand, which is af-fected by parameters such as the company’s reliability, the pricing and customer service quality, the range of provided services, the company’s brand name and the size of the postal network.
b) Market problems, such as compres-sion of prices, the high cost of vehi-
55. EETT (based on quality-related data provided by postal services providers)56. Source: Hirschman A. (1945), National Power and the Structure of Foreign Trade, Berkley & Los Angeles: Publications of the Bureau of Business and Economic Research, University of California and Herfindahl, O.C. (1950), Concentration in the U.S. Steel Industry, Columbia University, unpublished Ph.D. thesis. ΗΗΙ=∑ⁿ ι=1 si ², where s is the market share of company “i” and n the number of companies.57. EETT (based on quality-related data provided by postal services providers)
Postal services
90
20.6%
16.4%
14.5%
12.1%
10%
7.8%
18.6%
Company 1
Company 2
Company 3
Company 4
Company 5
Company 6
Others
Company 1
Company 2
Company 3
Company 4
Company 5
Company 6
Others
% of revenue
27.6%
21.5%
2.9%
3.5%
16.1%
11.8%
16.6%
% of volume
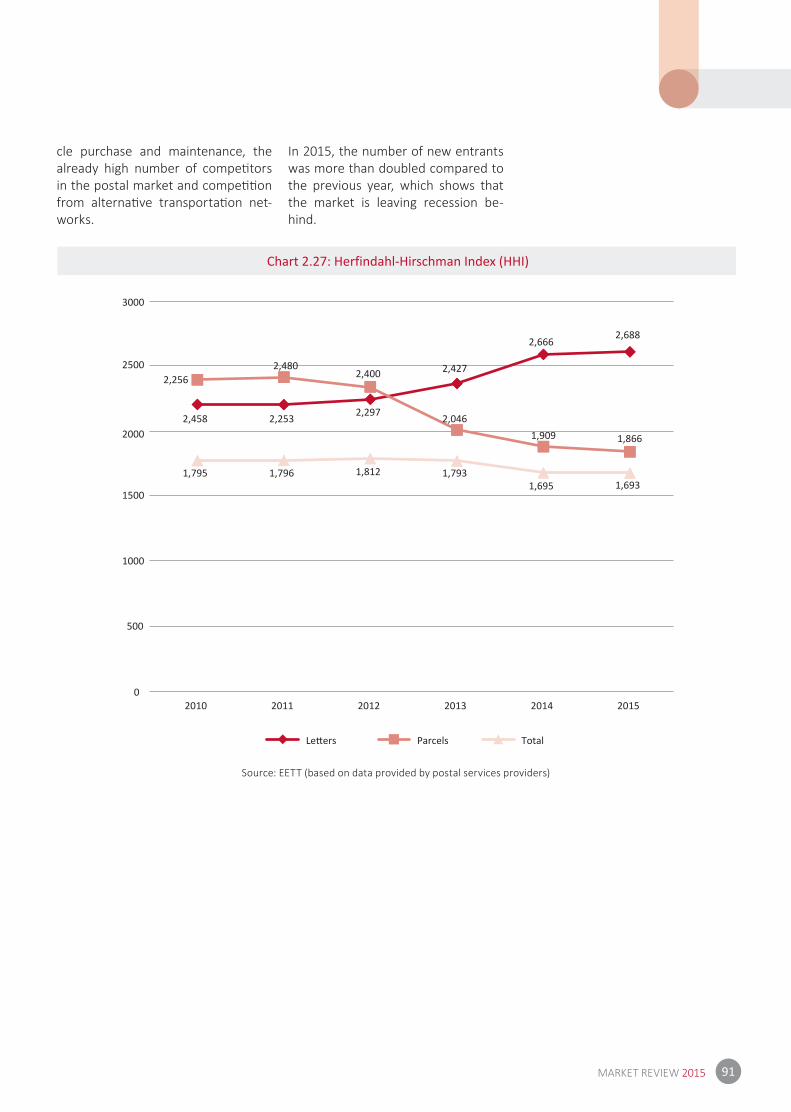
91MARKET REVIEW 2015
Chart 2.27: Herfindahl-Hirschman Index (HHI)
Source: EETT (based on data provided by postal services providers)
cle purchase and maintenance, the already high number of competi tors in the postal market and competi ti on from alternati ve transportati on net-works.
In 2015, the number of new entrants was more than doubled compared to the previous year, which shows that the market is leaving recession be-hind.
2000
1500
2,256
2,253 2,297
2,427
2,6662,688
2,458
2,4802,400
2,0461,909 1,866
1,795 1,796 1,812 1,7931,695 1,693
2010 2011 2012 2013 2014 2015
Parcels Total
0
1000
500
3000
2500
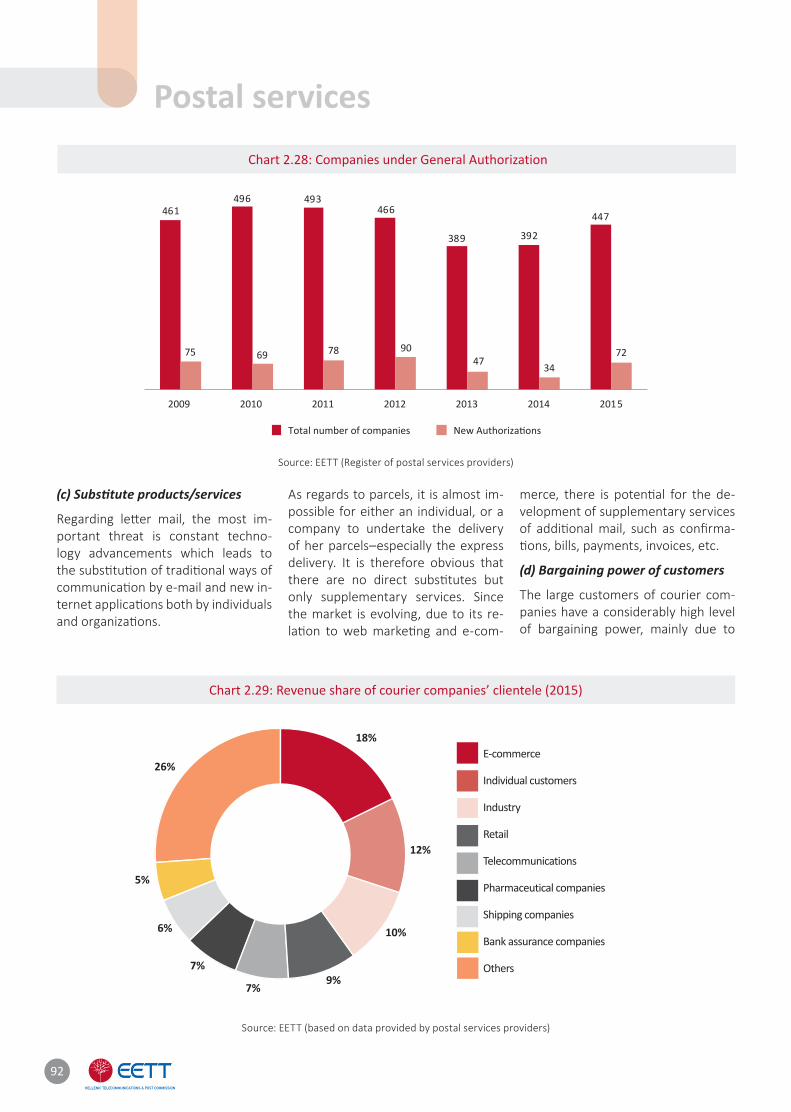
(c) Substi tute products/services
Regarding lett er mail, the most im-portant threat is constant techno-logy advancements which leads to the substi tuti on of traditi onal ways of communicati on by e-mail and new in-ternet applicati ons both by individuals and organizati ons.
As regards to parcels, it is almost im-possible for either an individual, or a company to undertake the delivery of her parcels–especially the express delivery. It is therefore obvious that there are no direct substi tutes but only supplementary services. Since the market is evolving, due to its re-lati on to web marketi ng and e-com-
merce, there is potenti al for the de-velopment of supplementary services of additi onal mail, such as confi rma-ti ons, bills, payments, invoices, etc.
(d) Bargaining power of customers
The large customers of courier com-panies have a considerably high level of bargaining power, mainly due to
Chart 2.29: Revenue share of courier companies’ clientele (2015)
Source: EETT (based on data provided by postal services providers)
Postal services
E-commerce
Individual customers
Industry
Retail
Telecommunications
Pharmaceutical companies
Shipping companies
Bank assurance companies
Others
18%
12%
10%
9%7%
7%
6%
5%
26%
Chart 2.28: Companies under General Authorization
Source: EETT (Register of postal services providers)
92
461496 493
466
389 392
447
75 69 78 9047 34
72
2009 2010 2011 2012 2013 2014 2015
Total number of companies
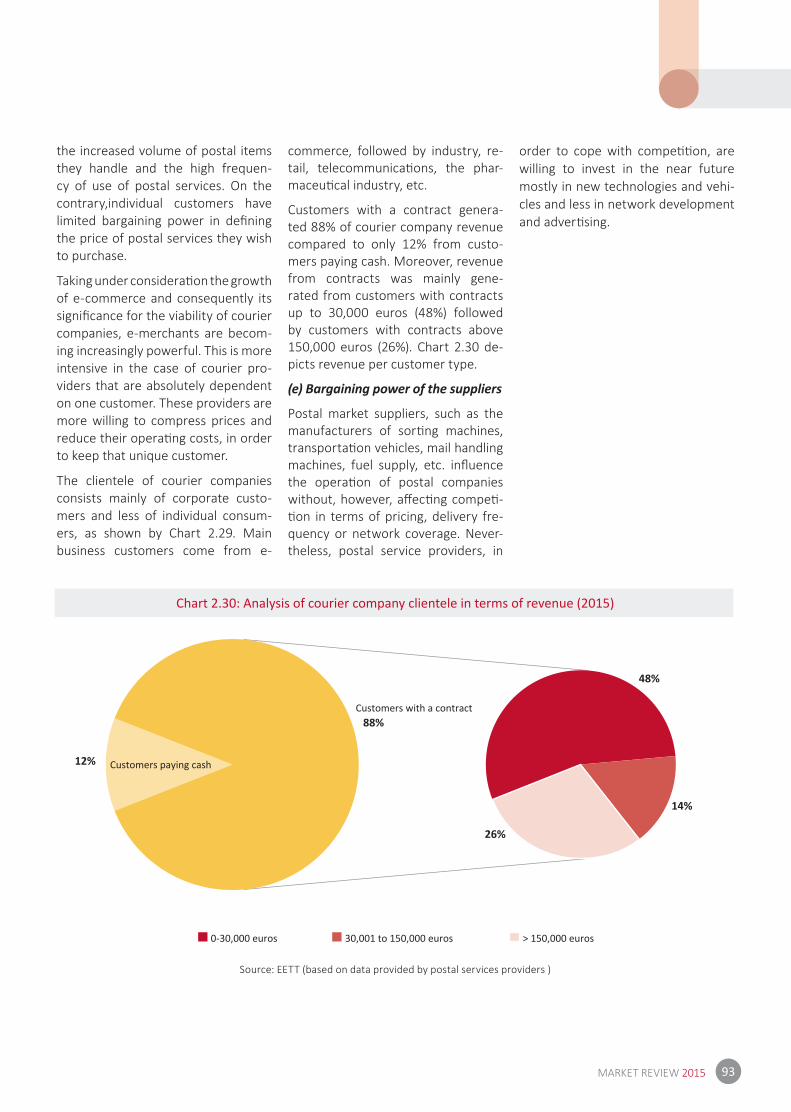
93MARKET REVIEW 2015
Chart 2.30: Analysis of courier company clientele in terms of revenue (2015)
Source: EETT (based on data provided by postal services providers )
12%
88%
48%
14%
26%
the increased volume of postal items they handle and the high frequen-cy of use of postal services. On the contrary,individual customers have limited bargaining power in defi ning the price of postal services they wish to purchase.
Taking under considerati on the growth of e-commerce and consequently its signifi cance for the viabi lity of courier companies, e-merchants are becom-ing increasingly powerful. This is more intensive in the case of courier pro-viders that are absolutely dependent on one customer. These providers are more willing to compress prices and reduce their operati ng costs, in order to keep that unique customer.
The clientele of courier companies consists mainly of corporate custo-mers and less of individual consum-ers, as shown by Chart 2.29. Main business customers come from e-
commerce, followed by industry, re-tail, telecommunicati ons, the phar-maceuti cal industry, etc.
Customers with a contract genera-ted 88% of courier company revenue compared to only 12% from custo-mers paying cash. Moreover, revenue from contracts was mainly gene-rated from customers with contracts up to 30,000 euros (48%) followed by cu stomers with contracts above 150,000 euros (26%). Chart 2.30 de-picts revenue per customer type.
(e) Bargaining power of the suppliers
Postal market suppliers, such as the manufacturers of sorti ng machines, transportati on vehicles, mail handling machines, fuel supply, etc. infl uence the operati on of postal companies without, however, aff ecti ng competi -ti on in terms of pricing, delivery fre-quency or network coverage. Never-theless, postal service providers, in
order to cope with competi ti on, are willing to invest in the near future mostly in new technologies and vehi-cles and less in network development and adverti sing.
Customers paying cash
Customers with a contract
0-30,000 euros 30,001 to 150,000 euros > 150,000 euros
Index of Tables and Charts(a) Tables
Table 1.1: Acti ve fi xed & mobile telephony operators 11
Table 1.2: Electronic communications operators’ financial figures (in billion euros) 11
Table 1.3: Progress of telephony lines 21
Table 1.4: Volume per call type (in millions minutes) 24
Table 1.5: Market shares for the main call types 26
Table 1.6: Total and active mobile telephony connections/subscriptions (excl. datacards) 30
Table 1.7: Number of bundled offers and unbundled subscriptions 47
Table 2.1: Revenue and volume growth rate of the European postal market 71
Table 2.2: Total volume of the European postal market 71
Table 2.3: Herfindahl-Hirschman Index (HHI) (2013 & 2014) 73
Table 2.4: Main postal service providers’ financials (in millions euros) (2015) 79
Table 2.5: Postal market financial indicators (2010-2015) 80
Table 2.6: Postal market volume (in thousand items) 82
Table 2.7: Postal market revenue (in thousand euros) 82
Table 2.8: Volume and revenue share of postal items within the US sector (2015) 85
Table 2.9: USP volume and revenue share per service 87
Table 2.10: Volume and revenue share per service for companies with Individual License (2015) 88
94
95MARKET REVIEW 2015
(b) Charts
Chart 1.1: Licensed operators (2015) 10
Chart 1.2: Contribution of telecommunications to Greece’s GDP (in million euros) 12
Chart 1.3: Number of personnel 12
Chart 1.4: Progress of the Monthly Consumer Price Index (General Index – Communications Sub-Index) 13
Chart 1.5: Change of the Monthly Consumer Price Index compared to the respective index of the previous year 13
Chart 1.6: Turnover of electronic communications operators 15
Chart 1.7: Turnover of fixed & mobile telephony operators 15
Chart 1.8: Turnover breakdown 16
Chart 1.9: Progress of Pay TV subscriptions 16
Chart 1.10: Telecommunication services breakdown 17
Chart 1.11: Fixed network revenues breakdown 17
Chart 1.12: Mobile network revenues breakdown 18
Chart 1.13: Investments from electronic communications operators 18
Chart 1.14: Electronic communications operators investments breakdown (2015) 19
Chart 1.15: Growth rate of investments/turnover 19
Chart 1.16: Investments / Turnover ratio 20
Chart 1.17: EBITDA 20
Chart 1.18: Progress of telephony lines 22
Chart 1.19: Progress of the fixed outgoing traffic 23
Chart 1.20: Fixed outgoing traffic for the main call types 23
Chart 1.21: Annual change of fixed outgoing traffic volume 23
Chart 1.22: OTE’s annual market shares (based on outgoing traffic) 24
Chart 1.23: OTE market shares per main call type (based on traffic) 25
Chart 1.24: Market shares for the main call types (based on traffic) 25
Chart 1.25: Outgoing traffic volume for OTE and the alternative operators (except dial-up) 26
Chart 1.26: Retail revenues from the provision of telephony and internet services at a fixed location 27
Chart 1.27: OTE’s market share (based on retail revenues from telephony and internet at a fixed location) 27
Chart 1.28: Call termination traffic to fixed telephony networks (OTE – alternative operators) 28
Chart 1.29: Actual Interconnection fees 28
Chart 1.30: Number portability for fixed telephony 29
Chart 1.31: Mobile telephony connections/subscriptions 30
Chart 1.32: Progress of the mobile telephony subscribers (pre-paid and post-paid) 30
Chart 1.33: MTO’s market shares over the number of mobile telephony connections 31
Chart 1.34: Volume of voice calls originating from mobile phones 32
Chart 1.35: Voice calls per category (in percent of the total) 32
Chart 1.36: Voice calls per user category 33
Chart 1.37: Total number of SMS 33
Chart 1.38: SMS per user category 34
Chart 1.39: Total number of MMS 34
Chart 1.40: Total number (MB) of data services 35
Chart 1.41: Average use of data via mobile phones 35
Chart 1.42: Mobile telephony retail revenues 36
Chart 1.43: Mobile telephony retail revenues breakdown (2015) 36
Chart 1.44: Average revenue per mobile user 37
Chart 1.45: Mobile telephony operators interconnection traffic 37
Chart 1.46: MTO’s on-net traffic 38
Chart 1.47: Voice calls terminating to mobile phones in Greece 38
Chart 1.48: Decrease in mobile call termination fees 39
Chart 1.49: Portability for mobile telephony 39
Chart 1.50: Connections/subscriptions for fixed and mobile telephony 40
Chart 1.51: Revenues from fixed and mobile telephony 41
Chart 1.52: Volume of calls from fixed and mobile phones 41
Chart 1.53: Market shares of fixed and mobile telephony 42
Chart 1.54: Bundled offers (per general bundling type) 44
Chart 1.55: Bundled (per specific type) and unbundled offers 44
Chart 1.56: Fixed telephony: Bundled (per specific type) and unbundled offers’ breakdown 45
Chart 1.57: Fixed broadband internet: Bundled (per specific type) and unbundled subscriptions’ breakdown 45
Annex(b) Charts
96
97MARKET REVIEW 2015
Chart 1.58: Pay TV: Bundled (per specific type) and unbundled subscriptions’ breakdown 46
Chart 1.59: Bundled subscriptions with fixed and mobile services (based on fixed subscriptions and mobile SIM cards) 46
Chart 1.60: Progress of broadband lines 48
Chart 1.61: Progress of LLU lines 48
Chart 1.62: Progress of VDSL lines 49
Chart 1.63: Distribution of broadband lines per technology (December 2015) 50
Chart 1.64: Evolution of broadband lines per technology (number of lines) 50
Chart 1.65: Distribution of broadband lines speeds (December 2015) 51
Chart 1.66: Progress of broadband lines nominal speed 51
Chart 1.67: Progress of the average access speed of retail and wholesale ADSL lines 52
Chart 1.68: Mobile telephony subscribers that used the internet 52
Chart 1.69: Broadband availability per geographic region 53
Chart 1.70: LLU availability per geographic region in Greece (December 2015) 54
Chart 1.71: Mobile network population coverage 54
Chart 1.72: Number of domain names 55
Chart 1.73: Average assignment percentage 55
Chart 1.74: PRS and Directory services shares based on the respective revenues 56
Chart 1.75: Mobile telephony penetration in the EU 57
Chart 1.76: Average revenue per mobile telephony user in the EU (in Euros) 58
Chart 1.77: Internet access via mobile phones 59
Chart 1.78: Montly price of a double play bundled offer (fixed telephony + Internet) 59
Chart 1.79: Monthly price of a triple play bundled offer (fixed telephony + internet + TV) 60
Chart 1.80: Internet accessibility based on the available income 60
Chart 1.81: Broadband penetration increase in Greece and the EU 61
Chart 1.82: Broadband penetration in the EU (June 2015) 62
Chart 1.83: Broadband penetration change in the EU (June 2015) 63
Chart 1.84: Broadband penetration progress in Greece and the EU 64
Chart 1.85: Percentage of lines at speeds exceeding 30Mbps in the EU (June 2015) 64
Chart 1.86: Broadband lines with on DSL technologies in the EU (June 2015) 65
Chart 1.87: Mobile broadband penetration in the EU 65
Chart 1.88: NGA broadband network coverage in Greece and the EU 66
Chart 1.89: 3G and 4G mobile broadband access network coverage 67
(b) Charts

(b) Charts
Chart 2.1: Average revenue growth rate in the global postal market 69
Chart 2.2: Global volume growth rate of letters vs parcel and express (2012 – 2014) 70
Chart 2.3: Total revenues of the European postal market (2013 – 2014) 72
Chart 2.4: Domestic letter mail volume (excluding unaddressed mail) in the EU (2014) 72
Chart 2.5: Total domestic US revenue per country (2014) 73
Chart 2.6: Postal market liberalization in Europe (2015) 74
Chart 2.7: USP market shares in terms of volume in 2014: express and non-express 75
Chart 2.8: Average price for posting a letter of the 1st weight step within Europe (2013 & 2014) 76
Chart 2.9: Price for sending a 2kg parcel from Austria to Italy and vice-versa 76
Chart 2.10: The Greek postal market 77
Chart 2.11: Evolution of the postal market turnover index (base year 2010) 78
Chart 2.12: Turnover of postal companies (in million euros) 79
Chart 2.13: Assets share in the postal market (2015) 79
Chart 2.14: Liabilities share in the postal market (2015) 80
Chart 2.15: Revenue and volume of the Greek postal market (2010-2015) 81
Chart 2.16: Volume and revenue share per postal service (2015) 82
Chart 2.17: Volume and revenue share of parcels and letters (2010-2015) 83
Chart 2.18: Volume and Revenue share of postal operators (2015) 84
Chart 2.19: Revenue share of postal operators (2010-2015) 84
Chart 2.20: Letter and parcels share for US and courier (2015) 85
Chart 2.21: Volume and revenue share of postal operators within the US sector (2015) 86
Chart 2.22: Volume and revenue share of services within the US sector (2015) 86
Chart 2.23: USP volume and revenue (2010-2015) 87
Chart 2.24: Number of companies with an Individual License 88
Chart 2.25: Volume and revenue share per service in the courier sector (2015) 89
Chart 2.26: Volume and revenue share of courier companies (2015) 90
Chart 2.27: Herfindahl-Hirschman Index (HHI) 91
Chart 2.28: Companies under General Authorization 92
Chart 2.29: Revenue share of courier companies’ clientele (2015) 92
Chart 2.30: Analysis of courier company clientele in terms of revenue (2015) 93
98


Hellenic RepublicHellenic Telecommunications & Post Commission
60 Kifissias Ave., 151 25 Μaroussi, GreeceΤ +30 210 6151000 • F +30 210 6105049
W www.eett.gr • E [email protected]
o f e l e c t r o n i c c o m m u n i c a t i o n s& p o s t a l s e r v i c e s