ODEON and scattering and scattering.pdf · Scattering as a weighted vector addition of specular and...
45
ODEON Workshop, Mariehamn, Åland, Finland, 2nd June 2004 ODEON and the scattering coefficient Jens Holger Rindel
Transcript of ODEON and scattering and scattering.pdf · Scattering as a weighted vector addition of specular and...
ODEON Workshop, Mariehamn, Åland, Finland, 2nd June 2004
ODEON and the scattering coefficient
Jens Holger Rindel
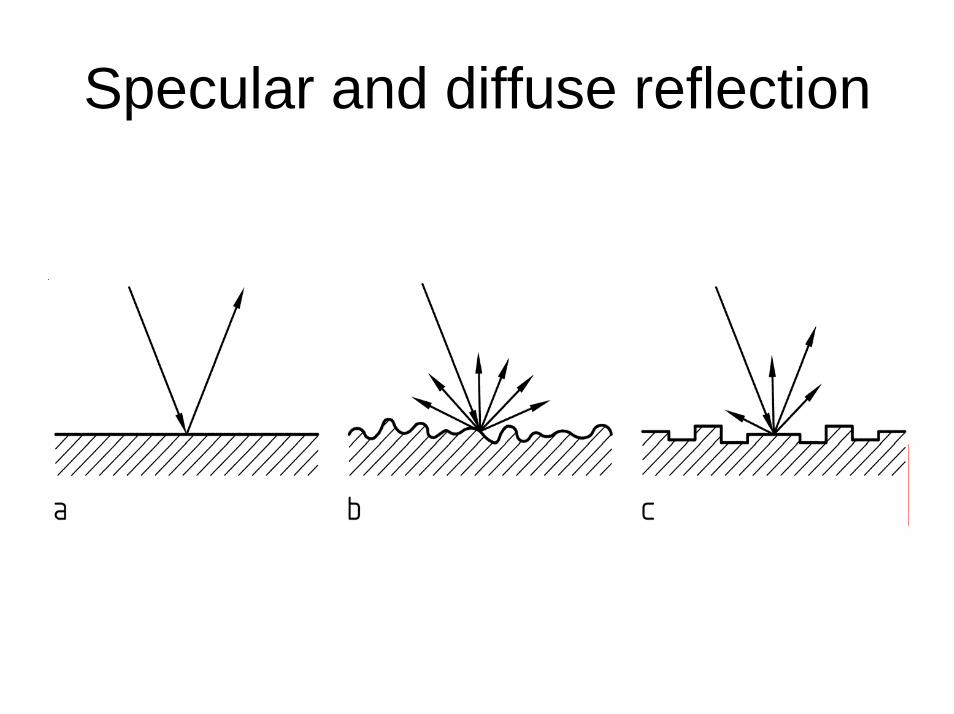
Specular and diffuse reflection
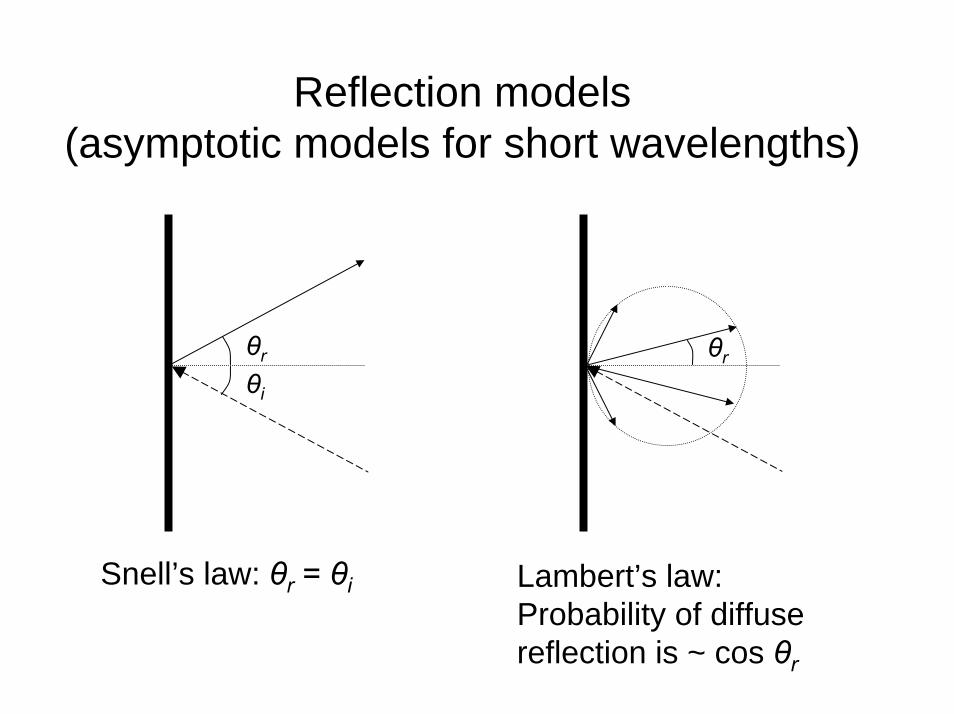
Reflection models (asymptotic models for short wavelengths)
θr
θi
θr
Snell’s law: θr = θi Lambert’s law: Probability of diffuse reflection is ~ cos θr
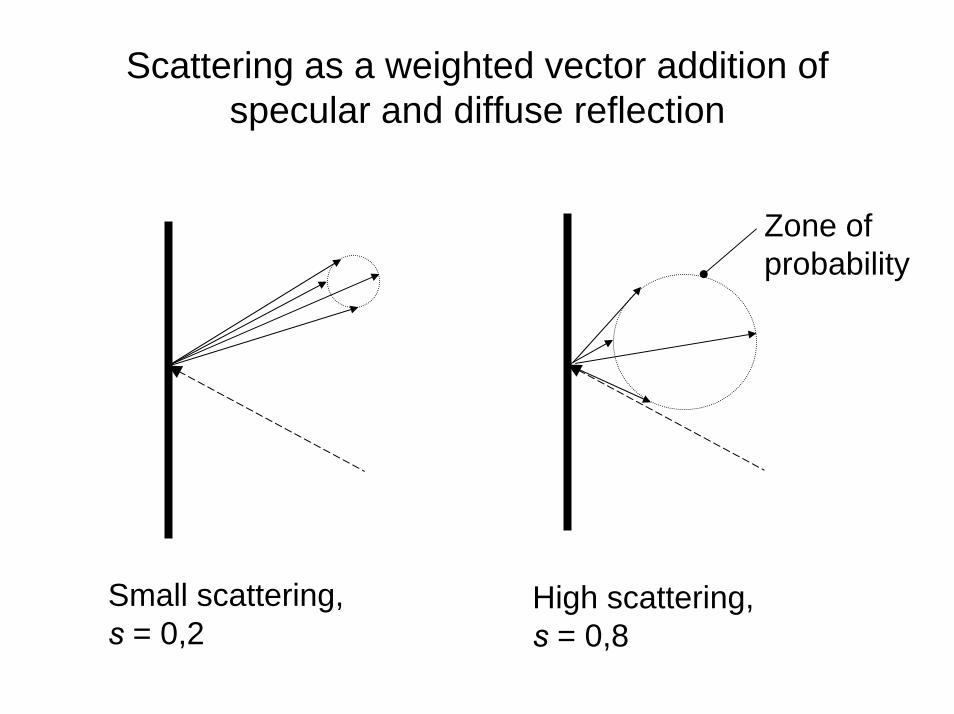
Scattering as a weighted vector addition of specular and diffuse reflection
Zone of probability
Small scattering, s = 0,2
High scattering, s = 0,8
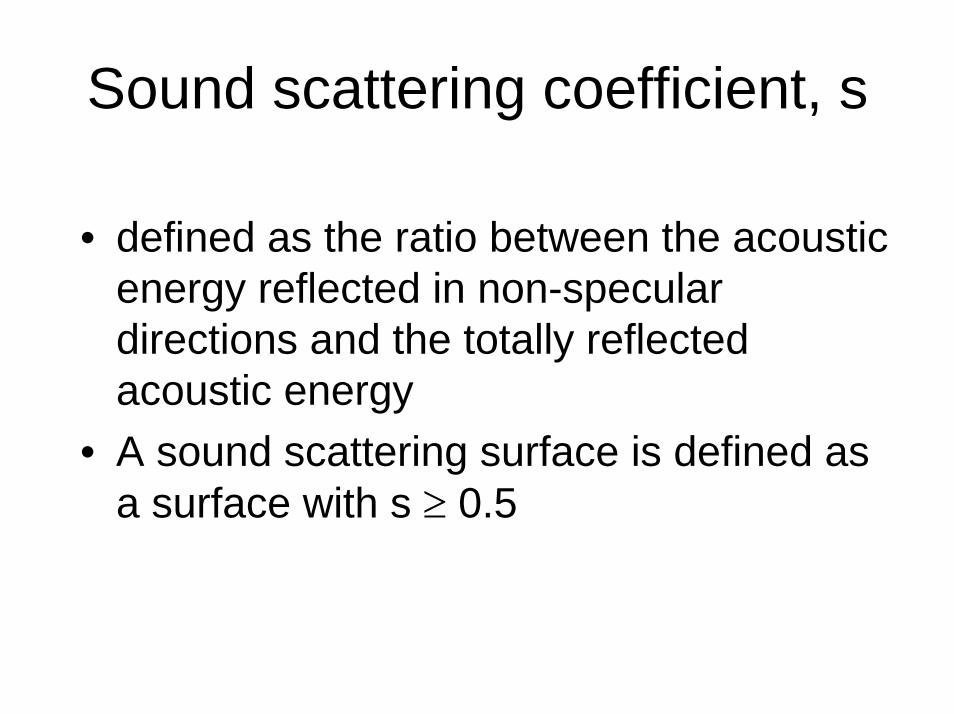
Sound scattering coefficient, s
• defined as the ratio between the acoustic energy reflected in non-speculardirections and the totally reflected acoustic energy
• A sound scattering surface is defined as a surface with s ≥ 0.5
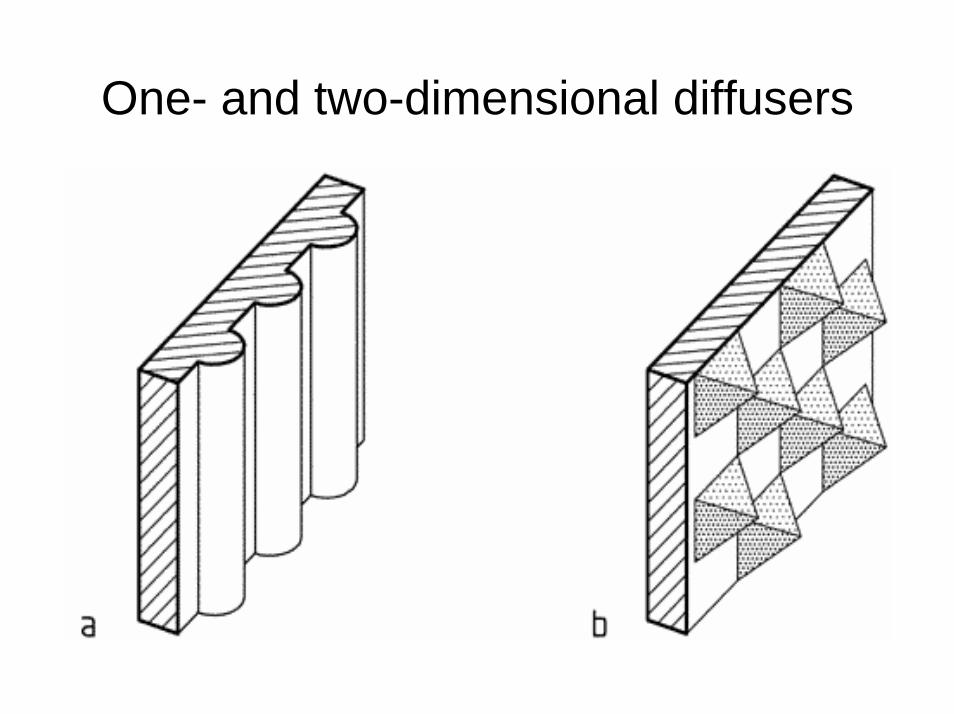
One- and two-dimensional diffusers
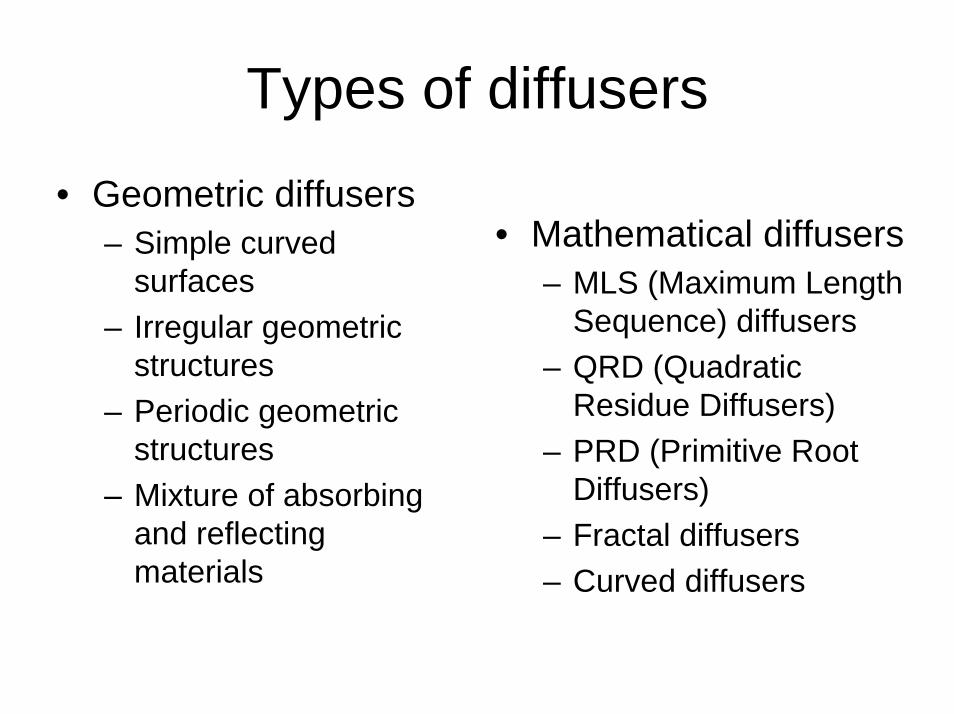
Types of diffusers
• Geometric diffusers– Simple curved
surfaces– Irregular geometric
structures– Periodic geometric
structures– Mixture of absorbing
and reflecting materials
• Mathematical diffusers– MLS (Maximum Length
Sequence) diffusers– QRD (Quadratic
Residue Diffusers) – PRD (Primitive Root
Diffusers)– Fractal diffusers– Curved diffusers
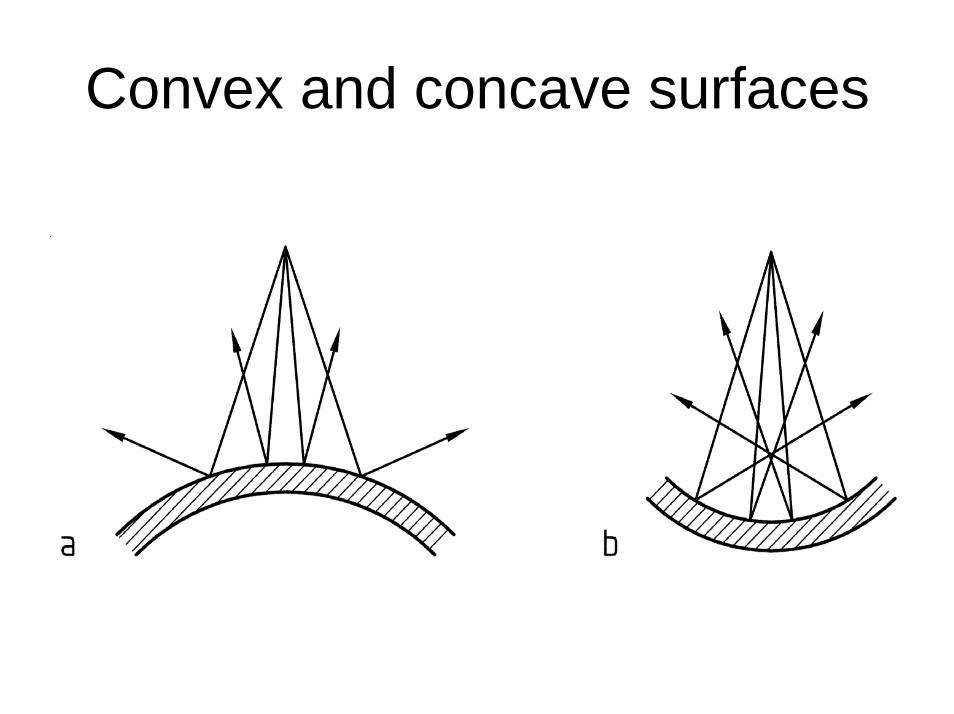
Convex and concave surfaces
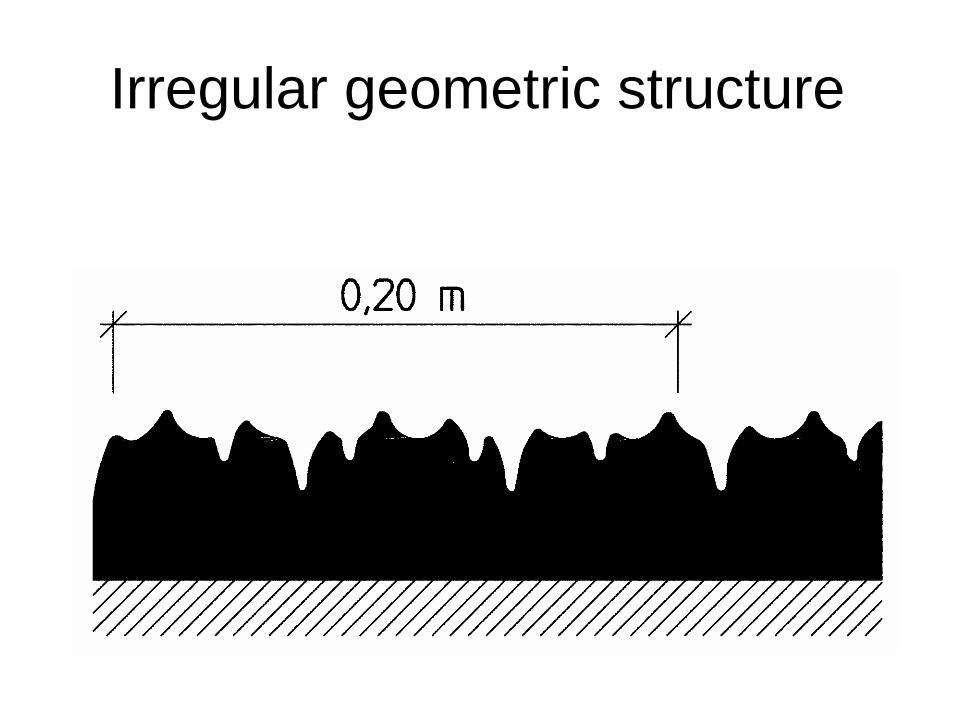
Irregular geometric structure
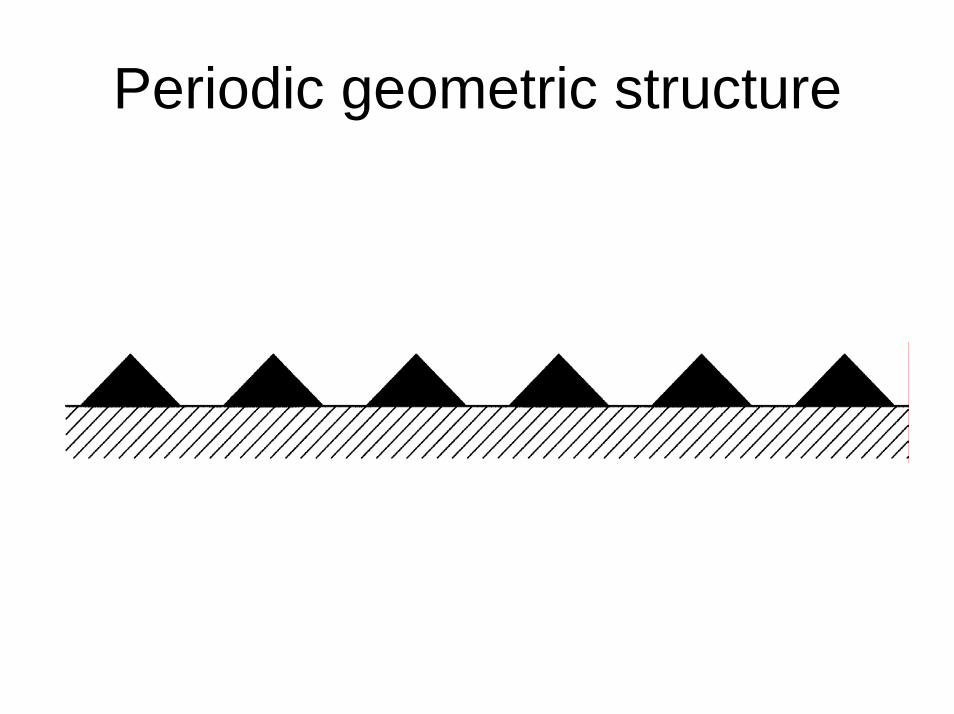
Periodic geometric structure
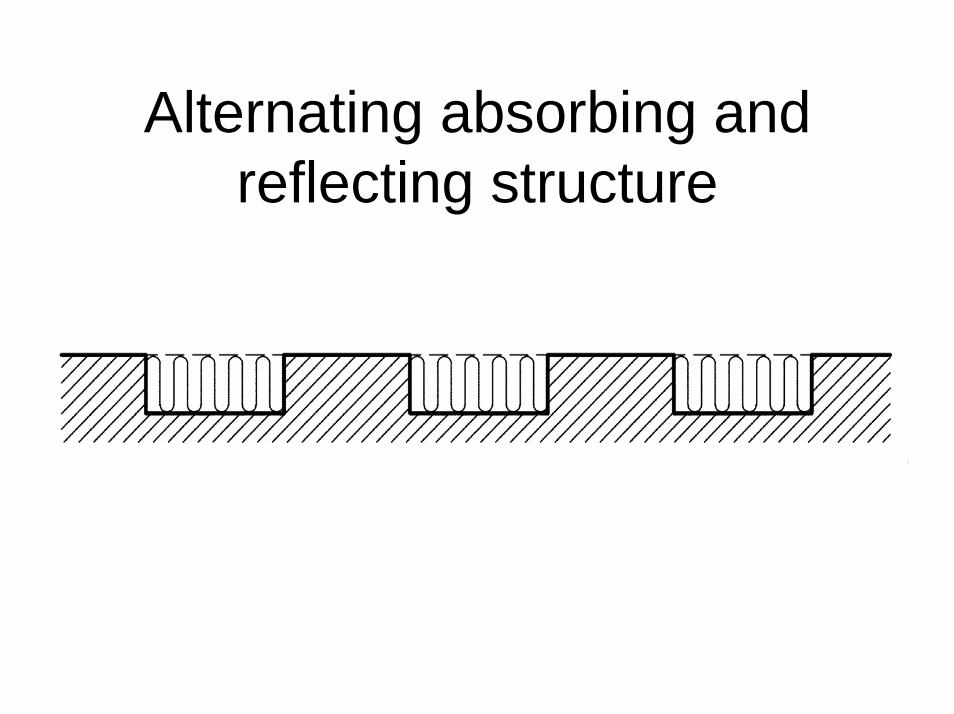
Alternating absorbing and reflecting structure
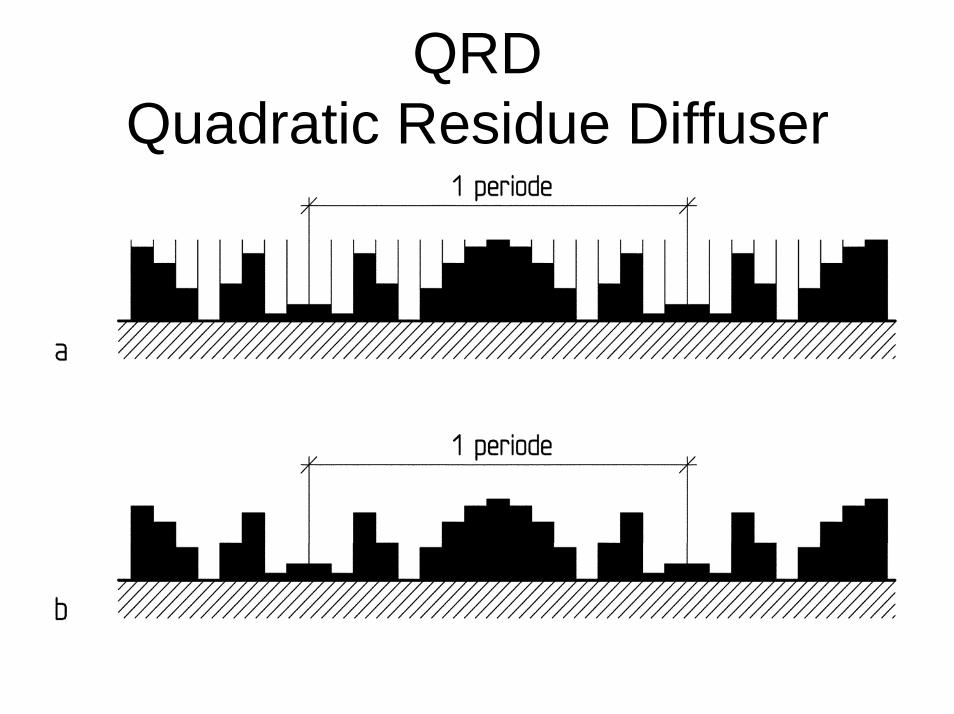
QRD Quadratic Residue Diffuser
Measurement of the scattering coefficient
ISO/FDIS 17497 -1:Acoustics – Sound scattering properties of surfaces – Part 1: Measurement of the random-incidence scattering coefficient in a reverberation room
Reverberation room
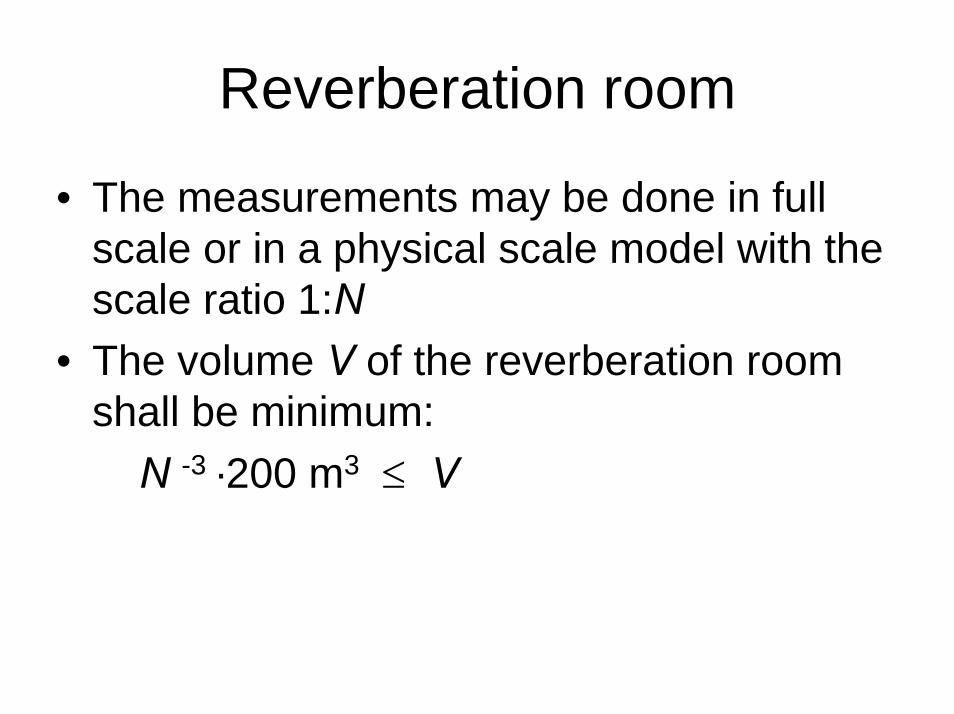
• The measurements may be done in full scale or in a physical scale model with the scale ratio 1:N
• The volume V of the reverberation room shall be minimum:
N -3 ·200 m3 ≤ V
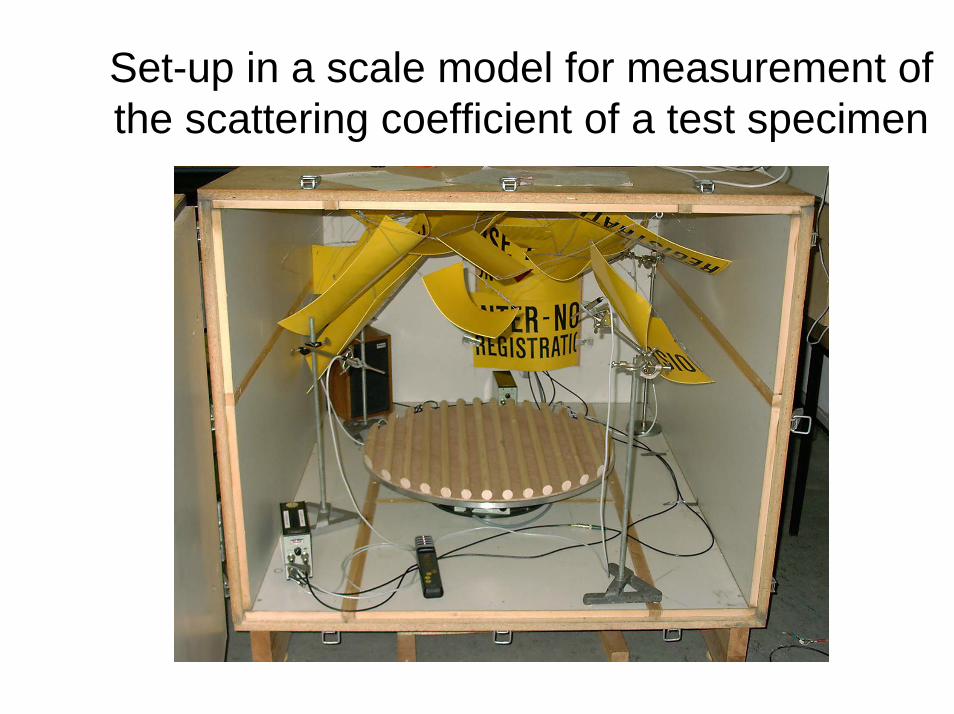
Set-up in a scale model for measurement of the scattering coefficient of a test specimen
Principle
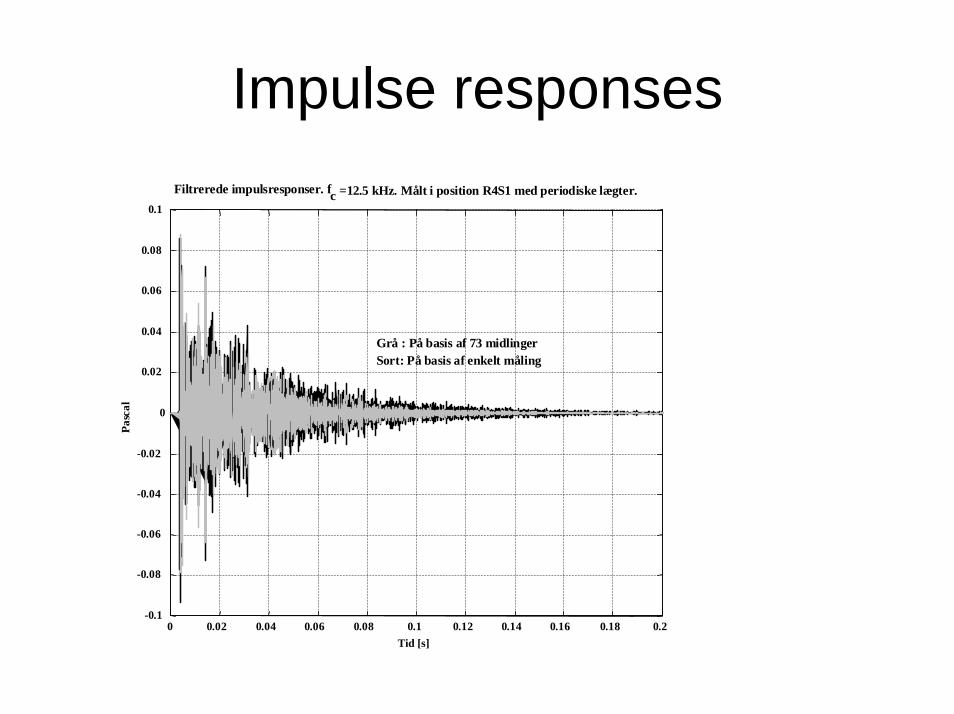
• Impulse responses are measured for different orientations of a circular test specimen on a turntable
• The specular energy is extracted from the impulse response by phase-locked averaging
• The scattered sound is incoherent and is eliminated by averaging
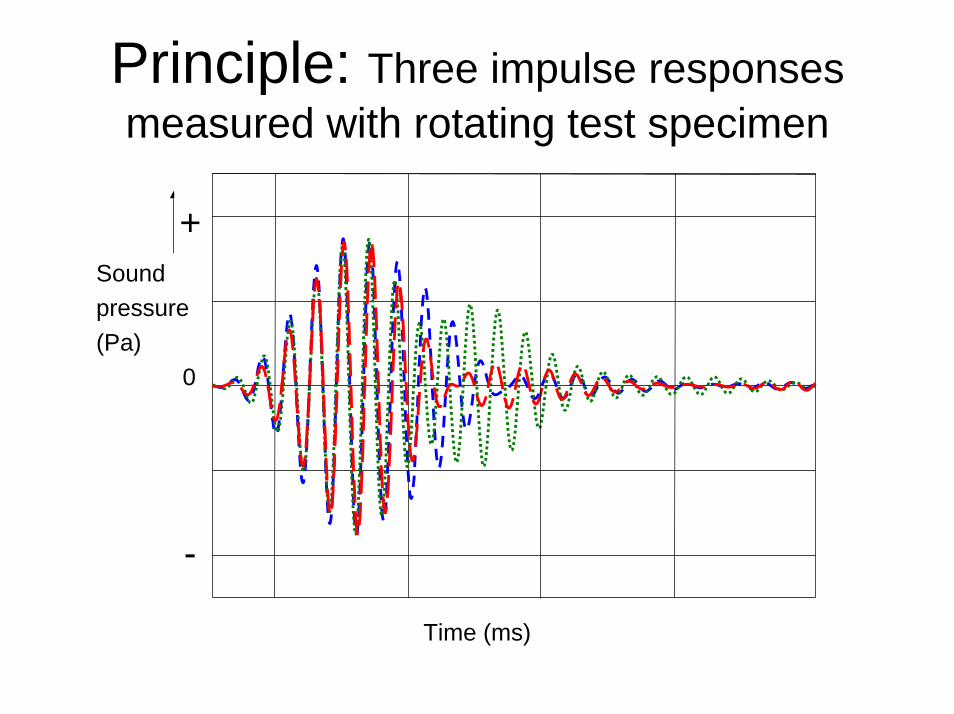
Principle: Three impulse responses measured with rotating test specimen
Amplitude
Time
Soundpressure(Pa)
0
+
-
Time (ms)
Impulse responses
0 0.02 0.04 0.06 0.08 0.1 0.12 0.14 0.16 0.18 0.2-0.1
-0.08
-0.06
-0.04
-0.02
0
0.02
0.04
0.06
0.08
0.1
Filtrerede impulsresponser. fc =12.5 kHz. Målt i position R4S1 med periodiske lægter.
Tid [s]
Pasc
al
Grå : På basis af 73 midlingerSort: På basis af enkelt måling
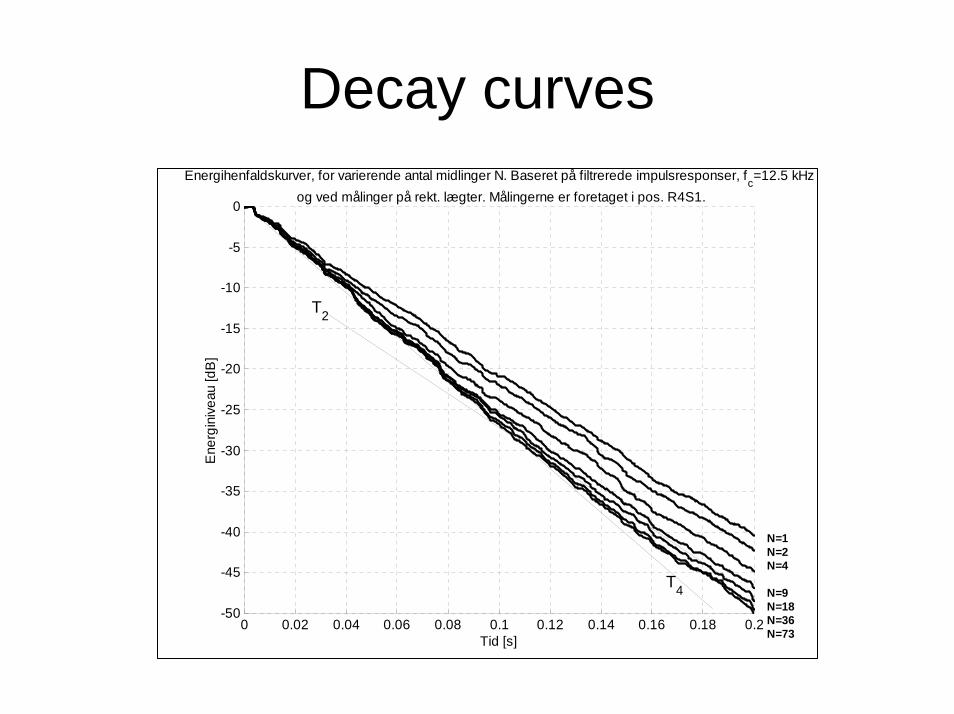
Decay curves
0 0.02 0.04 0.06 0.08 0.1 0.12 0.14 0.16 0.18 0.2-50
-45
-40
-35
-30
-25
-20
-15
-10
-5
0
Energihenfaldskurver, for varierende antal midlinger N. Baseret på filtrerede impulsresponser, fc=12.5 kHz og ved målinger på rekt. lægter. Målingerne er foretaget i pos. R4S1.
Tid [s]
Ene
rgin
ivea
u [d
B]
N=1 N=2 N=4 N=9 N=18 N=36 N=73
T2
T4
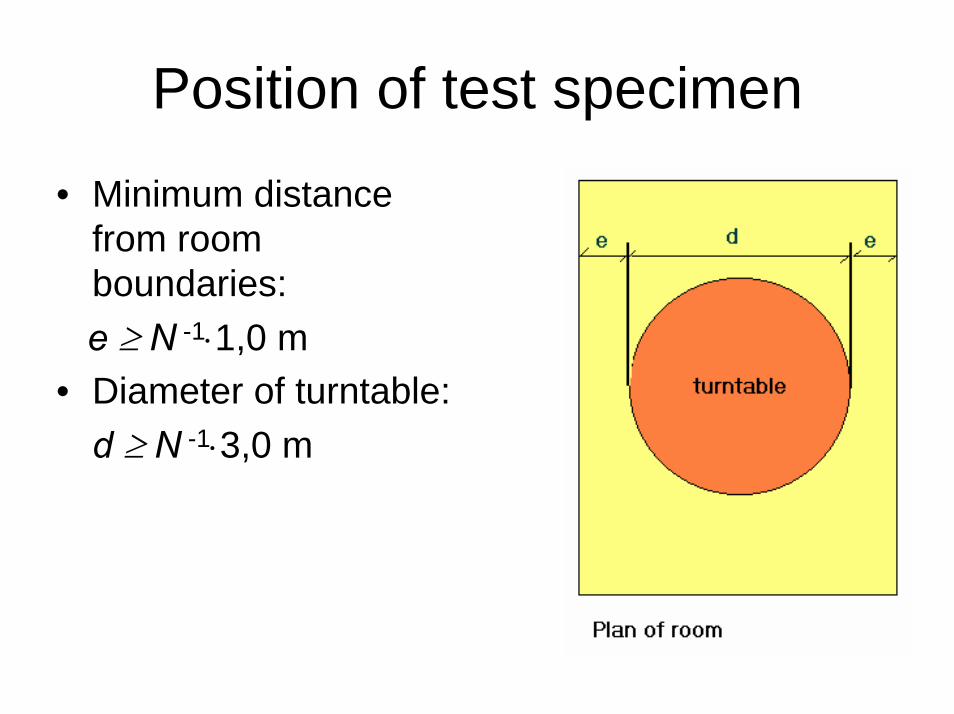
Position of test specimen
• Minimum distance from room boundaries: e ≥ N -1⋅1,0 m
• Diameter of turntable: d ≥ N -1⋅3,0 m
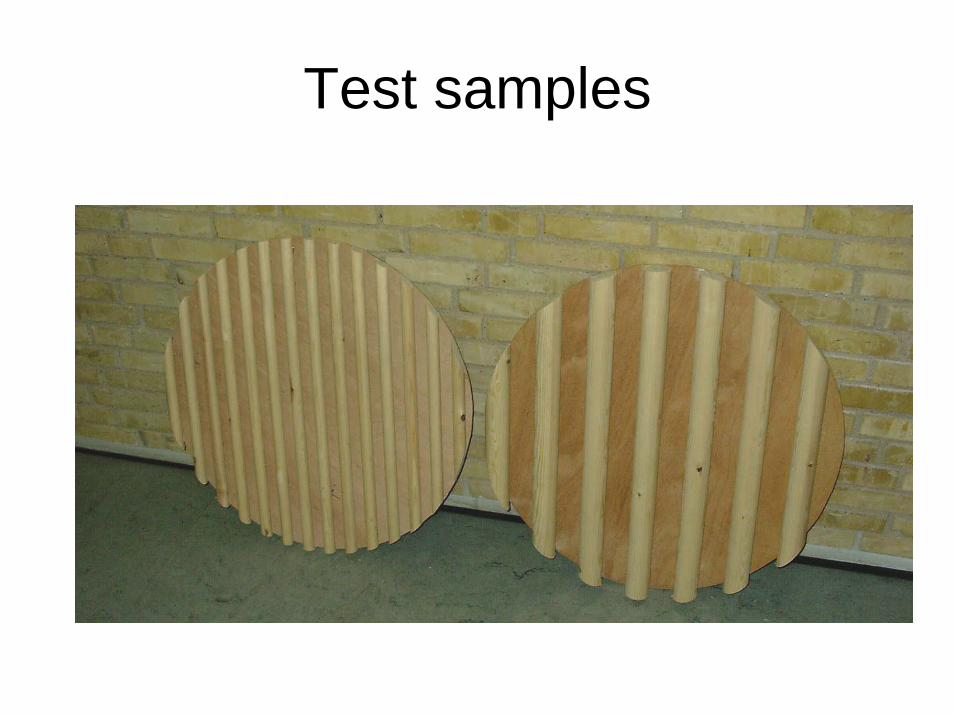
Test samples
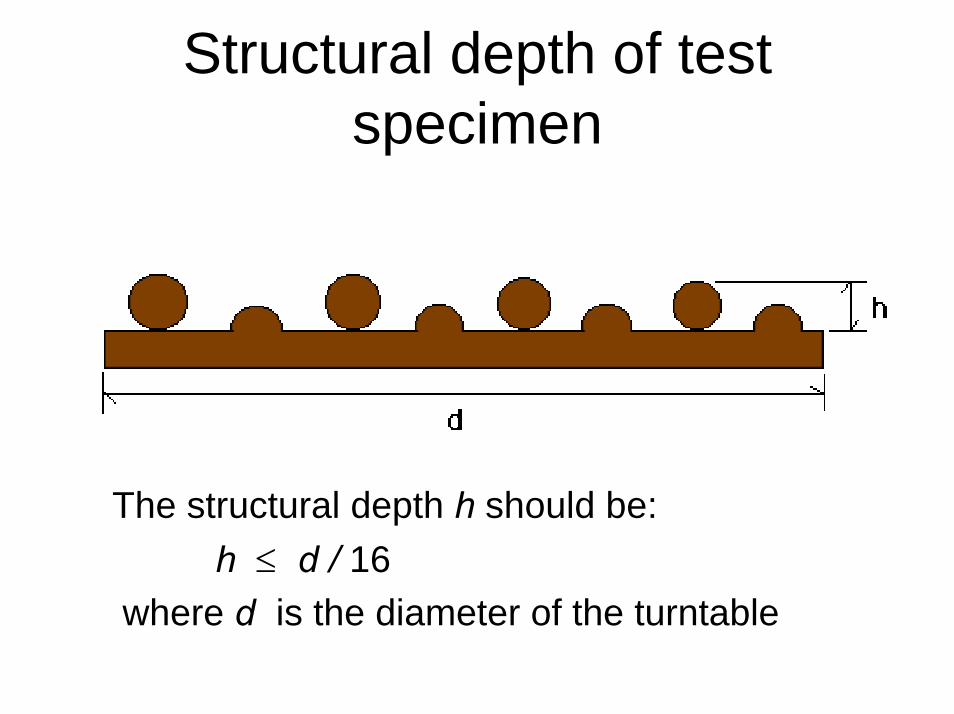
Structural depth of test specimen
The structural depth h should be:h ≤ d / 16
where d is the diameter of the turntable
Absorption of test specimen
• Measuring accuracy decreases for samples with high absorption
• Sound scattering surfaces should generally be as reflective as possible
• The absorption coefficient should beαs < 0,50
Rotation of test specimen
• Number of coherent averages: n60 ≤ n ≤ 120
• Turn between measurements:∆ ϕ = 360° / n3° ≤ ∆ ϕ ≤ 6°
• Preferred number of averages: n = 72, ∆ ϕ = 5°
Rotation of test specimen
• Continuous rotation may be used • The total measuring time shall equal a
multiple of the revolution time of the turntable
• As a minimum two source positions and three microphone positions shall be used
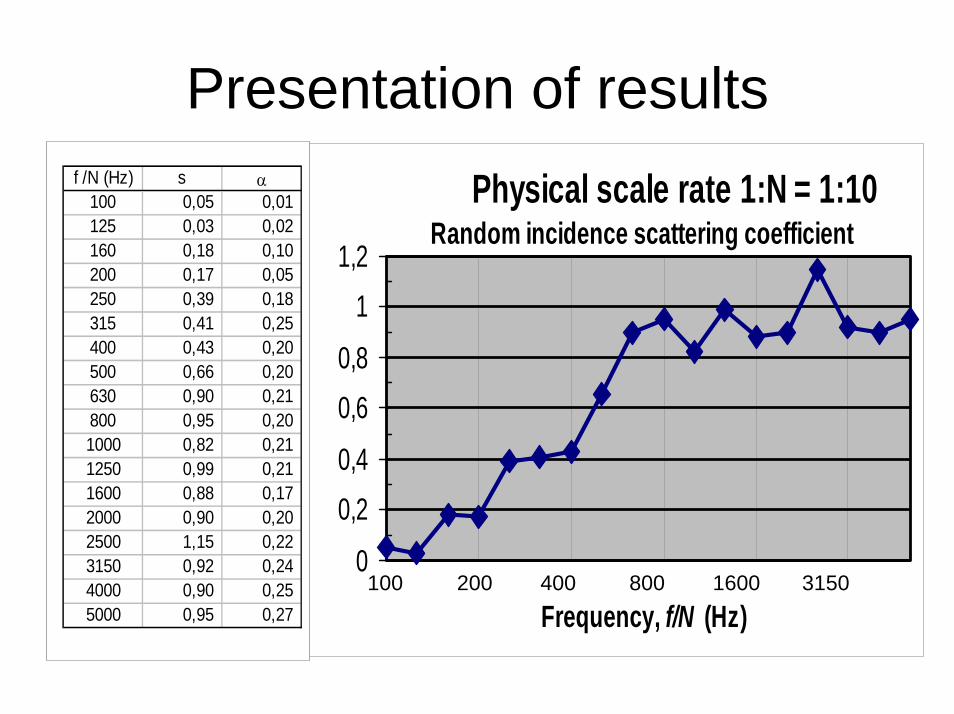
Presentation of results Physical scale rate 1:N = 1:10
Random incidence scattering coefficient
0
0,20,4
0,60,8
11,2
Frequency, f/N (Hz)
100 200 400 800 1600 3150
f /N (Hz) s α100 0,05 0,01 125 0,03 0,02 160 0,18 0,10 200 0,17 0,05 250 0,39 0,18 315 0,41 0,25 400 0,43 0,20 500 0,66 0,20 630 0,90 0,21 800 0,95 0,20 1000 0,82 0,21 1250 0,99 0,21 1600 0,88 0,17 2000 0,90 0,20 2500 1,15 0,22 3150 0,92 0,24 4000 0,90 0,25 5000 0,95 0,27
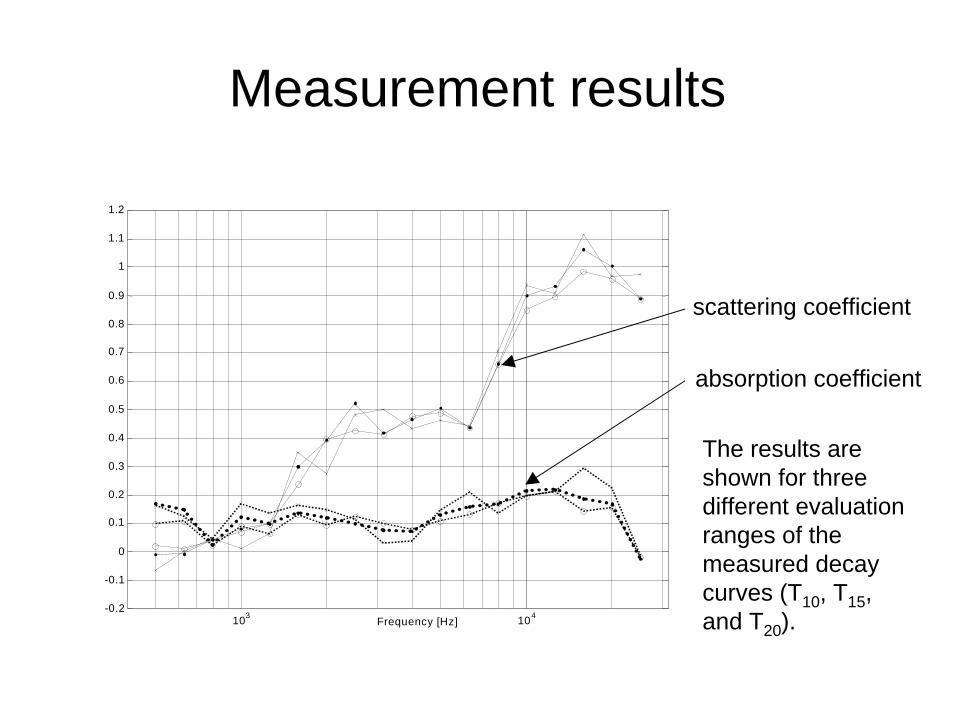
Measurement results
103 10 4 -0.2
-0.1
0
0.1
0.2
0.3
0.4
0.5
0.6
0.7
0.8
0.9
1
1.1
1.2
Frequency [Hz]
scattering coefficient
absorption coefficient
The results are shown for three different evaluation ranges of the measured decay curves (T10, T15, and T20).
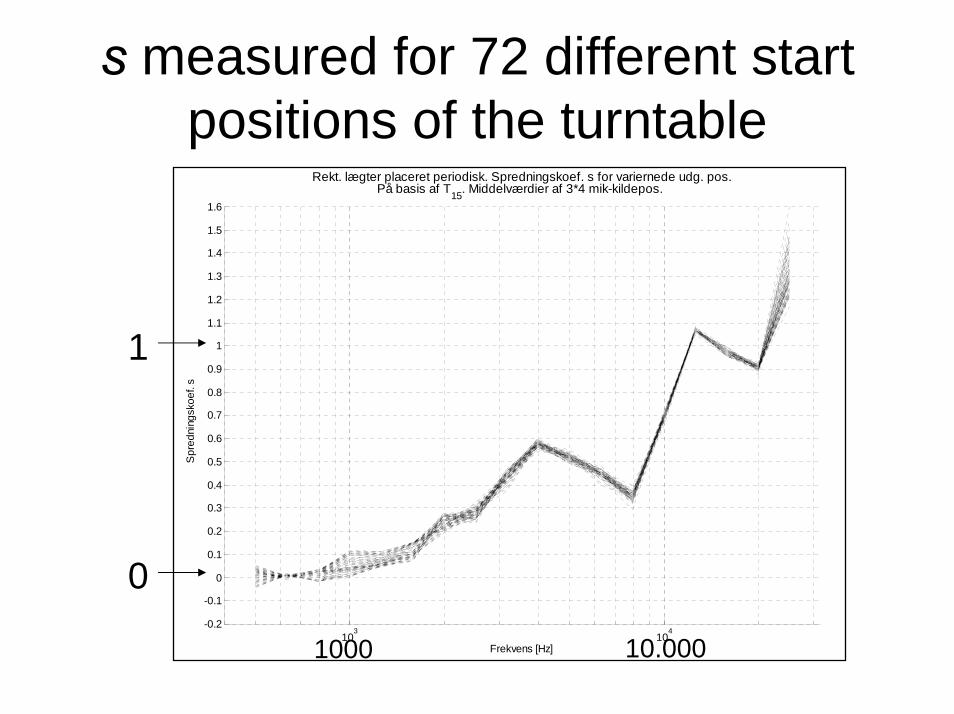
s measured for 72 different start positions of the turntable
103
104
-0.2
-0.1
0
0.1
0.2
0.3
0.4
0.5
0.6
0.7
0.8
0.9
1
1.1
1.2
1.3
1.4
1.5
1.6
Frekvens [Hz]
Spr
edni
ngsk
oef.
sRekt. lægter placeret periodisk. Spredningskoef. s for variernede udg. pos.
På basis af T15. Middelværdier af 3*4 mik-kildepos.
1
1000 10.000
0

αs measured for 72 different start positions of the turntable
103
104
-0.2
-0.1
0
0.1
0.2
0.3
0.4
0.5
0.6
Frekvens [Hz]
Alfa
sRekt. lægter placeret periodisk. Alfas for varierende udg. pos.
På basis T15 værdier. Middelværdier af 3*4 mik-kildepos.
0
0,5
1000 10.000
Some limitations in the ISO-method
• The absorption of the test sample should be low (< 0,5)
• The attenuation in the air may cause reduced accuracy at high frequencies
• The structural depth must be limited (< 1/16 diameter)
• Variation of the structure along the perimeter may cause values of s > 1
Summary of the ISO-method
• The measuring method is an extension of the traditional room-method for sound absorption
• A coherence technique is used to separate the specular reflection
• The measurements may be done in a scale model
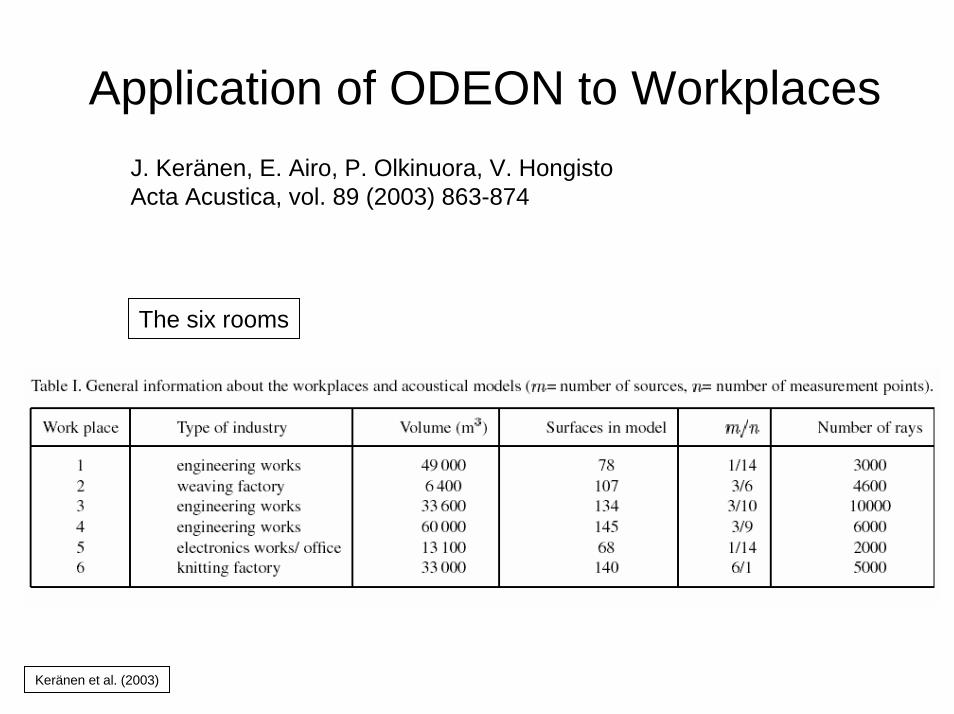
Application of ODEON to WorkplacesJ. Keränen, E. Airo, P. Olkinuora, V. HongistoActa Acustica, vol. 89 (2003) 863-874
The six rooms
Keränen et al. (2003)
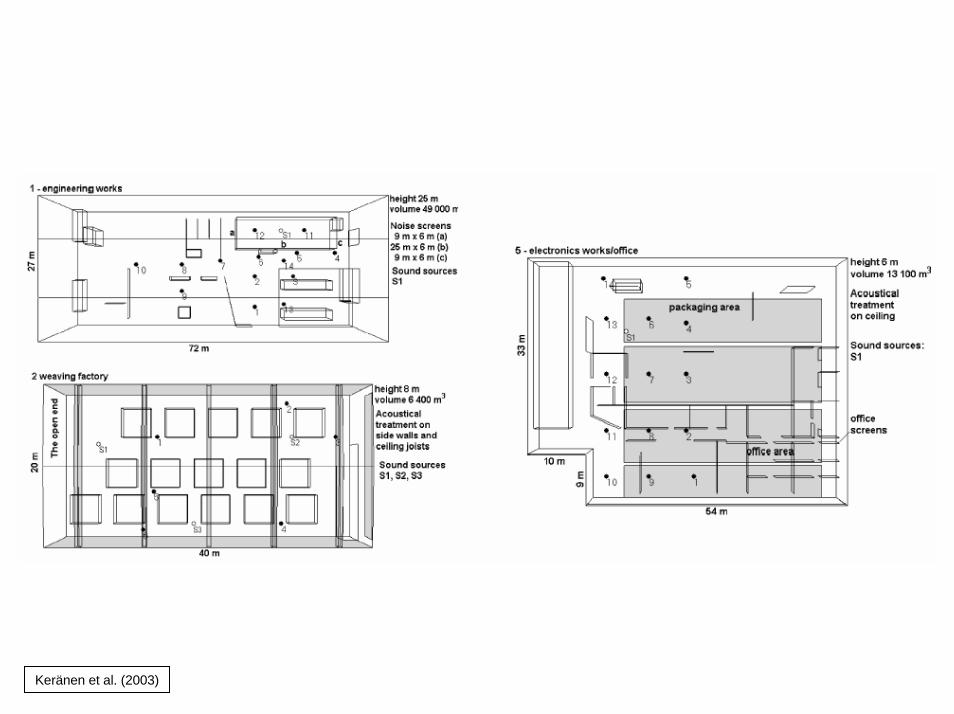
Keränen et al. (2003)
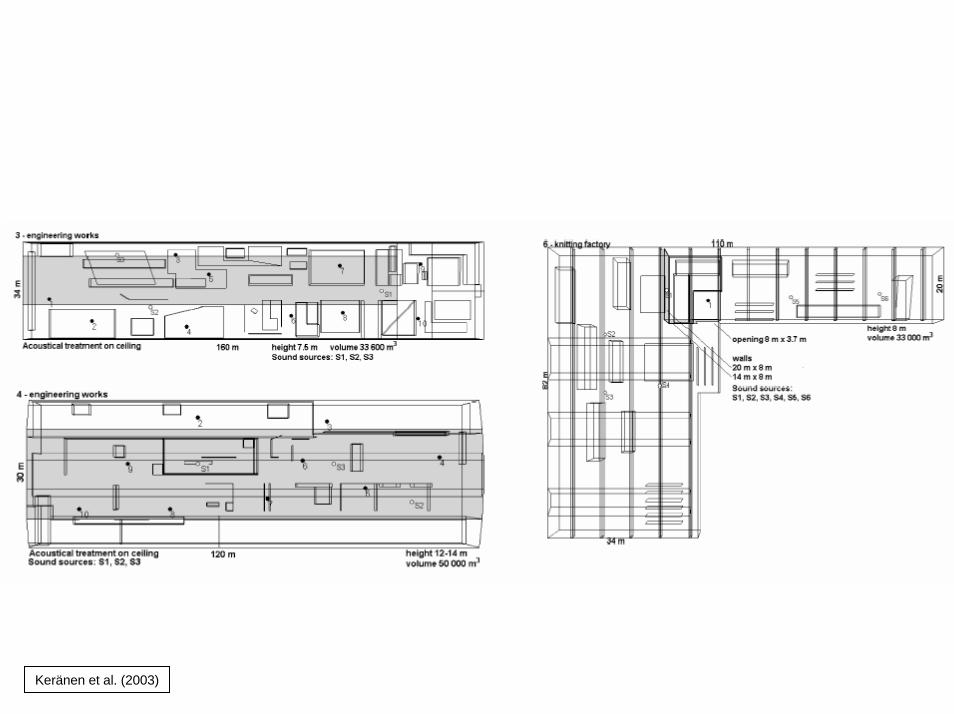
Keränen et al. (2003)
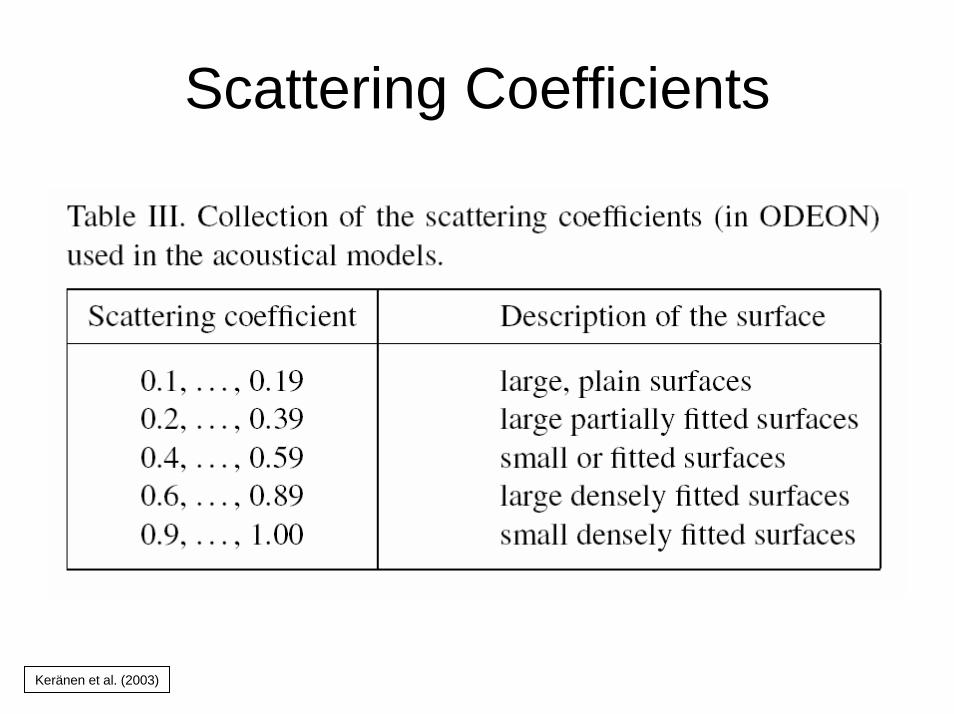
Scattering Coefficients
Keränen et al. (2003)
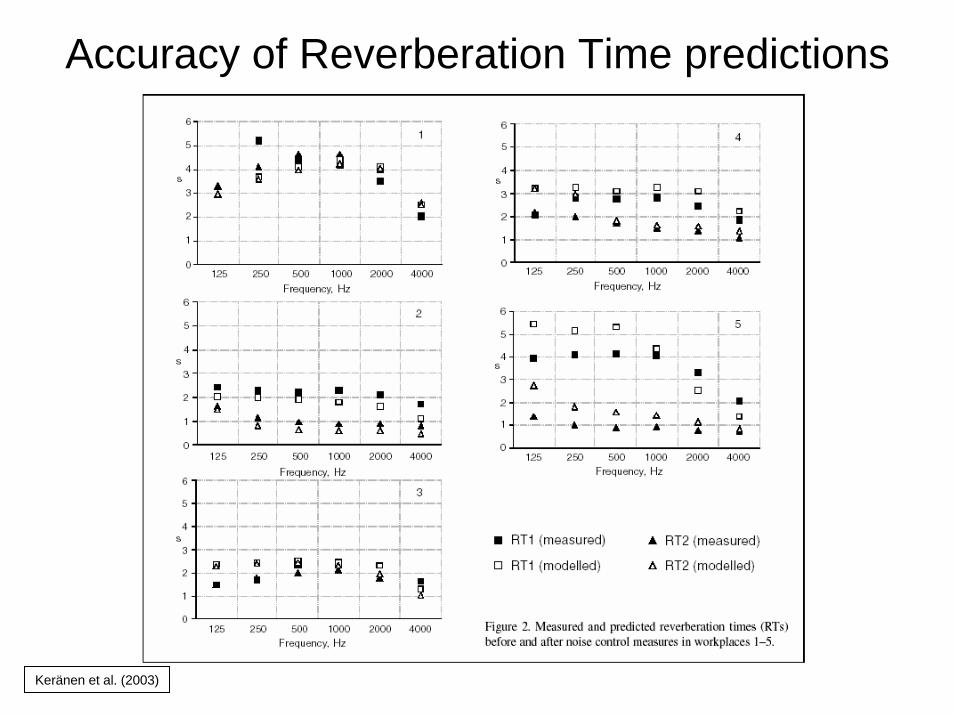
Accuracy of Reverberation Time predictions
Keränen et al. (2003)
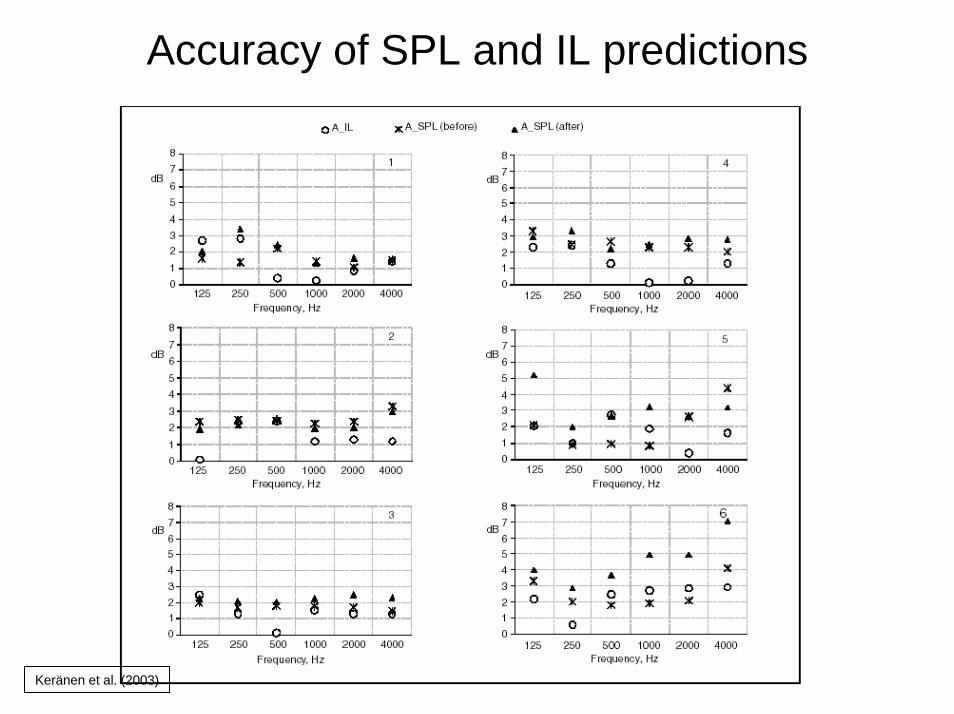
Accuracy of SPL and IL predictions
Keränen et al. (2003)
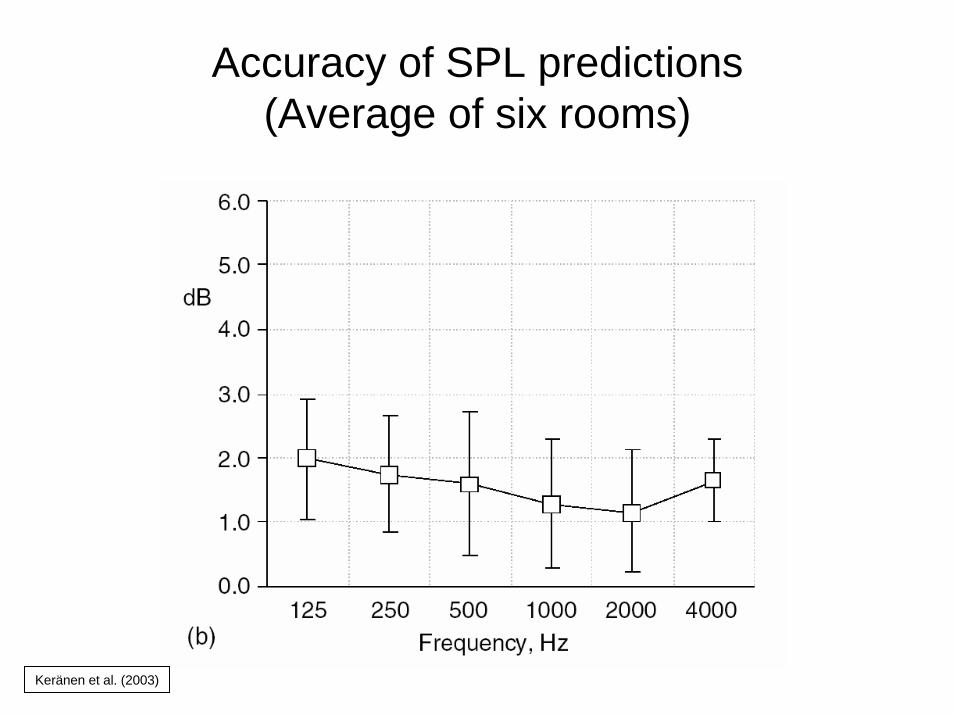
Accuracy of SPL predictions (Average of six rooms)
Keränen et al. (2003)
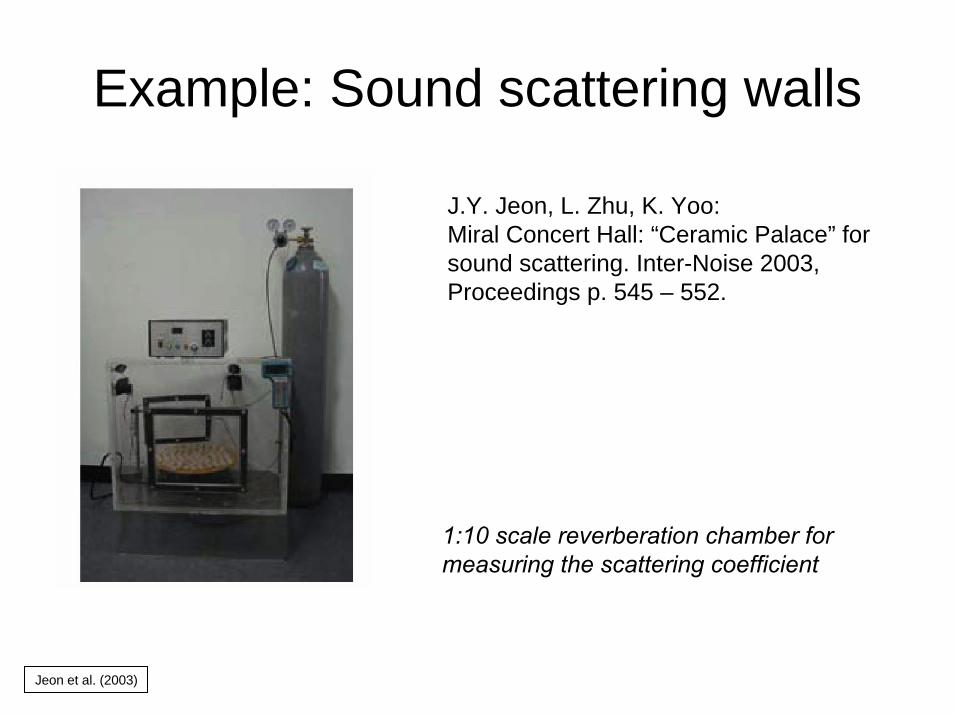
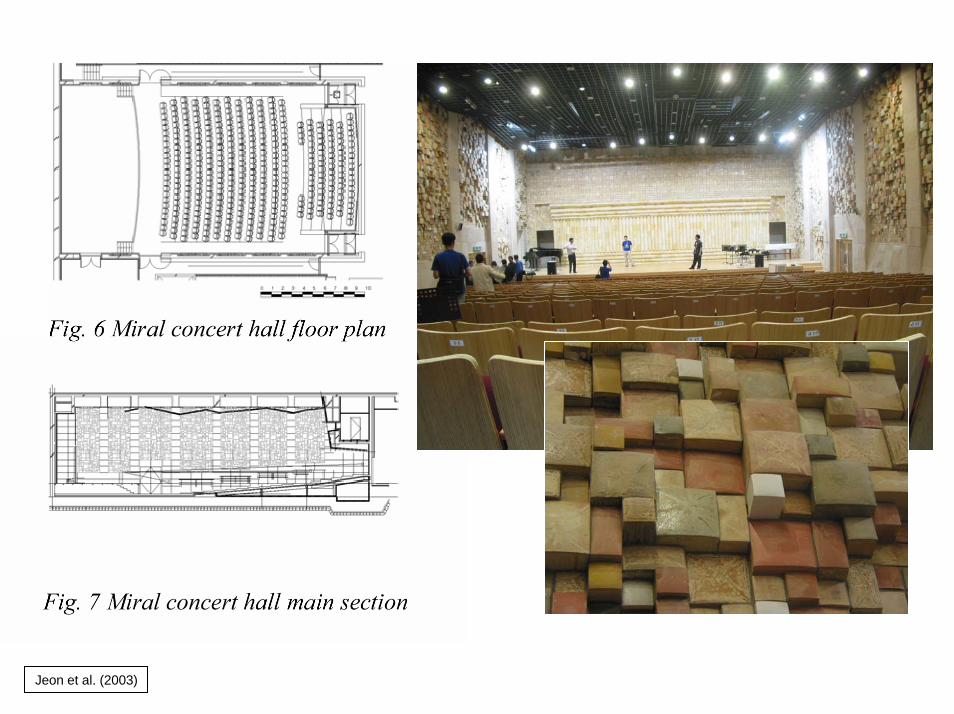
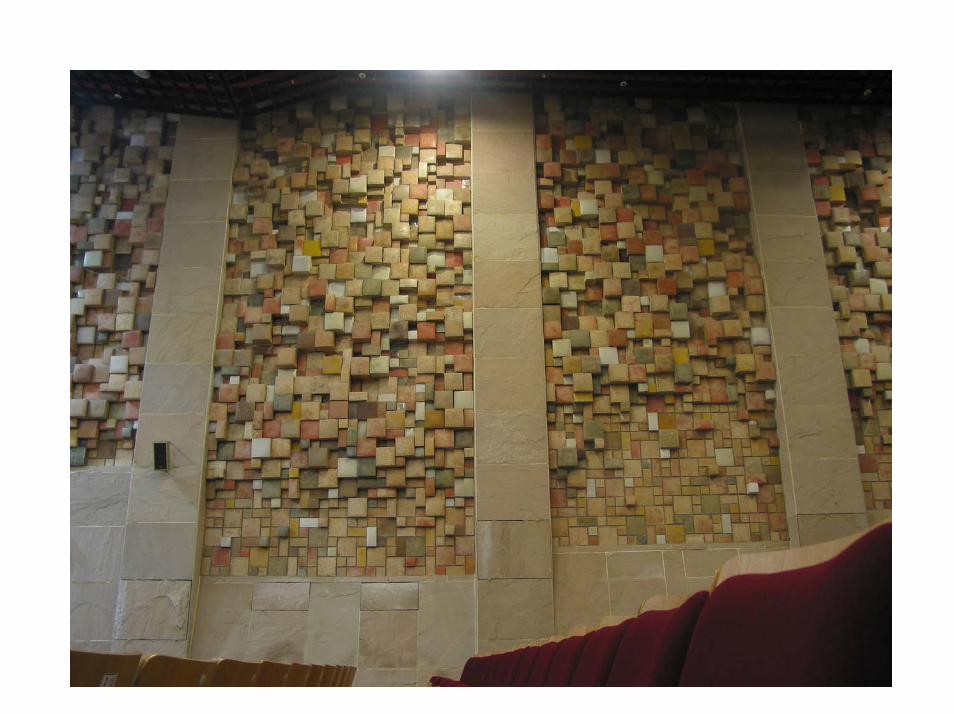
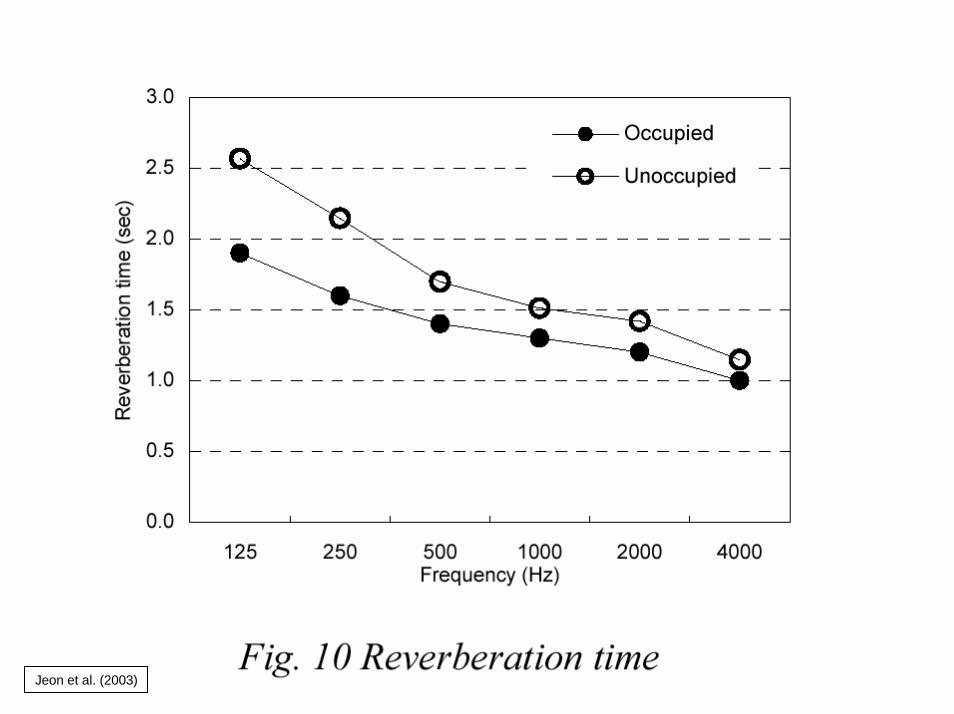
Example: Sound scattering walls
J.Y. Jeon, L. Zhu, K. Yoo:Miral Concert Hall: “Ceramic Palace” for sound scattering. Inter-Noise 2003, Proceedings p. 545 – 552.
1:10 scale reverberation chamber for measuring the scattering coefficient
Jeon et al. (2003)
Jeon et al. (2003)
Jeon et al. (2003)
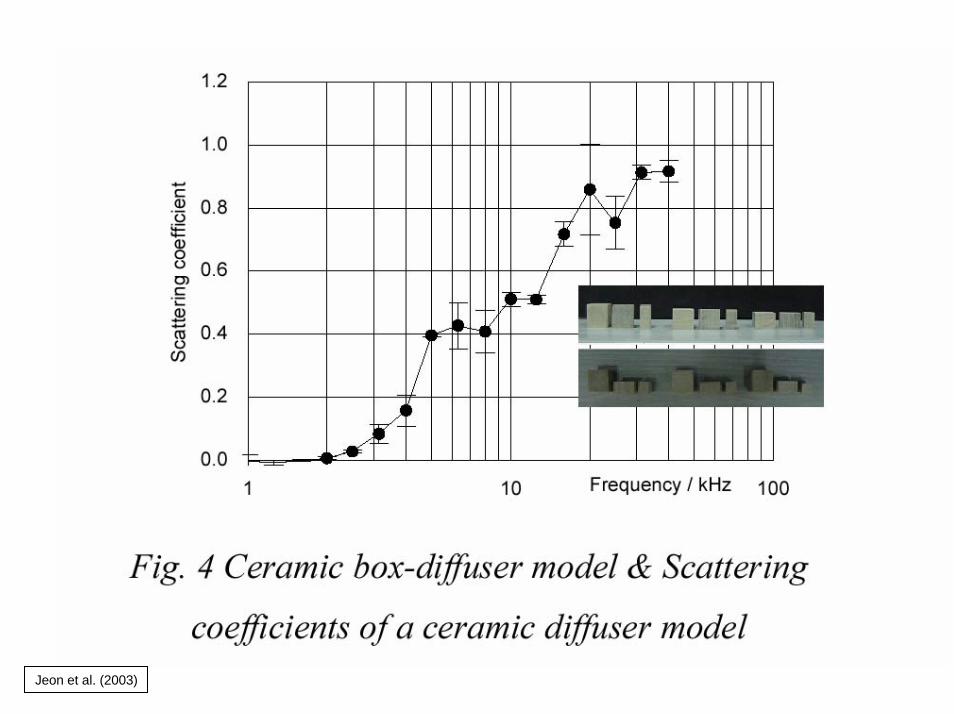
Jeon et al. (2003)
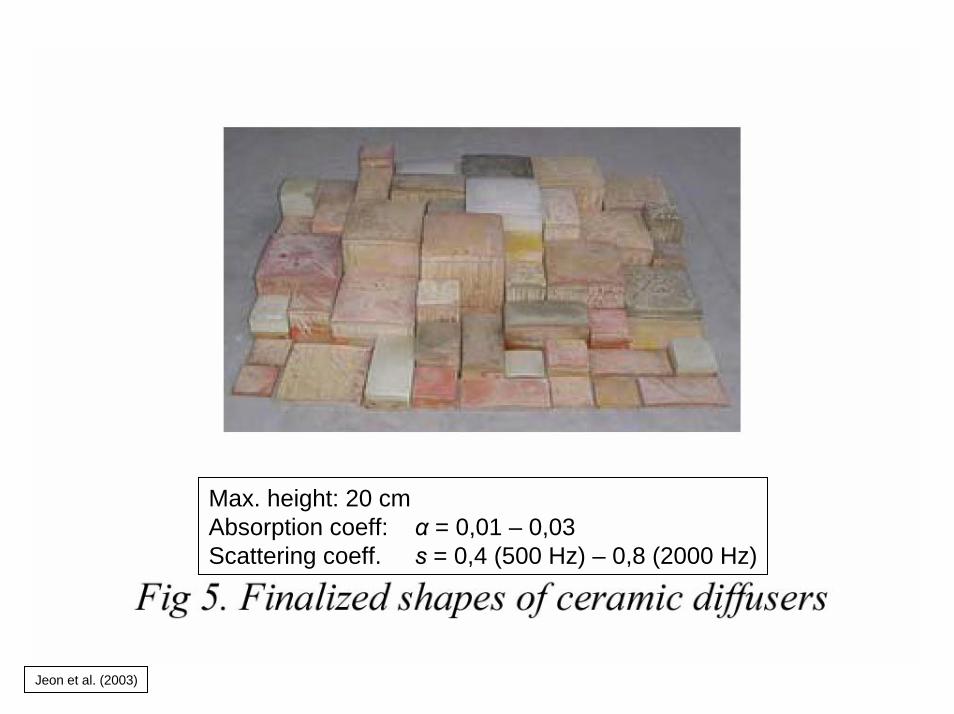
Max. height: 20 cmAbsorption coeff: α = 0,01 – 0,03Scattering coeff. s = 0,4 (500 Hz) – 0,8 (2000 Hz)
Jeon et al. (2003)
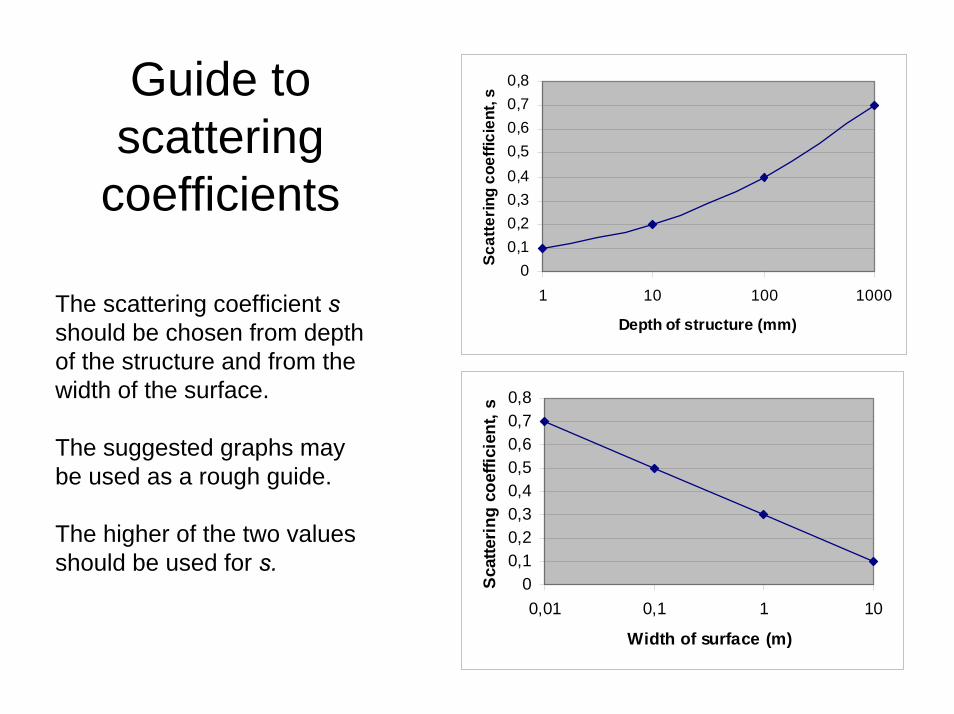
Guide to scattering
coefficients0
0,10,20,30,40,50,60,70,8
1 10 100 1000
Depth of structure (mm)
Scat
terin
g co
effic
ient
, s
00,10,20,30,40,50,60,70,8
0,01 0,1 1 10
Width of surface (m)
Scat
terin
g co
effic
ient
, s
The scattering coefficient sshould be chosen from depth of the structure and from the width of the surface.
The suggested graphs may be used as a rough guide.
The higher of the two values should be used for s.