Observations of the Crab Nebula and Pulsar
20
Observations of the Crab Nebula and Pulsar with the Solar Tower Atmospheric Cherenkov Effect Experiment John Kildea McGill University, Montr´ eal, on behalf of the STACEE Collaboration
Transcript of Observations of the Crab Nebula and Pulsar

Observations of the Crab Nebula and Pulsar
with
the Solar Tower Atmospheric CherenkovEffect Experiment
John KildeaMcGill University, Montreal,
on behalf of the STACEE Collaboration
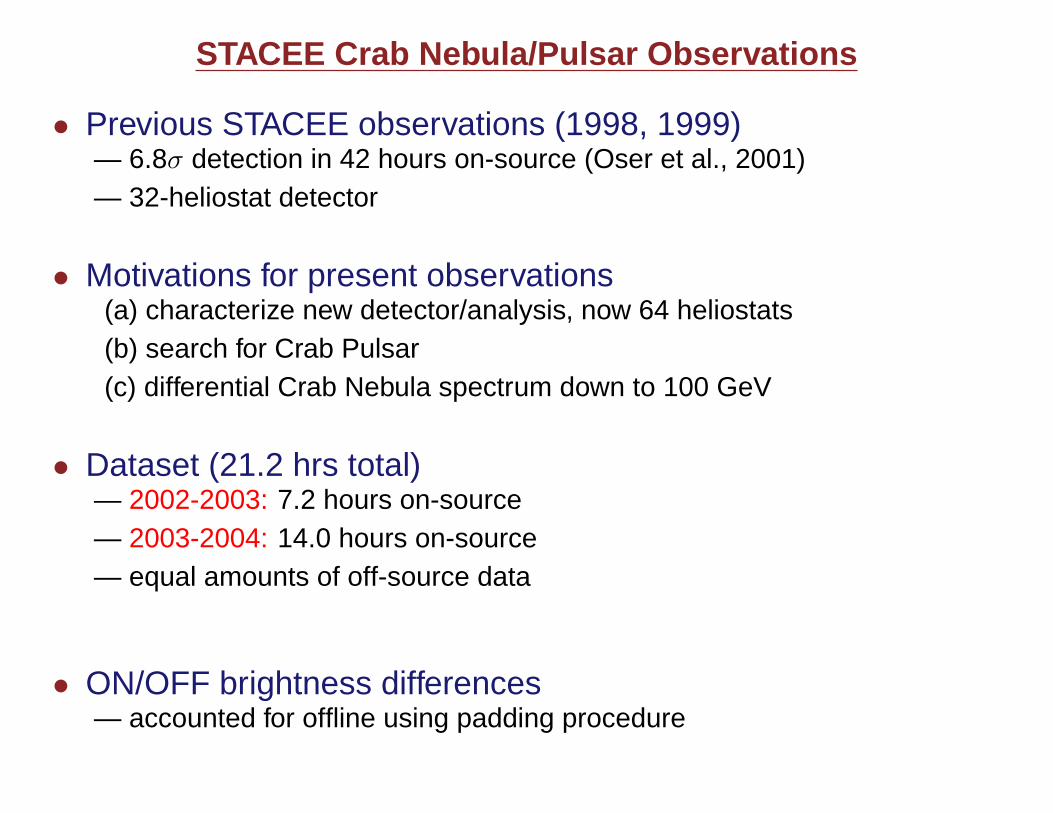
1STACEE Crab Nebula/Pulsar Observations
• Previous STACEE observations (1998, 1999)— 6.8σ detection in 42 hours on-source (Oser et al., 2001)— 32-heliostat detector
• Motivations for present observations—(a) characterize new detector/analysis, now 64 heliostats—(b) search for Crab Pulsar—(c) differential Crab Nebula spectrum down to 100 GeV
• Dataset (21.2 hrs total)— 2002-2003: 7.2 hours on-source— 2003-2004: 14.0 hours on-source— equal amounts of off-source data
• ON/OFF brightness differences— accounted for offline using padding procedure
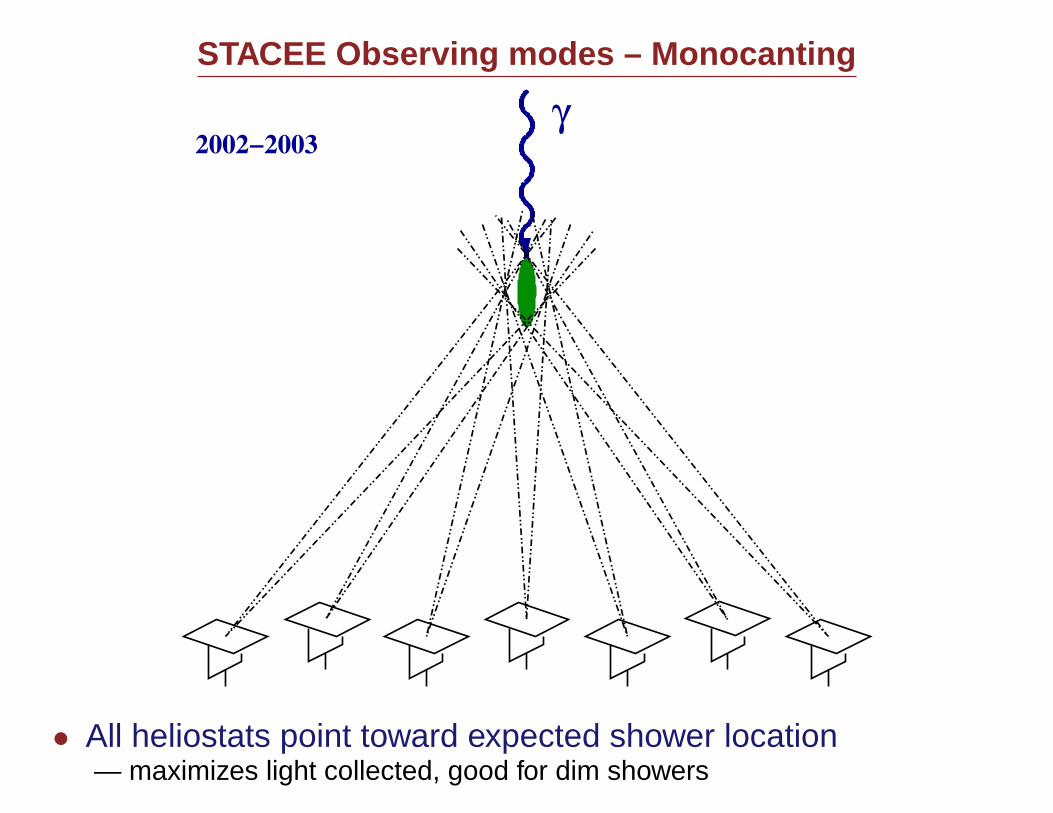
2STACEE Observing modes – Monocanting
γ2002−2003
• All heliostats point toward expected shower location— maximizes light collected, good for dim showers
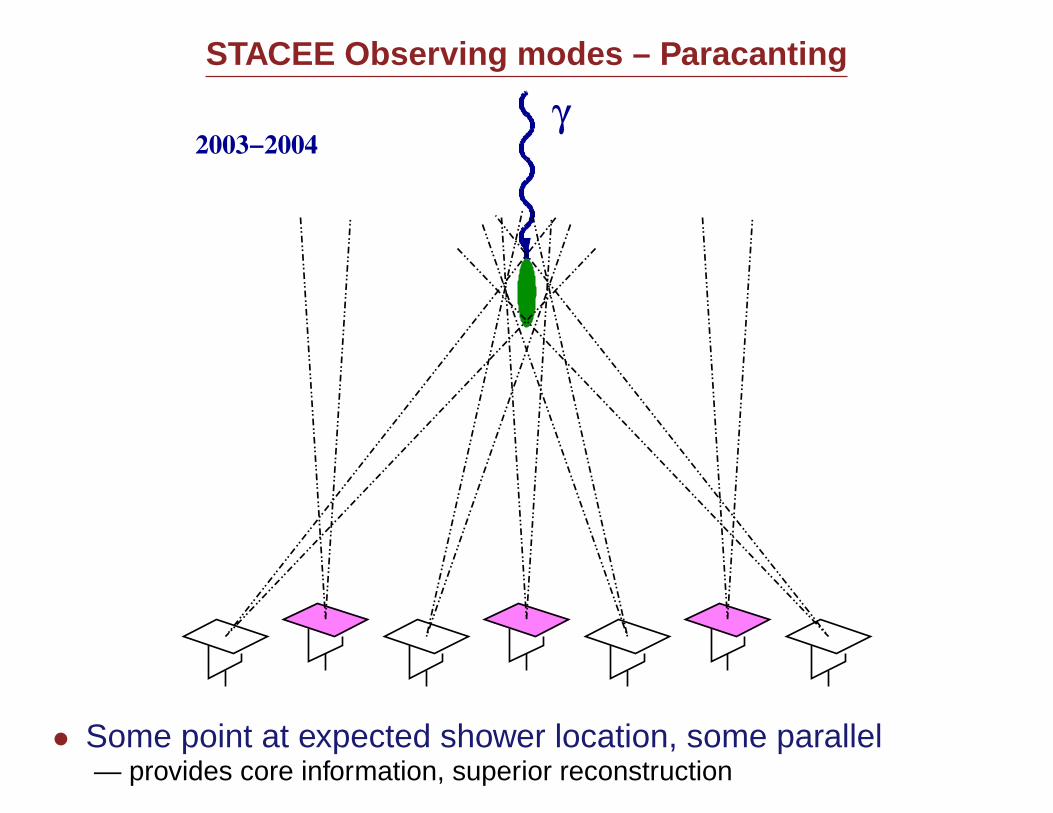
3STACEE Observing modes – Paracanting
γ2003−2004
• Some point at expected shower location, some parallel— provides core information, superior reconstruction

4Shower Reconstruction and Gamma/Hadron Separation
γ −rays~10 km
~130 m
~240 m
Show
er C
ore
gamma−ray
Second, select− shower direction parameter− grid ratio parameter
First, find the shower core
− see STACEE reconstruction poster− three independent methods
.
.
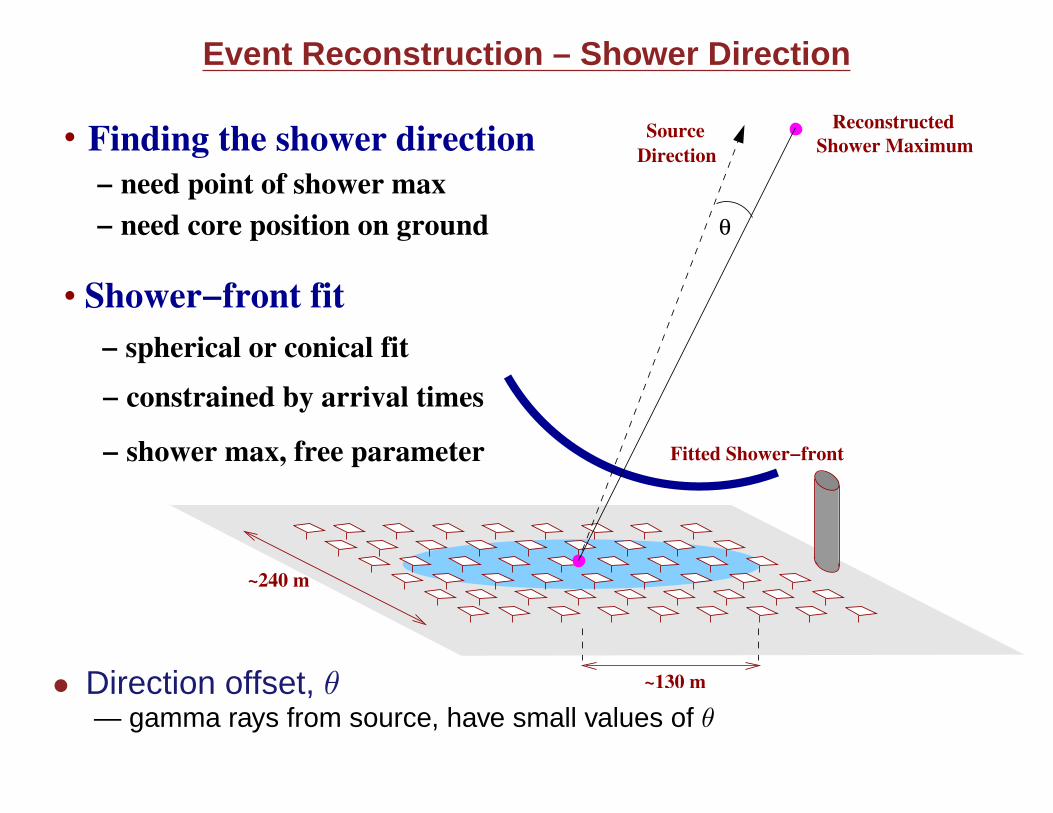
5Event Reconstruction – Shower Direction
DirectionSource
Shower MaximumReconstructed
~130 m
~240 m
. Shower−front fit
− constrained by arrival times
− shower max, free parameter
− spherical or conical fit
Finding the shower direction− need point of shower max− need core position on ground
.
Fitted Shower−front
θ
• Direction offset, θ— gamma rays from source, have small values of θ

6Gamma/Hadron Separation – Shower Direction
(mrad)θ0 5 10 15 20 25 30 35
Nor
mal
ised
Pop
ulat
ion
0
0.1
0.2
0.3
0.4
0.5
0.6
0.7
0.8
(mrad)θ0 5 10 15 20 25 30 35
Nor
mal
ised
Pop
ulat
ion
0
0.1
0.2
0.3
0.4
0.5
0.6
0.7
0.8
(mrad)θ0 5 10 15 20 25 30 35
Nor
mal
ised
Pop
ulat
ion
0
0.1
0.2
0.3
0.4
0.5
0.6
0.7
0.8 Gamma-raysProtons
• Simulated data— θ is a good gamma/hadron separation parameter for STACEE∗
∗Bins have equal area on the sky
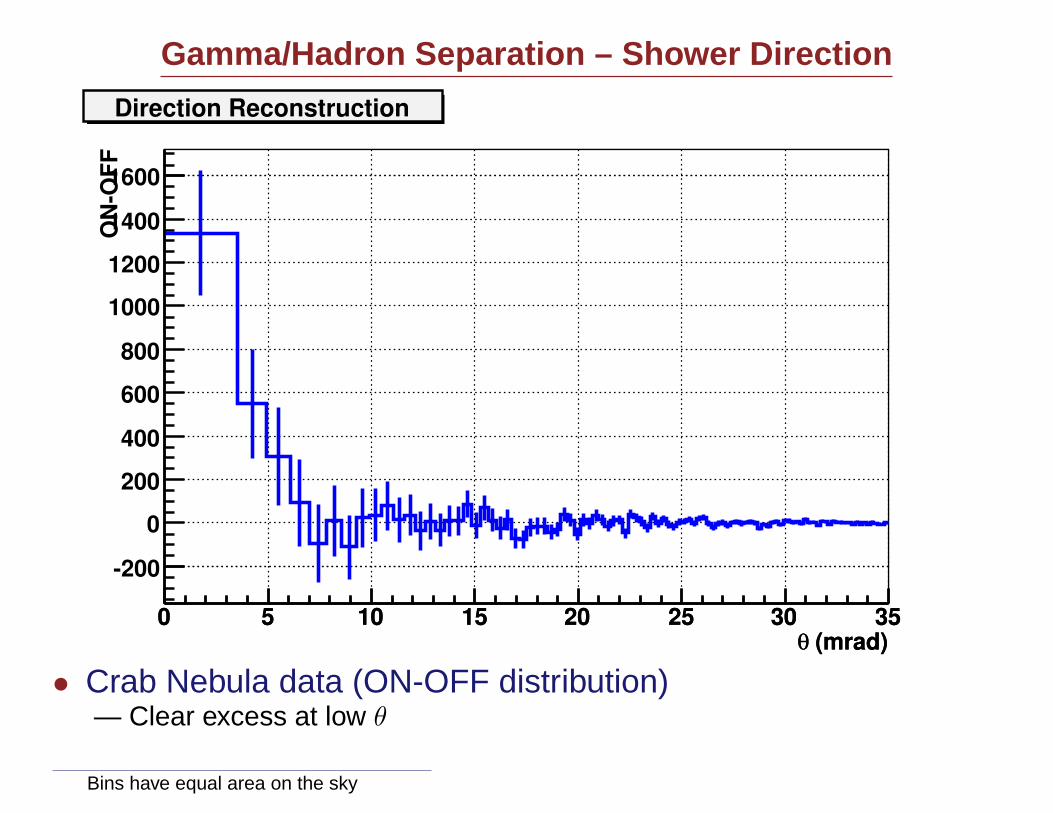
7Gamma/Hadron Separation – Shower Direction
(mrad)θ0 5 10 15 20 25 30 35
(mrad)θ0 5 10 15 20 25 30 35
ON
-OFF
-200
0
200
400
600
800
1000
1200
1400
1600
Direction Reconstruction
• Crab Nebula data (ON-OFF distribution)— Clear excess at low θ∗
∗Bins have equal area on the sky
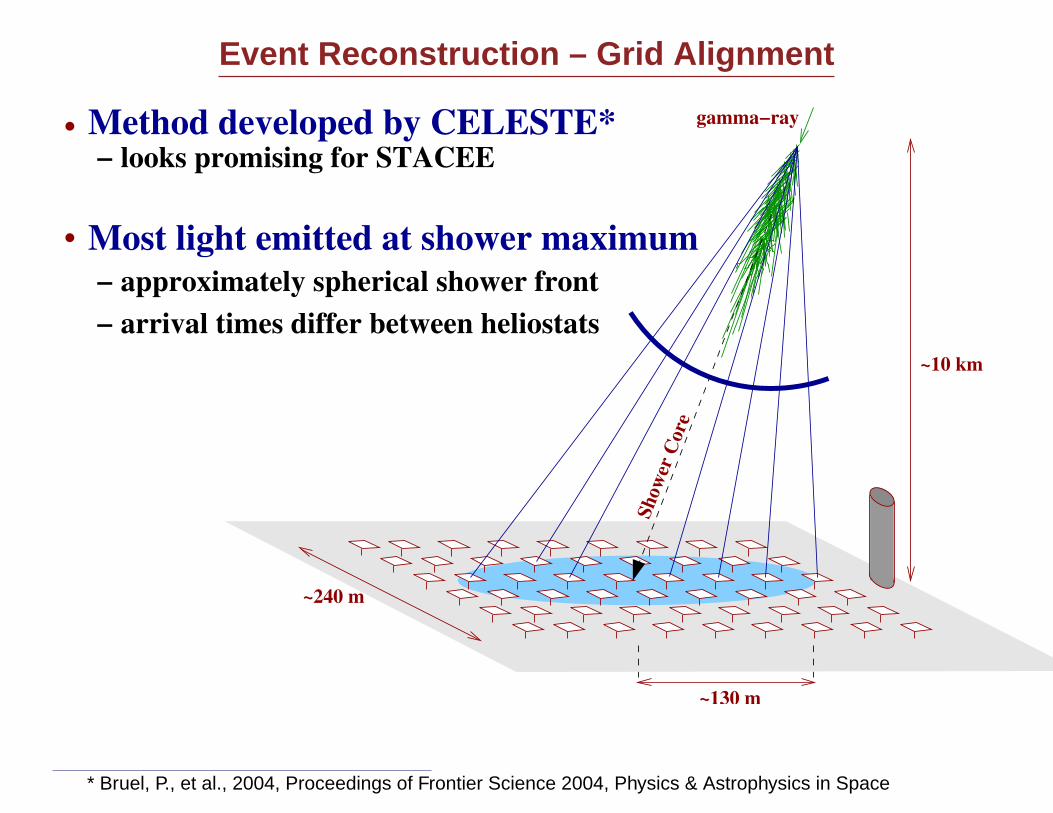
8Event Reconstruction – Grid Alignment
~10 km
~130 m
~240 m
gamma−ray
Show
er C
ore
Most light emitted at shower maximum− approximately spherical shower front− arrival times differ between heliostats
Method developed by CELESTE*
.− looks promising for STACEE
.
CELESTE∗∗* Bruel, P., et al., 2004, Proceedings of Frontier Science 2004, Physics & Astrophysics in Space
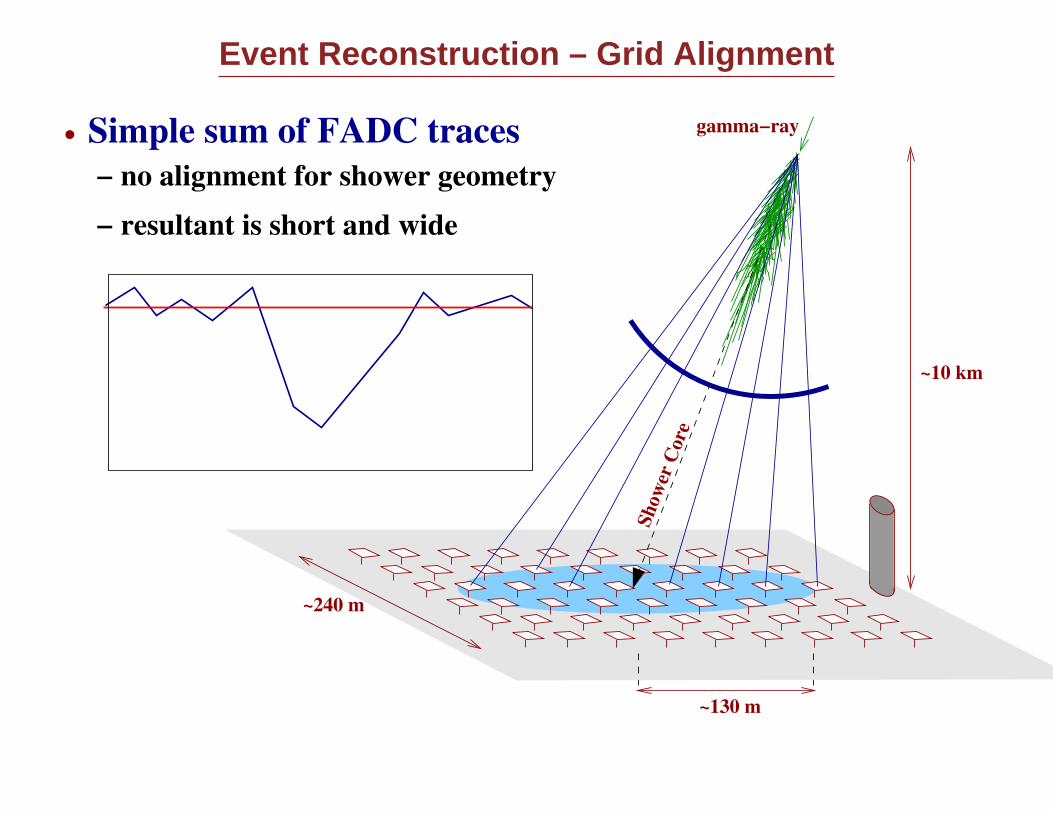
9Event Reconstruction – Grid Alignment
~10 km
~130 m
~240 m
gamma−ray
Show
er C
ore
Simple sum of FADC traces.− no alignment for shower geometry
− resultant is short and wide

10Event Reconstruction – Grid Alignment
~10 km
~130 m
~240 m
gamma−ray
Show
er C
ore
Account for shower geometry.− realign and resum traces
− resultant is tall and narrow
H
W
— of course, we don’t know where the shower max is!
11Event Reconstruction – Grid Alignment
~10 km
~130 m
~240 m
gamma−ray
Show
er C
ore
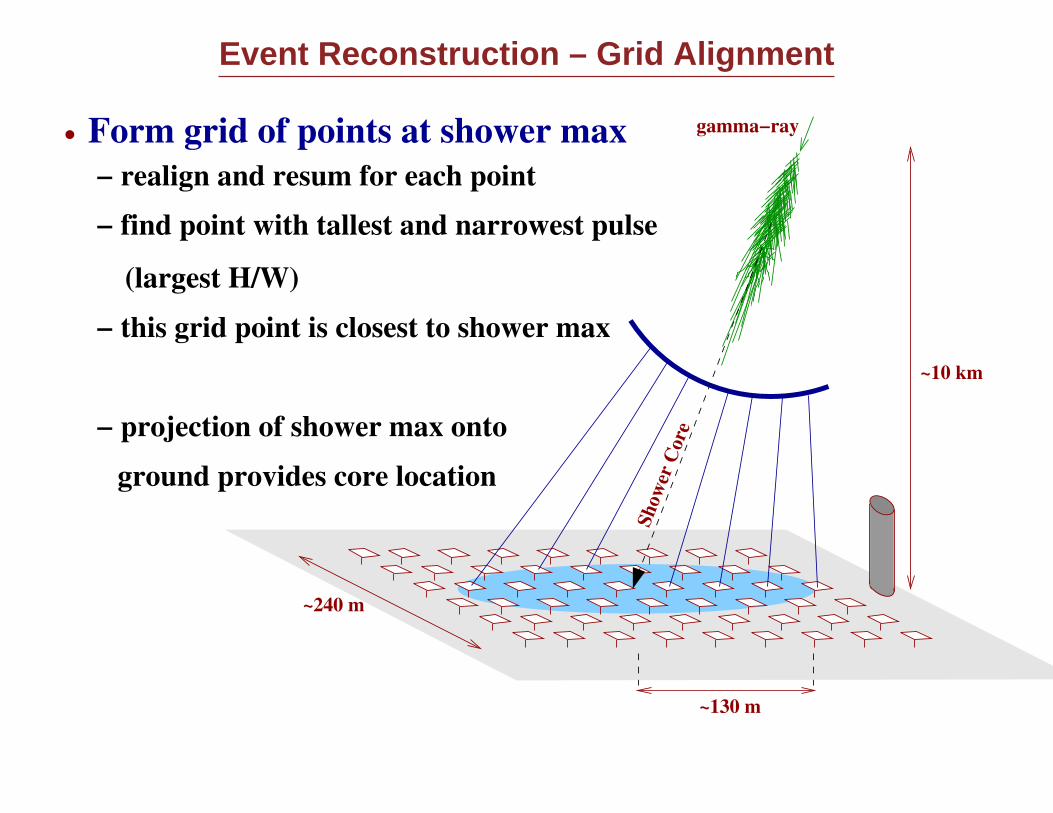
Form grid of points at shower max.− realign and resum for each point
− find point with tallest and narrowest pulse
(largest H/W)
− projection of shower max onto
ground provides core location
− this grid point is closest to shower max
12Gamma/Hadron Separation – Grid Alignment
X (m)-200 -150 -100 -50 0 50 100 150 200
Y (m)
-100-50
050
100150
200250
300
H/W
(mV
/ns)
0
500
1000
1500
2000
2500
X (m)-200 -150 -100 -50 0 50 100 150 200
Y (m)
-100-50
050
100150
200250
300
H/W
(mV
/ns)
0200400600800
10001200140016001800
X (m)X (m)
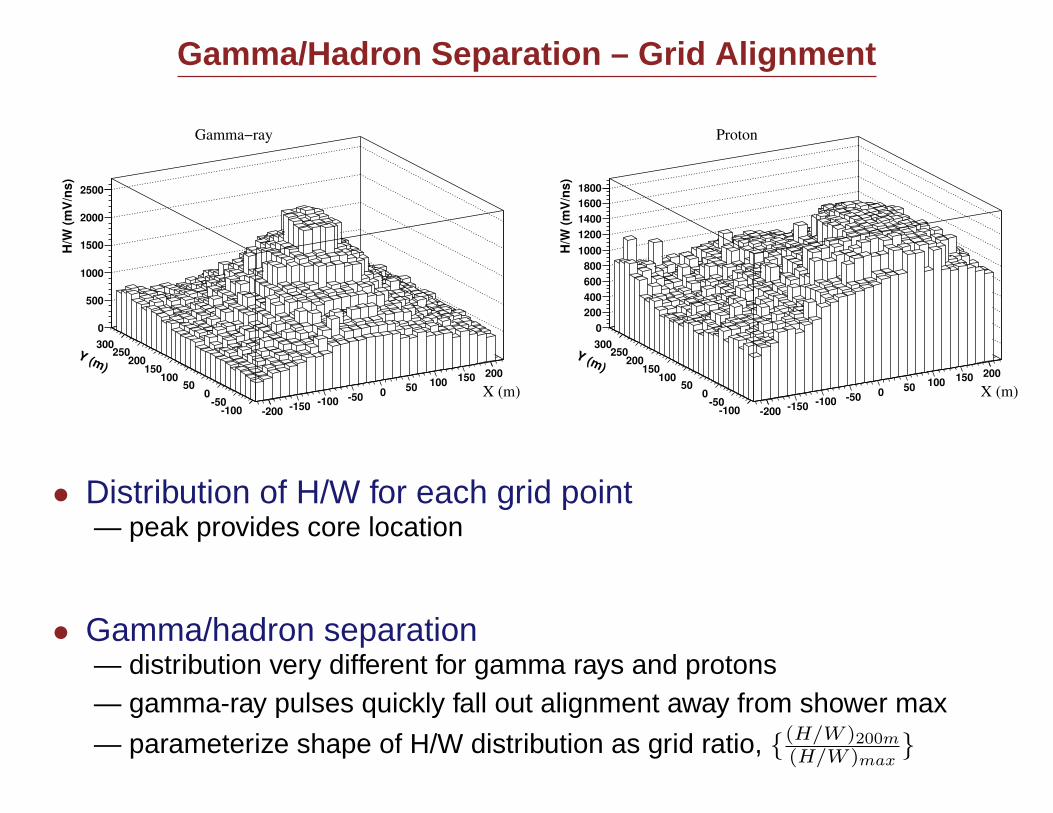
Gamma−ray Proton
• Distribution of H/W for each grid point— peak provides core location
• Gamma/hadron separation— distribution very different for gamma rays and protons— gamma-ray pulses quickly fall out alignment away from shower max
— parameterize shape of H/W distribution as grid ratio, {(H/W )200m(H/W )max
}
13Gamma/Hadron Separation – Grid Ratio
]max
]/[(H/W)200m
[(H/W)0 0.1 0.2 0.3 0.4 0.5 0.6 0.7 0.8 0.9 1
]max
]/[(H/W)200m
[(H/W)0 0.1 0.2 0.3 0.4 0.5 0.6 0.7 0.8 0.9 1
Nor
mal
ised
Pop
ulat
ion
0
0.05
0.1
0.15
0.2
0.25
0.3
0.35
0.4
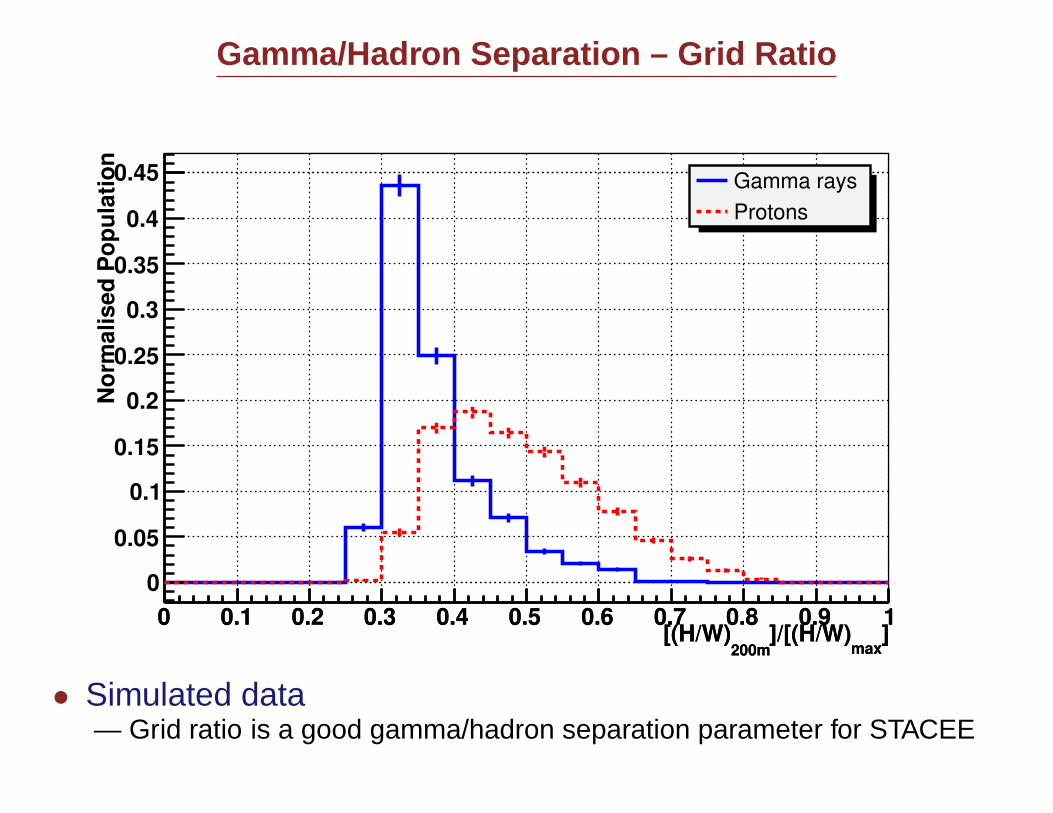
0.45 Gamma raysProtons
• Simulated data— Grid ratio is a good gamma/hadron separation parameter for STACEE
14Gamma/Hadron Separation – Grid Ratio
]max/(H/L)200mGridRatio [(H/L)0 0.1 0.2 0.3 0.4 0.5 0.6 0.7 0.8 0.9
]max/(H/L)200mGridRatio [(H/L)0 0.1 0.2 0.3 0.4 0.5 0.6 0.7 0.8 0.9
Pop
ulat
ion
0
1000
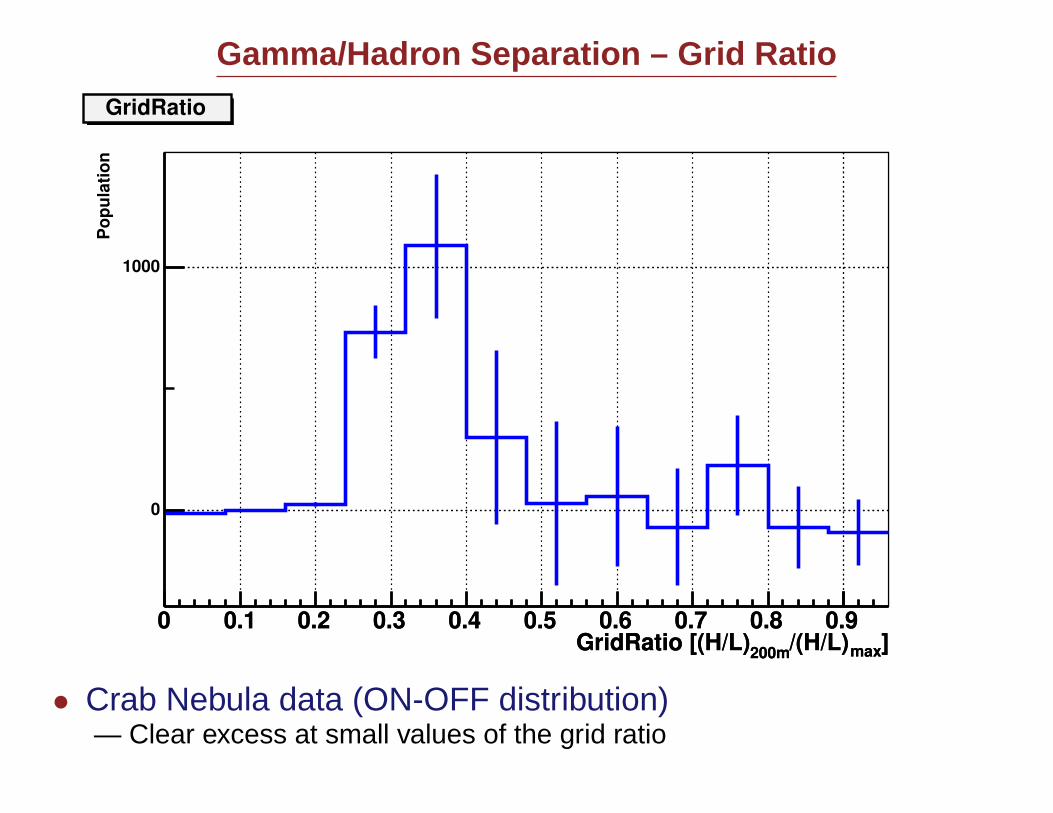
GridRatio
• Crab Nebula data (ON-OFF distribution)— Clear excess at small values of the grid ratio
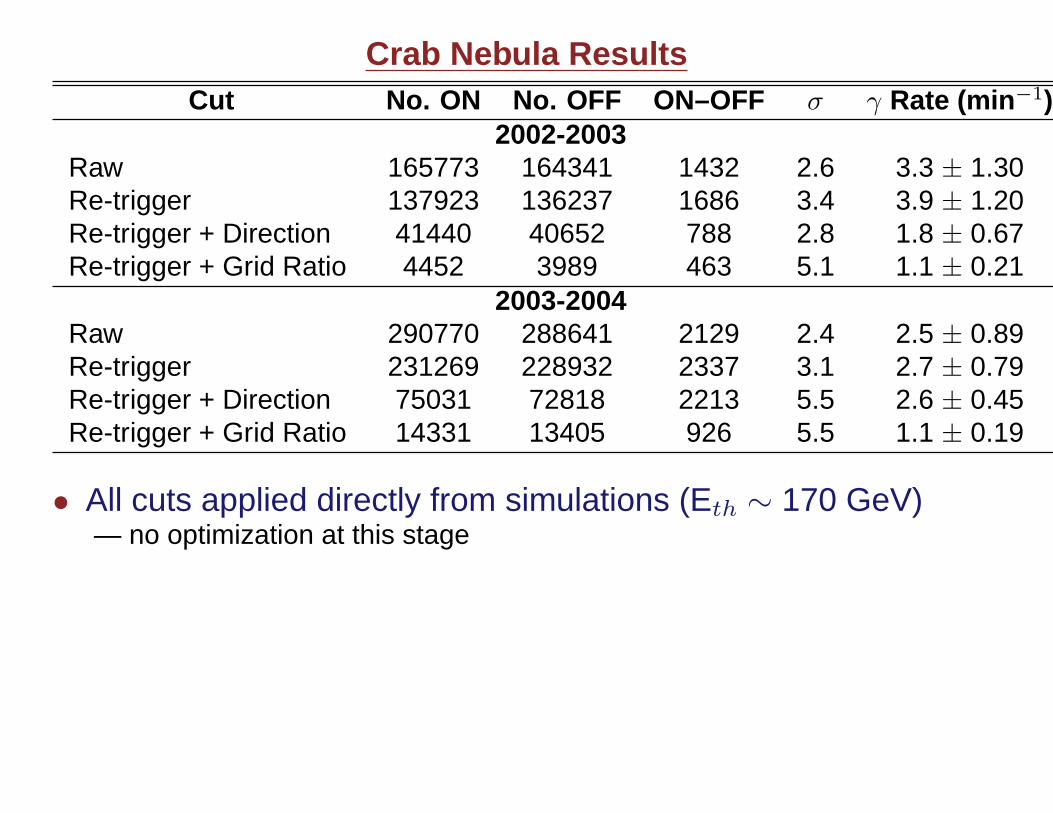
15Crab Nebula ResultsCut No. ON No. OFF ON–OFF σ γ Rate (min −1)
2002-2003Raw 165773 164341 1432 2.6 3.3 ± 1.30Re-trigger 137923 136237 1686 3.4 3.9 ± 1.20Re-trigger + Direction 41440 40652 788 2.8 1.8 ± 0.67Re-trigger + Grid Ratio 4452 3989 463 5.1 1.1 ± 0.21
2003-2004Raw 290770 288641 2129 2.4 2.5 ± 0.89Re-trigger 231269 228932 2337 3.1 2.7 ± 0.79Re-trigger + Direction 75031 72818 2213 5.5 2.6 ± 0.45Re-trigger + Grid Ratio 14331 13405 926 5.5 1.1 ± 0.19
• All cuts applied directly from simulations (Eth ∼ 170 GeV)— no optimization at this stage

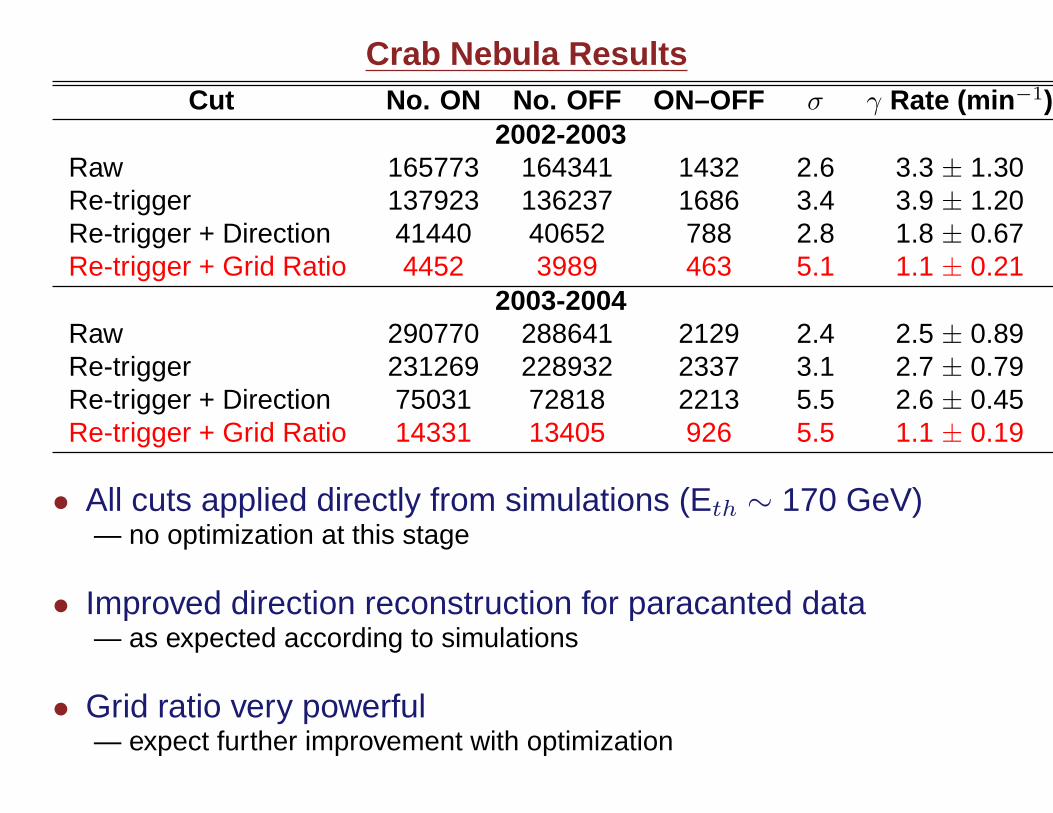
16Crab Nebula ResultsCut No. ON No. OFF ON–OFF σ γ Rate (min −1)
2002-2003Raw 165773 164341 1432 2.6 3.3 ± 1.30Re-trigger 137923 136237 1686 3.4 3.9 ± 1.20Re-trigger + Direction 41440 40652 788 2.8 1.8 ± 0.67Re-trigger + Grid Ratio 4452 3989 463 5.1 1.1 ± 0.21
2003-2004Raw 290770 288641 2129 2.4 2.5 ± 0.89Re-trigger 231269 228932 2337 3.1 2.7 ± 0.79Re-trigger + Direction 75031 72818 2213 5.5 2.6 ± 0.45Re-trigger + Grid Ratio 14331 13405 926 5.5 1.1 ± 0.19
• All cuts applied directly from simulations (Eth ∼ 170 GeV)— no optimization at this stage
• Improved direction reconstruction for paracanted data— as expected according to simulations
17Crab Nebula ResultsCut No. ON No. OFF ON–OFF σ γ Rate (min −1)
2002-2003Raw 165773 164341 1432 2.6 3.3 ± 1.30Re-trigger 137923 136237 1686 3.4 3.9 ± 1.20Re-trigger + Direction 41440 40652 788 2.8 1.8 ± 0.67Re-trigger + Grid Ratio 4452 3989 463 5.1 1.1 ± 0.21
2003-2004Raw 290770 288641 2129 2.4 2.5 ± 0.89Re-trigger 231269 228932 2337 3.1 2.7 ± 0.79Re-trigger + Direction 75031 72818 2213 5.5 2.6 ± 0.45Re-trigger + Grid Ratio 14331 13405 926 5.5 1.1 ± 0.19
• All cuts applied directly from simulations (Eth ∼ 170 GeV)— no optimization at this stage
• Improved direction reconstruction for paracanted data— as expected according to simulations
• Grid ratio very powerful— expect further improvement with optimization
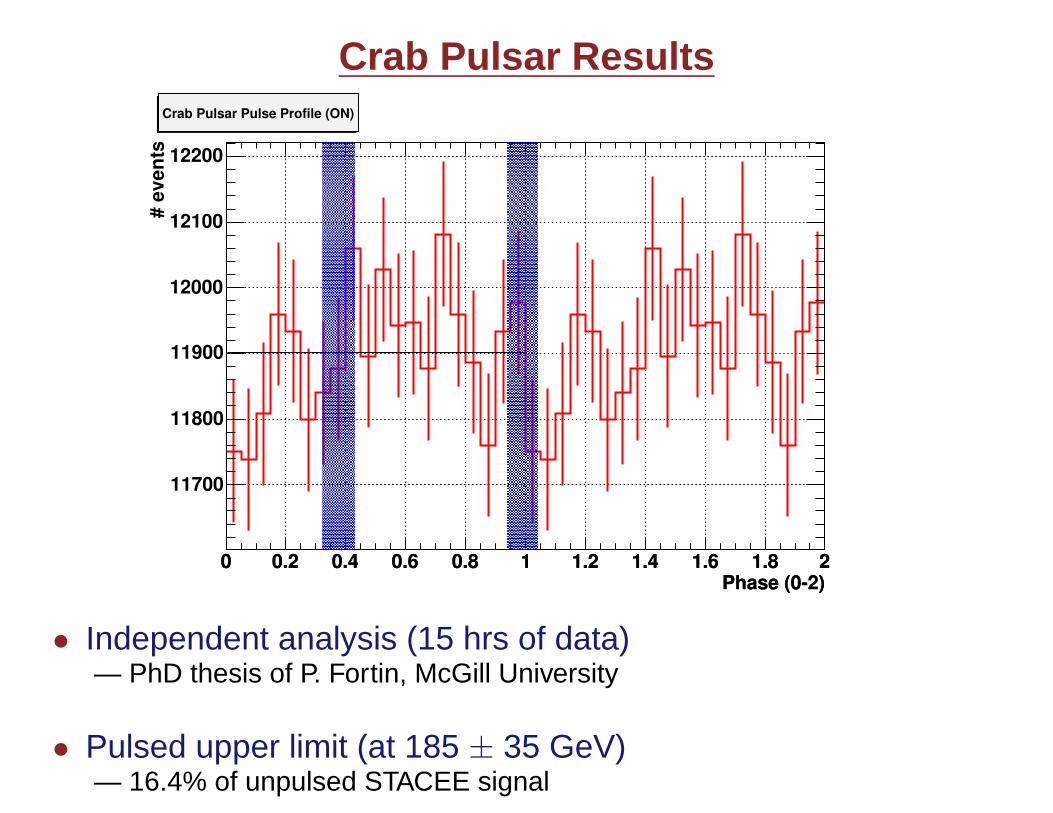
18Crab Pulsar Results
Phase (0-2)0 0.2 0.4 0.6 0.8 1 1.2 1.4 1.6 1.8 2
Phase (0-2)0 0.2 0.4 0.6 0.8 1 1.2 1.4 1.6 1.8 2
# ev
ents
11700
11800
11900
12000
12100
12200
Crab Pulsar Pulse Profile (ON)
• Independent analysis (15 hrs of data)— PhD thesis of P. Fortin, McGill University
• Pulsed upper limit (at 185 ± 35 GeV)— 16.4% of unpulsed STACEE signal

19Conclusions
• STACEE Crab Nebula detection— clear detection in both years with different pointing strategies— non-optimized cuts
• Crab Pulsar upper limits— 16.4% of unpulsed signal at 185 ± 35 GeV— expect improvement with low-energy event selection— (down to ∼50 GeV)
• Looking ahead...— spectral analysis underway (see Mkn 421 talk by Jennifer Carson)— event reconstruction methods look promising— proceeding systematically (understand cuts, optimize, apply)— perform analysis on other sources