
Obesity: Management of the Burgeoning Waistline Management of the Burgeoning Waistline Osama Hamdy,...
62
Obesity: Management of the Burgeoning Waistline Osama Hamdy, MD, PhD, FACE Director, Obesity Clinical Program Joslin Diabetes Center Harvard Medical School Boston, MA
Transcript of Obesity: Management of the Burgeoning Waistline Management of the Burgeoning Waistline Osama Hamdy,...
Obesity: Management of the Burgeoning Waistline
Osama Hamdy, MD, PhD, FACE Director, Obesity Clinical Program Joslin Diabetes Center Harvard Medical School Boston, MA

Evolution of our concepts of the value of body fat
2015 B.C. 2015 A.C.

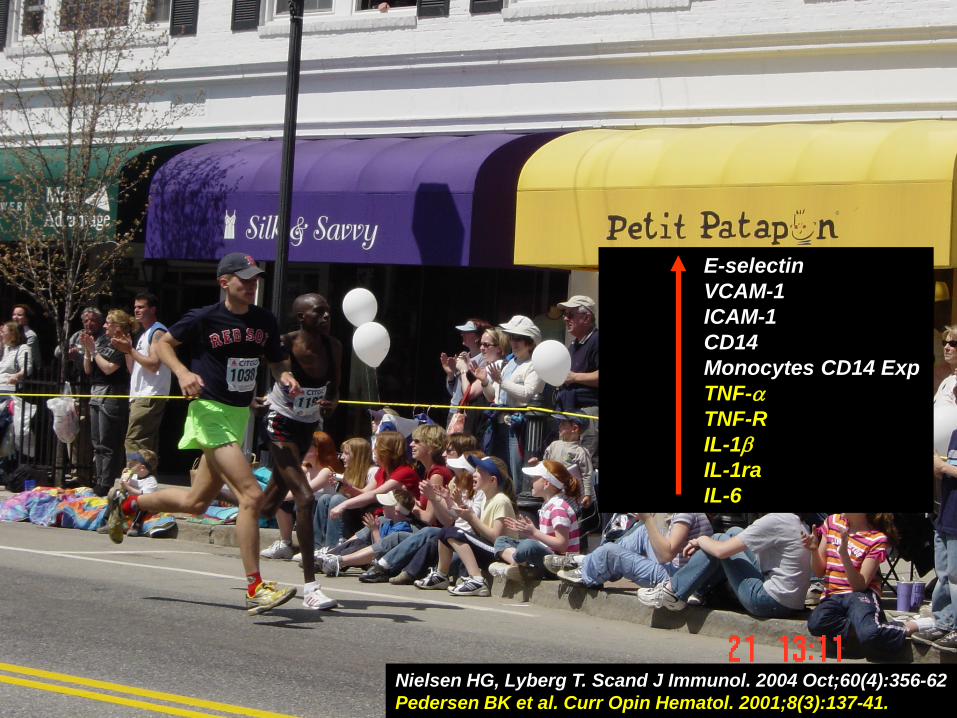
E-selectin VCAM-1 ICAM-1 CD14 Monocytes CD14 Exp TNF-α TNF-R IL-1β IL-1ra IL-6
Nielsen HG, Lyberg T. Scand J Immunol. 2004 Oct;60(4):356-62 Pedersen BK et al. Curr Opin Hematol. 2001;8(3):137-41.
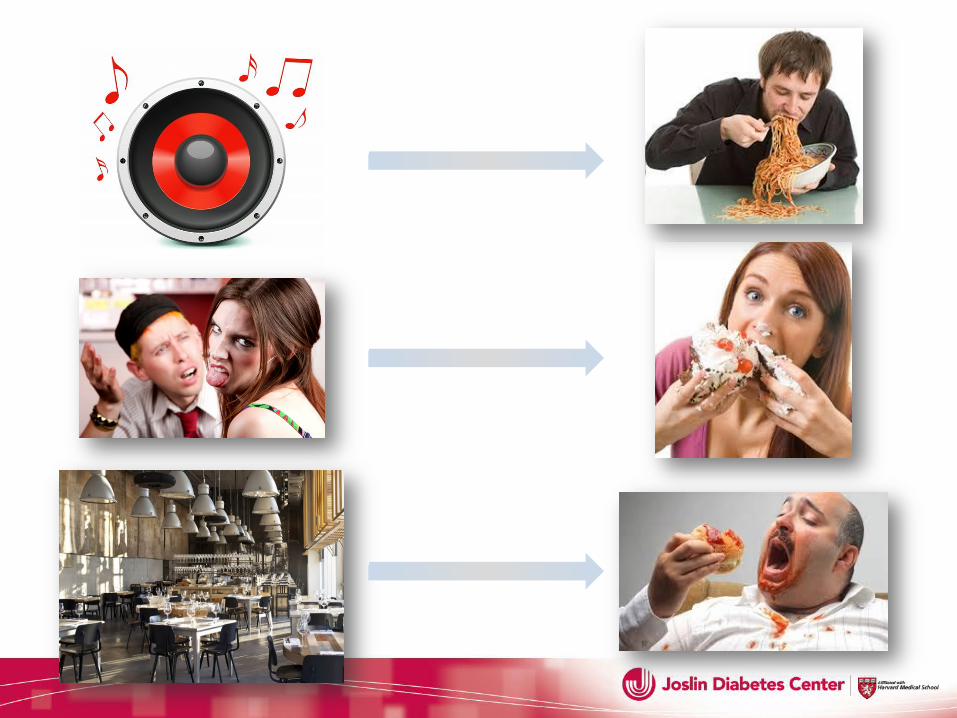
Obesity Smoking Stress


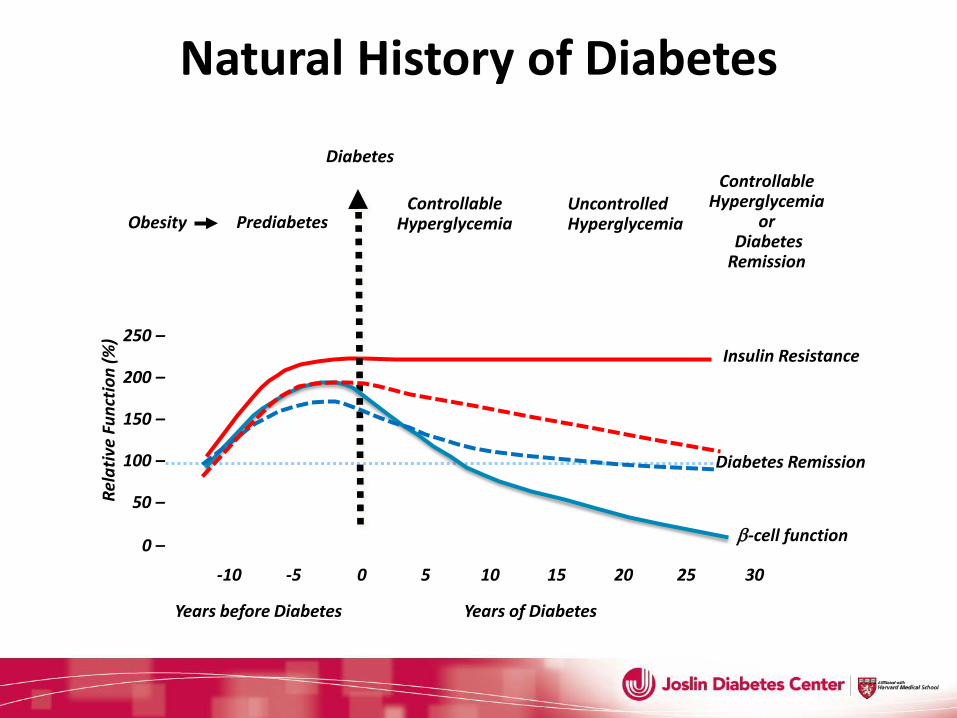
Years of Diabetes
0 –
50 –
100 –
150 –
200 –
250 –
-10 -5 0 5 10 15 20 25 30
Rela
tive
Func
tion
(%)
Obesity Prediabetes
Diabetes
Uncontrolled Hyperglycemia
Insulin Resistance
Years before Diabetes
β-cell function
Controllable Hyperglycemia
Controllable Hyperglycemia
or Diabetes Remission
Diabetes Remission
Natural History of Diabetes
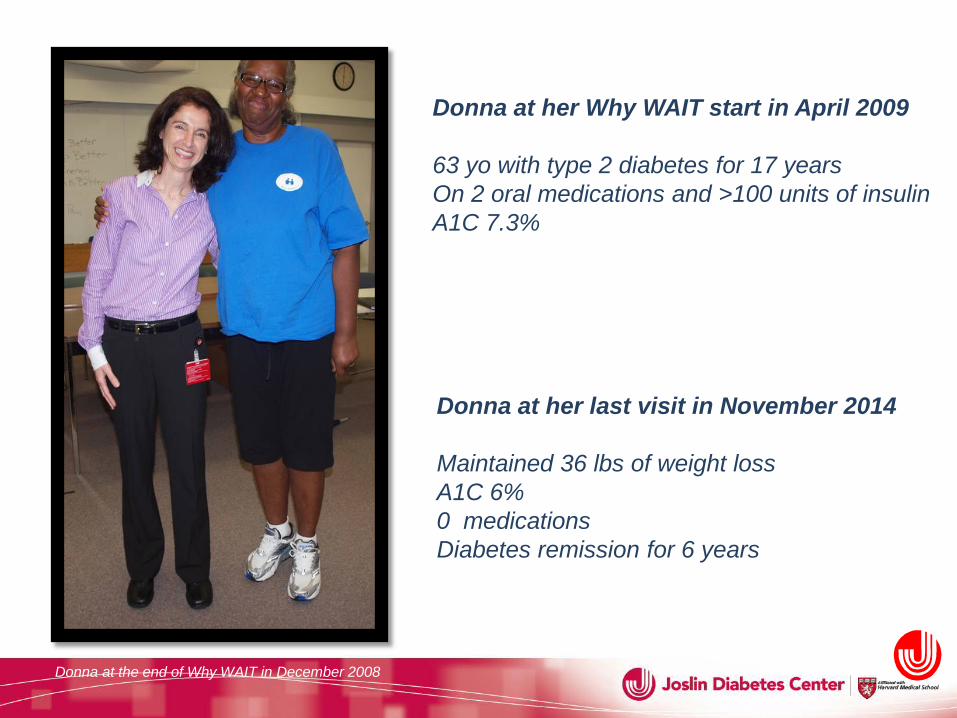
Donna at her Why WAIT start in April 2009 63 yo with type 2 diabetes for 17 years On 2 oral medications and >100 units of insulin A1C 7.3%
Donna at her last visit in November 2014 Maintained 36 lbs of weight loss A1C 6% 0 medications Diabetes remission for 6 years
Donna at the end of Why WAIT in December 2008
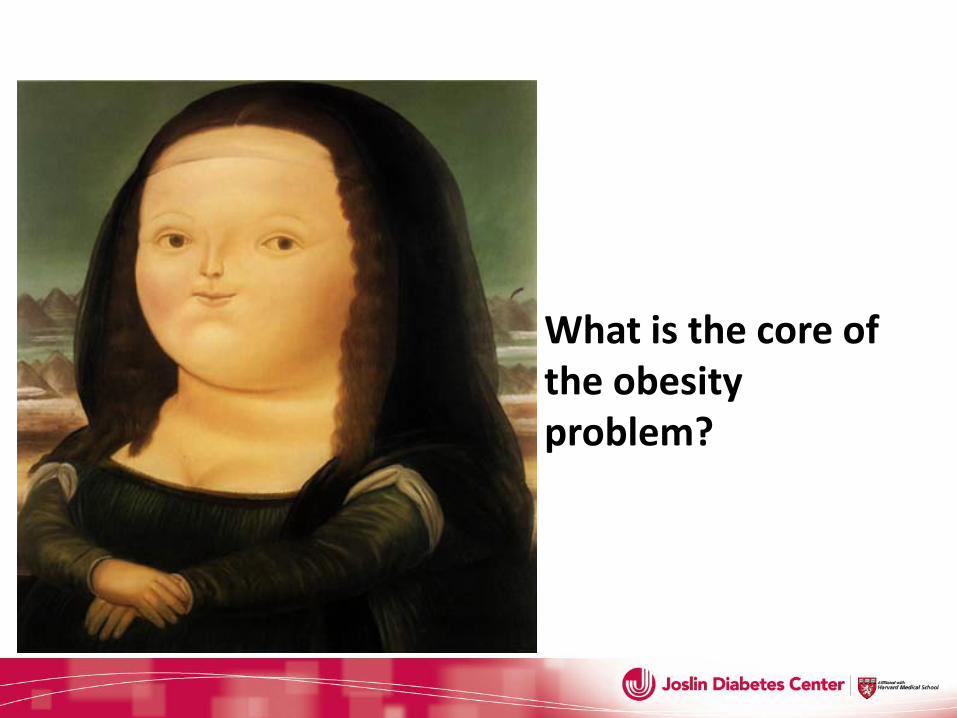
What is the core of the obesity problem?
Obesity is Brain Dysfunction
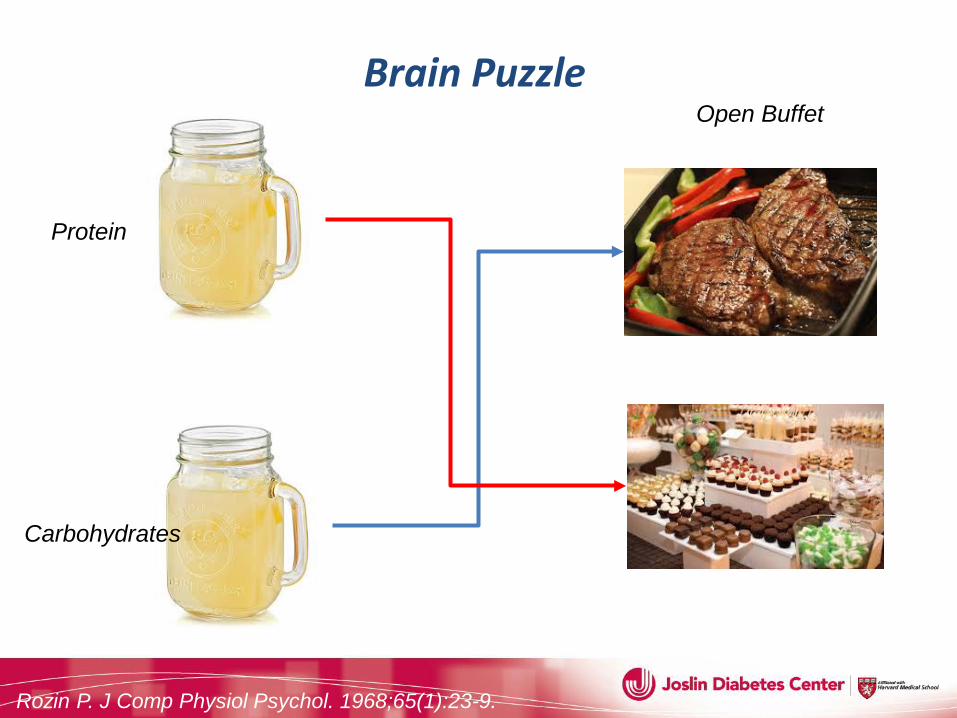
Protein
Carbohydrates
Open Buffet Brain Puzzle
Rozin P. J Comp Physiol Psychol. 1968;65(1):23-9.

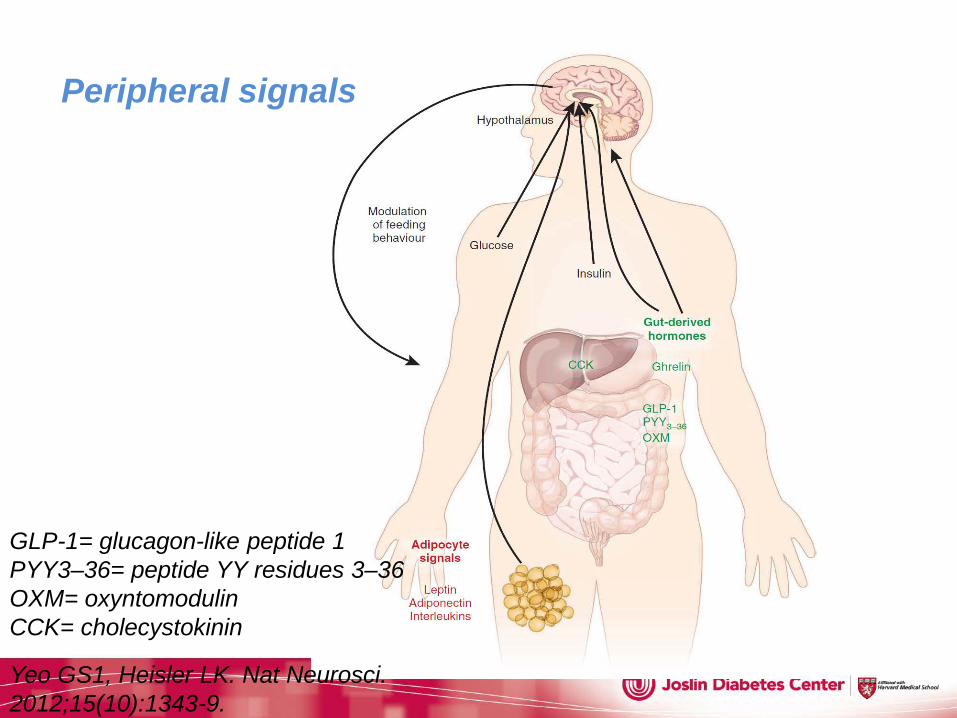
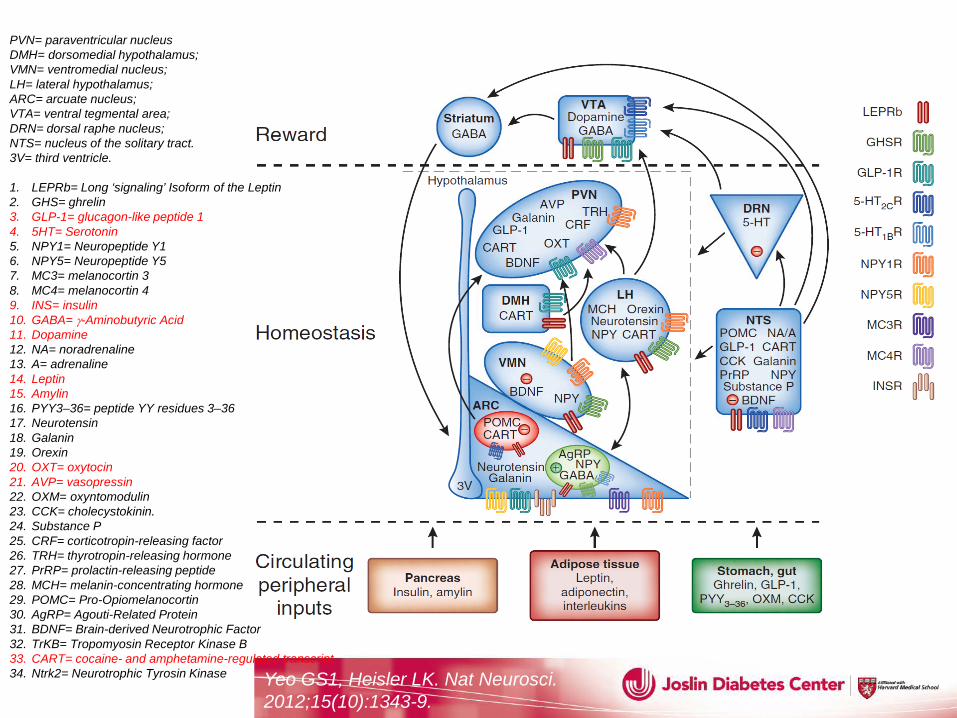
GLP-1= glucagon-like peptide 1 PYY3–36= peptide YY residues 3–36 OXM= oxyntomodulin CCK= cholecystokinin
Yeo GS1, Heisler LK. Nat Neurosci. 2012;15(10):1343-9.
Peripheral signals
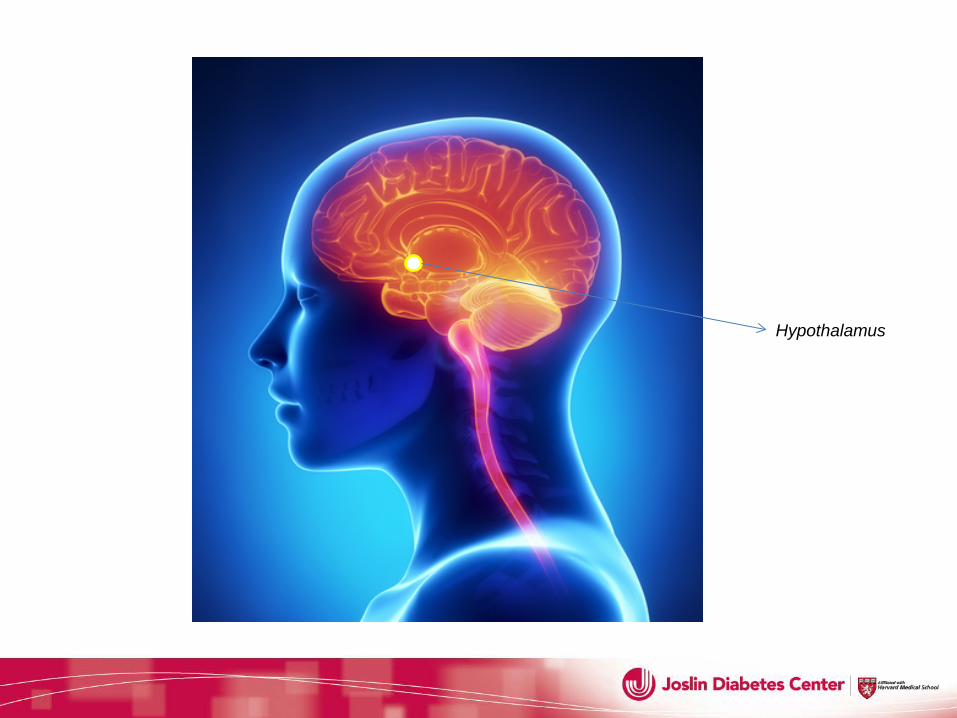
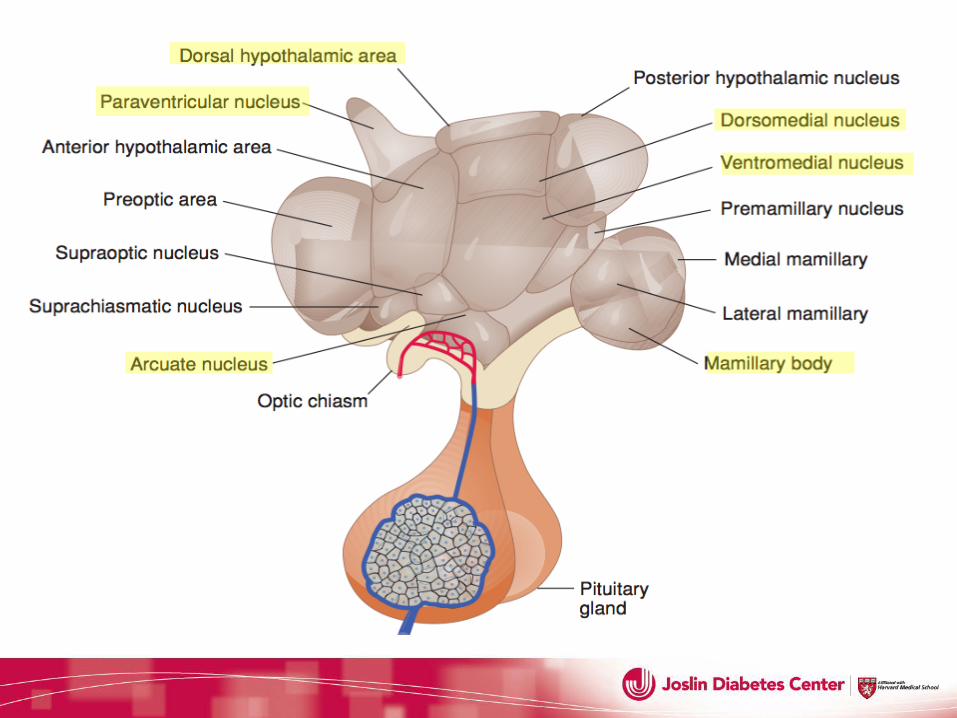
Hypothalamus
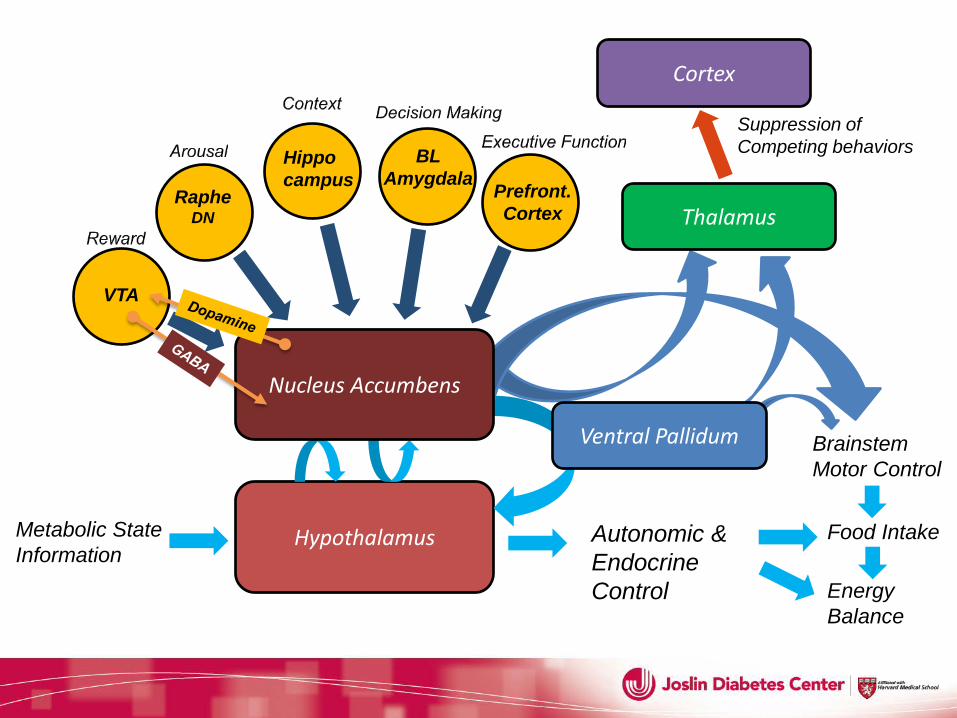
Hypothalamus Metabolic State Information
Autonomic & Endocrine Control
Food Intake
Energy Balance
VTA
Raphe DN
Hippo campus
Brainstem Motor Control
Thalamus
Cortex
Suppression of Competing behaviors BL
Amygdala Prefront. Cortex
Ventral Pallidum
Nucleus Accumbens
Yeo GS1, Heisler LK. Nat Neurosci. 2012;15(10):1343-9.
PVN= paraventricular nucleus DMH= dorsomedial hypothalamus; VMN= ventromedial nucleus; LH= lateral hypothalamus; ARC= arcuate nucleus; VTA= ventral tegmental area; DRN= dorsal raphe nucleus; NTS= nucleus of the solitary tract. 3V= third ventricle.
1. LEPRb= Long ‘signaling’ Isoform of the Leptin 2. GHS= ghrelin 3. GLP-1= glucagon-like peptide 1 4. 5HT= Serotonin 5. NPY1= Neuropeptide Y1 6. NPY5= Neuropeptide Y5 7. MC3= melanocortin 3 8. MC4= melanocortin 4 9. INS= insulin 10. GABA= γ-Aminobutyric Acid 11. Dopamine 12. NA= noradrenaline 13. A= adrenaline 14. Leptin 15. Amylin 16. PYY3–36= peptide YY residues 3–36 17. Neurotensin 18. Galanin 19. Orexin 20. OXT= oxytocin 21. AVP= vasopressin 22. OXM= oxyntomodulin 23. CCK= cholecystokinin. 24. Substance P 25. CRF= corticotropin-releasing factor 26. TRH= thyrotropin-releasing hormone 27. PrRP= prolactin-releasing peptide 28. MCH= melanin-concentrating hormone 29. POMC= Pro-Opiomelanocortin 30. AgRP= Agouti-Related Protein 31. BDNF= Brain-derived Neurotrophic Factor 32. TrKB= Tropomyosin Receptor Kinase B 33. CART= cocaine- and amphetamine-regulated transcript 34. Ntrk2= Neurotrophic Tyrosin Kinase
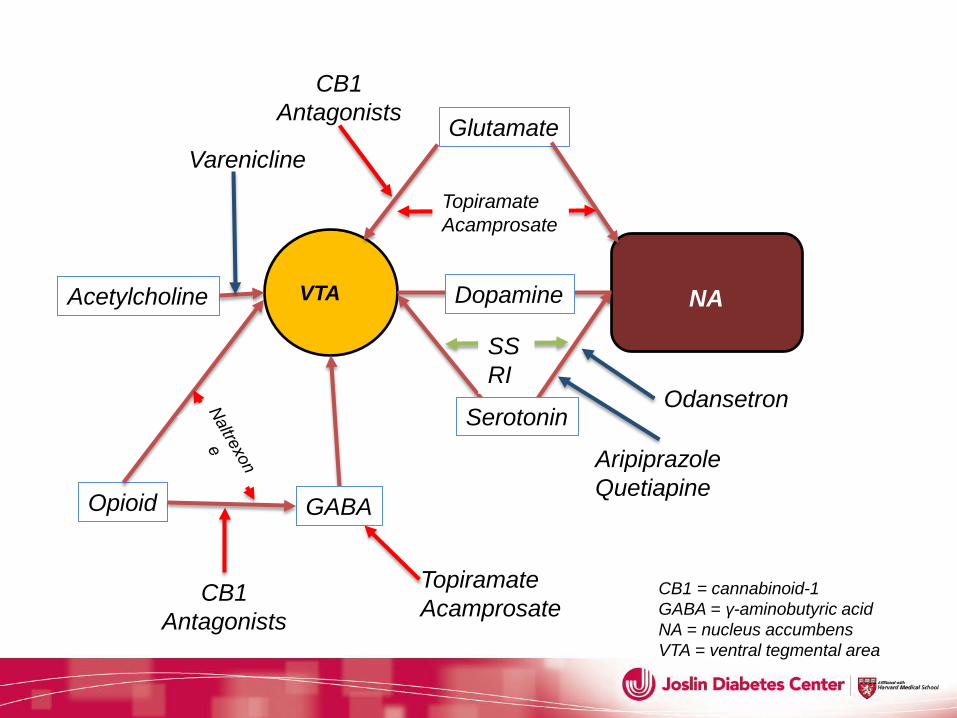
CB1 = cannabinoid-1 GABA = γ-aminobutyric acid NA = nucleus accumbens VTA = ventral tegmental area
VTA NA Dopamine
Serotonin
SSRI
GABA Opioid
Acetylcholine
Glutamate
Topiramate Acamprosate
Topiramate Acamprosate
CB1 CB1 Antagonists
Aripiprazole Quetiapine
Odansetron
Varenicline
CB1 Antagonists
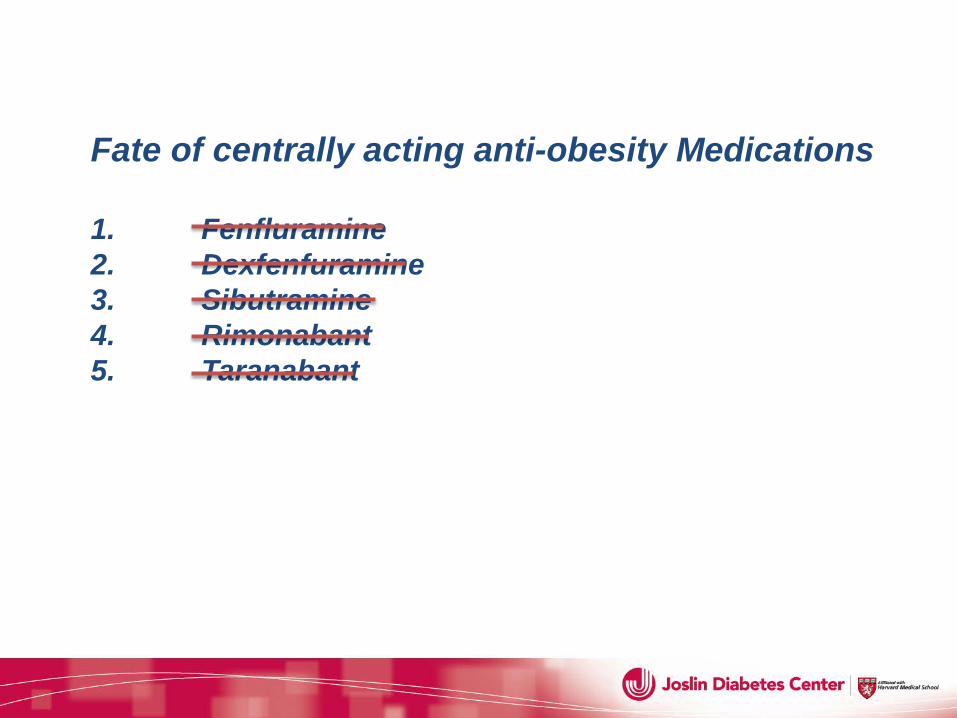
Fate of centrally acting anti-obesity Medications 1. Fenfluramine 2. Dexfenfuramine 3. Sibutramine 4. Rimonabant 5. Taranabant
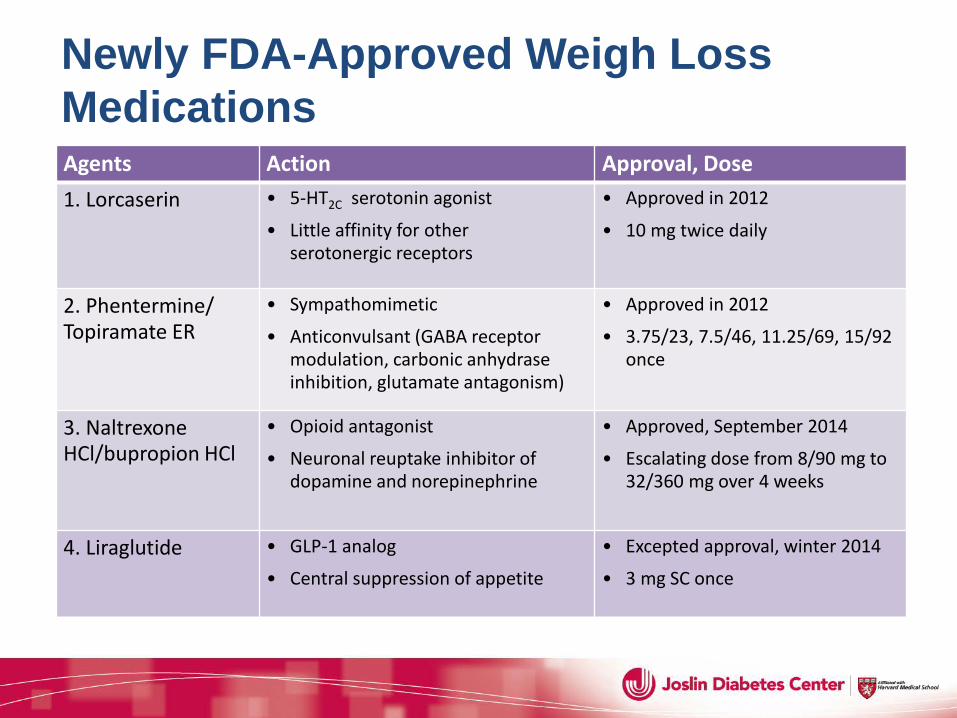
Newly FDA-Approved Weigh Loss Medications Agents Action Approval, Dose 1. Lorcaserin • 5-HT2C serotonin agonist
• Little affinity for other serotonergic receptors
• Approved in 2012
• 10 mg twice daily
2. Phentermine/ Topiramate ER
• Sympathomimetic
• Anticonvulsant (GABA receptor modulation, carbonic anhydrase inhibition, glutamate antagonism)
• Approved in 2012
• 3.75/23, 7.5/46, 11.25/69, 15/92 once
3. Naltrexone HCl/bupropion HCl
• Opioid antagonist
• Neuronal reuptake inhibitor of dopamine and norepinephrine
• Approved, September 2014
• Escalating dose from 8/90 mg to 32/360 mg over 4 weeks
4. Liraglutide • GLP-1 analog
• Central suppression of appetite
• Excepted approval, winter 2014
• 3 mg SC once
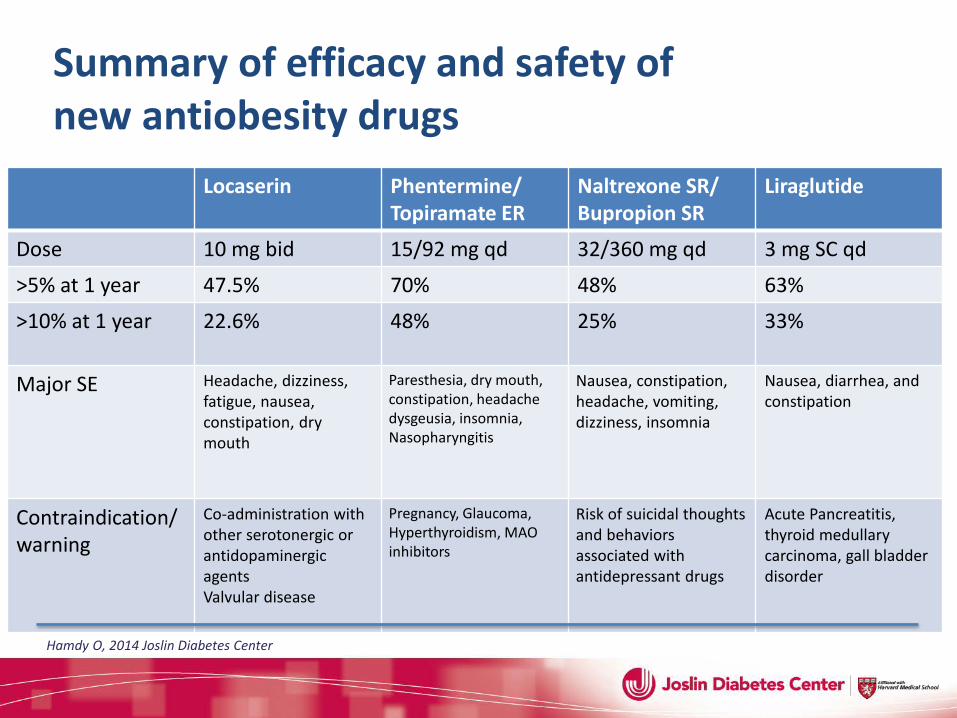
Locaserin Phentermine/ Topiramate ER
Naltrexone SR/ Bupropion SR
Liraglutide
Dose 10 mg bid 15/92 mg qd 32/360 mg qd 3 mg SC qd
>5% at 1 year 47.5% 70% 48% 63%
>10% at 1 year 22.6%
48% 25% 33%
Major SE Headache, dizziness, fatigue, nausea, constipation, dry mouth
Paresthesia, dry mouth, constipation, headache dysgeusia, insomnia, Nasopharyngitis
Nausea, constipation, headache, vomiting, dizziness, insomnia
Nausea, diarrhea, and constipation
Contraindication/warning
Co-administration with other serotonergic or antidopaminergic agents Valvular disease
Pregnancy, Glaucoma, Hyperthyroidism, MAO inhibitors
Risk of suicidal thoughts and behaviors associated with antidepressant drugs
Acute Pancreatitis, thyroid medullary carcinoma, gall bladder disorder
Summary of efficacy and safety of new antiobesity drugs
Hamdy O, 2014 Joslin Diabetes Center
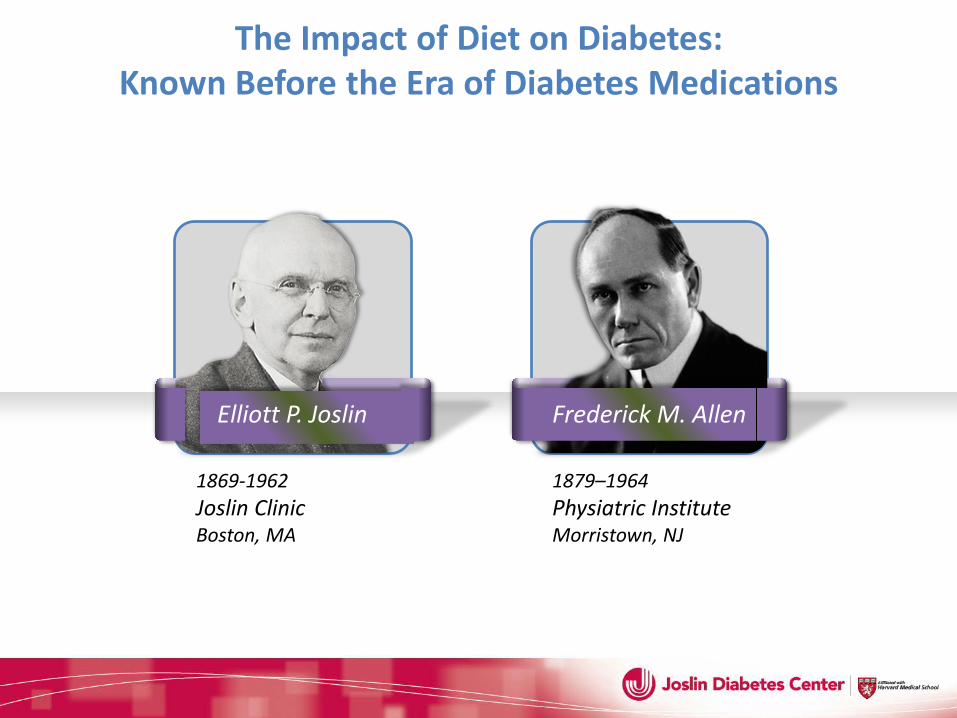
The Impact of Diet on Diabetes: Known Before the Era of Diabetes Medications
1869-1962 Joslin Clinic Boston, MA
1879–1964 Physiatric Institute Morristown, NJ
Elliott P. Joslin Frederick M. Allen
“Strict diet”: Meats, poultry, game, fish, clear soups, gelatin, eggs, butter, olive oil, coffee, tea Osler W & McCrae T, The Principles and Practice of Medicine, 1923; Westman EC, Perspect Biol Med, 2006
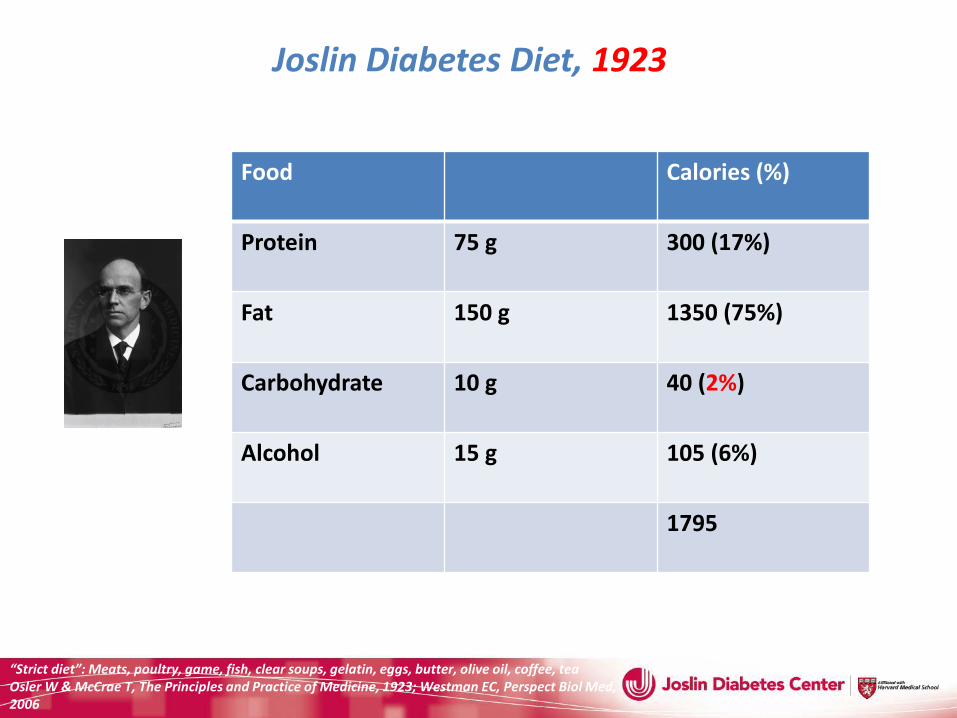
Joslin Diabetes Diet, 1923 Quantity of food required by severe diabetic patient weighing 60 Kg
Food
Calories (%)
Protein 75 g
300 (17%)
Fat 150 g
1350 (75%)
Carbohydrate 10 g
40 (2%)
Alcohol 15 g
105 (6%)
1795
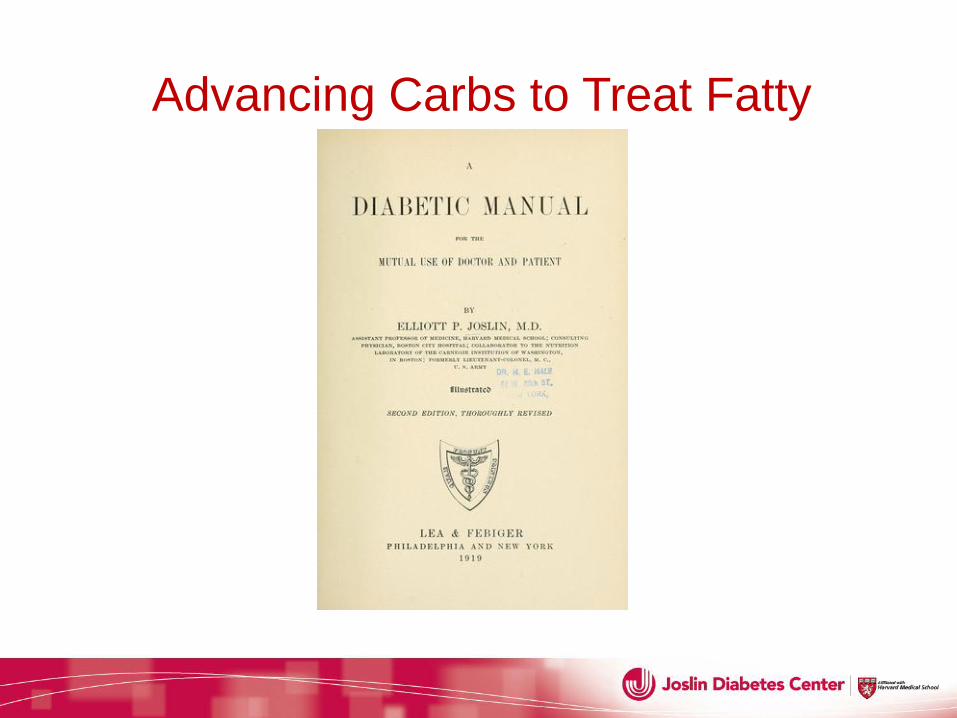
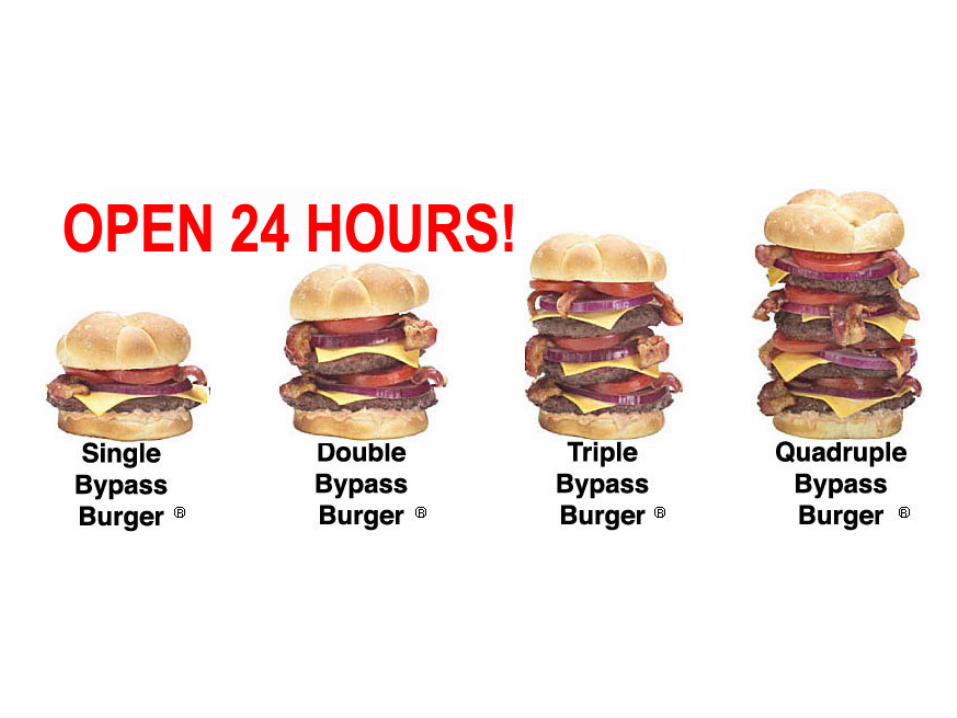
Advancing Carbs to Treat Fatty Diabetes
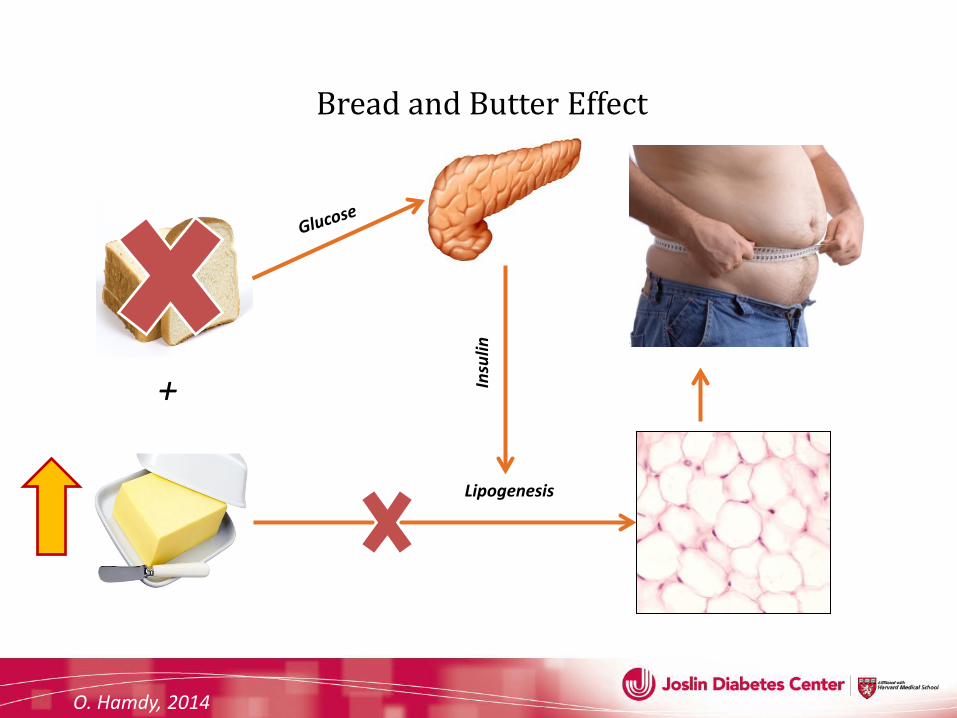
Bread and Butter Effect
O. Hamdy, 2014
Insu
lin
Lipogenesis
+
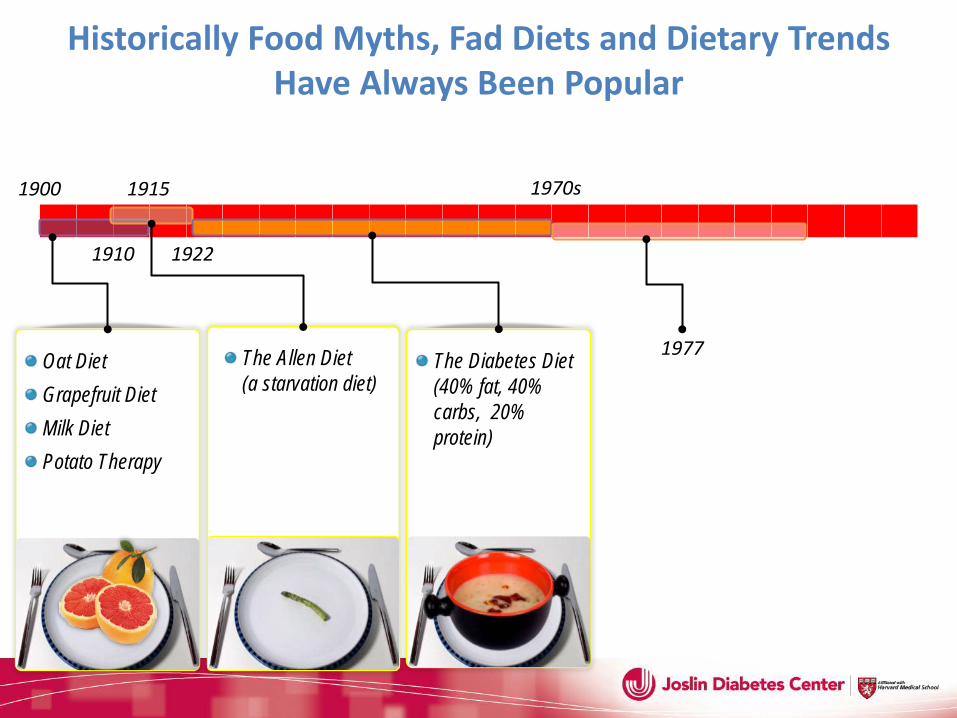
The Allen Diet (a starvation diet)
The Diabetes Diet (40% fat, 40% carbs, 20% protein)
Oat Diet Grapefruit Diet Milk Diet Potato Therapy
Historically Food Myths, Fad Diets and Dietary Trends Have Always Been Popular
1900 1915
1922 1910
1977
1970s
The Roots of Dietary Problems
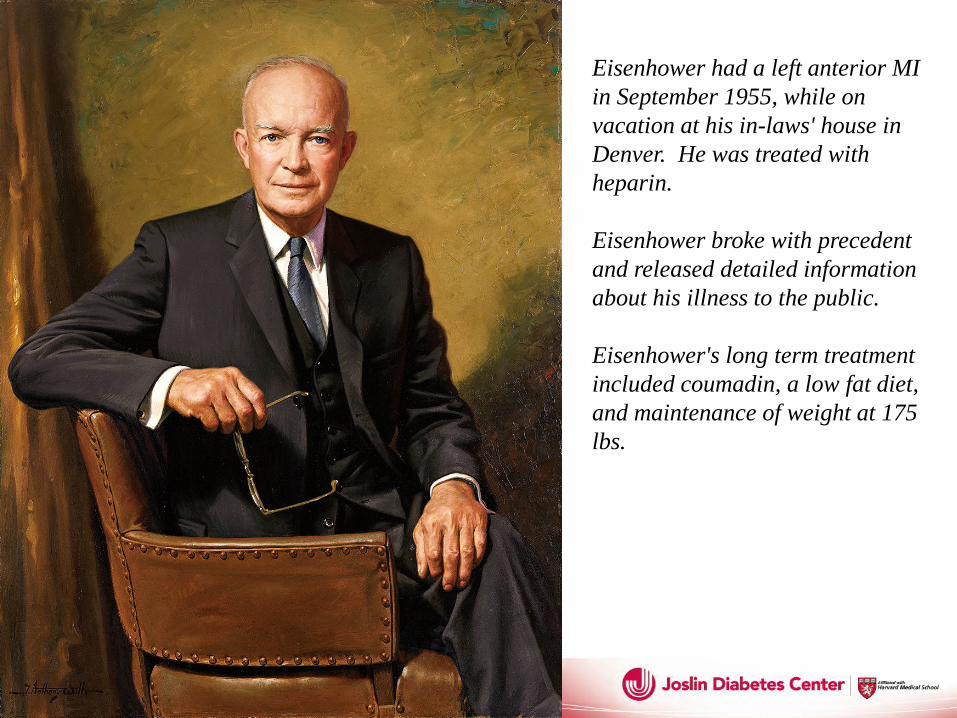
Eisenhower had a left anterior MI in September 1955, while on vacation at his in-laws' house in Denver. He was treated with heparin. Eisenhower broke with precedent and released detailed information about his illness to the public. Eisenhower's long term treatment included coumadin, a low fat diet, and maintenance of weight at 175 lbs.
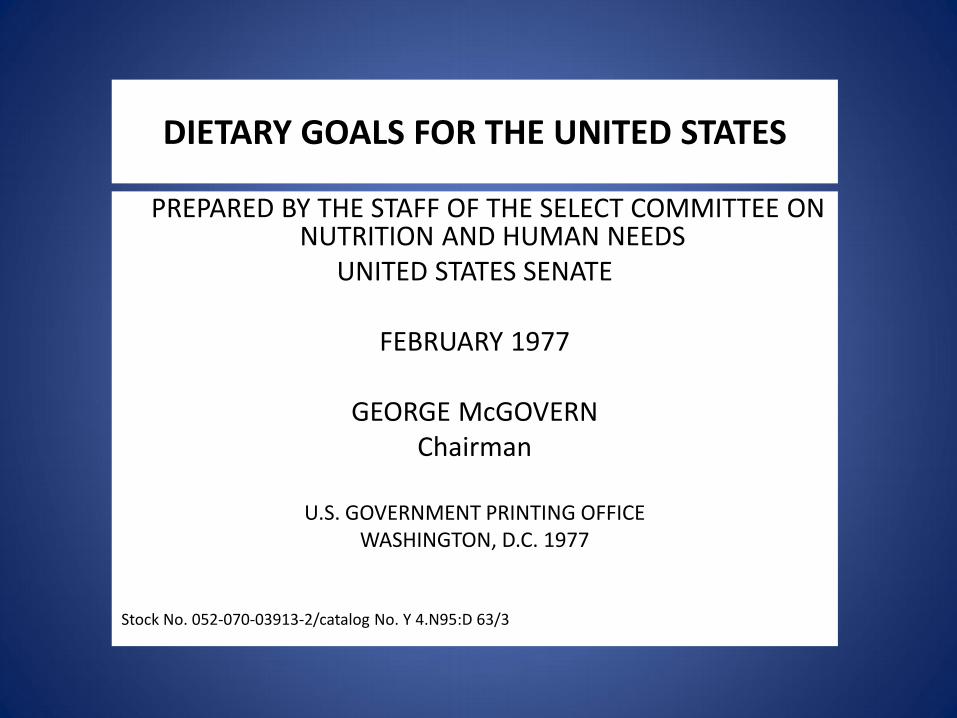
DIETARY GOALS FOR THE UNITED STATES
PREPARED BY THE STAFF OF THE SELECT COMMITTEE ON NUTRITION AND HUMAN NEEDS
UNITED STATES SENATE
FEBRUARY 1977
GEORGE McGOVERN Chairman
U.S. GOVERNMENT PRINTING OFFICE
WASHINGTON, D.C. 1977
Stock No. 052-070-03913-2/catalog No. Y 4.N95:D 63/3
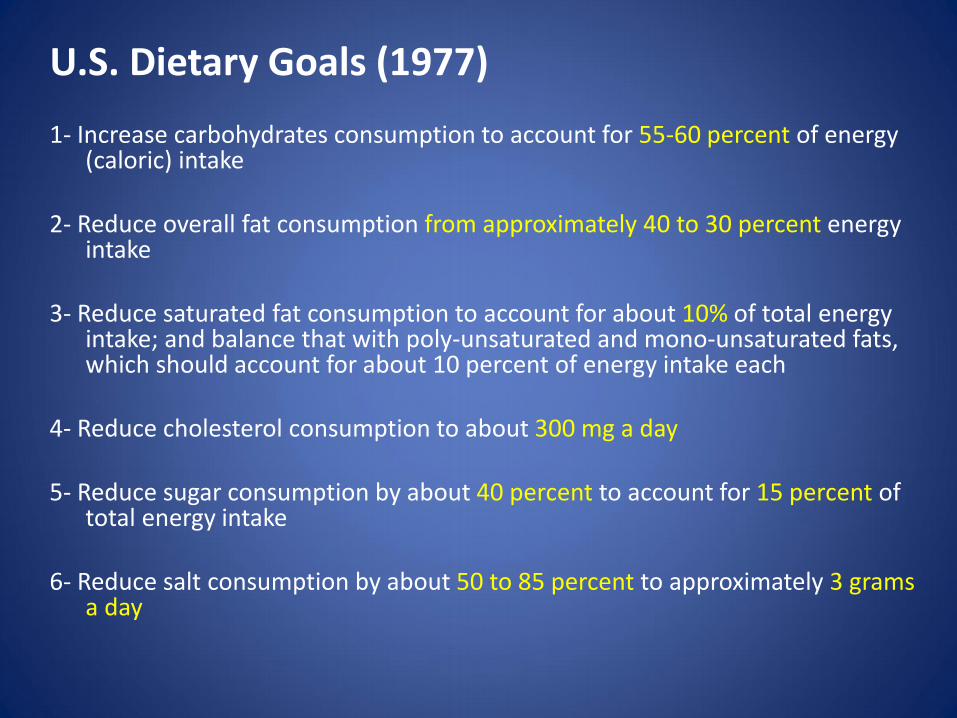
U.S. Dietary Goals (1977) 1- Increase carbohydrates consumption to account for 55-60 percent of energy
(caloric) intake 2- Reduce overall fat consumption from approximately 40 to 30 percent energy
intake 3- Reduce saturated fat consumption to account for about 10% of total energy
intake; and balance that with poly-unsaturated and mono-unsaturated fats, which should account for about 10 percent of energy intake each
4- Reduce cholesterol consumption to about 300 mg a day 5- Reduce sugar consumption by about 40 percent to account for 15 percent of
total energy intake 6- Reduce salt consumption by about 50 to 85 percent to approximately 3 grams
a day
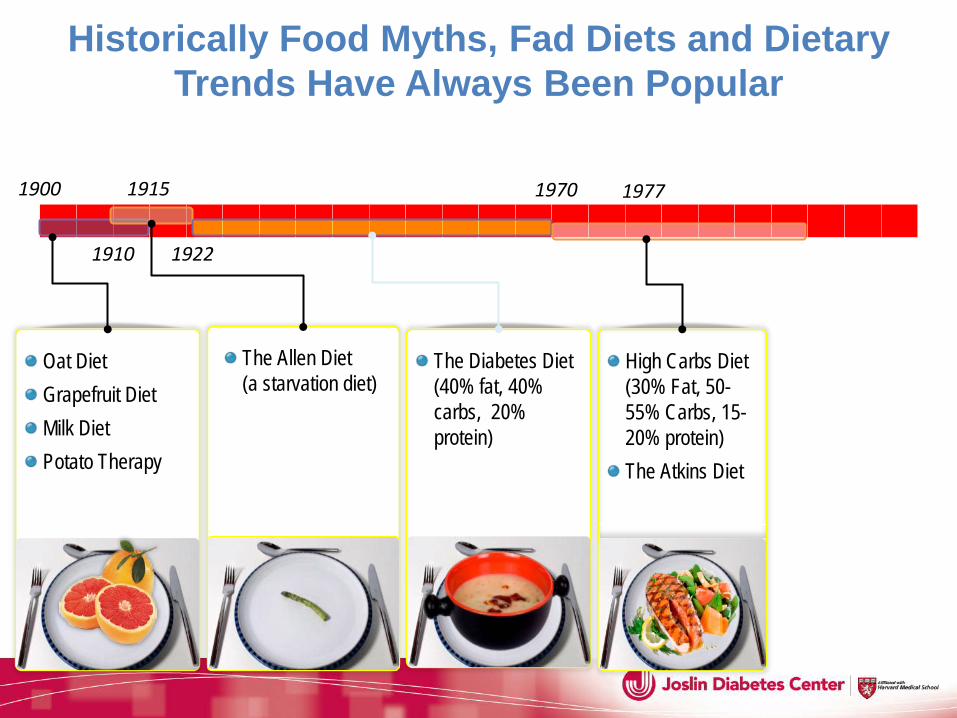
The Allen Diet (a starvation diet)
High Carbs Diet (30% Fat, 50-55% Carbs, 15-20% protein) The Atkins Diet
The Diabetes Diet (40% fat, 40% carbs, 20% protein)
Oat Diet Grapefruit Diet Milk Diet Potato Therapy
Historically Food Myths, Fad Diets and Dietary Trends Have Always Been Popular
1900 1915
1922 1910
1970 1977
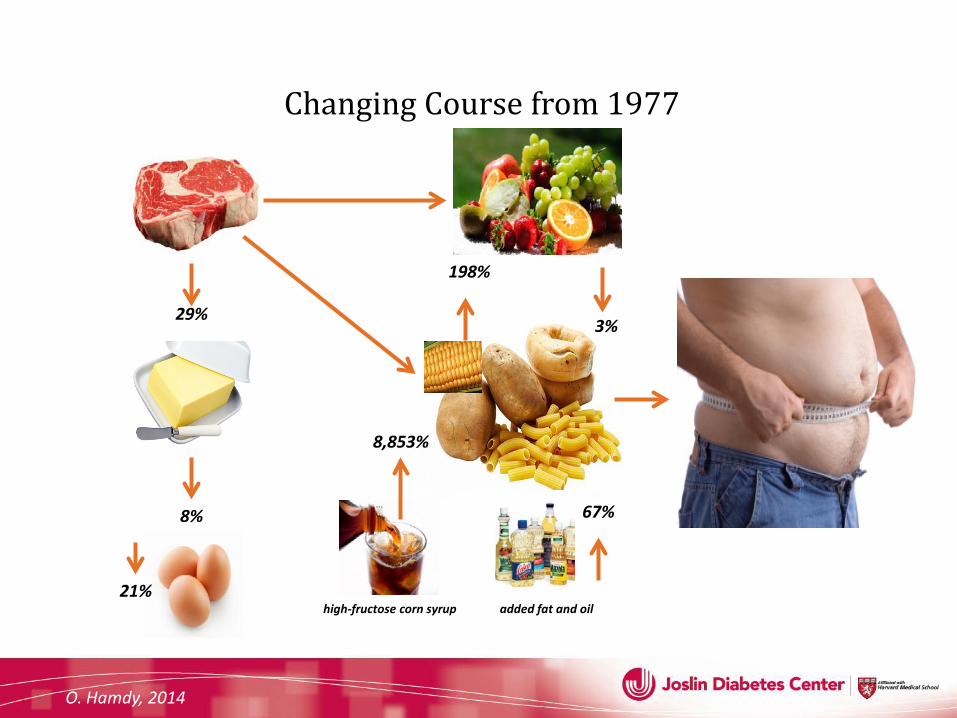
Changing Course from 1977
29%
8%
3%
198%
8,853%
high-fructose corn syrup 21%
added fat and oil
67%
O. Hamdy, 2014
0
10
20
30
40
50
60
1971-1974 1976-1980 1988-1994 1999-2000 2000-2012
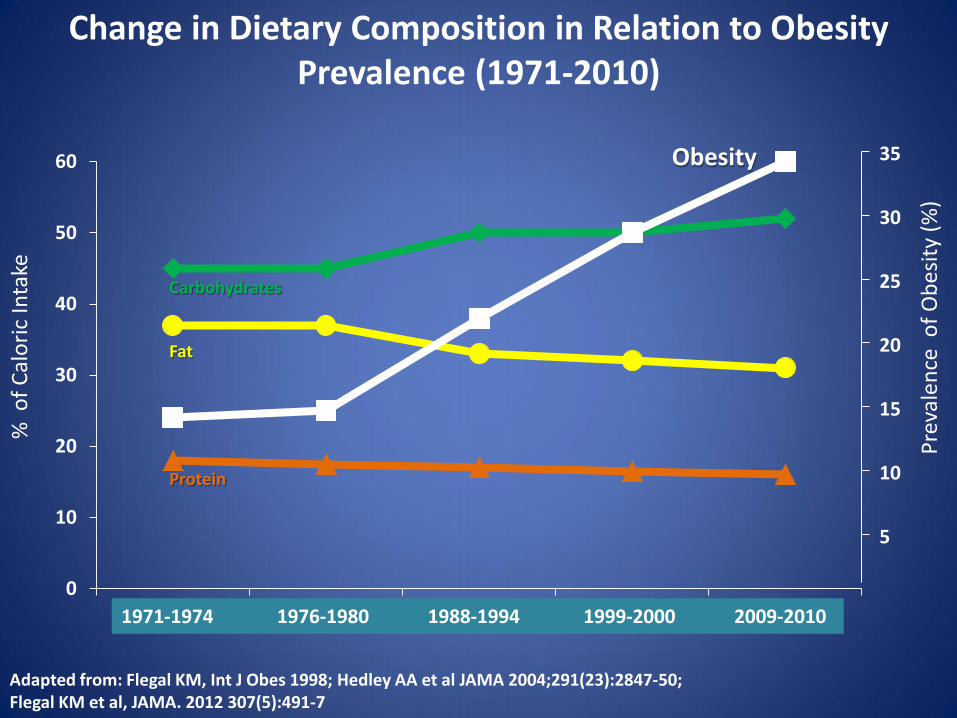
Protein
Obesity
Carbohydrates
Fat
% o
f Cal
oric
Inta
ke
Change in Dietary Composition in Relation to Obesity Prevalence (1971-2010)
5
10
15
20
25
30
35
Prev
alen
ce o
f Obe
sity
(%)
Adapted from: Flegal KM, Int J Obes 1998; Hedley AA et al JAMA 2004;291(23):2847-50; Flegal KM et al, JAMA. 2012 307(5):491-7
1971-1974 1976-1980 1988-1994 1999-2000 2009-2010


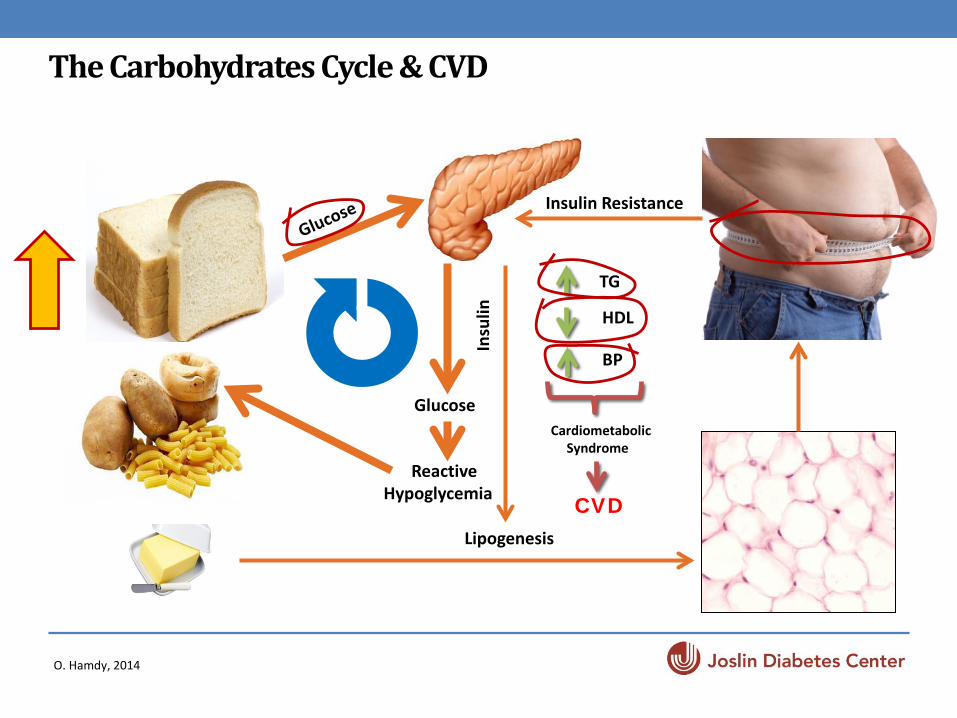
The Carbohydrates Cycle & CVD
O. Hamdy, 2014
Lipogenesis
+ Glucose
Reactive Hypoglycemia
Insulin Resistance
TG
HDL
BP
Cardiometabolic Syndrome
CVD In
sulin
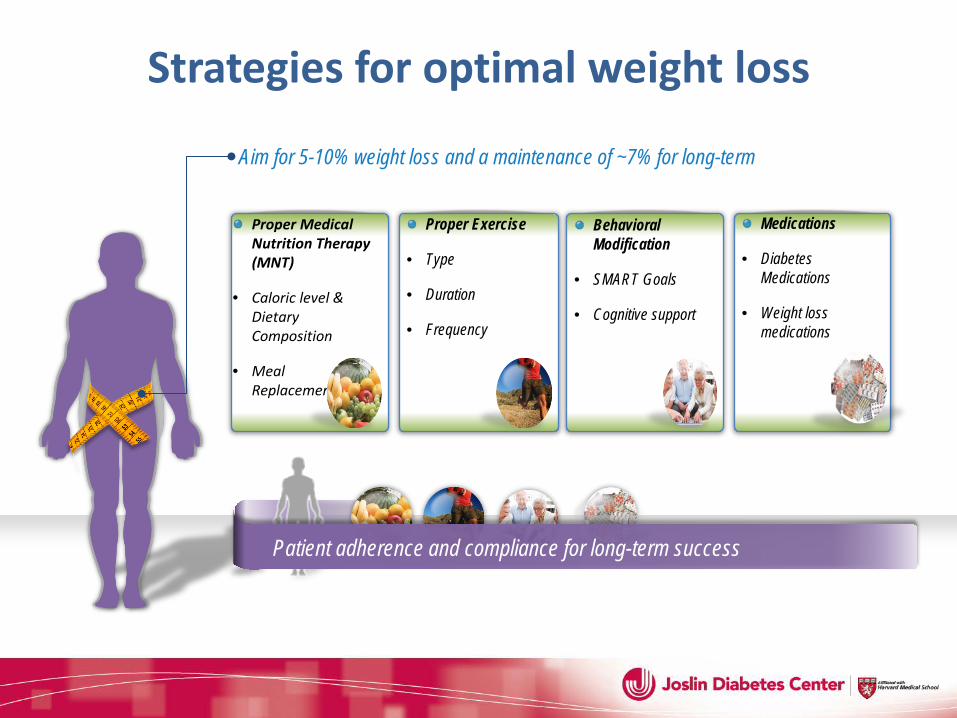
Strategies for optimal weight loss
Aim for 5-10% weight loss and a maintenance of ~7% for long-term
Proper Medical Nutrition Therapy (MNT)
• Caloric level & Dietary Composition
• Meal Replacements
Proper Exercise
• Type
• Duration
• Frequency
Behavioral Modification
• SMART Goals
• Cognitive support
Patient adherence and compliance for long-term success
Medications
• Diabetes Medications
• Weight loss medications
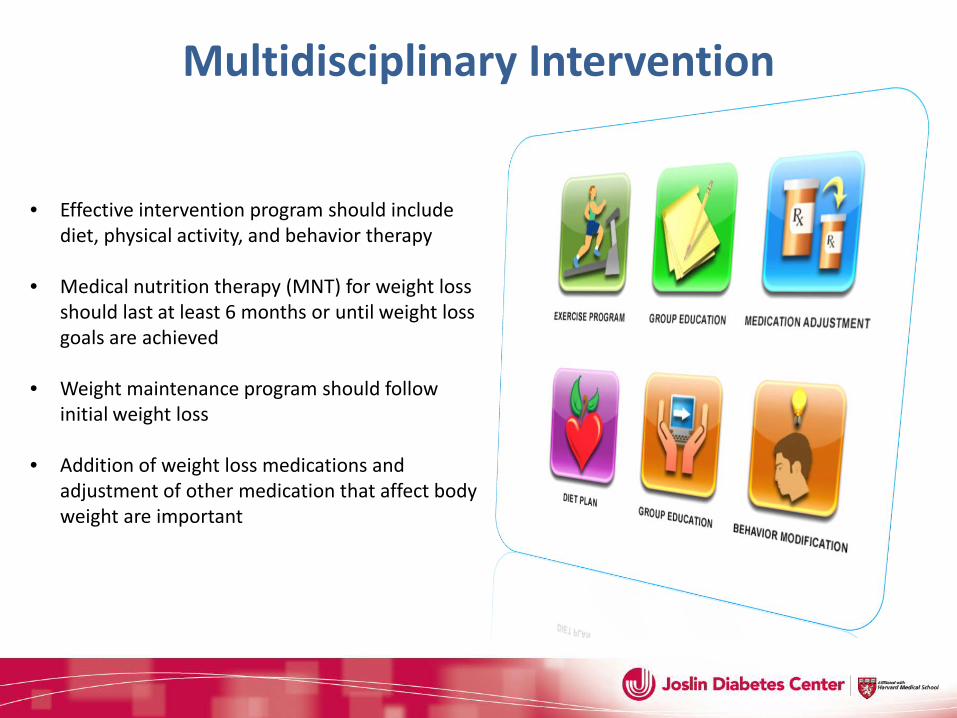
Multidisciplinary Intervention
• Effective intervention program should include diet, physical activity, and behavior therapy
• Medical nutrition therapy (MNT) for weight loss should last at least 6 months or until weight loss goals are achieved
• Weight maintenance program should follow initial weight loss
• Addition of weight loss medications and adjustment of other medication that affect body weight are important
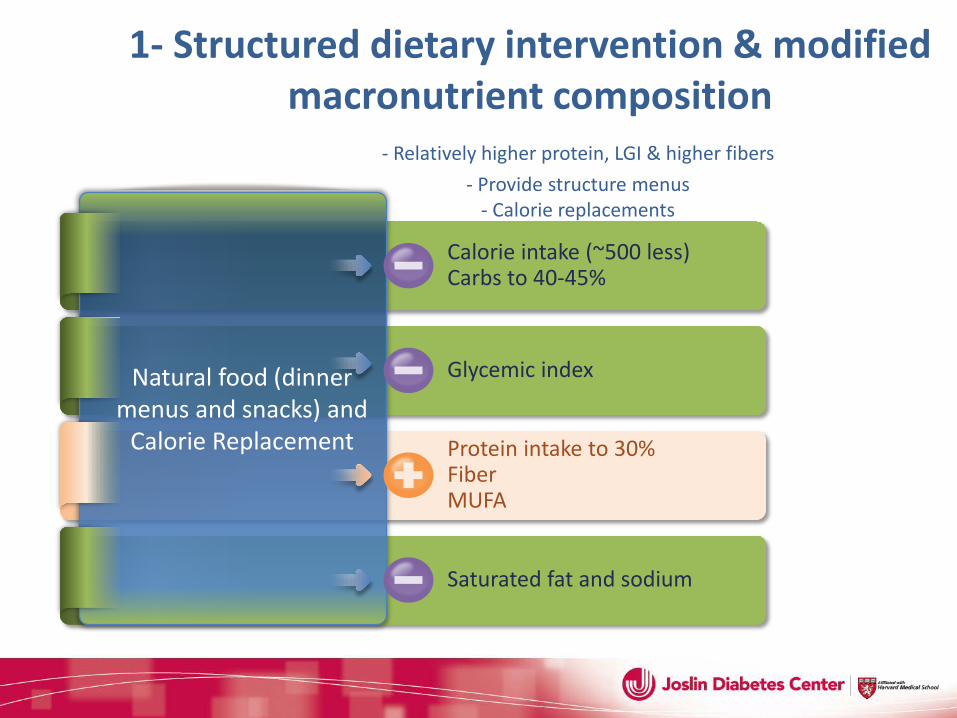
1- Structured dietary intervention & modified macronutrient composition - Relatively higher protein, LGI & higher fibers
- Provide structure menus - Calorie replacements
- Food records Calorie intake (~500 less) Carbs to 40-45%
Glycemic index
Protein intake to 30% Fiber MUFA
Saturated fat and sodium
Natural food (dinner menus and snacks) and
Calorie Replacement
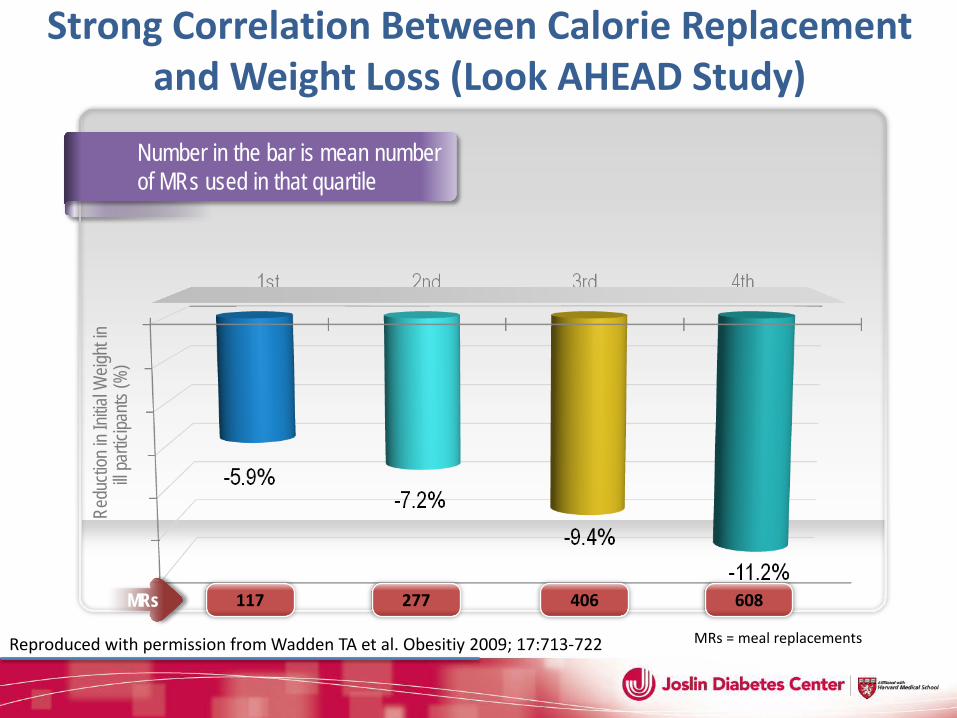
Strong Correlation Between Calorie Replacement and Weight Loss (Look AHEAD Study)
Number in the bar is mean number of MRs used in that quartile
Red
uctio
n in I
nitial
Weig
ht in
ill pa
rticipa
nts (%
)
Reproduced with permission from Wadden TA et al. Obesitiy 2009; 17:713-722
117 277 406 608 MRs
MRs = meal replacements
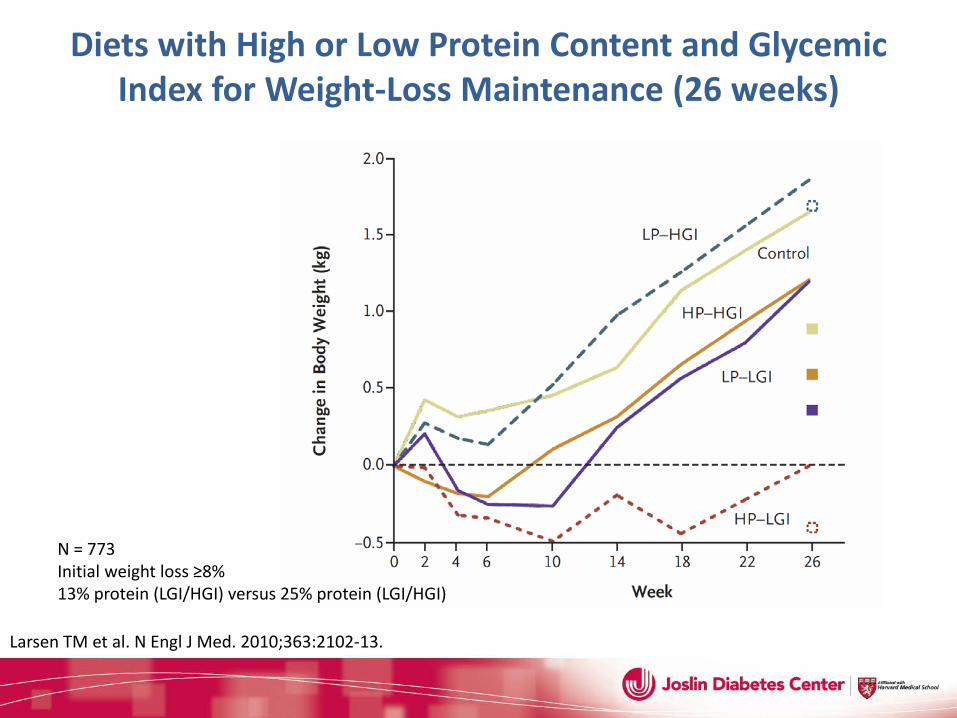
N = 773 Initial weight loss ≥8% 13% protein (LGI/HGI) versus 25% protein (LGI/HGI)
Diets with High or Low Protein Content and Glycemic Index for Weight-Loss Maintenance (26 weeks)
Larsen TM et al. N Engl J Med. 2010;363:2102-13.
Exercise
Exercise at any Age
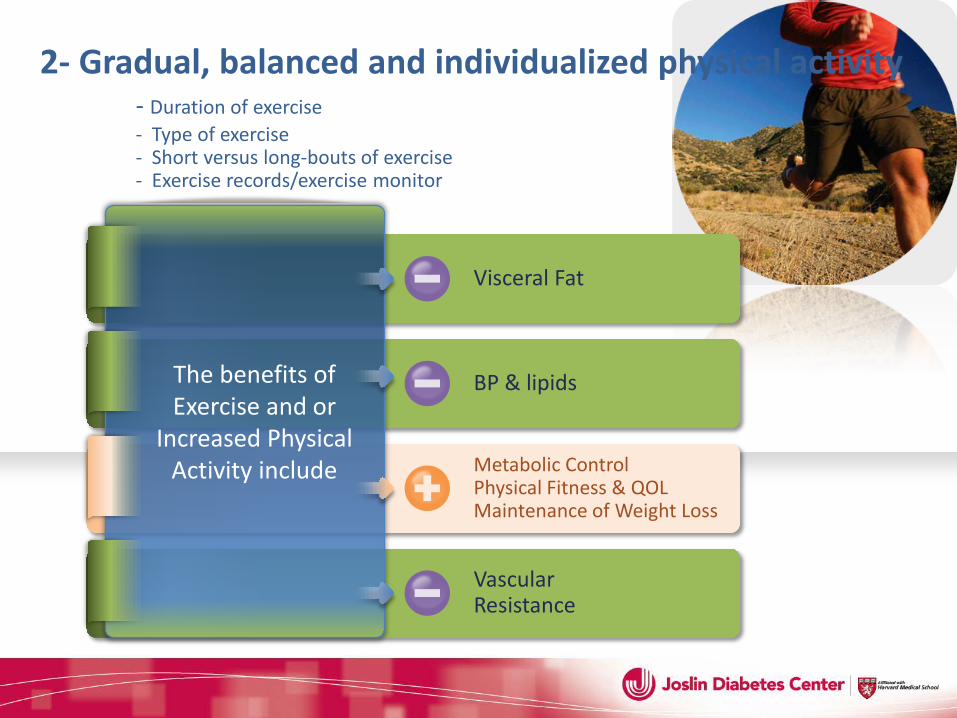
Visceral Fat
BP & lipids
Metabolic Control Physical Fitness & QOL Maintenance of Weight Loss
Vascular Resistance
The benefits of Exercise and or
Increased Physical Activity include
2- Gradual, balanced and individualized physical activity - Duration of exercise - Type of exercise - Short versus long-bouts of exercise - Exercise records/exercise monitor
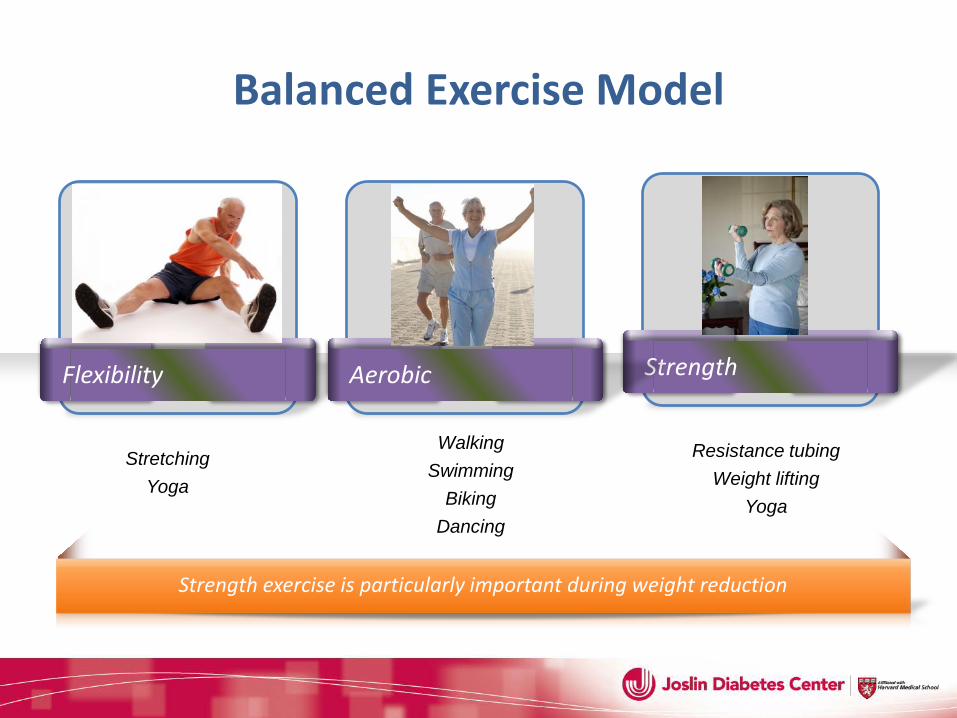
Balanced Exercise Model
Flexibility Strength
Strength exercise is particularly important during weight reduction
Aerobic
Walking Swimming
Biking Dancing
Resistance tubing Weight lifting
Yoga
Stretching Yoga
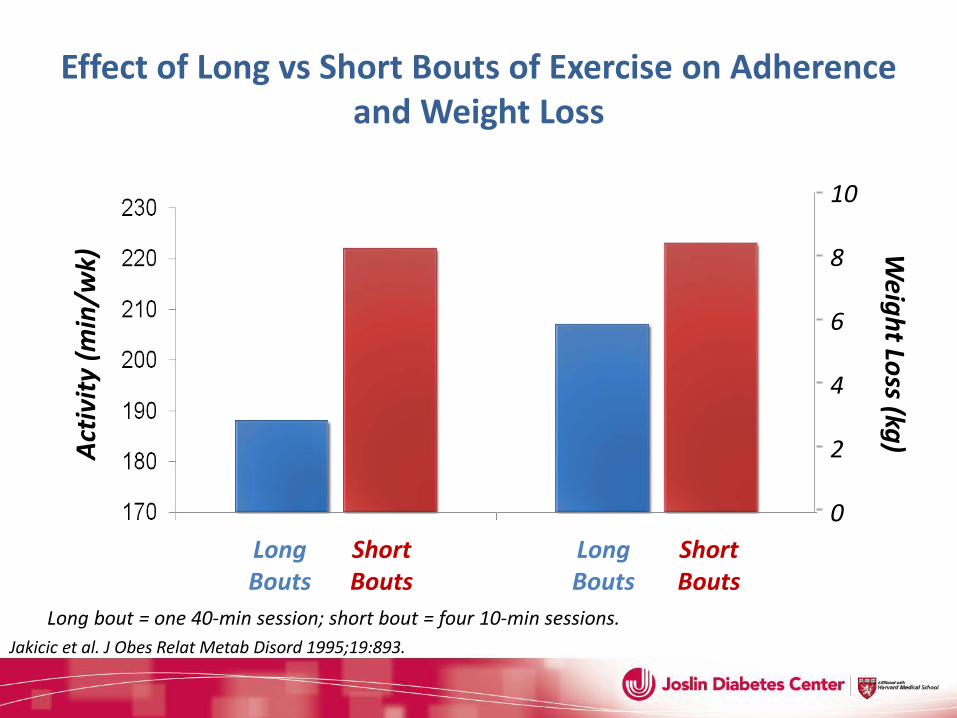
Effect of Long vs Short Bouts of Exercise on Adherence and Weight Loss
Jakicic et al. J Obes Relat Metab Disord 1995;19:893.
Long bout = one 40-min session; short bout = four 10-min sessions.
Activ
ity (m
in/w
k)
Long Bouts
Short Bouts
Long Bouts
Short Bouts
10
8
6
4
2
0
Weight Loss (kg)
Why WAIT Program Look AHEAD Study
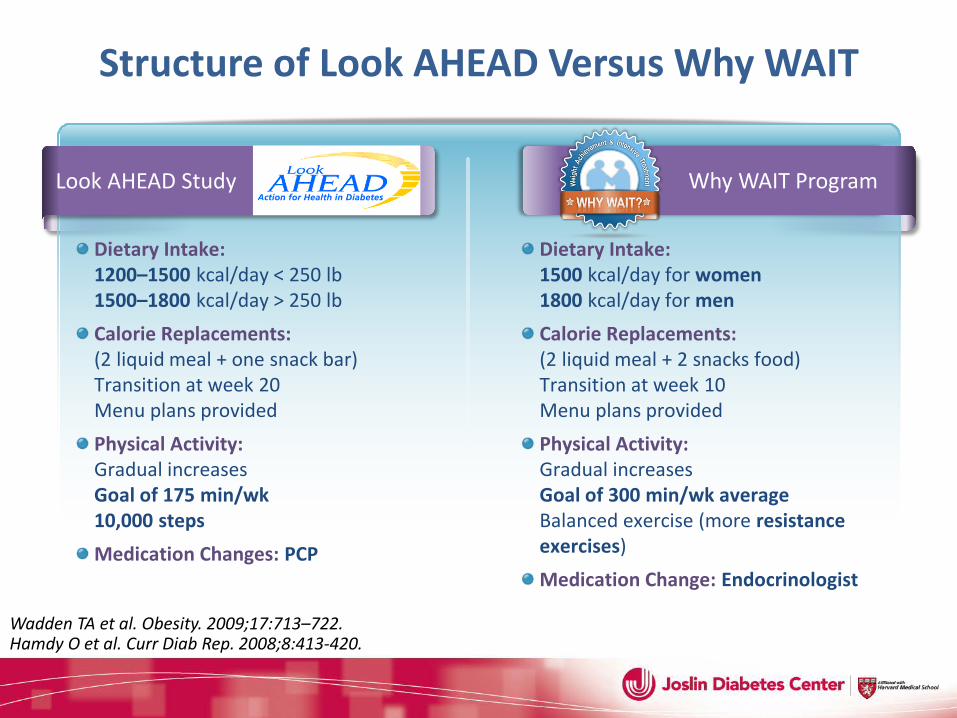
Structure of Look AHEAD Versus Why WAIT
Wadden TA et al. Obesity. 2009;17:713–722. Hamdy O et al. Curr Diab Rep. 2008;8:413-420.
Dietary Intake: 1200–1500 kcal/day < 250 lb 1500–1800 kcal/day > 250 lb Calorie Replacements: (2 liquid meal + one snack bar) Transition at week 20 Menu plans provided Physical Activity: Gradual increases Goal of 175 min/wk 10,000 steps Medication Changes: PCP
Dietary Intake: 1500 kcal/day for women 1800 kcal/day for men Calorie Replacements: (2 liquid meal + 2 snacks food) Transition at week 10 Menu plans provided Physical Activity: Gradual increases Goal of 300 min/wk average Balanced exercise (more resistance exercises) Medication Change: Endocrinologist
-16.0
-14.0
-12.0
-10.0
-8.0
-6.0
-4.0
-2.0
0.00 3M 6M 9M 12M 15M 18M 21M 24M 27M 30M 33M 36M 39M 42M 45M 48M 51M 54M 57M 60M
*** *** ***
***
*** ***
*** *** *** *** *** *** *** *** *** *** *** ***
Wei
ght L
oss (
%)
Duration in Months
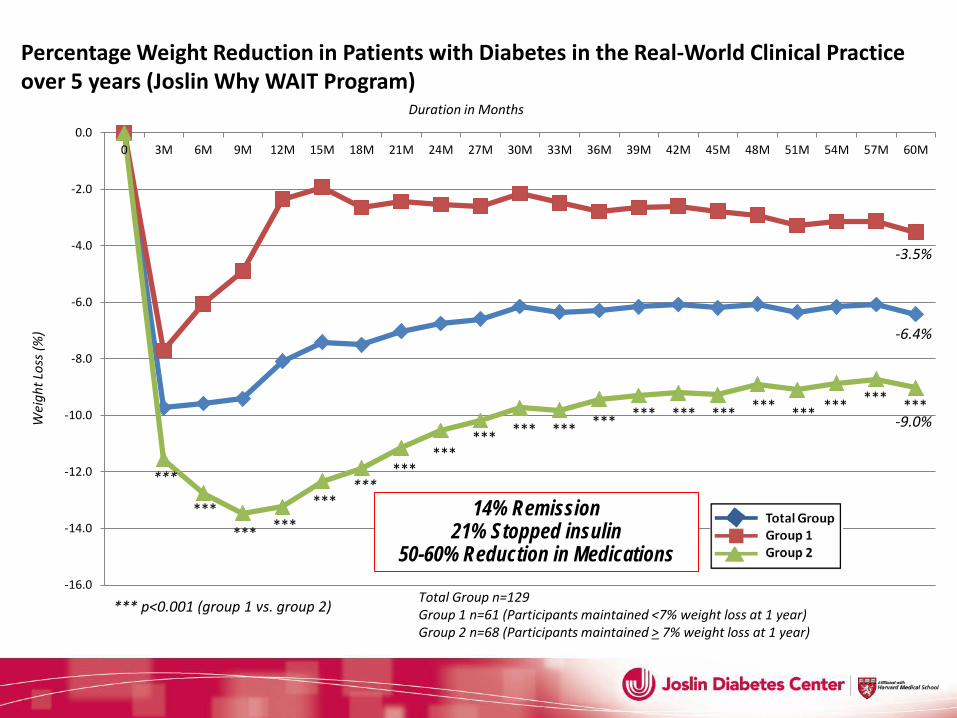
Total Group n=129 Group 1 n=61 (Participants maintained <7% weight loss at 1 year) Group 2 n=68 (Participants maintained > 7% weight loss at 1 year)
*** p<0.001 (group 1 vs. group 2)
*** ***
-9.0%
-3.5%
-6.4%
Percentage Weight Reduction in Patients with Diabetes in the Real-World Clinical Practice over 5 years (Joslin Why WAIT Program)
14% Remission 21% Stopped insulin
50-60% Reduction in Medications
Bod
y fa
t mas
s (lb
)
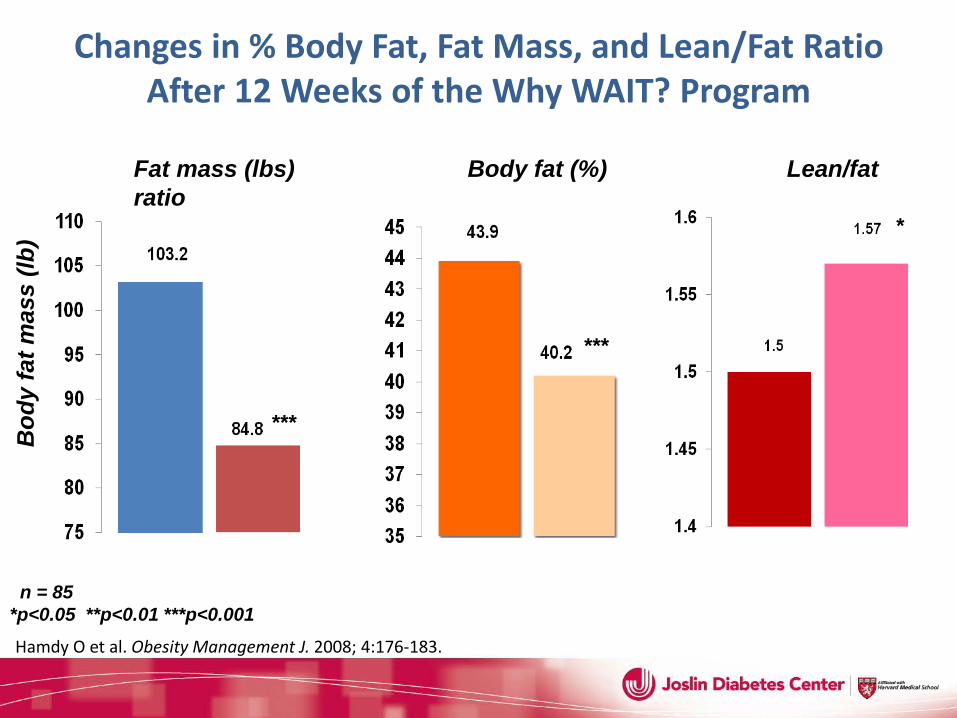
Fat mass (lbs) Body fat (%) Lean/fat ratio
***
***
n = 85 *p<0.05 **p<0.01 ***p<0.001
*
Changes in % Body Fat, Fat Mass, and Lean/Fat Ratio After 12 Weeks of the Why WAIT? Program
Hamdy O et al. Obesity Management J. 2008; 4:176-183.
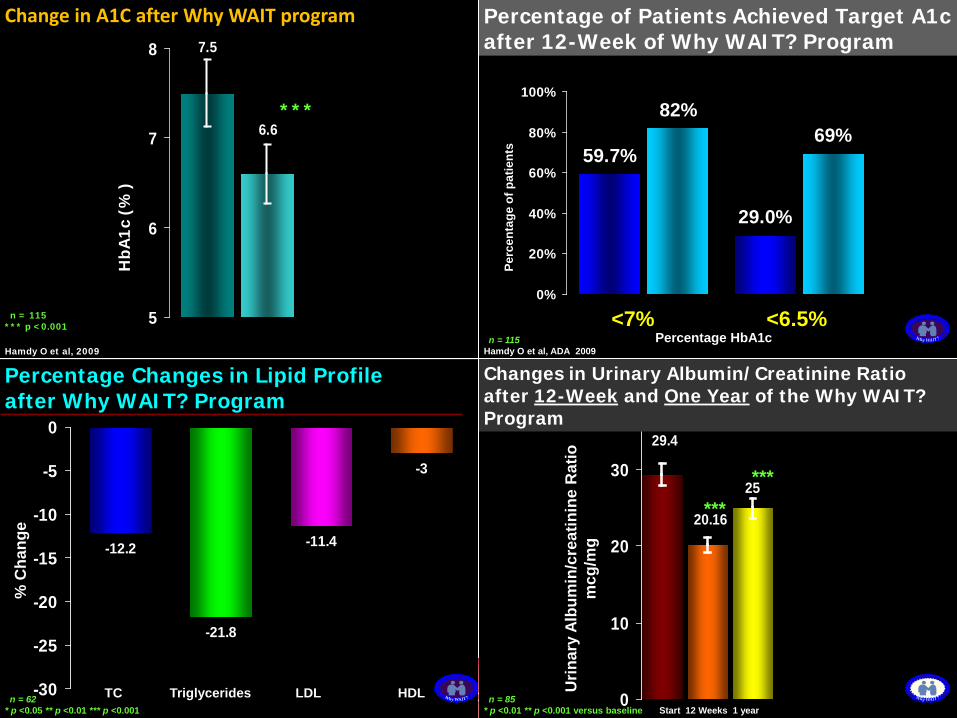
-12.2
-21.8
-11.4
-3
-30
-25
-20
-15
-10
-5
0
% C
hang
e
Percentage Changes in Lipid Profile after Why WAIT? Program
TC Triglycerides LDL HDL n = 62 * p <0.05 ** p <0.01 *** p <0.001
29.4
20.16
25
0
10
20
30
Urin
ary
Albu
min
/cre
atin
ine
Rat
io
mcg
/mg
Changes in Urinary Albumin/Creatinine Ratio after 12-Week and One Year of the Why WAIT? Program
******
Start 12 Weeks 1 yearn = 85
* p <0.01 ** p <0.001 versus baseline
29.0%
69%59.7%
82%
0%
20%
40%
60%
80%
100%
Perc
enta
ge o
f pat
ient
s
n = 115
Percentage of Patients Achieved Target A1c after 12-Week of Why WAIT? Program
<7% <6.5%Percentage HbA1c
Hamdy O et al, ADA 2009
7.5
6.6
5
6
7
8
Change in A1C after Why WAIT program
***H
bA1c
(%
)
n = 115 *** p <0.001
Hamdy O et al, 2009
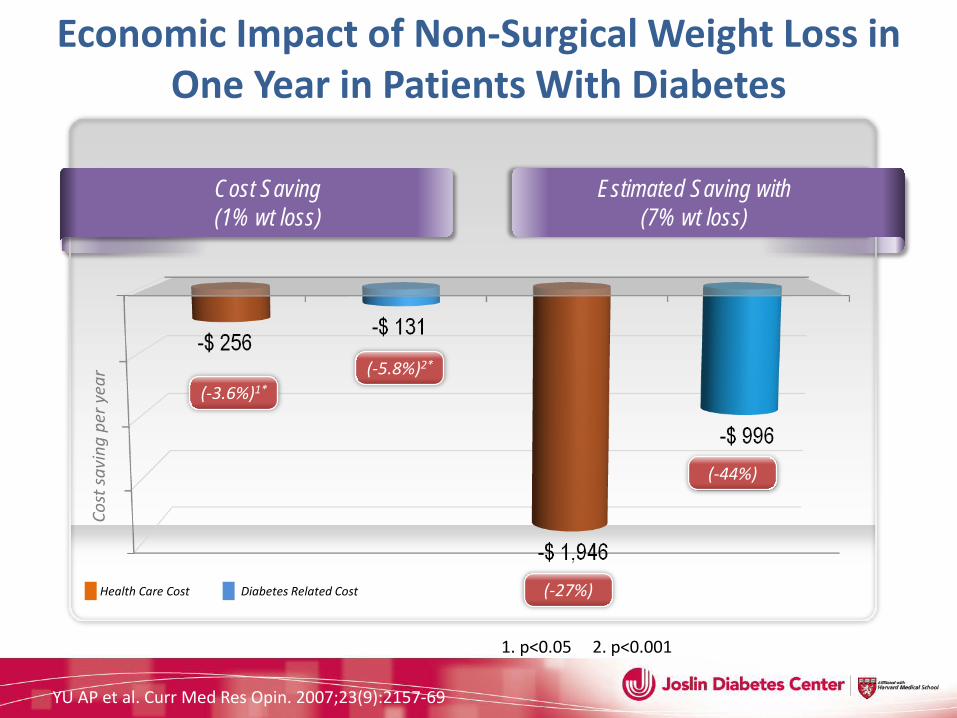
Economic Impact of Non-Surgical Weight Loss in One Year in Patients With Diabetes
Cost Saving (1% wt loss)
Cost
savi
ng p
er y
ear
(-3.6%)1* (-5.8%)2*
(-27%)
(-44%)
Estimated Saving with (7% wt loss)
YU AP et al. Curr Med Res Opin. 2007;23(9):2157-69
Health Care Cost Diabetes Related Cost
1. p<0.05 2. p<0.001
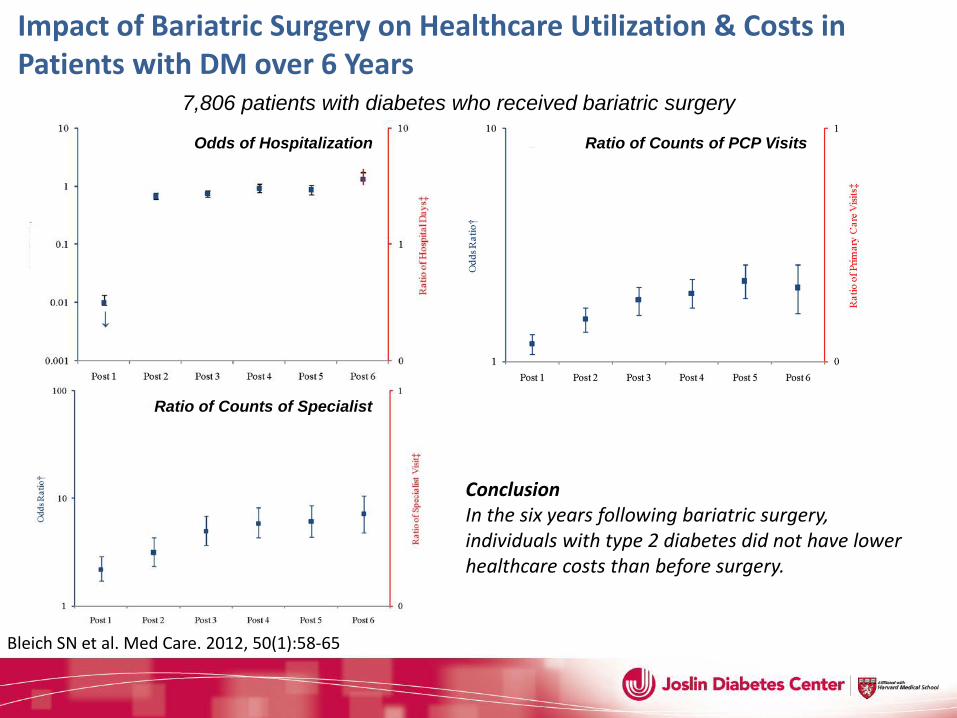
Impact of Bariatric Surgery on Healthcare Utilization & Costs in Patients with DM over 6 Years
Odds of Hospitalization Ratio of Counts of PCP Visits
Ratio of Counts of Specialist
Conclusion In the six years following bariatric surgery, individuals with type 2 diabetes did not have lower healthcare costs than before surgery.
Bleich SN et al. Med Care. 2012, 50(1):58-65
7,806 patients with diabetes who received bariatric surgery
http://www.TheDiabetesBreakthrough.com
Harvard Health Publications
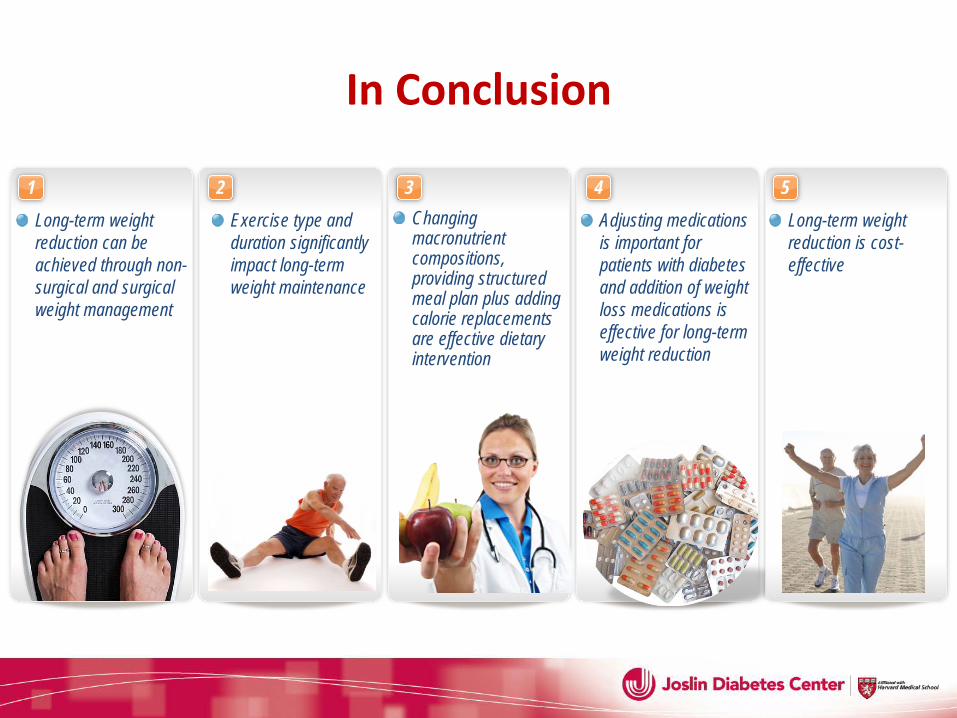
In Conclusion
Long-term weight reduction can be achieved through non-surgical and surgical weight management
1 Exercise type and duration significantly impact long-term weight maintenance
2 Changing macronutrient compositions, providing structured meal plan plus adding calorie replacements are effective dietary intervention
3 4 Adjusting medications is important for patients with diabetes and addition of weight loss medications is effective for long-term weight reduction
5 Long-term weight reduction is cost-effective


Thank You