Novel Ion Mobility Technology for LC/MS · PDF file• Custom reporting to comprehensively...
77
Novel Ion Mobility Technology for LC/MS Jaume C. Morales MS Product Specialist February 26, 2014 1
Transcript of Novel Ion Mobility Technology for LC/MS · PDF file• Custom reporting to comprehensively...
Novel Ion Mobility Technology for LC/MS
Jaume C. Morales
MS Product Specialist
February 26, 2014
1

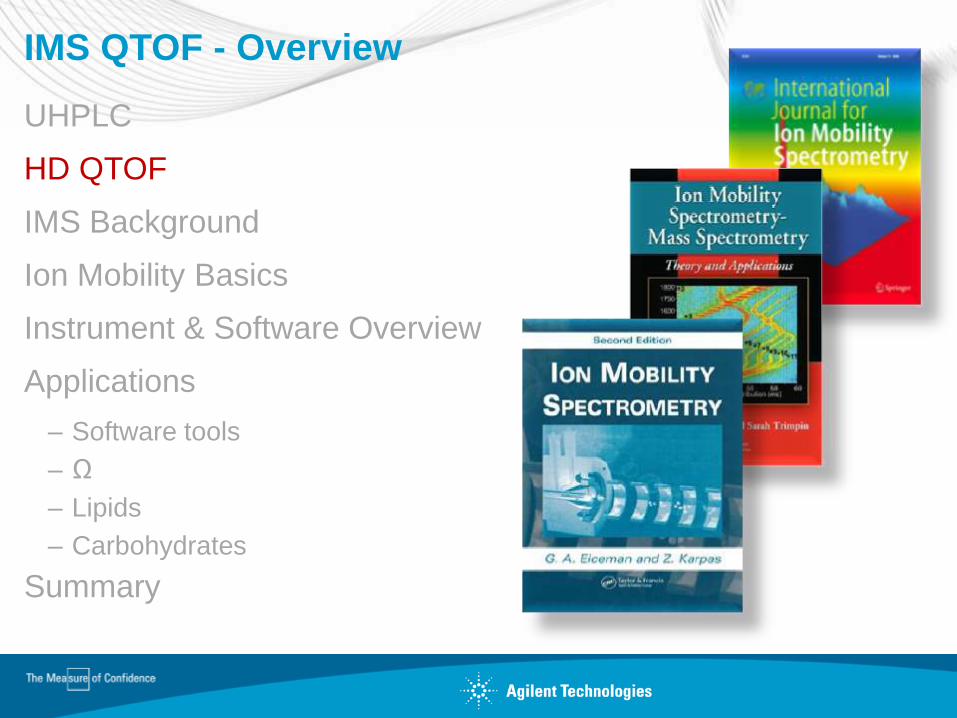
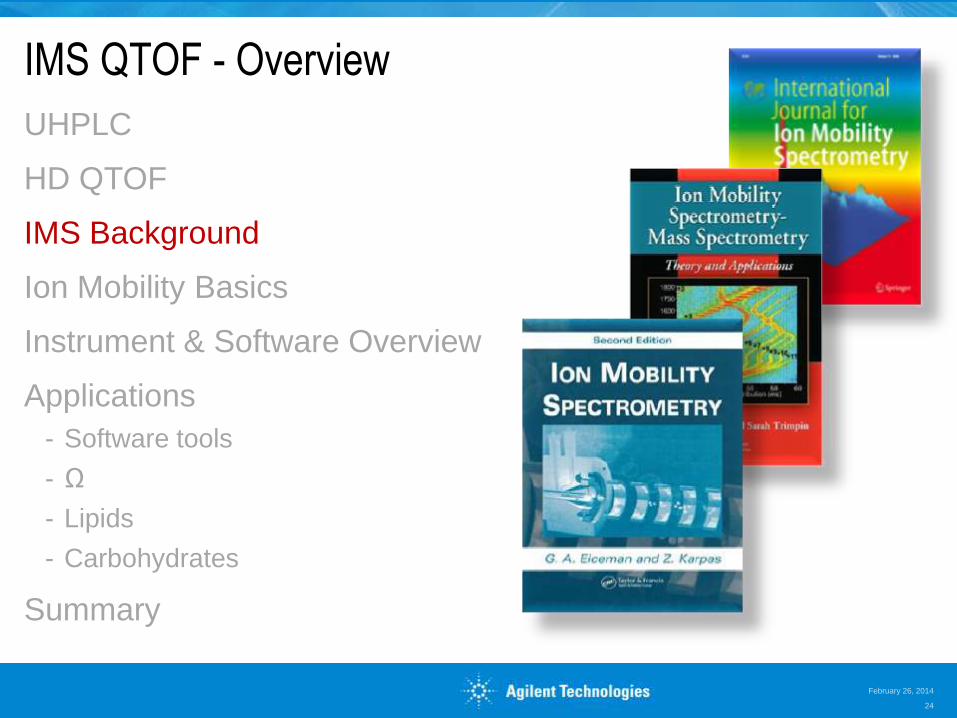
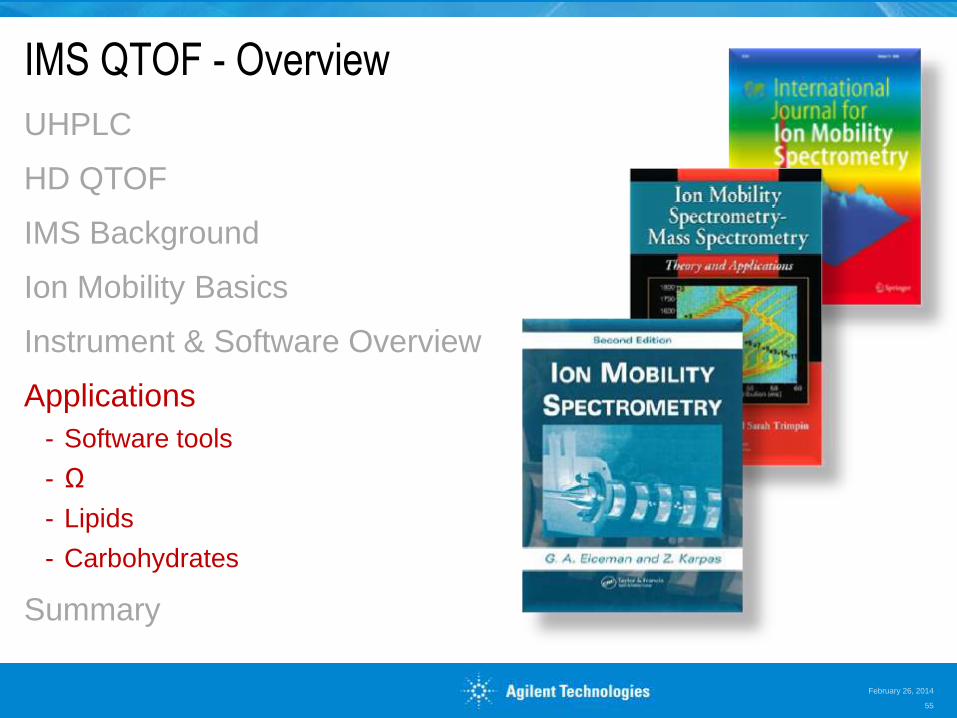
IMS QTOF - Overview
UHPLC
HD QTOF
IMS Background
Ion Mobility Basics
Instrument & Software Overview
Applications
- Software tools
- Ω
- Lipids
- Carbohydrates
Summary
February 26, 2014
2
ASMS 2013 Ion Mobility
Abstracts
IMS QTOF - Overview
UHPLC
HD QTOF
IMS Background
Ion Mobility Basics
Instrument & Software Overview
Applications
- Software tools
- Ω
- Lipids
- Carbohydrates
Summary
February 26, 2014
3
ASMS 2013 Ion Mobility
Abstracts
Nueva serie
LC Agilent
1200 Infinity
Page 4
Presentación de los
instrumentos LC de la nueva
plataforma
Agilent – 1220, 1260 y 1290
Page 5
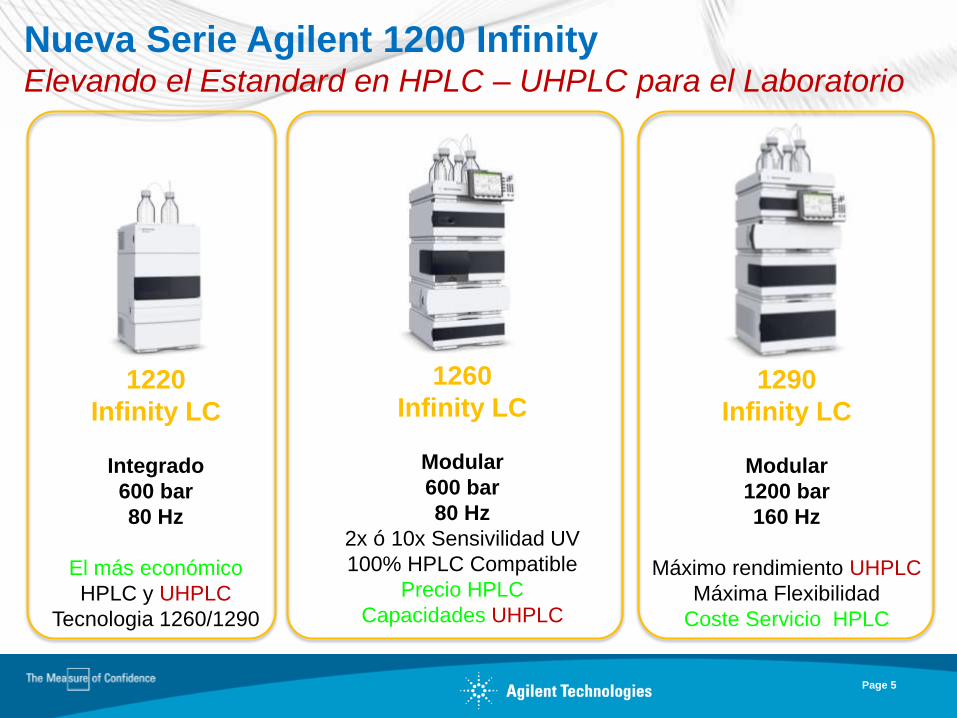
Nueva Serie Agilent 1200 Infinity Elevando el Estandard en HPLC – UHPLC para el Laboratorio
1260
Infinity LC
Modular
600 bar
80 Hz
2x ó 10x Sensivilidad UV
100% HPLC Compatible
Precio HPLC
Capacidades UHPLC
1220
Infinity LC
Integrado
600 bar
80 Hz
El más económico
HPLC y UHPLC
Tecnologia 1260/1290
1290
Infinity LC
Modular
1200 bar
160 Hz
Máximo rendimiento UHPLC
Máxima Flexibilidad
Coste Servicio HPLC
Page 7
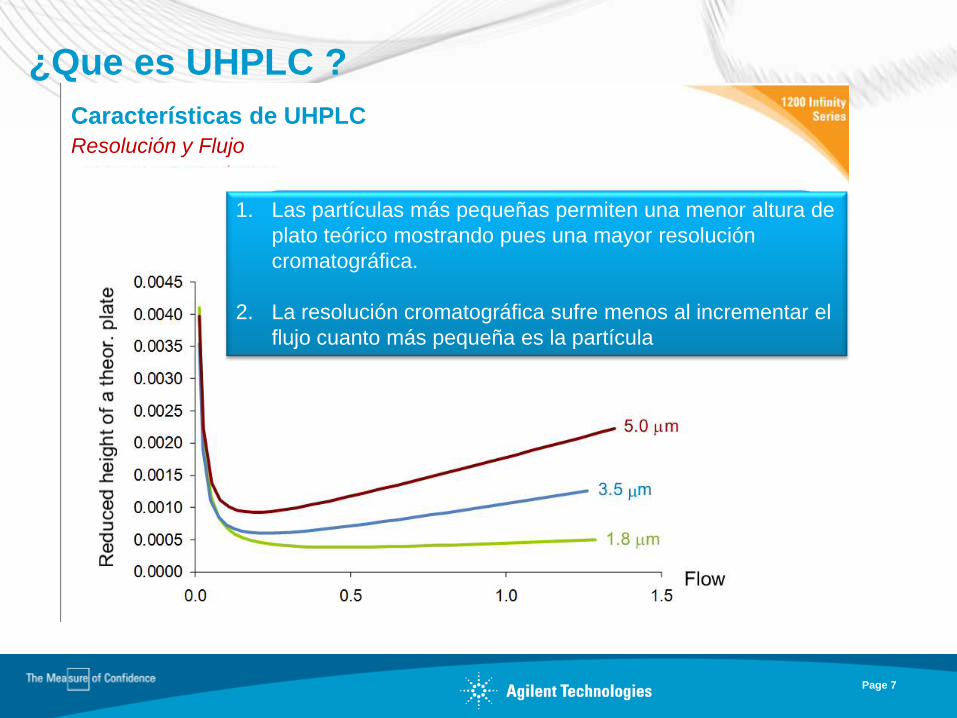
¿Que es UHPLC ?
1. Las partículas más pequeñas permiten una menor altura de
plato teórico mostrando pues una mayor resolución
cromatográfica.
2. La resolución cromatográfica sufre menos al incrementar el
flujo cuanto más pequeña es la partícula
Características de UHPLC
Resolución y Flujo

Page 8
Nueva Serie Agilent 1200 Infinity Elevando el Estandard en HPLC – UHPLC para el Laboratorio
1260
Infinity LC
Modular
600 bar
80 Hz
2x ó 10x Sensivilidad UV
100% HPLC Compatible
Precio HPLC
Capacidades UHPLC
1220
Infinity LC
Integrado
600 bar
80 Hz
El más económico
HPLC y UHPLC
Tecnologia 1260/1290
1290
Infinity LC
Modular
1200 bar
160 Hz
Máximo rendimiento UHPLC
Máxima Flexibilidad
Coste Servicio HPLC
Page 9
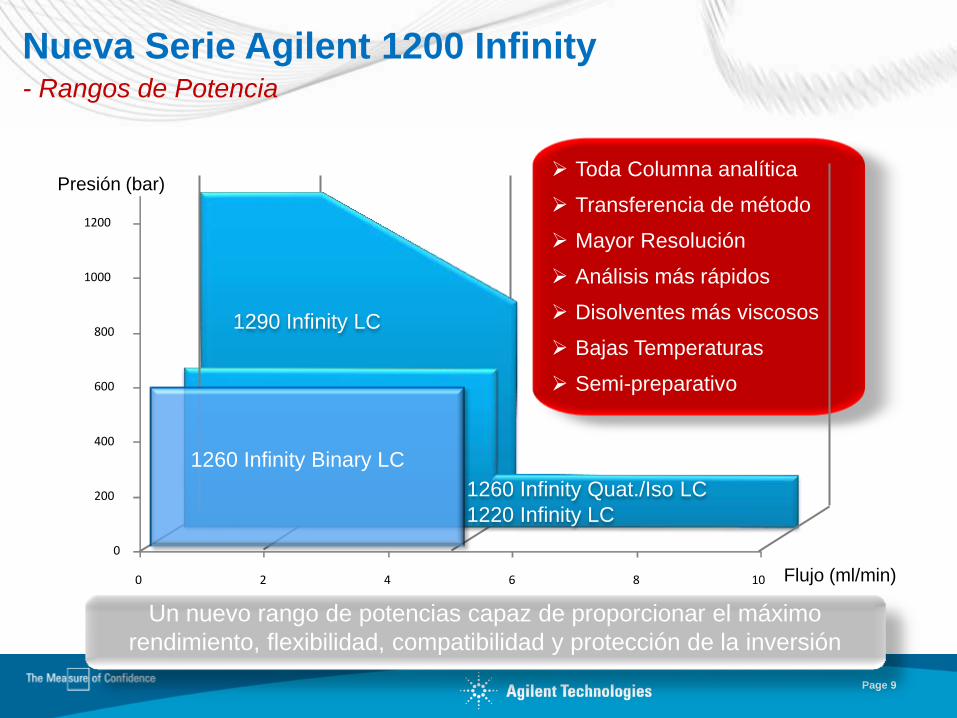
Nueva Serie Agilent 1200 Infinity - Rangos de Potencia
0
200
400
600
800
1000
1200
0 2 4 6 8 10
Toda Columna analítica
Transferencia de método
Mayor Resolución
Análisis más rápidos
Disolventes más viscosos
Bajas Temperaturas
Semi-preparativo
1290 Infinity LC
1260 Infinity Quat./Iso LC
1220 Infinity LC
Presión (bar)
Flujo (ml/min)
1260 Infinity Binary LC
Un nuevo rango de potencias capaz de proporcionar el máximo
rendimiento, flexibilidad, compatibilidad y protección de la inversión
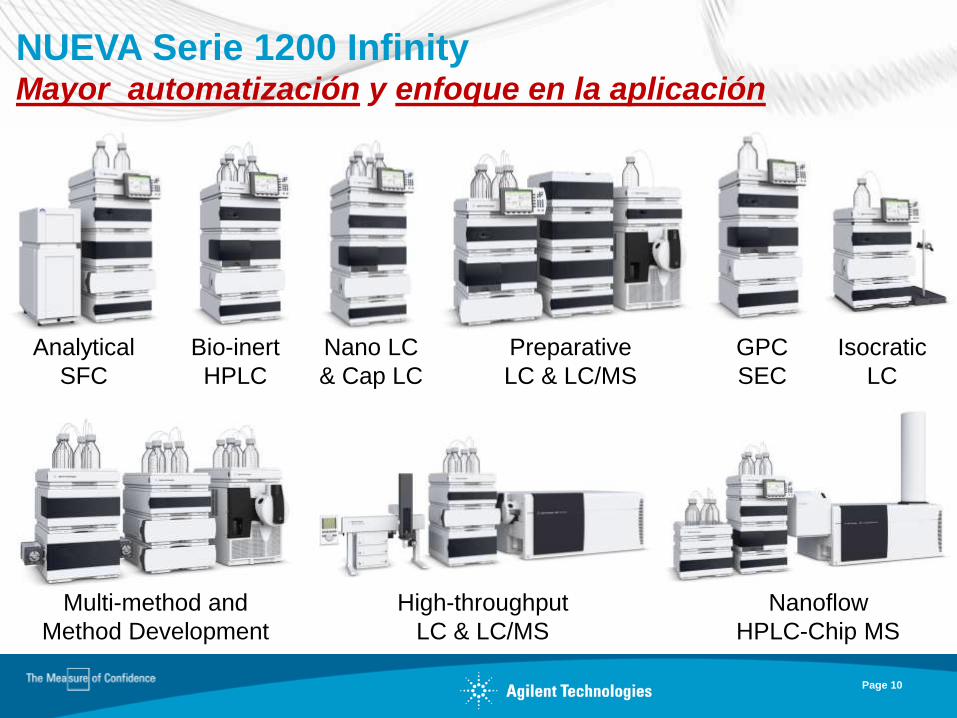
NUEVA Serie 1200 Infinity Mayor automatización y enfoque en la aplicación
GPC
SEC
Preparative
LC & LC/MS
Nanoflow
HPLC-Chip MS
Isocratic
LC
Nano LC
& Cap LC
Analytical
SFC
Bio-inert
HPLC
Multi-method and
Method Development
High-throughput
LC & LC/MS
Page 10
IMS QTOF - Overview
UHPLC
HD QTOF
IMS Background
Ion Mobility Basics
Instrument & Software Overview
Applications
– Software tools
– Ω
– Lipids
– Carbohydrates
Summary
ASMS 2013 Ion Mobility
Abstracts
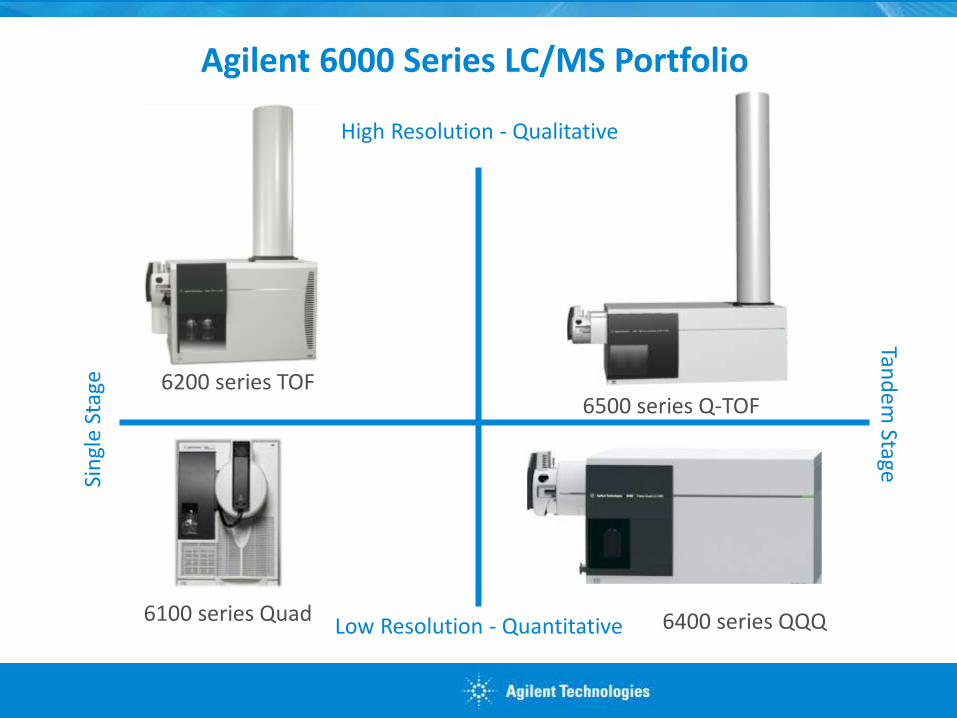
Agilent 6000 Series LC/MS Portfolio
6200 series TOF
6100 series Quad
6500 series Q-TOF
6400 series QQQ
High Resolution - Qualitative
Low Resolution - Quantitative
Sin
gle
Stag
e Tan
dem
Stage
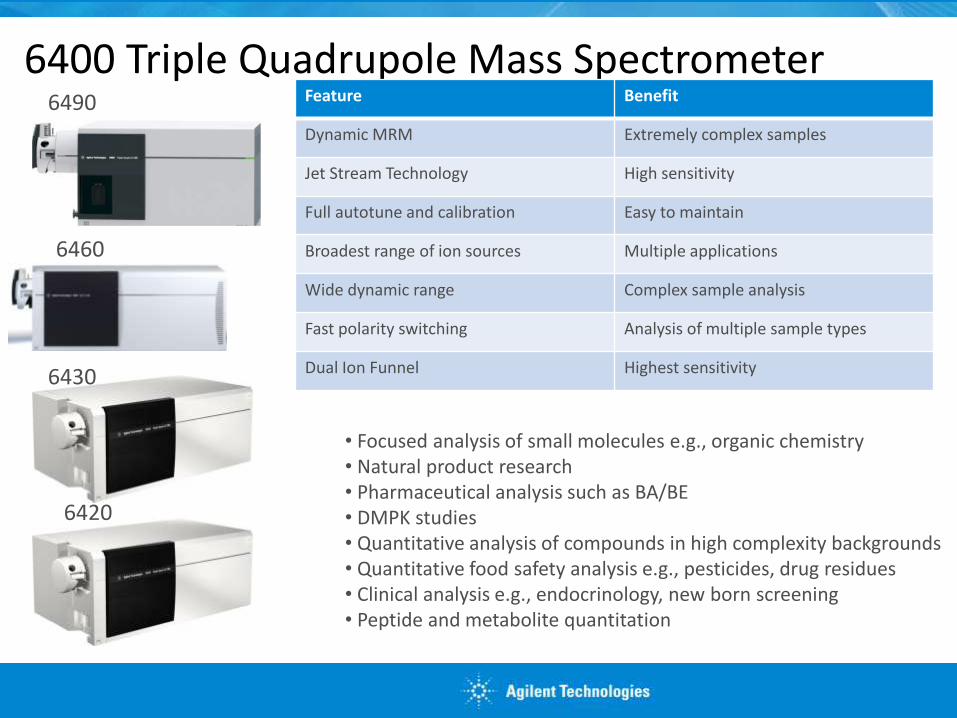
6400 Triple Quadrupole Mass Spectrometer Feature Benefit
Dynamic MRM Extremely complex samples
Jet Stream Technology High sensitivity
Full autotune and calibration Easy to maintain
Broadest range of ion sources Multiple applications
Wide dynamic range Complex sample analysis
Fast polarity switching Analysis of multiple sample types
Dual Ion Funnel Highest sensitivity
6460
6420
• Focused analysis of small molecules e.g., organic chemistry • Natural product research • Pharmaceutical analysis such as BA/BE • DMPK studies • Quantitative analysis of compounds in high complexity backgrounds • Quantitative food safety analysis e.g., pesticides, drug residues • Clinical analysis e.g., endocrinology, new born screening • Peptide and metabolite quantitation
6430
6490
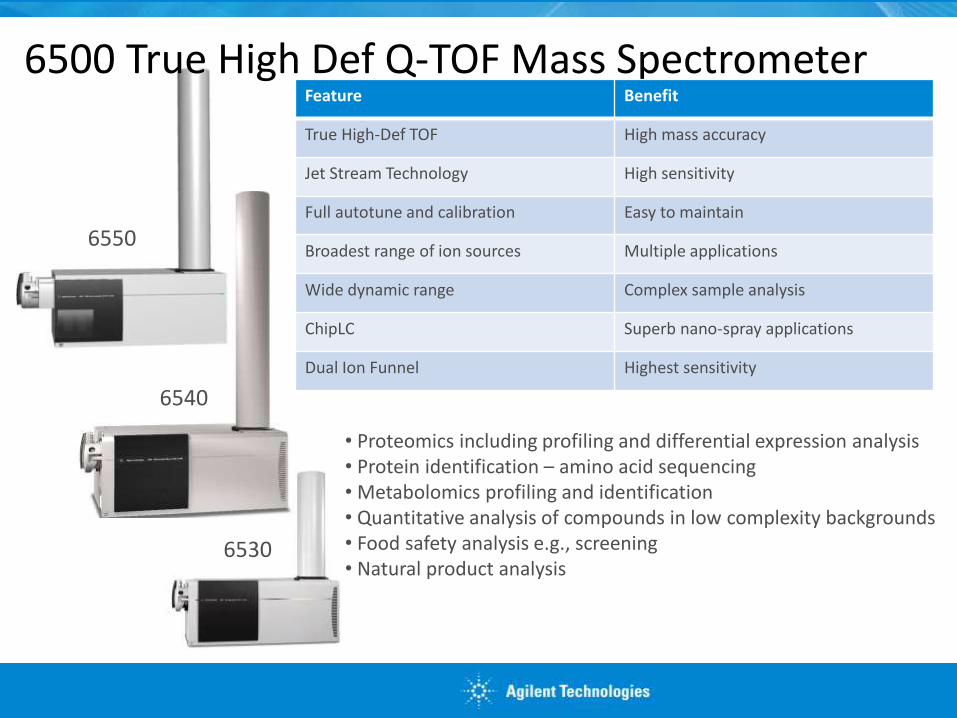
6500 True High Def Q-TOF Mass Spectrometer Feature Benefit
True High-Def TOF High mass accuracy
Jet Stream Technology High sensitivity
Full autotune and calibration Easy to maintain
Broadest range of ion sources Multiple applications
Wide dynamic range Complex sample analysis
ChipLC Superb nano-spray applications
Dual Ion Funnel Highest sensitivity
6530
6540
• Proteomics including profiling and differential expression analysis • Protein identification – amino acid sequencing • Metabolomics profiling and identification • Quantitative analysis of compounds in low complexity backgrounds • Food safety analysis e.g., screening • Natural product analysis
6550

Agilent 6550 Q-TOF with iFunnel Technologies
New- Ion Beam
Compression and
Shaping (resolution
+ sensitivity)
New- iFunnel (10X
sensitivity gain)
Hexapole axial focusing collision cell
(faster MS/MS spectra)
New- Dual Agilent
JetStream orthogonal
spray (robust and
stable mass
calibration)
4 GHz digitizer + ADC
detector
(resolution, mass accuracy,
dynamic range)
Longer Invar flight tube
(resolution + stable mass
accuracy)
New embedded processor
(50 spectra/sec)
March 2, 2012 15
6550 iFunnel Q-TOF
LC/MS System
ASMS 2010
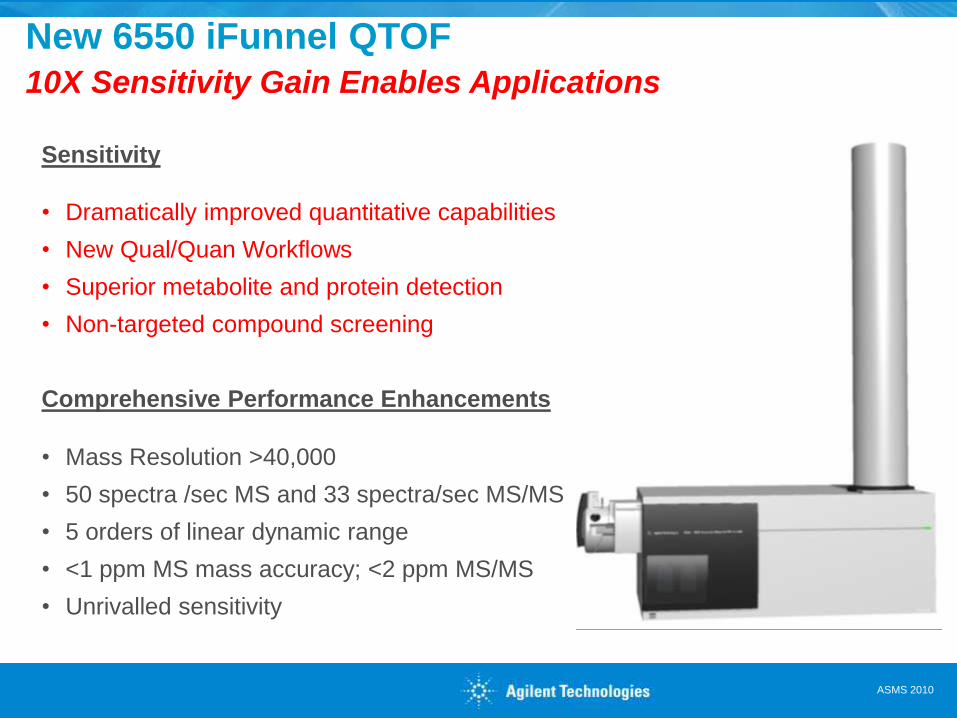
Sensitivity
• Dramatically improved quantitative capabilities
• New Qual/Quan Workflows
• Superior metabolite and protein detection
• Non-targeted compound screening
Comprehensive Performance Enhancements
• Mass Resolution >40,000
• 50 spectra /sec MS and 33 spectra/sec MS/MS
• 5 orders of linear dynamic range
• <1 ppm MS mass accuracy; <2 ppm MS/MS
• Unrivalled sensitivity
New 6550 iFunnel QTOF
10X Sensitivity Gain Enables Applications
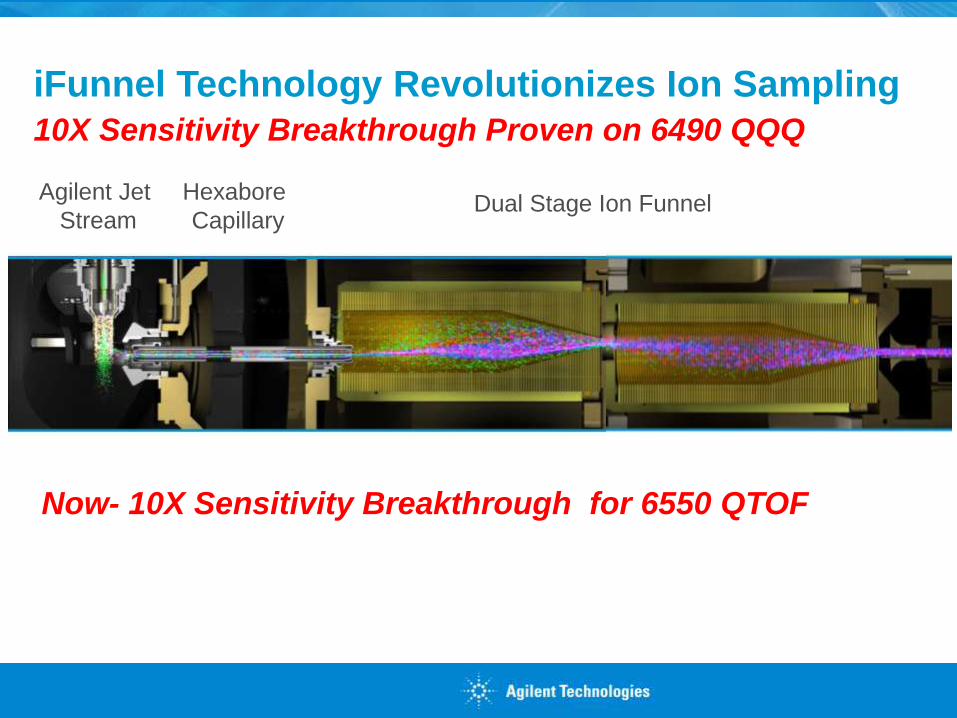
iFunnel Technology Revolutionizes Ion Sampling
10X Sensitivity Breakthrough Proven on 6490 QQQ
Agilent Jet
Stream
Hexabore
Capillary Dual Stage Ion Funnel
Now- 10X Sensitivity Breakthrough for 6550 QTOF
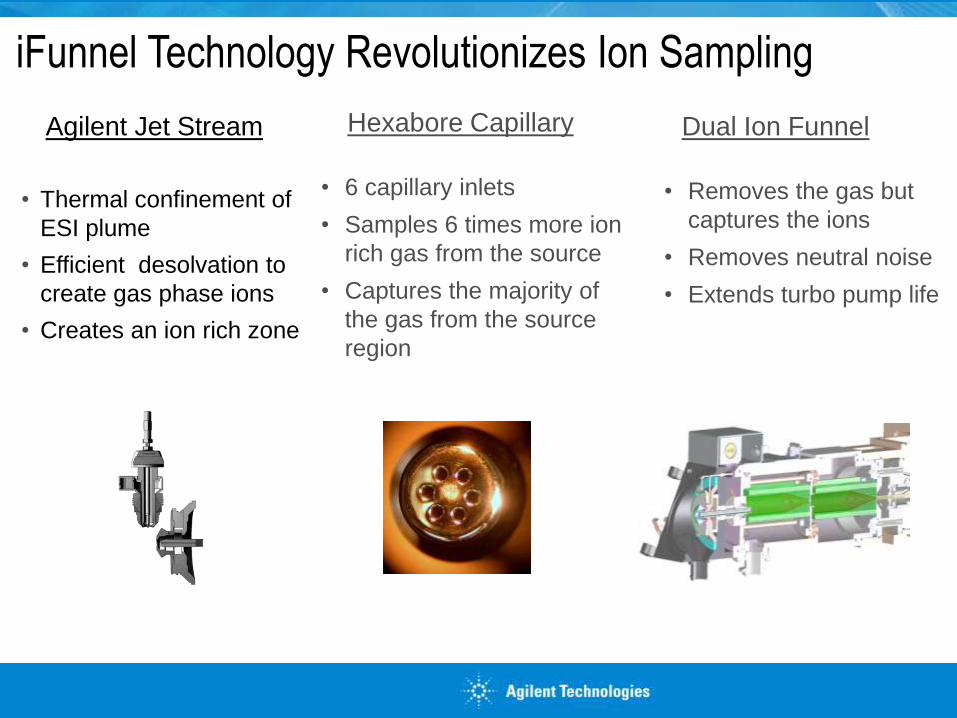
iFunnel Technology Revolutionizes Ion Sampling
Agilent Jet Stream
• Thermal confinement of
ESI plume
• Efficient desolvation to
create gas phase ions
• Creates an ion rich zone
Hexabore Capillary
• 6 capillary inlets
• Samples 6 times more ion
rich gas from the source
• Captures the majority of
the gas from the source
region
Dual Ion Funnel
• Removes the gas but
captures the ions
• Removes neutral noise
• Extends turbo pump life
2. Instrument and Software Overview
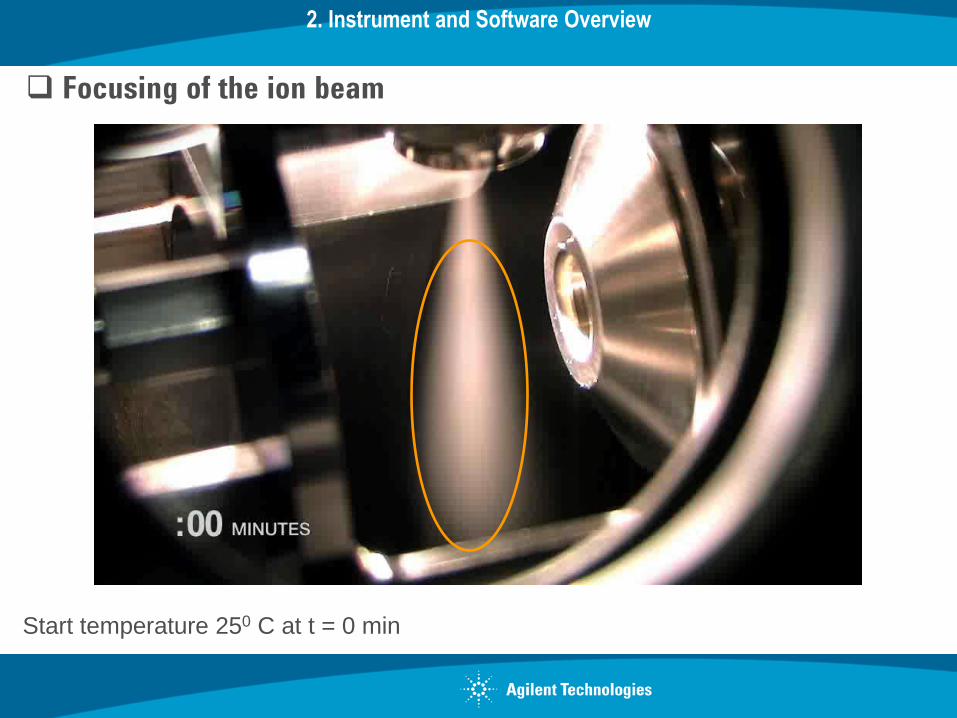
Start temperature 250 C at t = 0 min
Focusing of the ion beam
2. Instrument and Software Overview
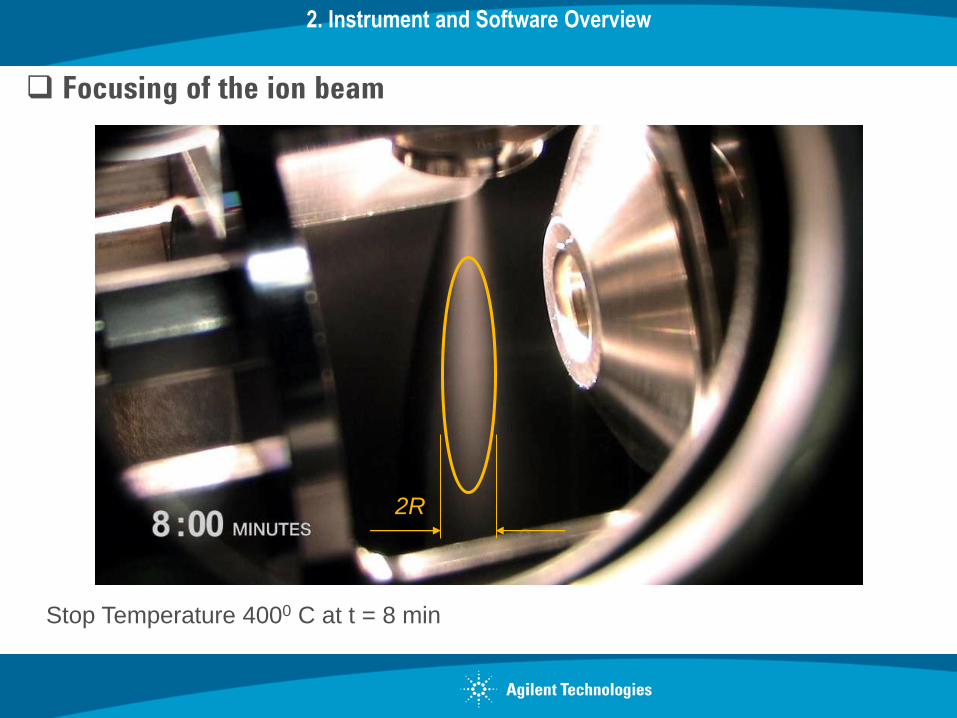
Focusing of the ion beam
2R
Stop Temperature 4000 C at t = 8 min
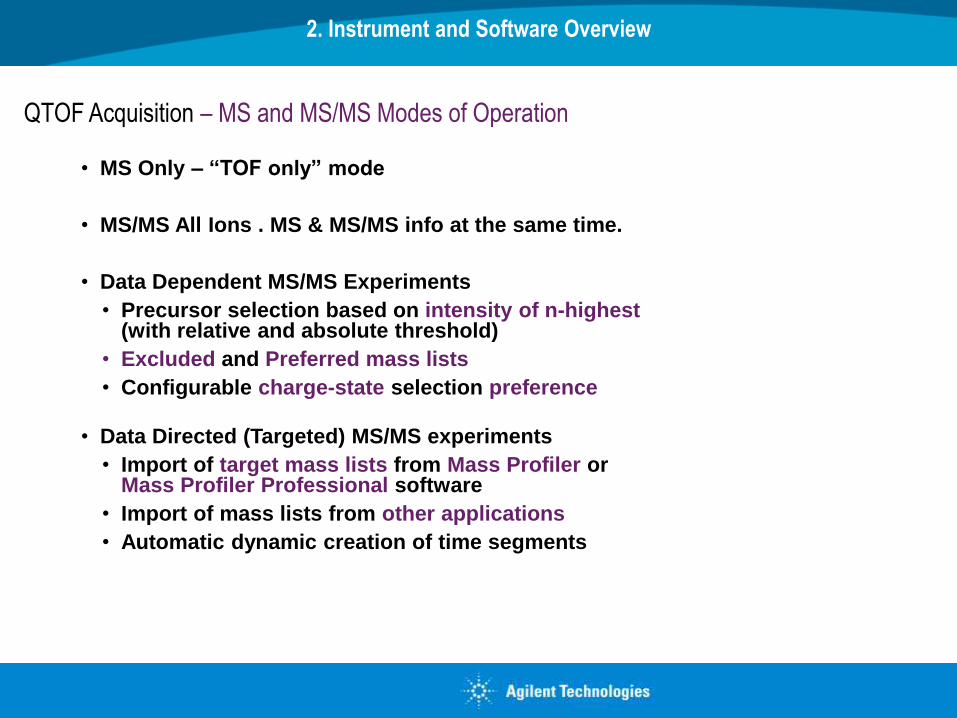
QTOF Acquisition – MS and MS/MS Modes of Operation
• MS Only – “TOF only” mode
• MS/MS All Ions . MS & MS/MS info at the same time.
• Data Dependent MS/MS Experiments
• Precursor selection based on intensity of n-highest (with relative and absolute threshold)
• Excluded and Preferred mass lists
• Configurable charge-state selection preference
• Data Directed (Targeted) MS/MS experiments
• Import of target mass lists from Mass Profiler or Mass Profiler Professional software
• Import of mass lists from other applications
• Automatic dynamic creation of time segments
2. Instrument and Software Overview
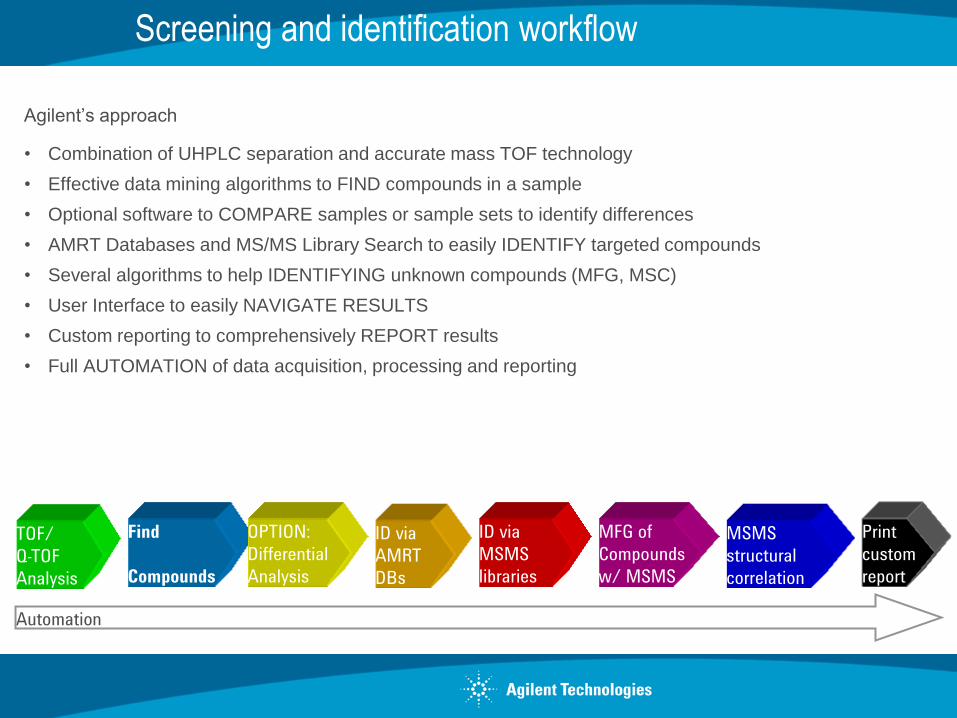
Screening and identification workflow
Agilent’s approach
• Combination of UHPLC separation and accurate mass TOF technology
• Effective data mining algorithms to FIND compounds in a sample
• Optional software to COMPARE samples or sample sets to identify differences
• AMRT Databases and MS/MS Library Search to easily IDENTIFY targeted compounds
• Several algorithms to help IDENTIFYING unknown compounds (MFG, MSC)
• User Interface to easily NAVIGATE RESULTS
• Custom reporting to comprehensively REPORT results
• Full AUTOMATION of data acquisition, processing and reporting
TOF/
Q-TOF
Analysis
ID via
AMRT
DBs
Find
Compounds
MFG of
Compounds
w/ MSMS
MSMS
structural
correlation
ID via
MSMS
libraries
OPTION:
Differential
Analysis
custom
report
Automation
Screening and identification workflow
TOF/
Q-TOF
Analysis
ID via
AMRT
DBs
Molecular
Feature
Finding
MFG of
Compounds
w/ MSMS
MSMS
structural
correlation
ID via
MSMS
libraries
Automation
OPTION:
Differential
Analysis
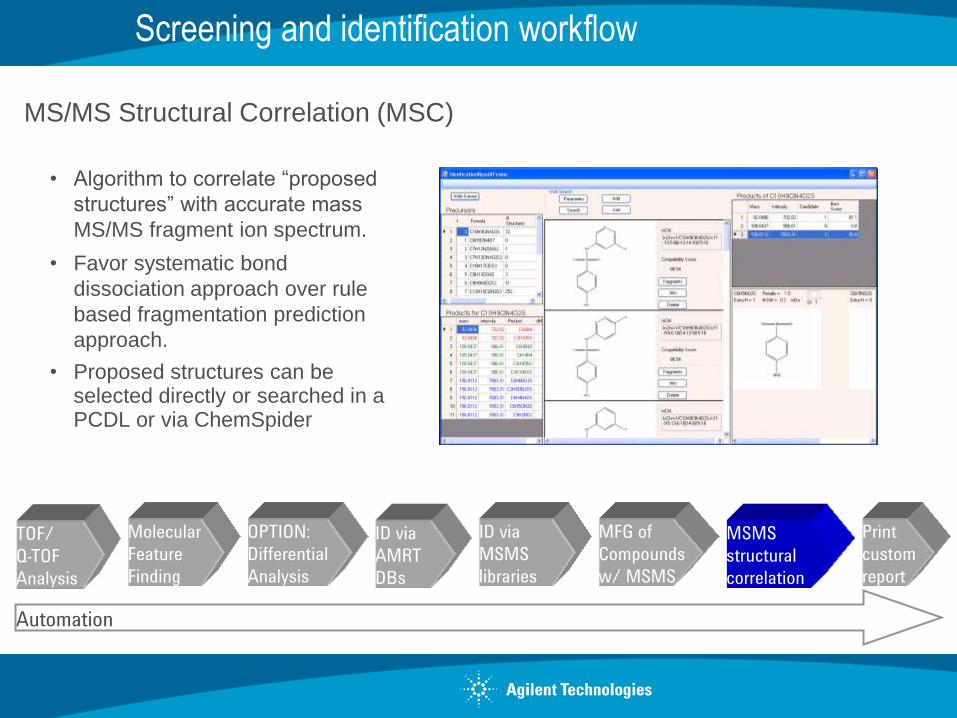
MS/MS Structural Correlation (MSC)
custom
report
• Algorithm to correlate “proposed
structures” with accurate mass
MS/MS fragment ion spectrum.
• Favor systematic bond
dissociation approach over rule
based fragmentation prediction
approach.
• Proposed structures can be selected directly or searched in a PCDL or via ChemSpider
IMS QTOF - Overview
UHPLC
HD QTOF
IMS Background
Ion Mobility Basics
Instrument & Software Overview
Applications
- Software tools
- Ω
- Lipids
- Carbohydrates
Summary
February 26, 2014
24
ASMS 2013 Ion Mobility
Abstracts
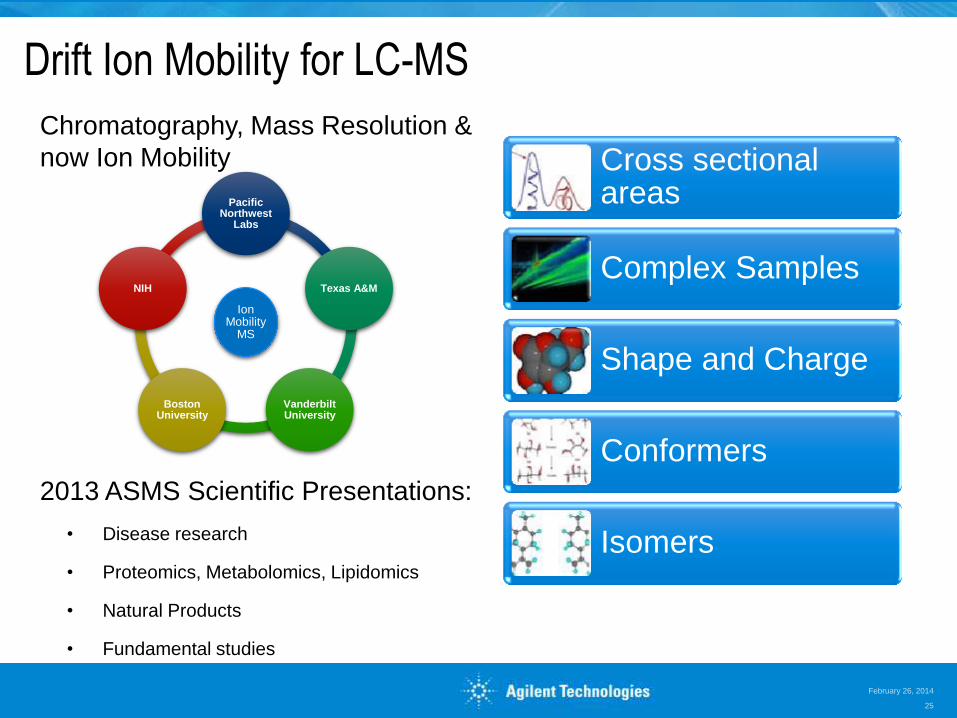
Drift Ion Mobility for LC-MS
Cross sectional areas
Complex Samples
Shape and Charge
Conformers
Isomers
Chromatography, Mass Resolution &
now Ion Mobility
2013 ASMS Scientific Presentations:
• Disease research
• Proteomics, Metabolomics, Lipidomics
• Natural Products
• Fundamental studies
Ion Mobility
MS
Pacific Northwest
Labs
Texas A&M
Vanderbilt University
Boston University
NIH
February 26, 2014
25

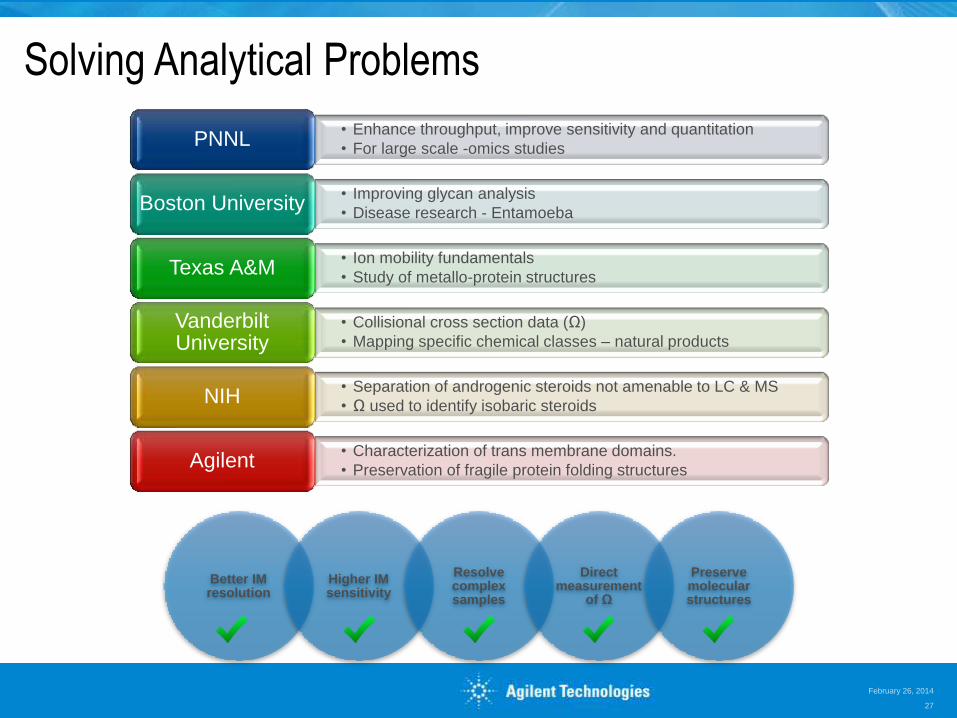
Solving Analytical Problems
February 26, 2014
26
Better IM resolution
Higher IM sensitivity
Resolve complex samples
Direct measurement
of Ω
Preserve molecular structures
• Richard Smith
• Erin Baker PNNL
• Cathy Costello
• Joe Zaia Boston University
• David Russell
• Fred Zinnell Texas A&M
• John McLean, Jody May and Cody Goodwin Vanderbilt University
• Al Yergey
• Peter Backlund. NIH
• Agilent LABS R&D Agilent
Solving Analytical Problems
February 26, 2014
27
Better IM resolution
Higher IM sensitivity
Resolve complex samples
Direct measurement
of Ω
Preserve molecular structures
• Enhance throughput, improve sensitivity and quantitation
• For large scale -omics studies PNNL
• Improving glycan analysis
• Disease research - Entamoeba Boston University
• Ion mobility fundamentals
• Study of metallo-protein structures Texas A&M
• Collisional cross section data (Ω)
• Mapping specific chemical classes – natural products
Vanderbilt University
• Separation of androgenic steroids not amenable to LC & MS
• Ω used to identify isobaric steroids NIH
• Characterization of trans membrane domains.
• Preservation of fragile protein folding structures Agilent
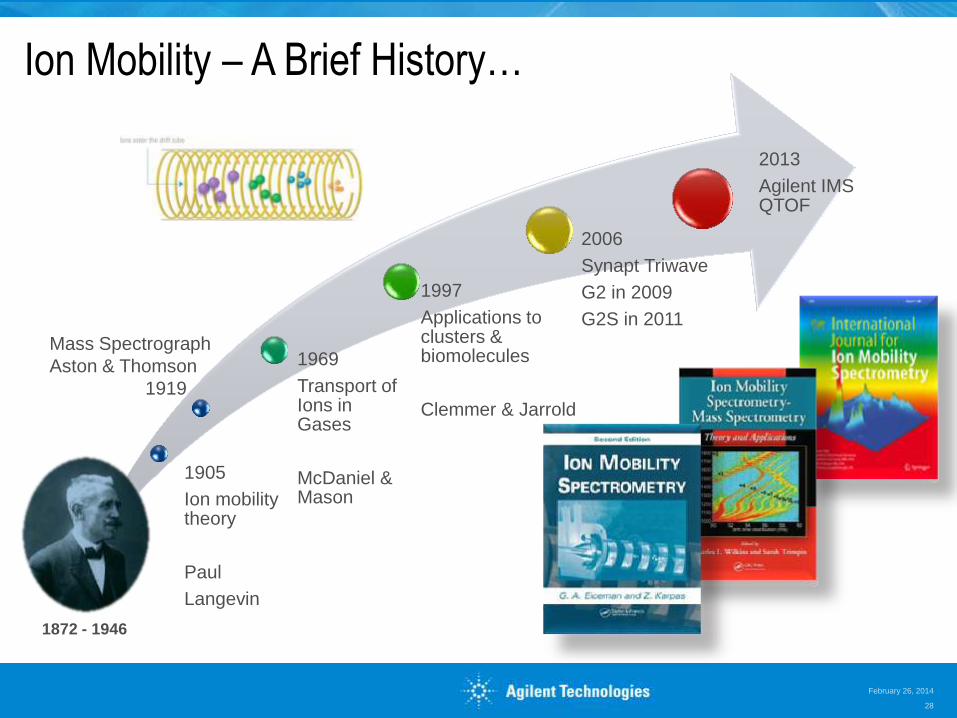
Ion Mobility – A Brief History…
February 26, 2014
28
1905
Ion mobility theory
Paul
Langevin
1969
Transport of Ions in Gases
McDaniel & Mason
1997
Applications to clusters & biomolecules
Clemmer & Jarrold
2006
Synapt Triwave
G2 in 2009
G2S in 2011
2013
Agilent IMS QTOF
1872 - 1946
Mass Spectrograph
Aston & Thomson
1919

IMS QTOF - Overview
UHPLC
HD QTOF
IMS Background
Ion Mobility Basics
Instrument & Software Overview
Applications
- Software tools
- Ω
- Lipids
- Carbohydrates
Summary
February 26, 2014
29
ASMS 2013 Ion Mobility
Abstracts
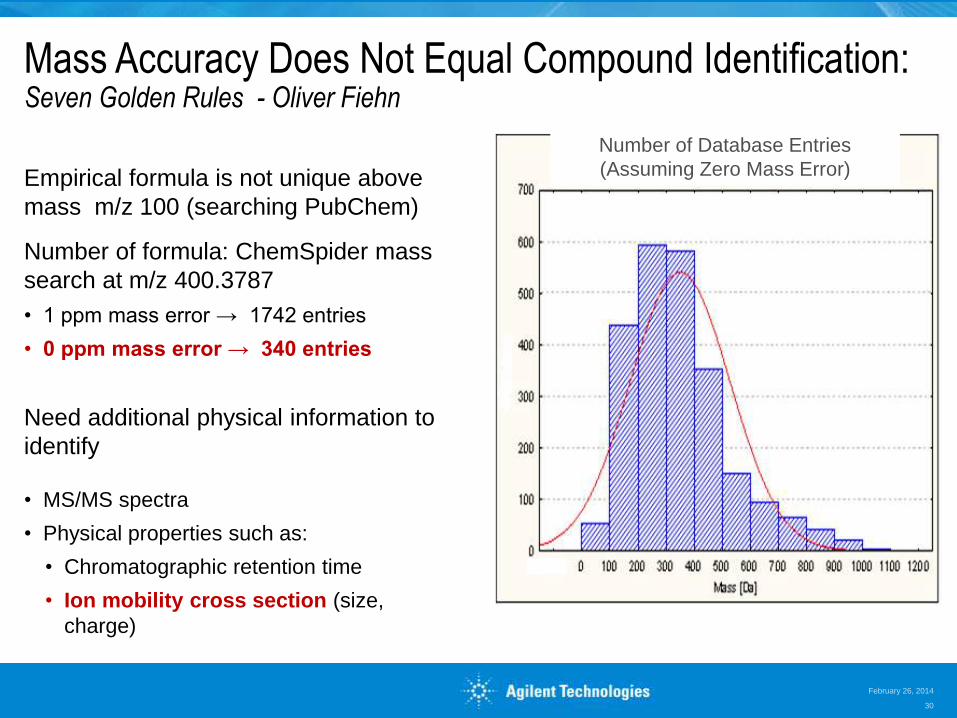
Mass Accuracy Does Not Equal Compound Identification: Seven Golden Rules - Oliver Fiehn
Empirical formula is not unique above
mass m/z 100 (searching PubChem)
Number of formula: ChemSpider mass
search at m/z 400.3787
• 1 ppm mass error → 1742 entries
• 0 ppm mass error → 340 entries
Need additional physical information to
identify
• MS/MS spectra
• Physical properties such as:
• Chromatographic retention time
• Ion mobility cross section (size,
charge)
Number of Database Entries
(Assuming Zero Mass Error)
February 26, 2014
30
What Does Ion Mobility Bring to Mass Spectrometry?
Separation
• Ion Mobility resolves of many isomeric analytes otherwise impossible to
determine by mass spectrometry alone.
Improves Detection Limits
• Ion Mobility dramatically reduces interference from other analytes and
background.
Confirmation
• Collision Cross Section data gives additional information supporting
compound characterization and identification.
February 26, 2014
31
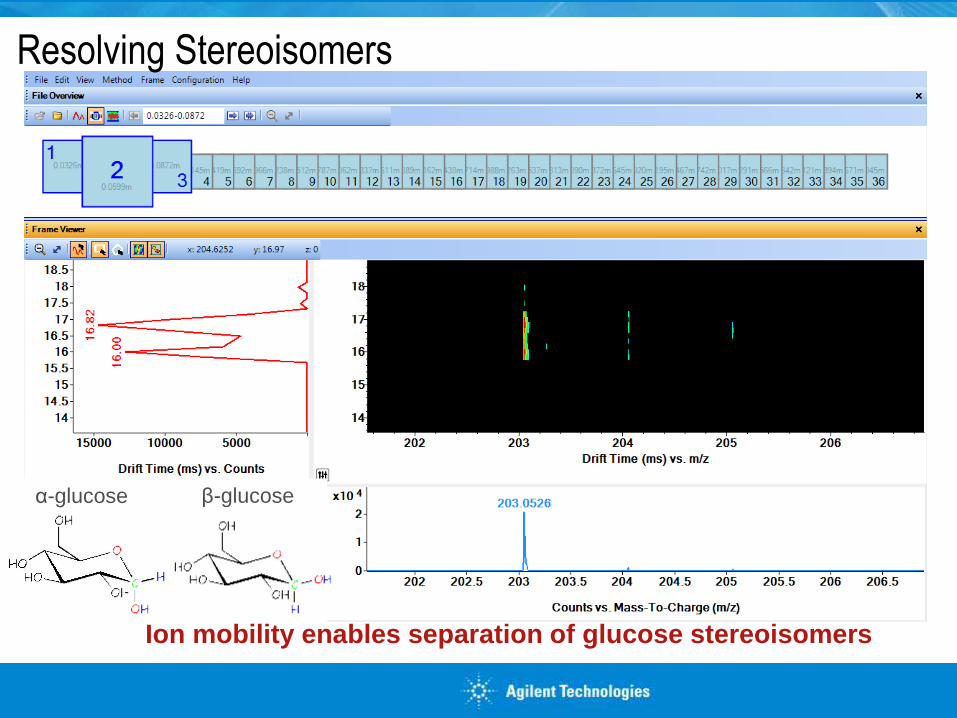
Resolving Stereoisomers
α-glucose β-glucose
Ion mobility enables separation of glucose stereoisomers
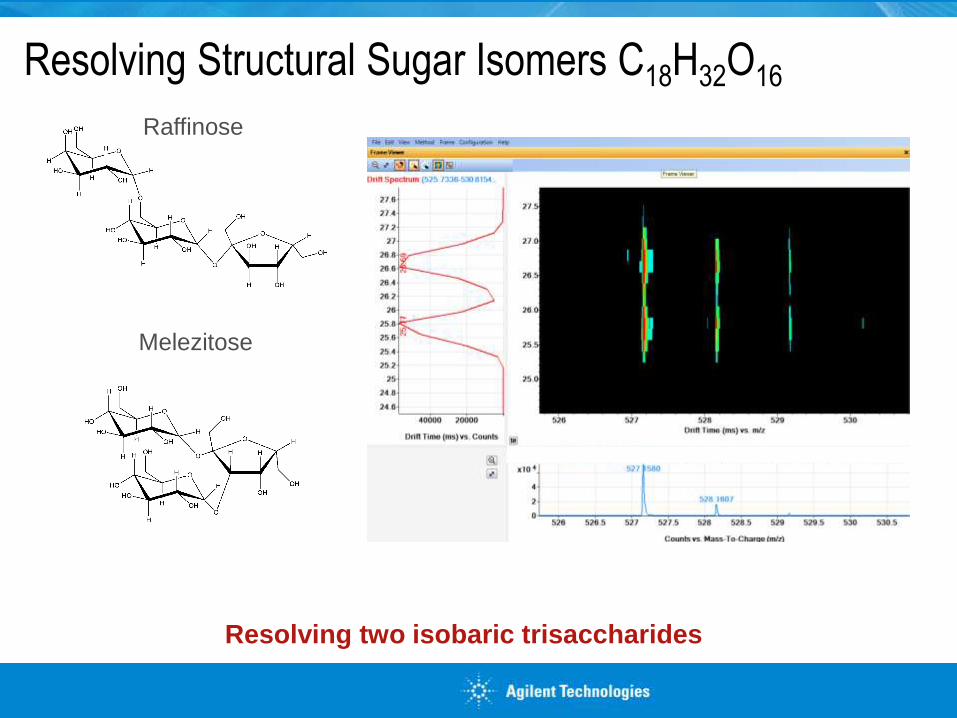
Resolving Structural Sugar Isomers C18H32O16
Melezitose
Raffinose
Resolving two isobaric trisaccharides
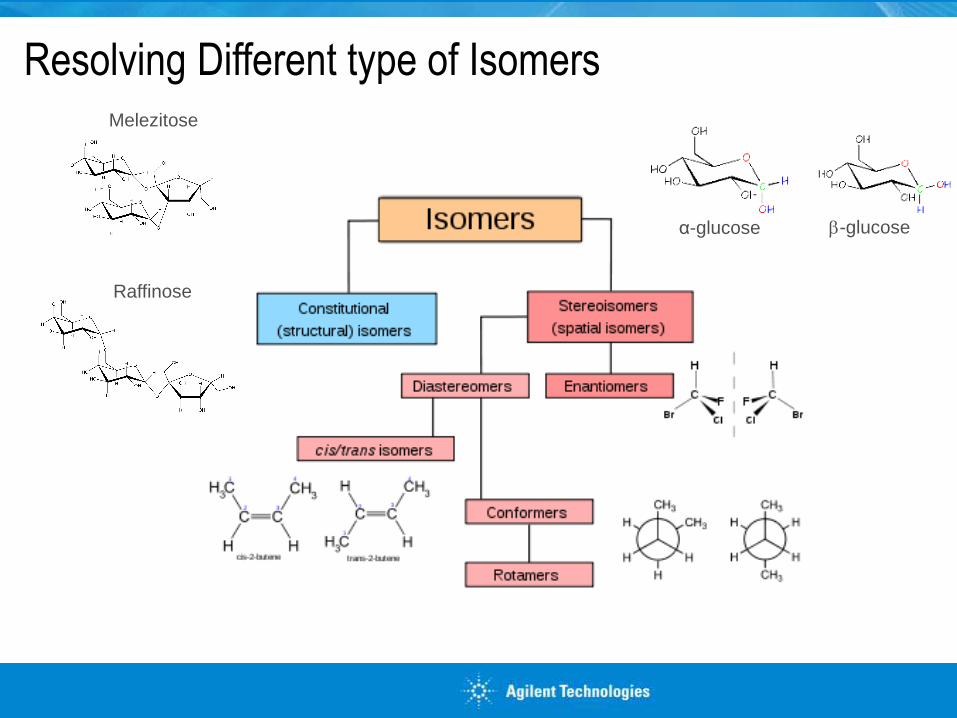
Melezitose
Raffinose
α-glucose b-glucose
Resolving Different type of Isomers
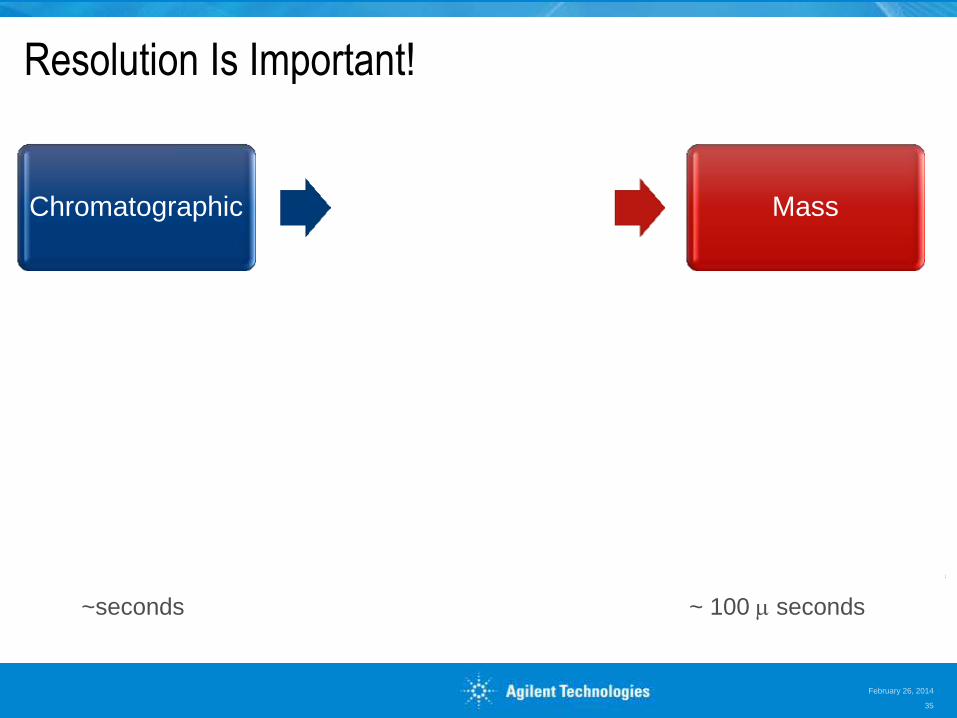
Resolution Is Important!
Chromatographic Ion Mobility Mass
~seconds ~60 milli-seconds ~ 100 m seconds
February 26, 2014
35
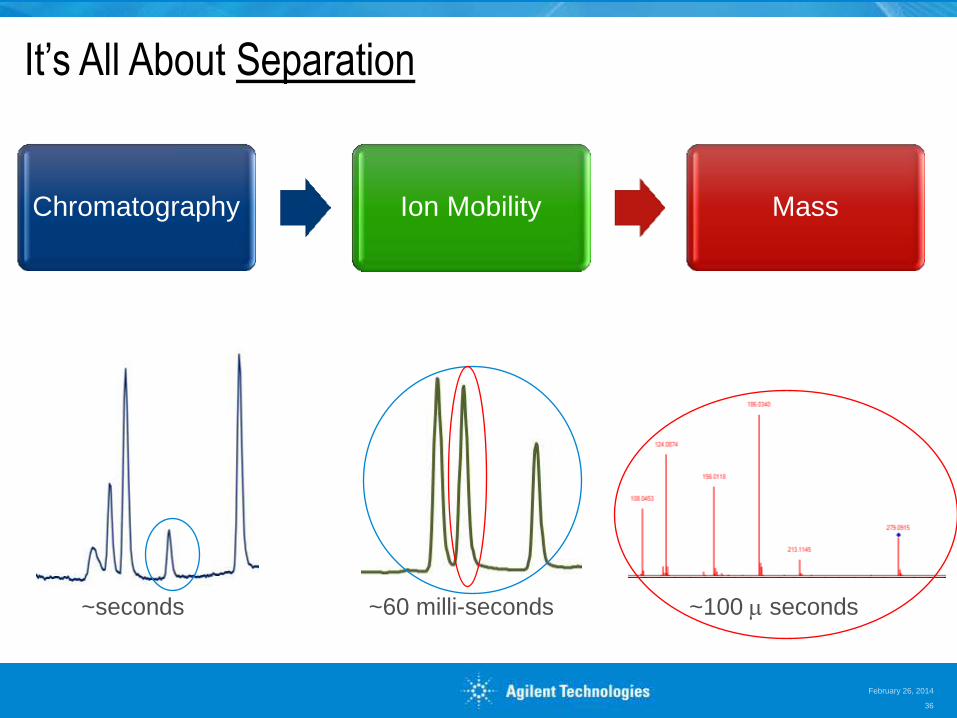
It’s All About Separation
Chromatography Ion Mobility Mass
~seconds ~60 milli-seconds ~100 m seconds
February 26, 2014
36
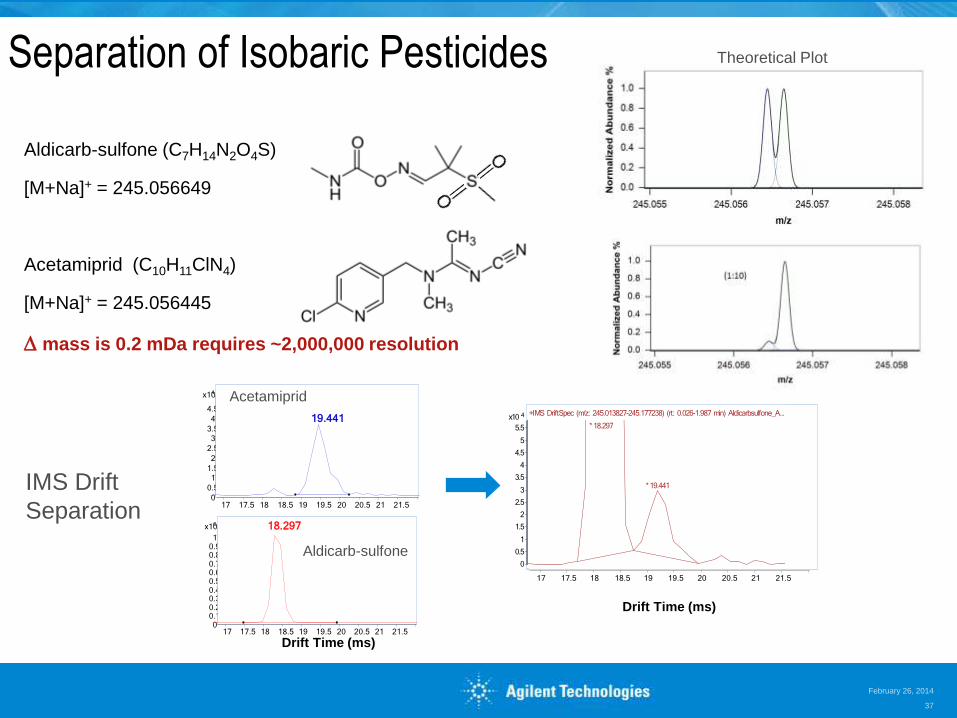
Aldicarb-sulfone (C7H14N2O4S)
[M+Na]+ = 245.056649
Acetamiprid (C10H11ClN4)
[M+Na]+ = 245.056445
D mass is 0.2 mDa requires ~2,000,000 resolution
Separation of Isobaric Pesticides
4 x10
0
0.5
1
1.5
2
2.5
3
3.5
4
4.5
19.441
17 17.5 18 18.5 19 19.5 20 20.5 21 21.5
6 x10
0 0.1 0.2 0.3 0.4 0.5 0.6 0.7 0.8 0.9 1
18.297
Drift Time (ms) 17 17.5 18 18.5 19 19.5 20 20.5 21 21.5
Aldicarb-sulfone
Acetamiprid
Drift Time (ms)
17 17.5 18 18.5 19 19.5 20 20.5 21 21.5
4x10
0
0.5
1
1.5
2
2.5
3
3.5
4
4.5
5
5.5
+IMS DriftSpec (m/z: 245.013827-245.177238) (rt: 0.026-1.987 min) Aldicarbsulfone_A…
* 18.297
* 19.441
Counts vs. Acquisition Time (min)17 17.5 18 18.5 19 19.5 20 20.5 21 21.5
Theoretical Plot
IMS Drift
Separation
February 26, 2014
37

IMS QTOF - Overview
UHPLC
HD QTOF
IMS Background
Ion Mobility Basics
Instrument & Software Overview
Applications
- Software tools
- Ω
- Lipids
- Carbohydrates
Summary
February 26, 2014
38
ASMS 2013 Ion Mobility
Abstracts
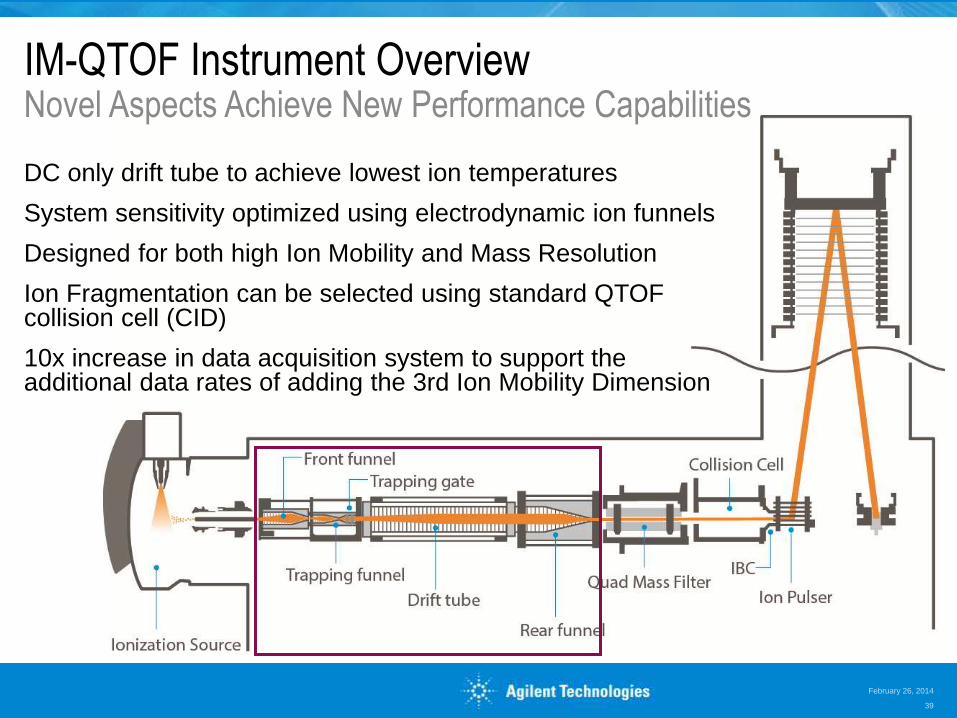
IM-QTOF Instrument Overview Novel Aspects Achieve New Performance Capabilities
DC only drift tube to achieve lowest ion temperatures
System sensitivity optimized using electrodynamic ion funnels
Designed for both high Ion Mobility and Mass Resolution
Ion Fragmentation can be selected using standard QTOF collision cell (CID)
10x increase in data acquisition system to support the additional data rates of adding the 3rd Ion Mobility Dimension
February 26, 2014
39
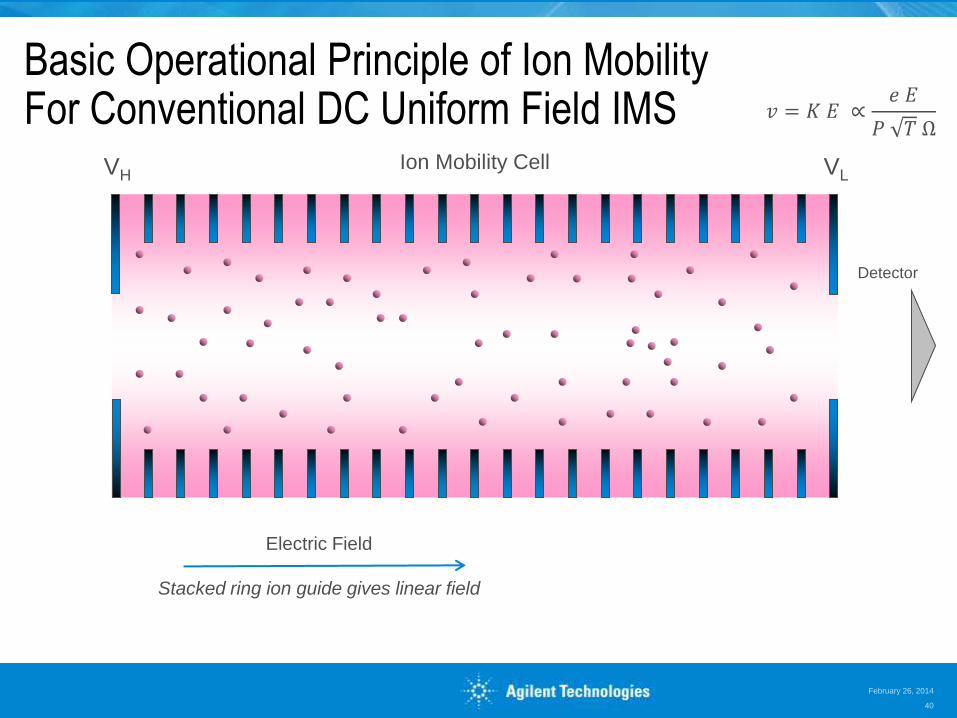
tdrift
Detector
Analyte
Ions
Gating
Optics
Ion Mobility Cell
t0
VH VL
Electric Field
Stacked ring ion guide gives linear field
𝑣 = 𝐾 𝐸 ∝𝑒 𝐸
𝑃 𝑇 Ω
Basic Operational Principle of Ion Mobility For Conventional DC Uniform Field IMS
February 26, 2014
40
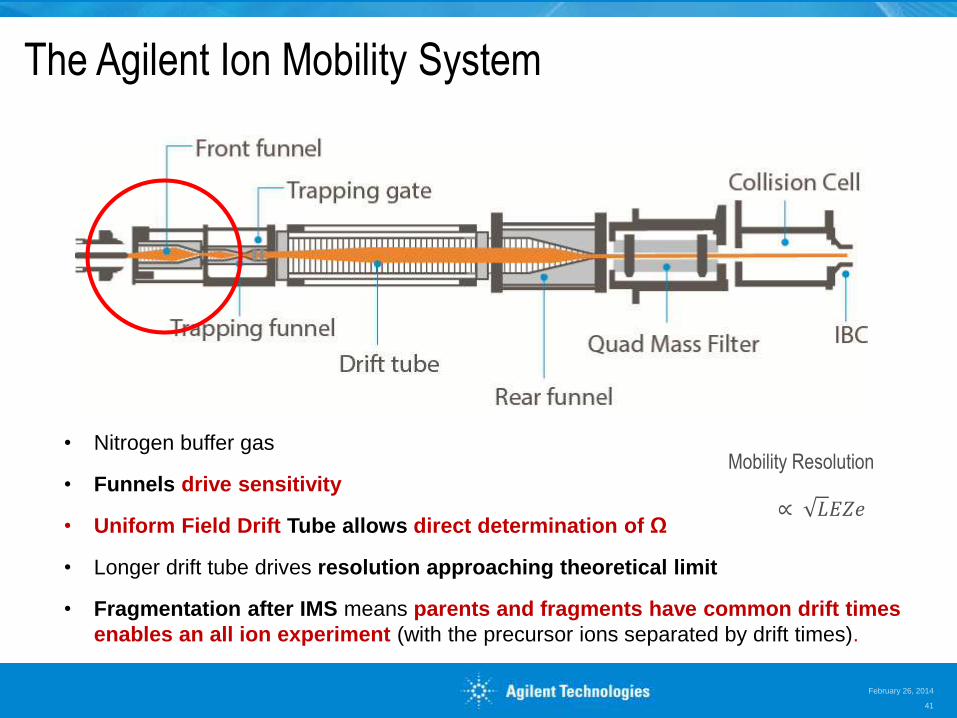
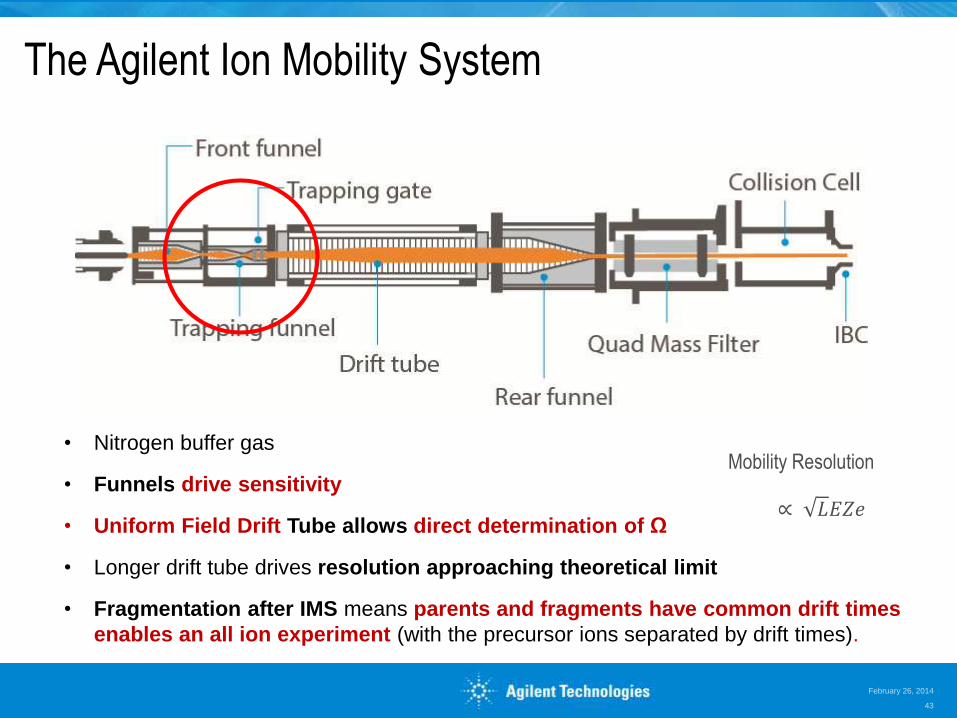
The Agilent Ion Mobility System
• Nitrogen buffer gas
• Funnels drive sensitivity
• Uniform Field Drift Tube allows direct determination of Ω
• Longer drift tube drives resolution approaching theoretical limit
• Fragmentation after IMS means parents and fragments have common drift times
enables an all ion experiment (with the precursor ions separated by drift times).
Mobility Resolution
∝ 𝐿𝐸𝑍𝑒
February 26, 2014
41
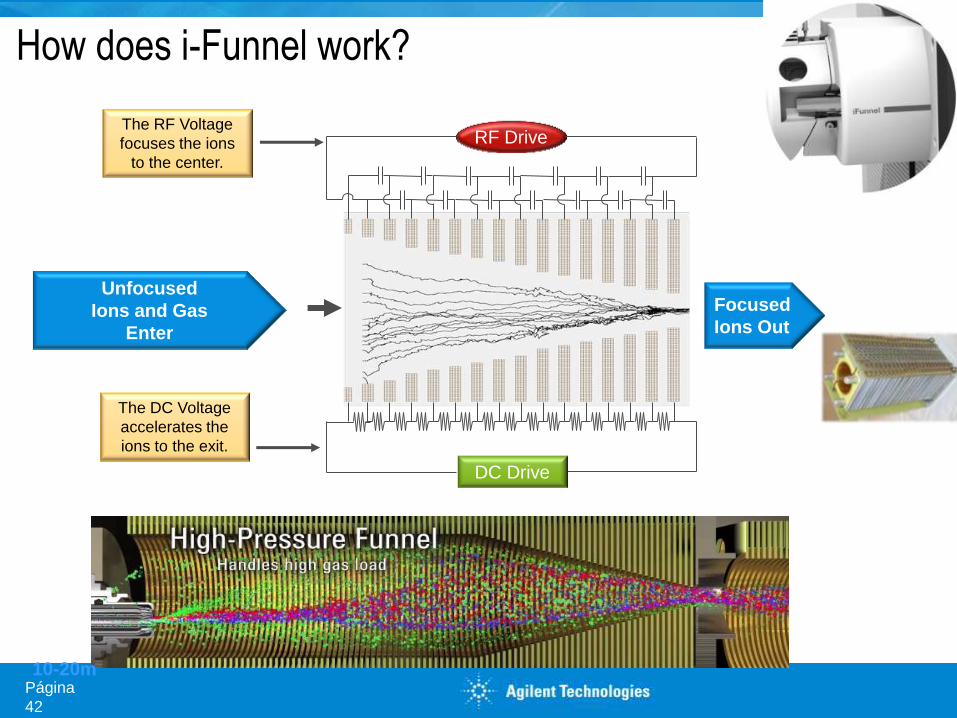
How does i-Funnel work?
The RF Voltage
focuses the ions
to the center.
The DC Voltage
accelerates the
ions to the exit.
RF Drive
DC Drive
Unfocused
Ions and Gas
Enter
Focused
Ions Out
Página
42
10-20m
The Agilent Ion Mobility System
Mobility Resolution
∝ 𝐿𝐸𝑍𝑒
February 26, 2014
43
• Nitrogen buffer gas
• Funnels drive sensitivity
• Uniform Field Drift Tube allows direct determination of Ω
• Longer drift tube drives resolution approaching theoretical limit
• Fragmentation after IMS means parents and fragments have common drift times
enables an all ion experiment (with the precursor ions separated by drift times).
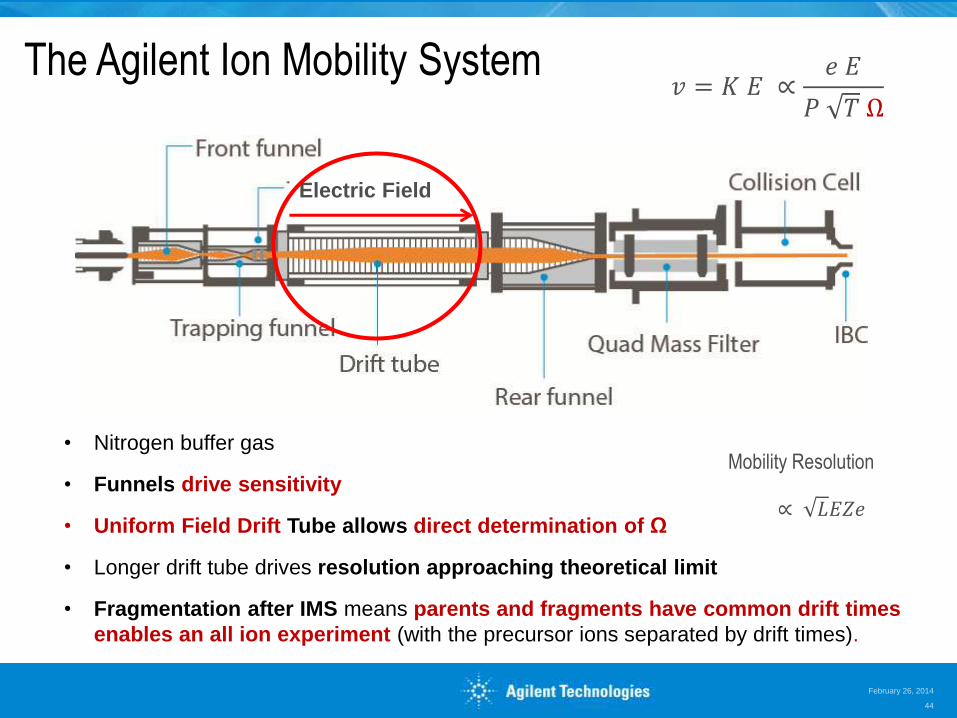
The Agilent Ion Mobility System
Electric Field
Mobility Resolution
∝ 𝐿𝐸𝑍𝑒
February 26, 2014
44
𝑣 = 𝐾 𝐸 ∝𝑒 𝐸
𝑃 𝑇 Ω
• Nitrogen buffer gas
• Funnels drive sensitivity
• Uniform Field Drift Tube allows direct determination of Ω
• Longer drift tube drives resolution approaching theoretical limit
• Fragmentation after IMS means parents and fragments have common drift times
enables an all ion experiment (with the precursor ions separated by drift times).
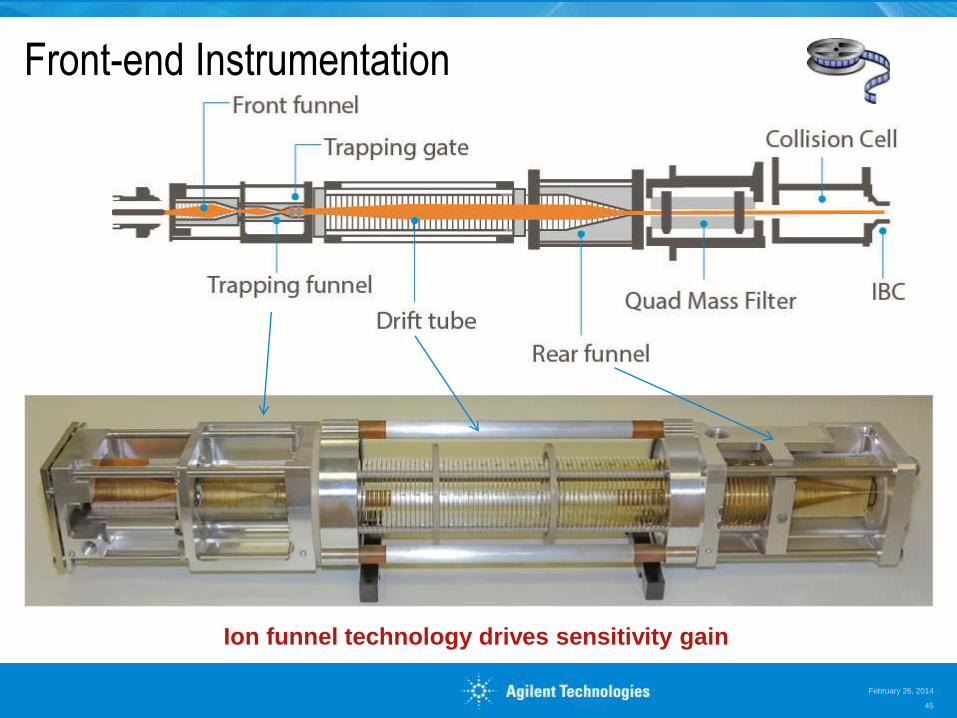
Front-end Instrumentation
Ion funnel technology drives sensitivity gain
February 26, 2014
45
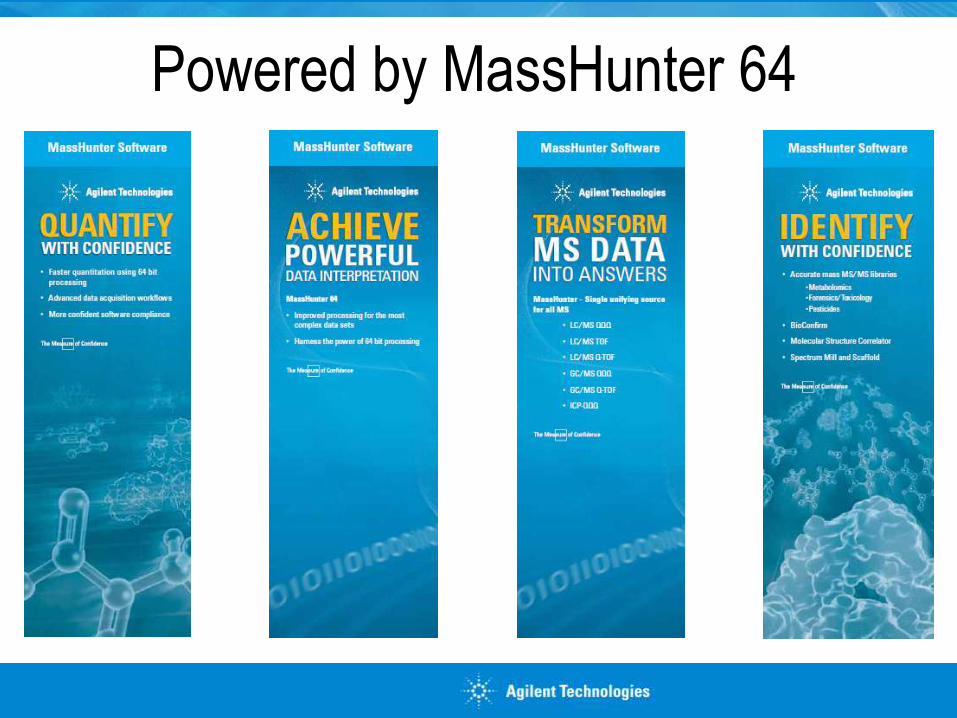
Powered by MassHunter 64
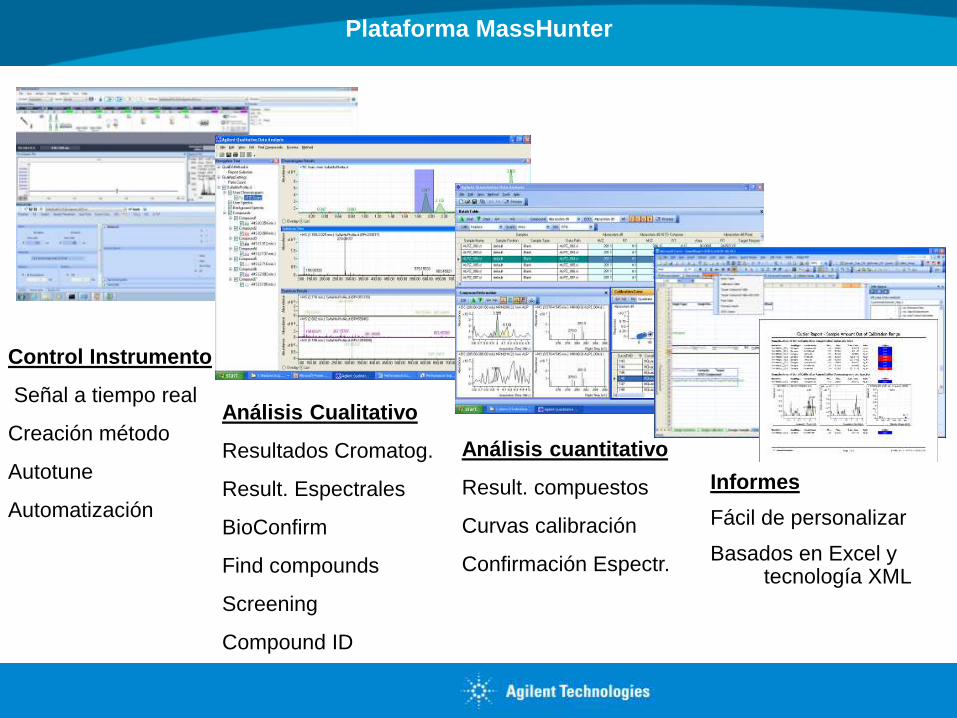
Plataforma MassHunter
Control Instrumento
Señal a tiempo real
Creación método
Autotune
Automatización
Análisis Cualitativo
Resultados Cromatog.
Result. Espectrales
BioConfirm
Find compounds
Screening
Compound ID
Análisis cuantitativo
Result. compuestos
Curvas calibración
Confirmación Espectr.
Informes
Fácil de personalizar
Basados en Excel y tecnología XML
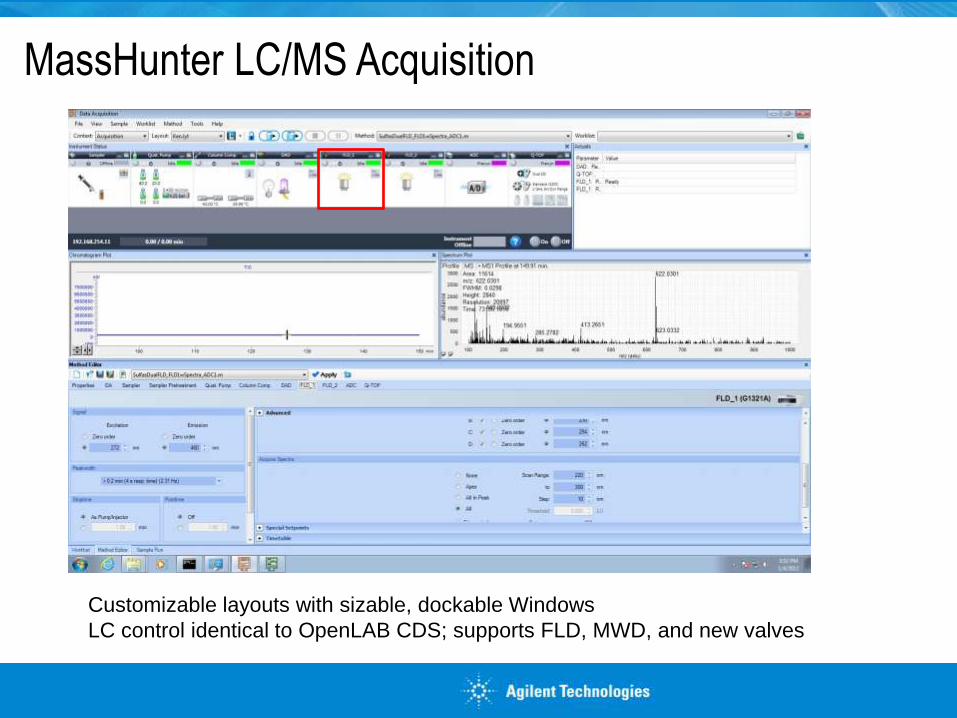
MassHunter LC/MS Acquisition
Customizable layouts with sizable, dockable Windows
LC control identical to OpenLAB CDS; supports FLD, MWD, and new valves
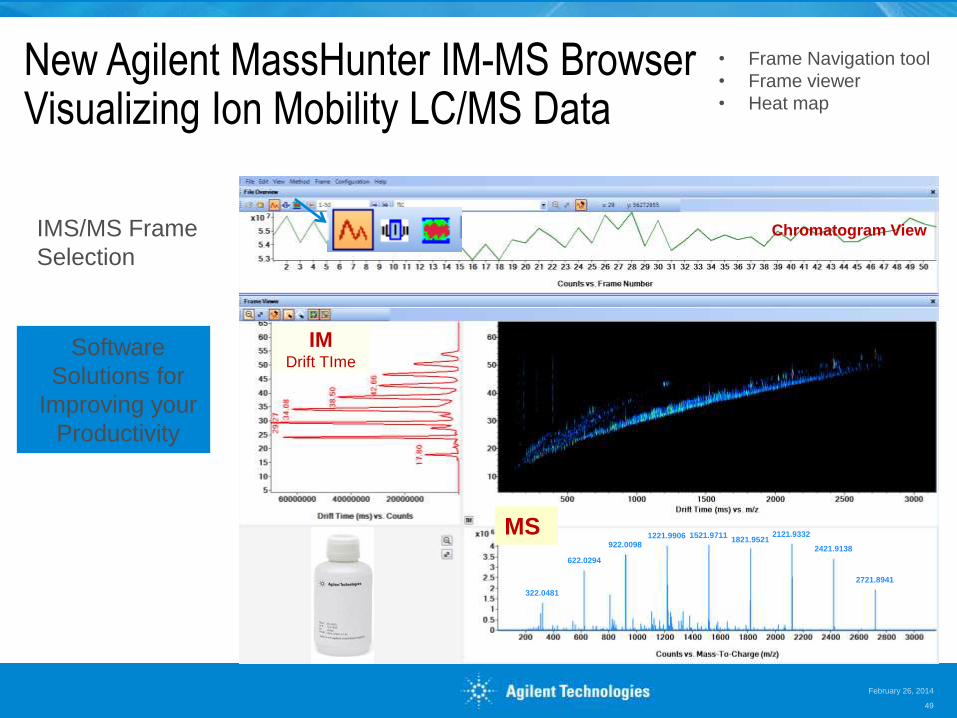
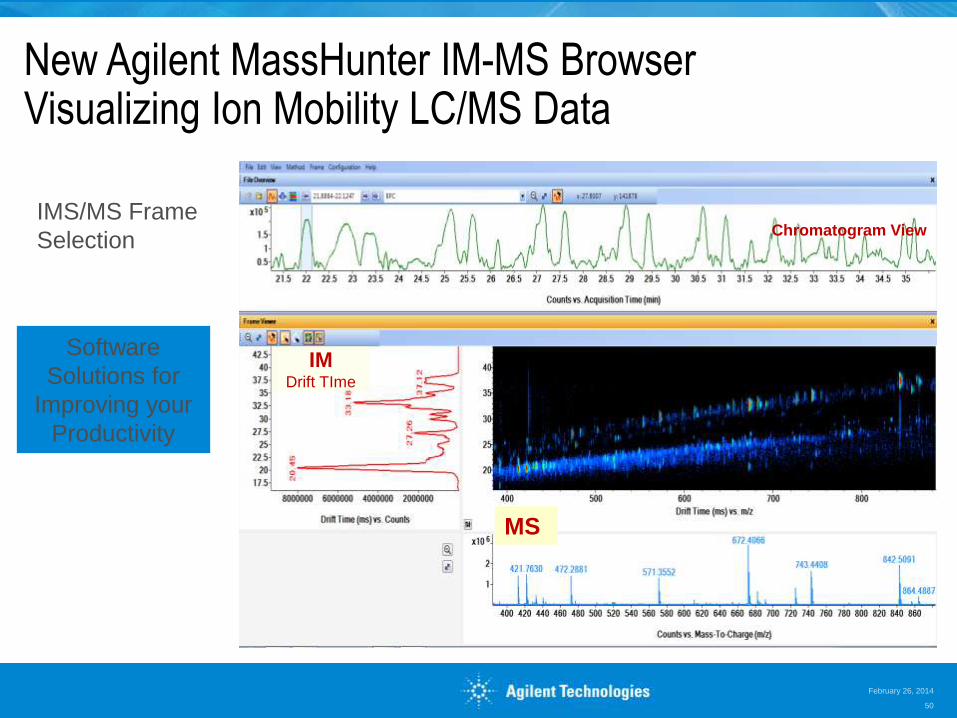
New Agilent MassHunter IM-MS Browser Visualizing Ion Mobility LC/MS Data
322.0481
622.0294
922.0098 1221.9906 1521.9711
1821.9521 2121.9332
2421.9138
2721.8941
IMS/MS Frame
Selection
Chromatogram View
Software
Solutions for
Improving your
Productivity
February 26, 2014
49
• Frame Navigation tool
• Frame viewer
• Heat map
IM Drift TIme
MS
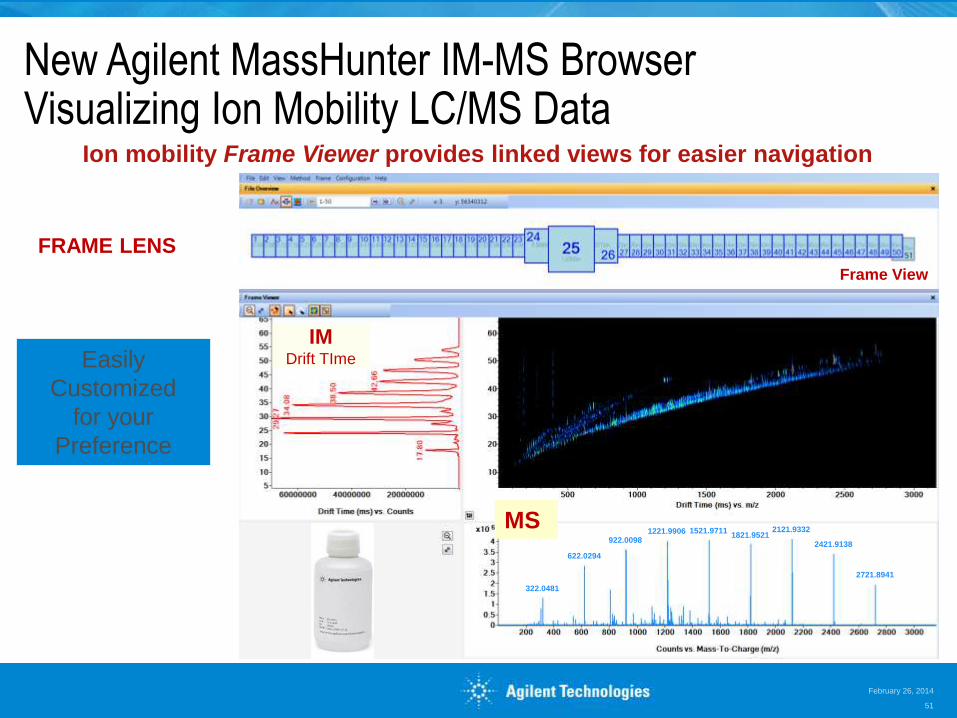
New Agilent MassHunter IM-MS Browser Visualizing Ion Mobility LC/MS Data
IMS/MS Frame
Selection
Software
Solutions for
Improving your
Productivity
February 26, 2014
50
IM Drift TIme
MS
Chromatogram View
New Agilent MassHunter IM-MS Browser Visualizing Ion Mobility LC/MS Data
Frame View
Ion mobility Frame Viewer provides linked views for easier navigation
322.0481
622.0294
922.0098 1221.9906 1521.9711
1821.9521 2121.9332
2421.9138
2721.8941
Easily
Customized
for your
Preference
February 26, 2014
51
FRAME LENS
IM Drift TIme
MS
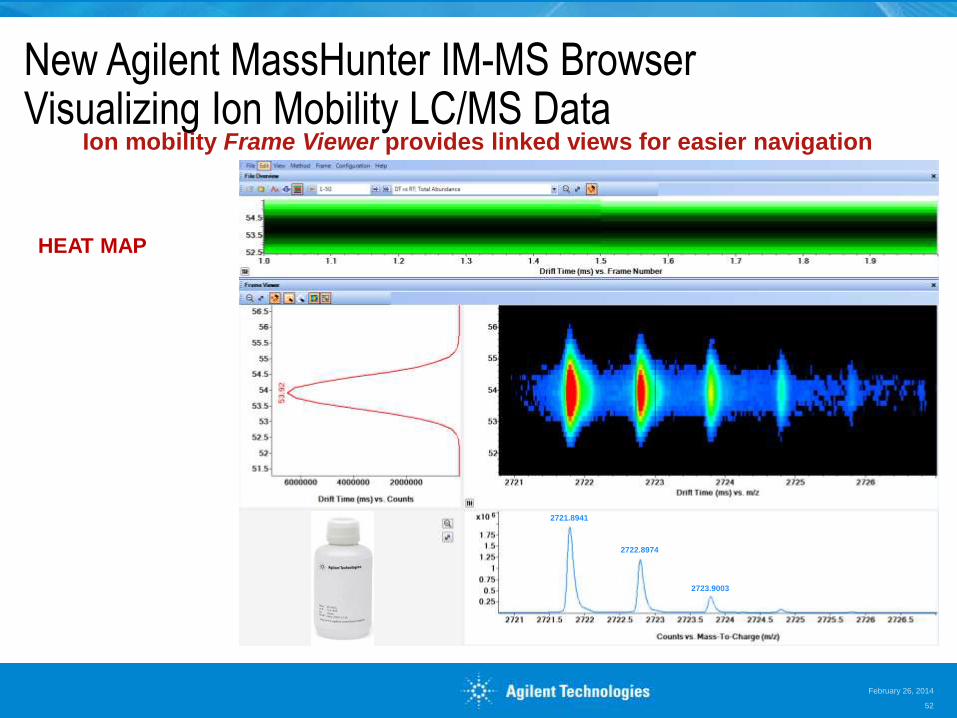
New Agilent MassHunter IM-MS Browser Visualizing Ion Mobility LC/MS Data
Ion mobility Frame Viewer provides linked views for easier navigation
2721.8941
2722.8974
2723.9003
February 26, 2014
52
HEAT MAP
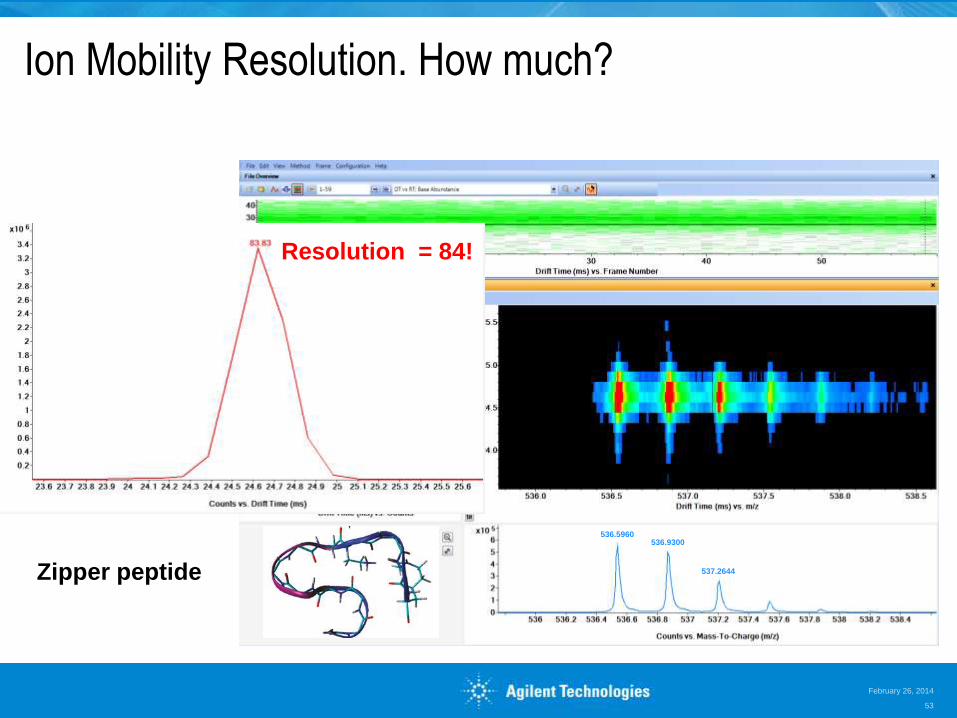
Ion Mobility Resolution. How much?
536.5960 536.9300
537.2644
Resolution = 84!
Zipper peptide
February 26, 2014
53
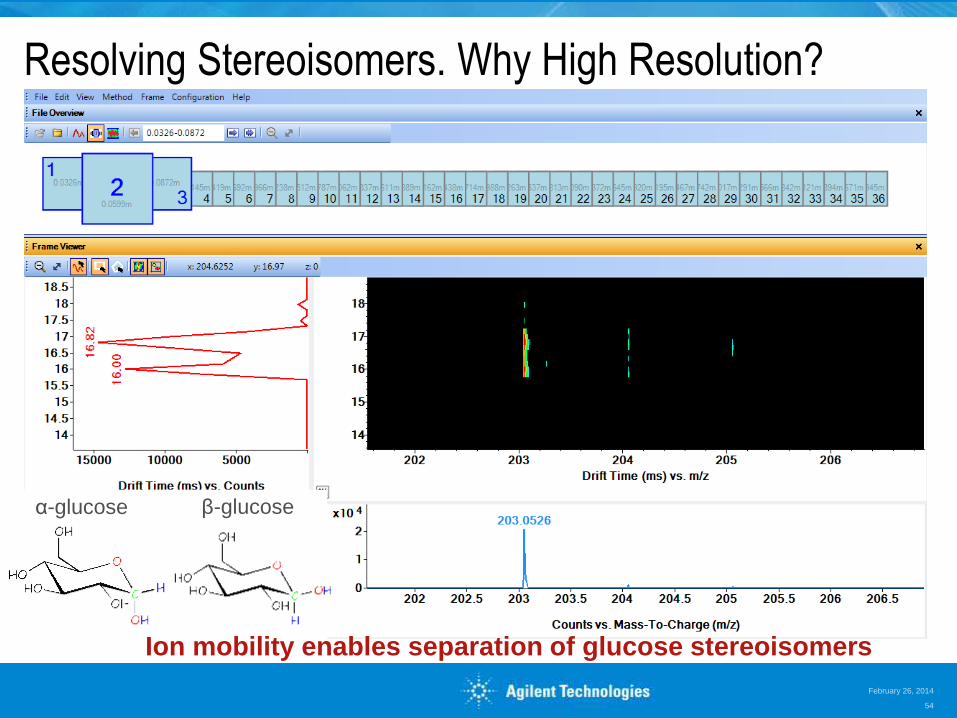
Resolving Stereoisomers. Why High Resolution?
February 26, 2014
54
α-glucose β-glucose
Ion mobility enables separation of glucose stereoisomers
IMS QTOF - Overview
UHPLC
HD QTOF
IMS Background
Ion Mobility Basics
Instrument & Software Overview
Applications
- Software tools
- Ω
- Lipids
- Carbohydrates
Summary
February 26, 2014
55
ASMS 2013 Ion Mobility
Abstracts
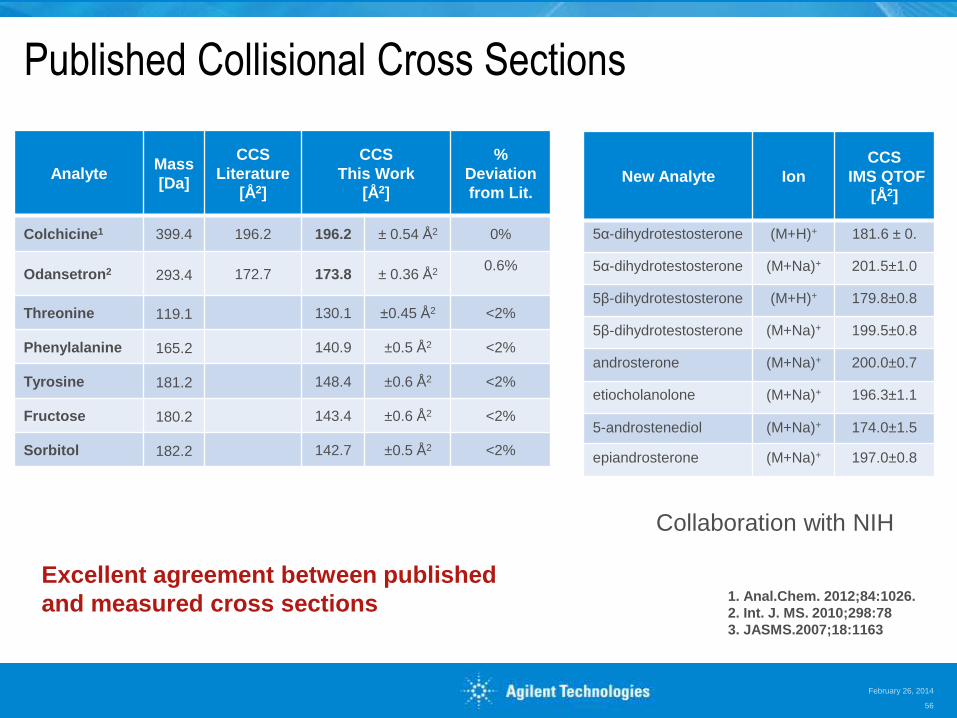
Published Collisional Cross Sections
February 26, 2014
56
Analyte Mass
[Da]
CCS
Literature
[Å2]
CCS
This Work
[Å2]
%
Deviation
from Lit.
Colchicine1 399.4 196.2 196.2 ± 0.54 Å2 0%
Odansetron2 293.4 172.7 173.8 ± 0.36 Å2 0.6%
Threonine 119.1 130.1 ±0.45 Å2 <2%
Phenylalanine 165.2 140.9 ±0.5 Å2 <2%
Tyrosine 181.2 148.4 ±0.6 Å2 <2%
Fructose 180.2 143.4 ±0.6 Å2 <2%
Sorbitol 182.2 142.7 ±0.5 Å2 <2%
1. Anal.Chem. 2012;84:1026.
2. Int. J. MS. 2010;298:78
3. JASMS.2007;18:1163
New Analyte Ion
CCS
IMS QTOF
[Å2]
5α-dihydrotestosterone (M+H)+ 181.6 ± 0.
5α-dihydrotestosterone (M+Na)+ 201.5±1.0
5β-dihydrotestosterone (M+H)+ 179.8±0.8
5β-dihydrotestosterone (M+Na)+ 199.5±0.8
androsterone (M+Na)+ 200.0±0.7
etiocholanolone (M+Na)+ 196.3±1.1
5-androstenediol (M+Na)+ 174.0±1.5
epiandrosterone (M+Na)+ 197.0±0.8
Excellent agreement between published
and measured cross sections
Collaboration with NIH
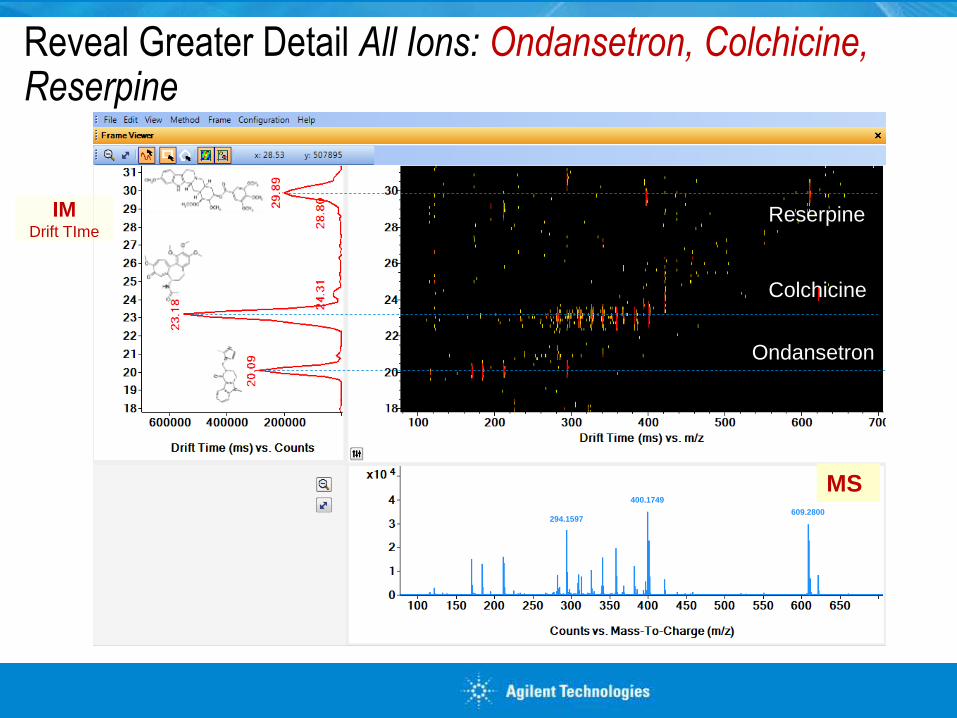
Reveal Greater Detail All Ions: Ondansetron, Colchicine, Reserpine
Reserpine
Colchicine
Ondansetron
609.2800
400.1749
294.1597
IM Drift TIme
MS
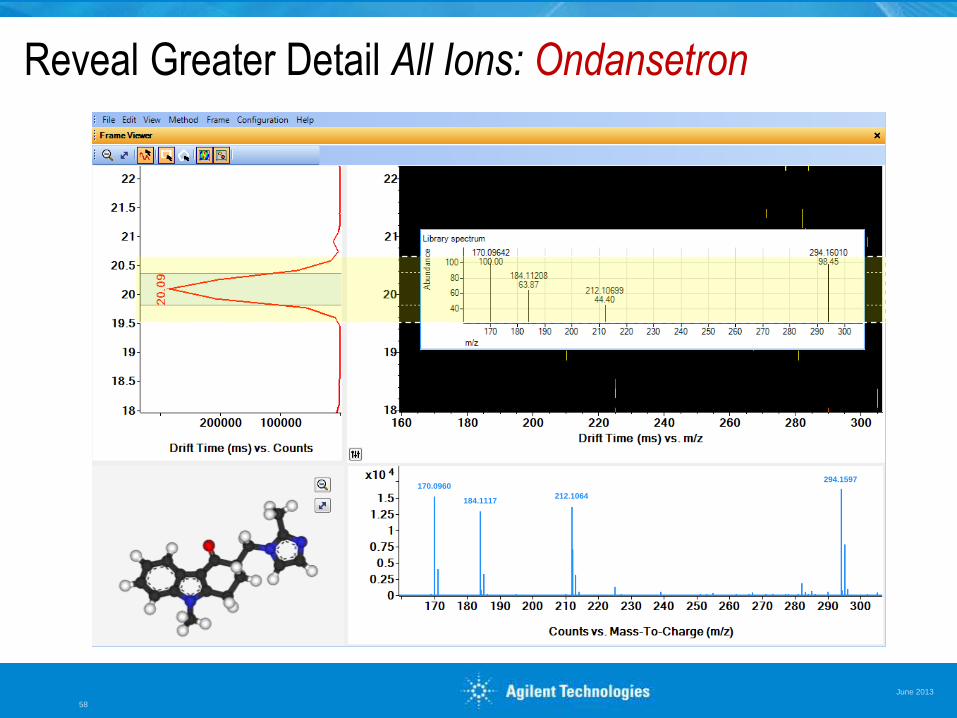
Reveal Greater Detail All Ions: Ondansetron
June 2013
58
294.1597
184.1117
170.0960
212.1064
294.1597
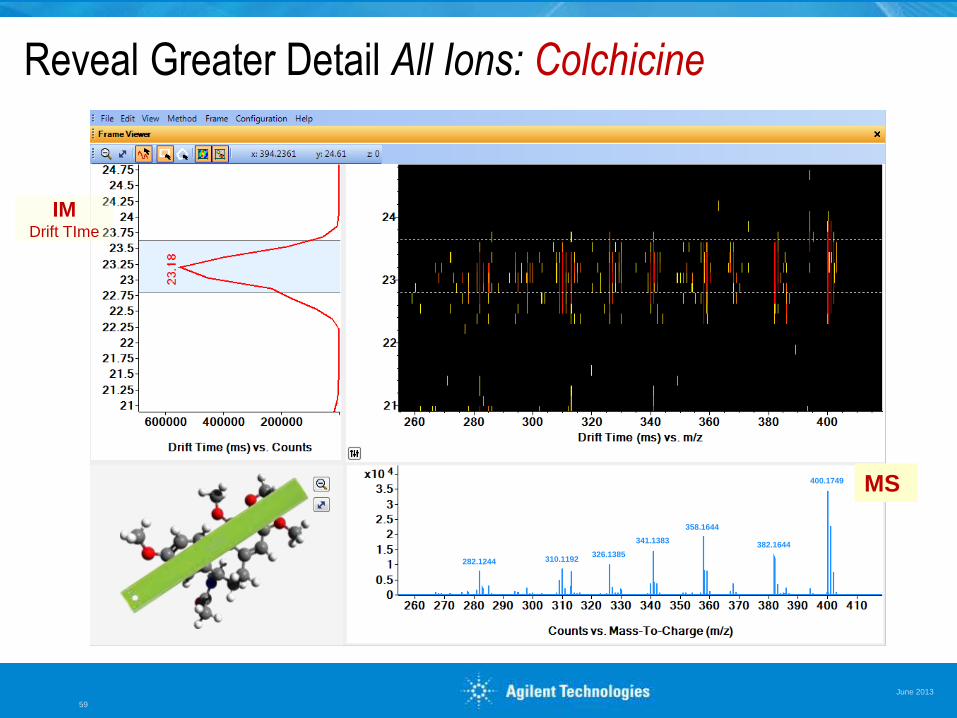
Reveal Greater Detail All Ions: Colchicine
June 2013
59
400.1749
358.1644
341.1383
326.1385 282.1244
382.1644
310.1192
IM Drift TIme
MS
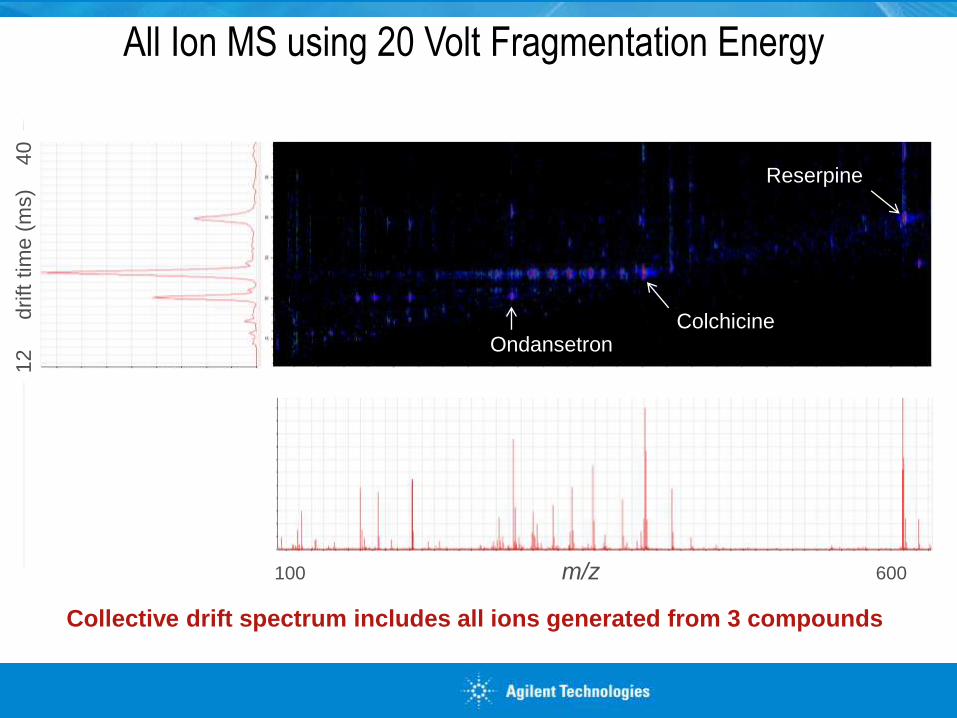
All Ion MS using 20 Volt Fragmentation Energy
Collective drift spectrum includes all ions generated from 3 compounds
Reserpine
Colchicine Ondansetron
100 m/z 600
12
d
rift t
ime (
ms)
4
0
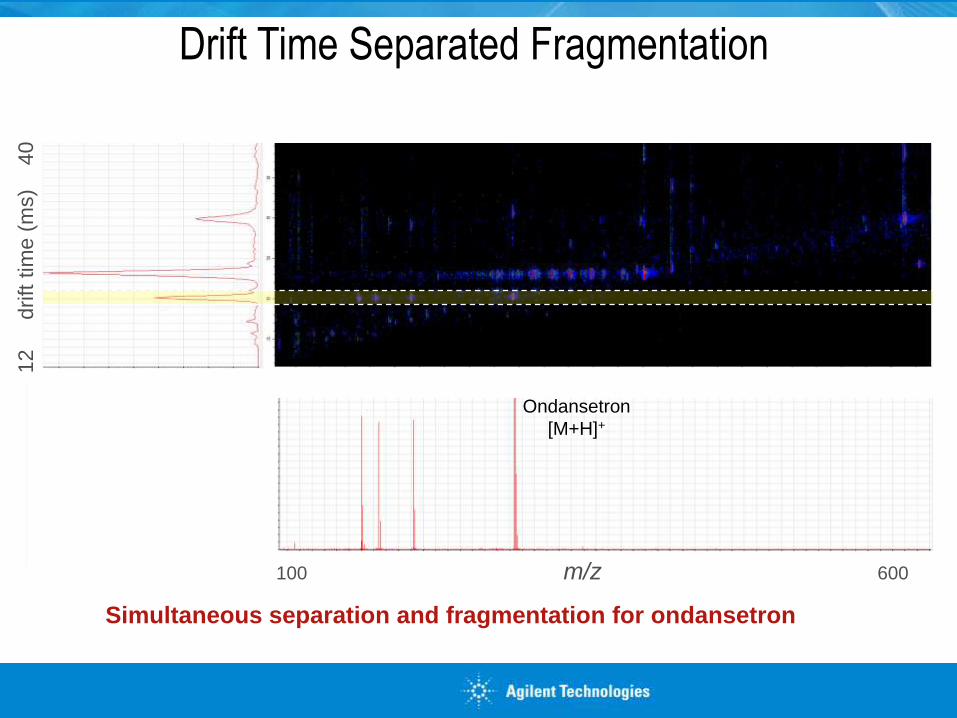
Drift Time Separated Fragmentation
Simultaneous separation and fragmentation for ondansetron
Ondansetron
[M+H]+
100 m/z 600
12
d
rift t
ime (
ms)
4
0
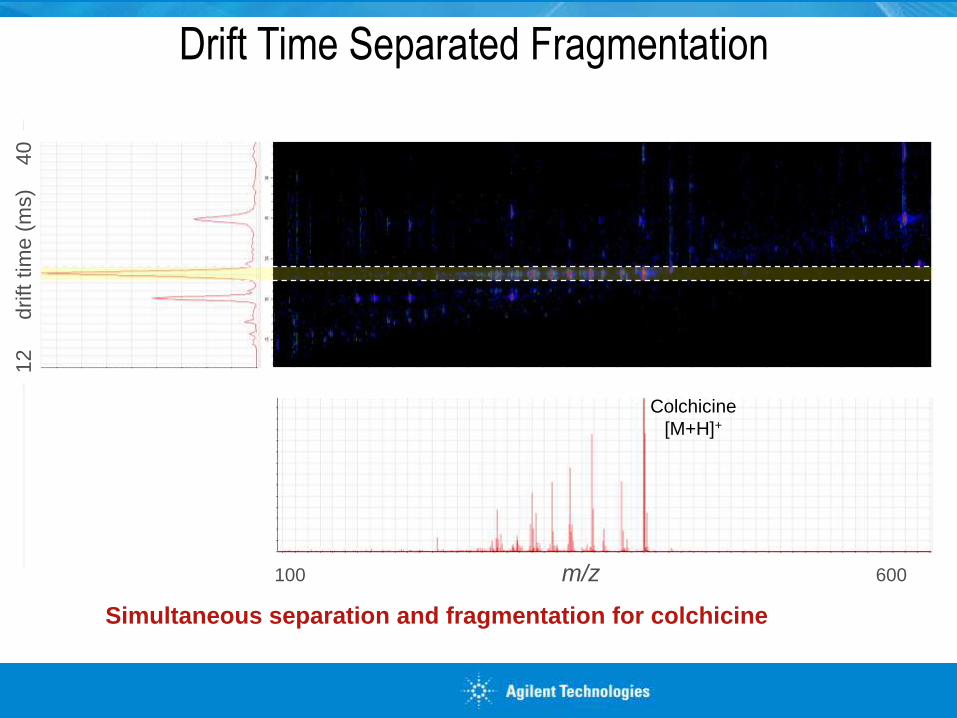
Simultaneous separation and fragmentation for colchicine
Drift Time Separated Fragmentation
Colchicine
[M+H]+
100 m/z 600
12
d
rift t
ime (
ms)
4
0
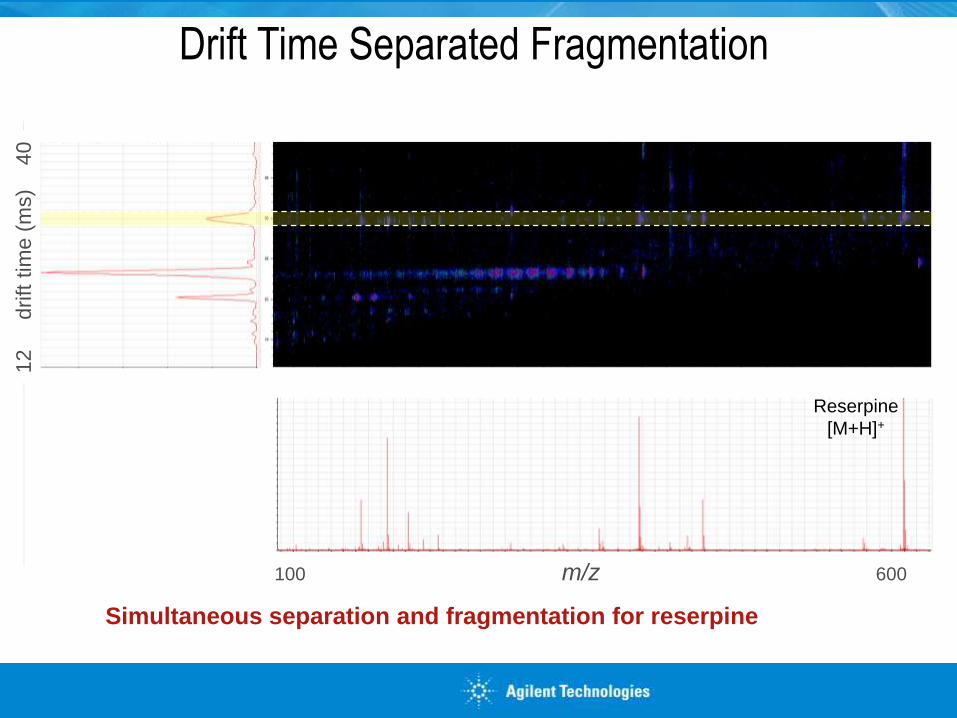
Simultaneous separation and fragmentation for reserpine
Drift Time Separated Fragmentation
Reserpine
[M+H]+
100 m/z 600
12
d
rift t
ime (
ms)
4
0
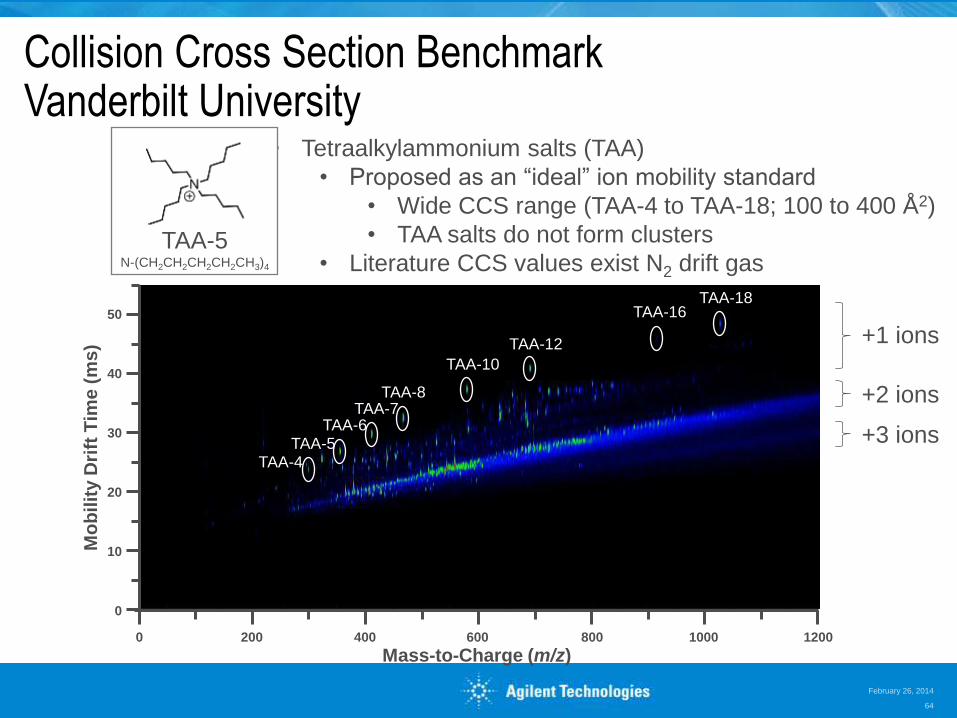
Collision Cross Section Benchmark Vanderbilt University
• Tetraalkylammonium salts (TAA)
• Proposed as an “ideal” ion mobility standard
• Wide CCS range (TAA-4 to TAA-18; 100 to 400 Å2)
• TAA salts do not form clusters
• Literature CCS values exist N2 drift gas
+2 ions
+3 ions
+1 ions TAA-16
TAA-18
TAA-12
TAA-10
TAA-8 TAA-7
TAA-6 TAA-5
TAA-4
0
10
30
40
200 400 600 800
0
20
Mo
bilit
y D
rift
Tim
e (
ms)
Mass-to-Charge (m/z) 1000 1200
50
TAA-5 N-(CH2CH2CH2CH2CH3)4
February 26, 2014
64
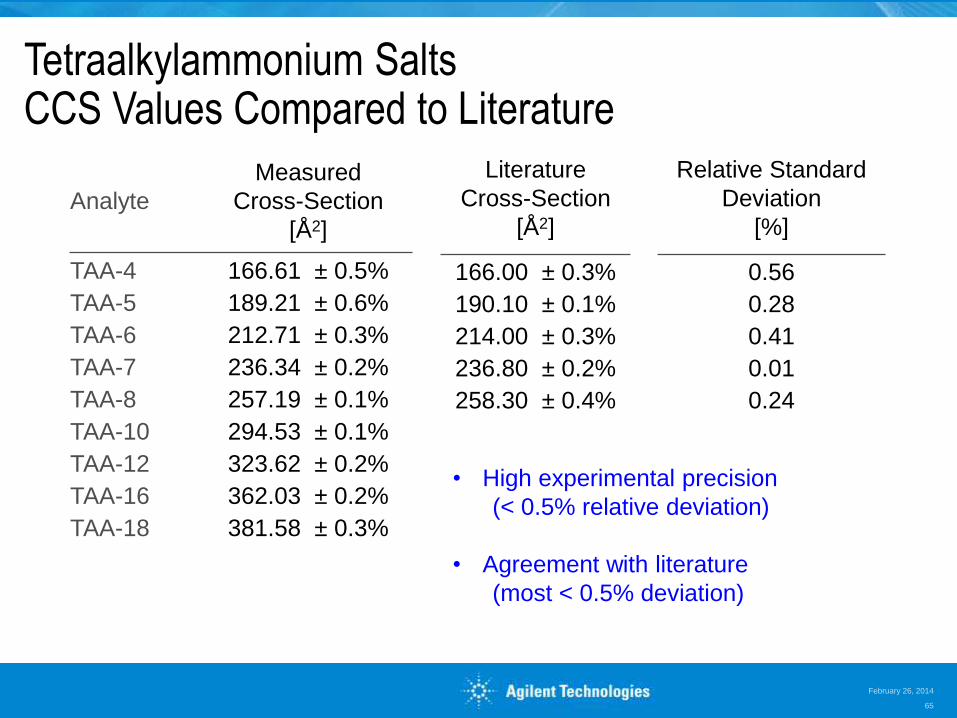
Tetraalkylammonium Salts CCS Values Compared to Literature
February 26, 2014
65
Analyte
Measured
Cross-Section
[Å2]
TAA-4 166.61 ± 0.5%
TAA-5 189.21 ± 0.6%
TAA-6 212.71 ± 0.3%
TAA-7 236.34 ± 0.2%
TAA-8 257.19 ± 0.1%
TAA-10 294.53 ± 0.1%
TAA-12 323.62 ± 0.2%
TAA-16 362.03 ± 0.2%
TAA-18 381.58 ± 0.3%
Literature
Cross-Section
[Å2]
166.00 ± 0.3%
190.10 ± 0.1%
214.00 ± 0.3%
236.80 ± 0.2%
258.30 ± 0.4%
Relative Standard
Deviation
[%]
0.56
0.28
0.41
0.01
0.24
• High experimental precision
(< 0.5% relative deviation)
• Agreement with literature
(most < 0.5% deviation)
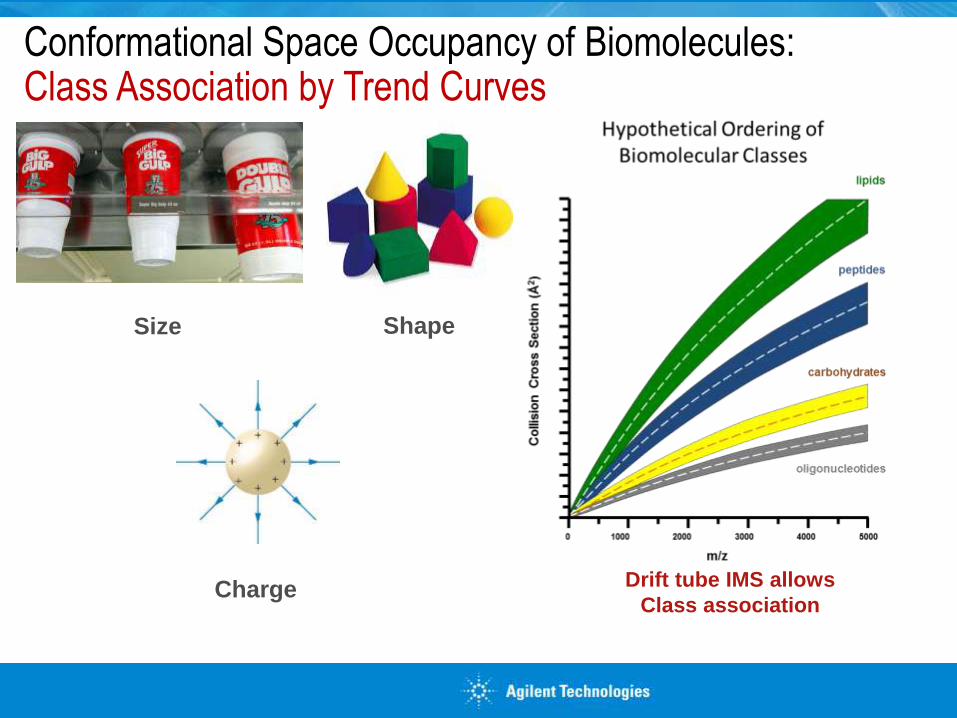
Conformational Space Occupancy of Biomolecules: Class Association by Trend Curves
Size Shape
Charge
Using a Synapt does NOT allow compound class association
Drift tube IMS allows
Class association
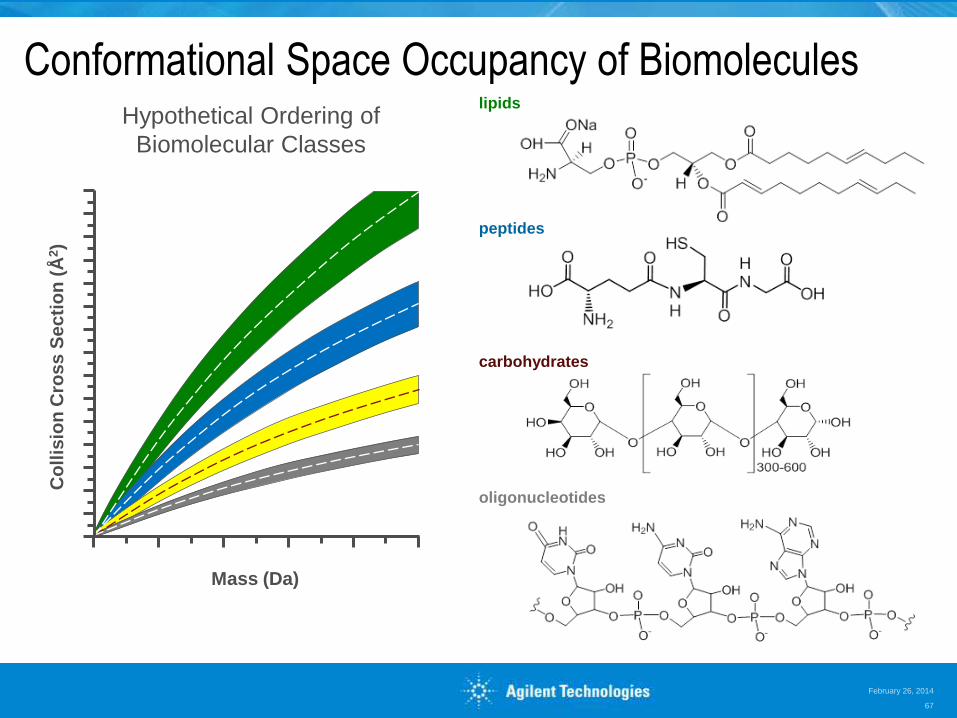
Conformational Space Occupancy of Biomolecules
Co
llis
ion
Cro
ss
Se
cti
on
(Å
2)
Mass (Da)
Hypothetical Ordering of
Biomolecular Classes
lipids
carbohydrates
peptides
oligonucleotides
February 26, 2014
67
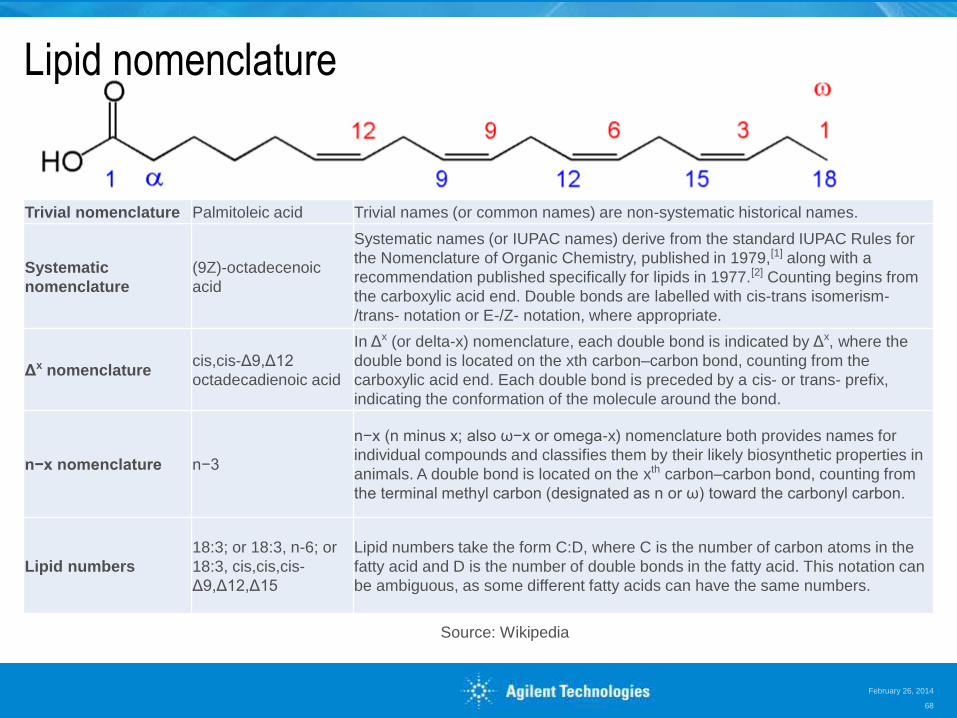
Lipid nomenclature
Trivial nomenclature Palmitoleic acid Trivial names (or common names) are non-systematic historical names.
Systematic
nomenclature (9Z)-octadecenoic
acid
Systematic names (or IUPAC names) derive from the standard IUPAC Rules for
the Nomenclature of Organic Chemistry, published in 1979,[1] along with a
recommendation published specifically for lipids in 1977.[2] Counting begins from
the carboxylic acid end. Double bonds are labelled with cis-trans isomerism-
/trans- notation or E-/Z- notation, where appropriate.
Δx nomenclature cis,cis-Δ9,Δ12
octadecadienoic acid
In Δx (or delta-x) nomenclature, each double bond is indicated by Δx, where the
double bond is located on the xth carbon–carbon bond, counting from the
carboxylic acid end. Each double bond is preceded by a cis- or trans- prefix,
indicating the conformation of the molecule around the bond.
n−x nomenclature n−3
n−x (n minus x; also ω−x or omega-x) nomenclature both provides names for
individual compounds and classifies them by their likely biosynthetic properties in
animals. A double bond is located on the xth carbon–carbon bond, counting from
the terminal methyl carbon (designated as n or ω) toward the carbonyl carbon.
Lipid numbers 18:3; or 18:3, n-6; or
18:3, cis,cis,cis-
Δ9,Δ12,Δ15
Lipid numbers take the form C:D, where C is the number of carbon atoms in the
fatty acid and D is the number of double bonds in the fatty acid. This notation can
be ambiguous, as some different fatty acids can have the same numbers.
Source: Wikipedia
February 26, 2014
68
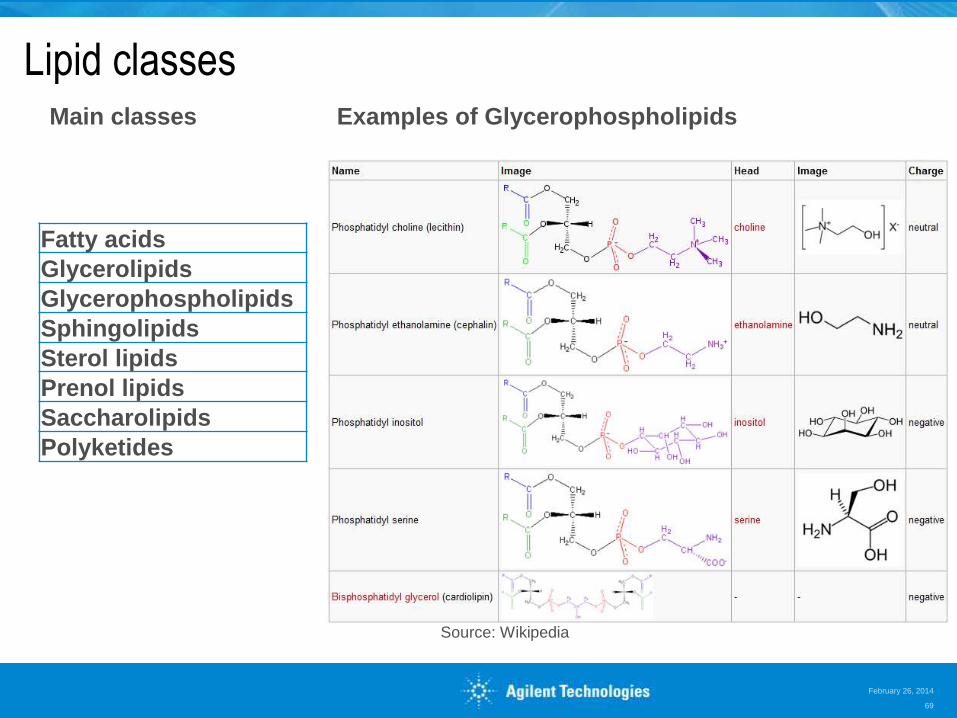
Lipid classes
Source: Wikipedia
Fatty acids
Glycerolipids
Glycerophospholipids
Sphingolipids
Sterol lipids
Prenol lipids
Saccharolipids
Polyketides
Main classes Examples of Glycerophospholipids
February 26, 2014
69
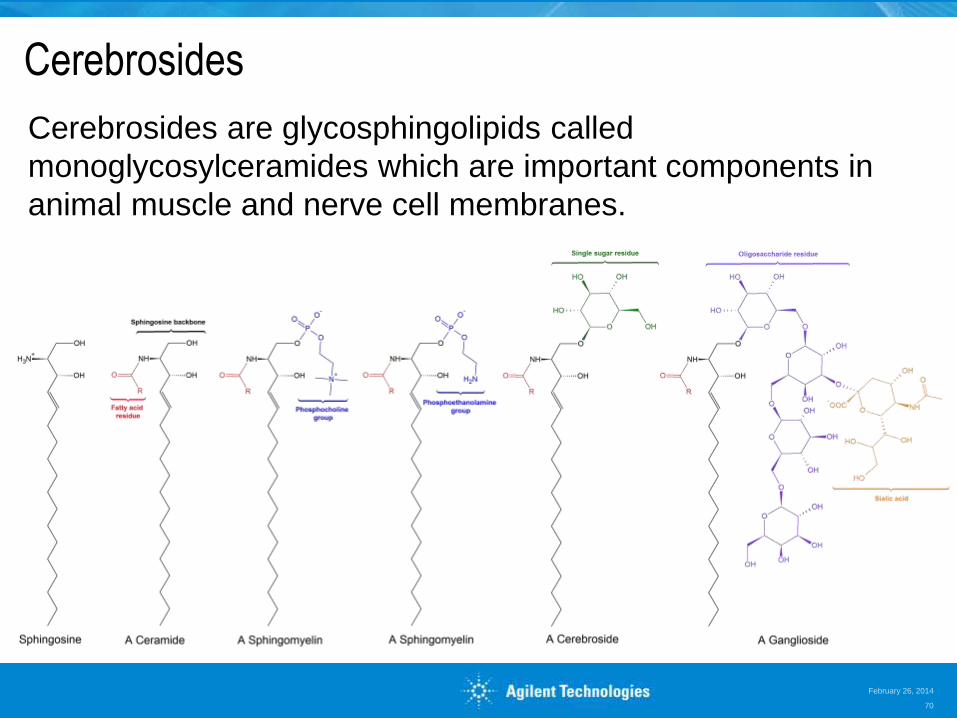
Cerebrosides
Cerebrosides are glycosphingolipids called
monoglycosylceramides which are important components in
animal muscle and nerve cell membranes.
February 26, 2014
70
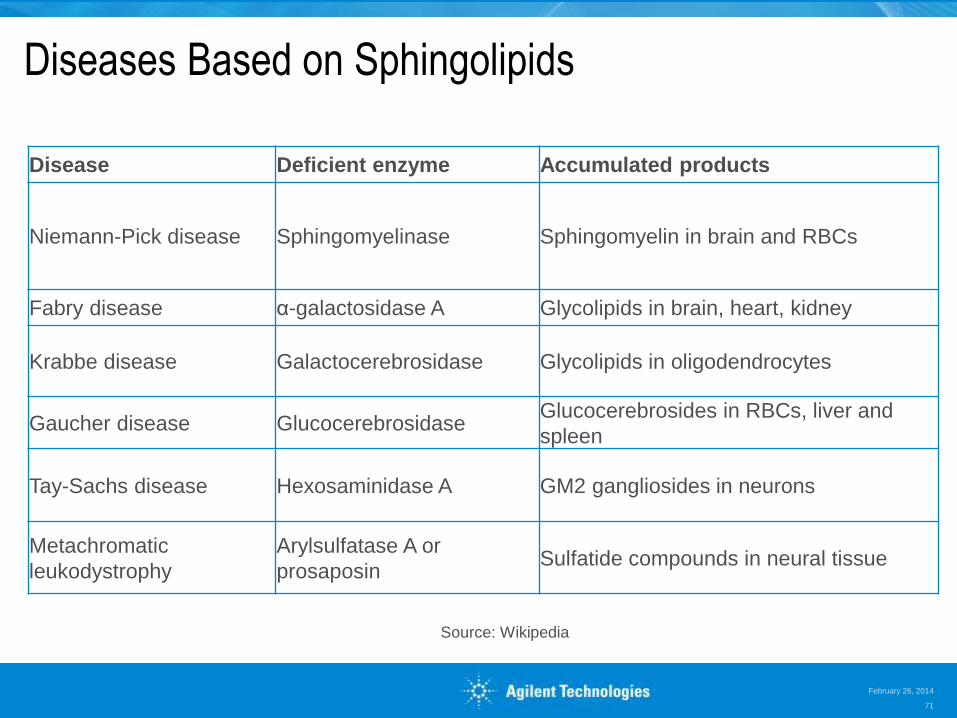
Diseases Based on Sphingolipids
Disease Deficient enzyme Accumulated products
Niemann-Pick disease Sphingomyelinase Sphingomyelin in brain and RBCs
Fabry disease α-galactosidase A Glycolipids in brain, heart, kidney
Krabbe disease Galactocerebrosidase Glycolipids in oligodendrocytes
Gaucher disease Glucocerebrosidase Glucocerebrosides in RBCs, liver and
spleen
Tay-Sachs disease Hexosaminidase A GM2 gangliosides in neurons
Metachromatic
leukodystrophy Arylsulfatase A or
prosaposin Sulfatide compounds in neural tissue
Source: Wikipedia
February 26, 2014
71
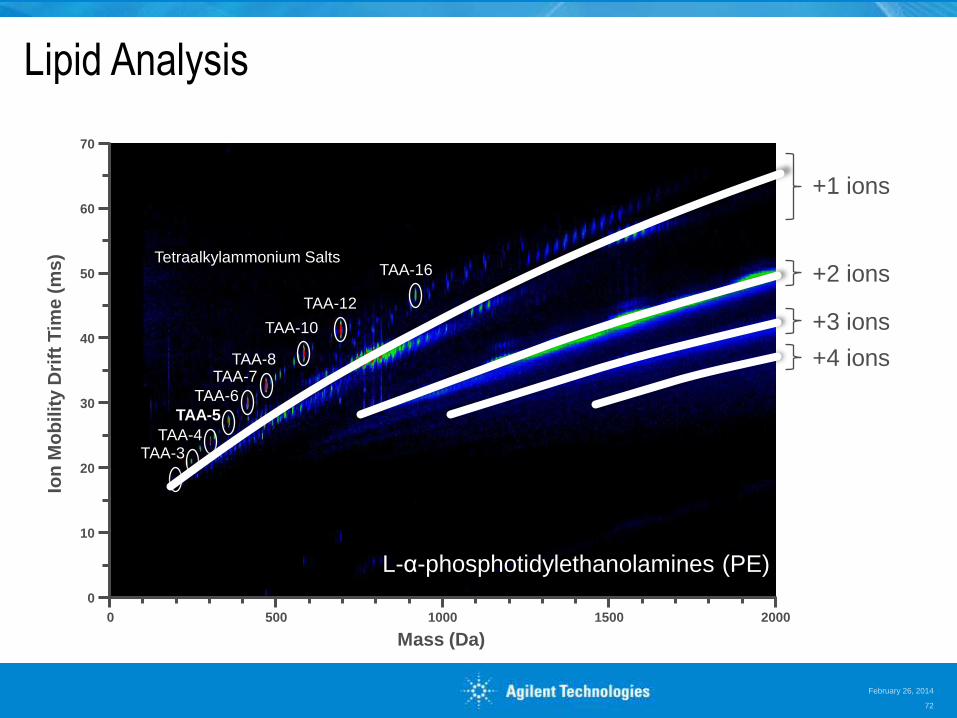
Lipid Analysis
Tetraalkylammonium Salts
+2 ions
+3 ions
+1 ions
+4 ions
Ion
Mo
bilit
y D
rift
Tim
e (
ms)
Mass (Da)
0
0
20
40
50
500 1000 1500 2000
10
30
60
70
L-α-phosphotidylethanolamines (PE)
TAA-3
TAA-16
TAA-12
TAA-10
TAA-8 TAA-7
TAA-6
TAA-5
TAA-4
February 26, 2014
72
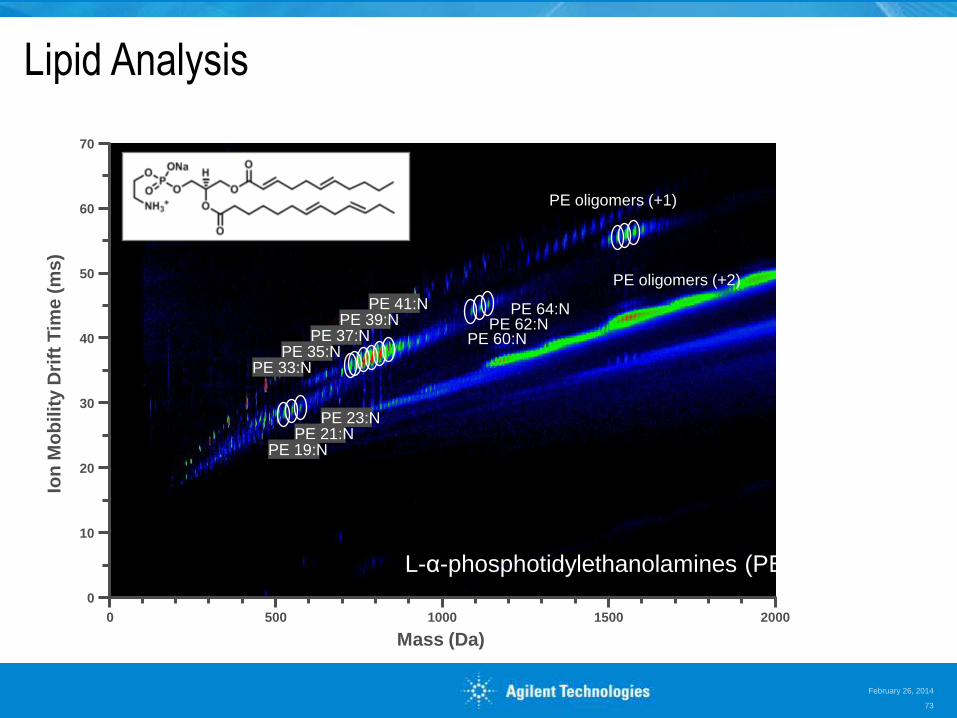
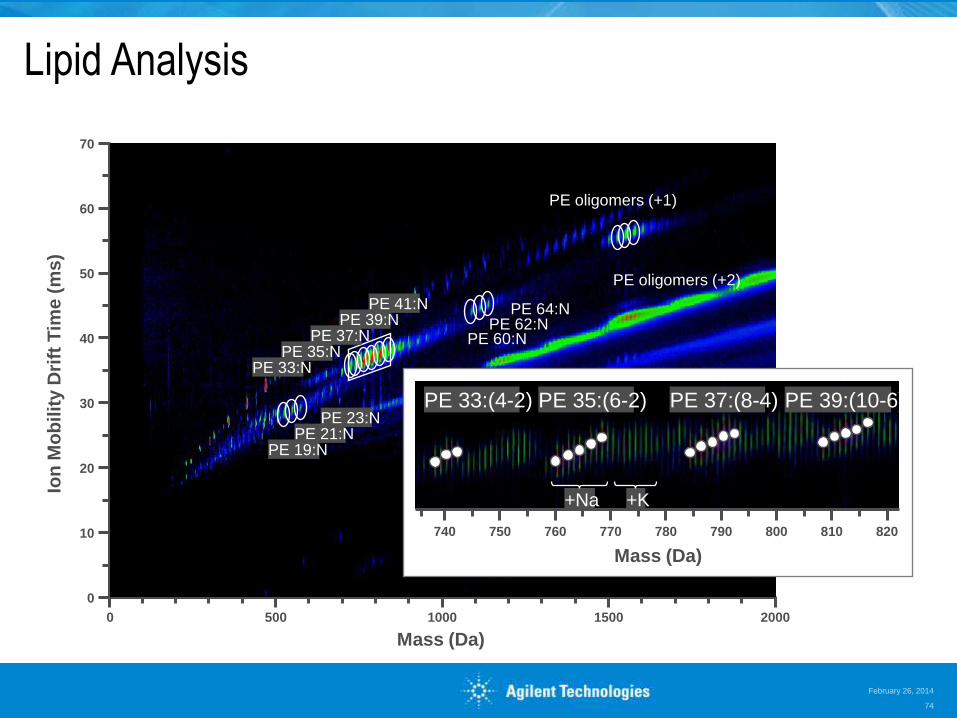
Lipid Analysis Io
n M
ob
ilit
y D
rift
Tim
e (
ms)
Mass (Da)
0
0
20
40
50
500 1000 1500 2000
10
30
60
70
PE 60:N PE 62:N
PE 64:N
PE 33:N PE 35:N
PE 37:N PE 39:N
PE 41:N
PE 23:N PE 21:N
PE 19:N
PE oligomers (+1)
PE oligomers (+2)
L-α-phosphotidylethanolamines (PE)
February 26, 2014
73
Lipid Analysis Io
n M
ob
ilit
y D
rift
Tim
e (
ms)
Mass (Da)
0
0
20
40
50
500 1000 1500 2000
10
30
60
70
PE 35:(6-2) PE 37:(8-4) PE 39:(10-6) PE 33:(4-2)
+Na +K
Mass (Da)
740 760 770 780 790 750 800 810 820
PE 60:N PE 62:N
PE 64:N
PE 33:N PE 35:N
PE 37:N PE 39:N
PE 41:N
PE 23:N PE 21:N
PE 19:N
PE oligomers (+1)
PE oligomers (+2)
February 26, 2014
74
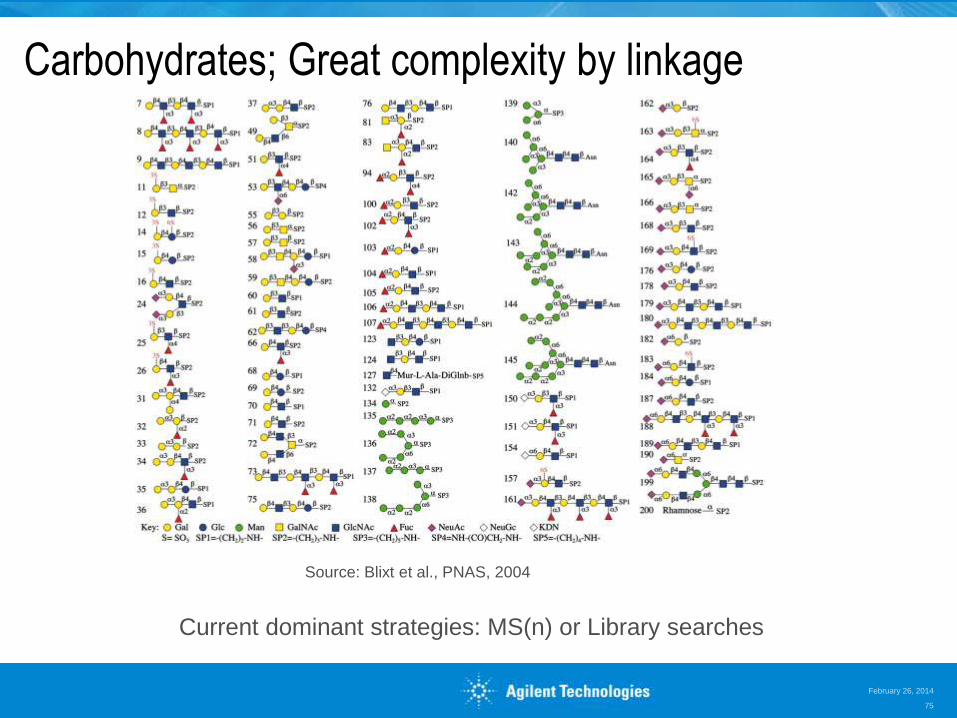
Carbohydrates; Great complexity by linkage
Source: Blixt et al., PNAS, 2004
Current dominant strategies: MS(n) or Library searches
February 26, 2014
75
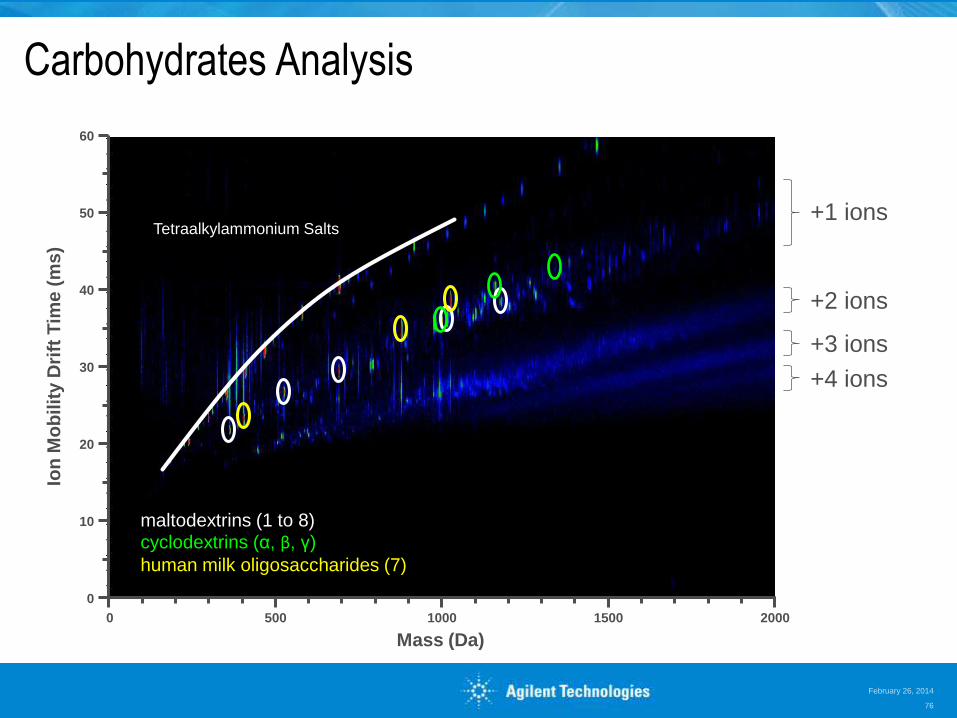
Carbohydrates Analysis
maltodextrins (1 to 8) cyclodextrins (α, β, γ)
human milk oligosaccharides (7)
Tetraalkylammonium Salts
+2 ions
+3 ions
+1 ions
+4 ions
Ion
Mo
bilit
y D
rift
Tim
e (
ms
)
Mass (Da)
0
0
20
40
50
500 1000 1500 2000
10
30
60
February 26, 2014
76
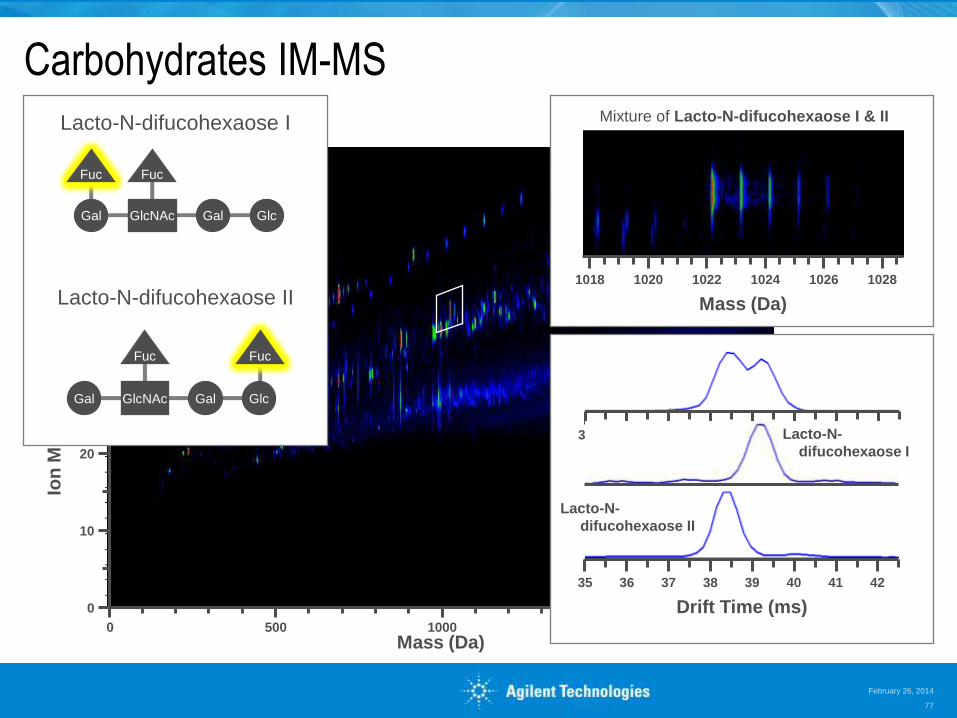
Carbohydrates IM-MS Io
n M
ob
ilit
y D
rift
Tim
e (
ms)
Mass (Da) 0
0
20
40
50
500 1000 1500 2000
10
30
60
Mixture of Lacto-N-difucohexaose I & II
Mass (Da)
1018 1022 1024 1026 1028 1020
Drift Time (ms)
37 39 40 41 42 38 36 35
Lacto-N-
difucohexaose II
Drift Time (ms)
37 39 40 41 42 38 36 35
Lacto-N-
difucohexaose I
Lacto-N-difucohexaose I
Lacto-N-difucohexaose II
Gal Glc Gal GlcNAc
Fuc Fuc
Gal Glc Gal GlcNAc
Fuc Fuc
February 26, 2014
77
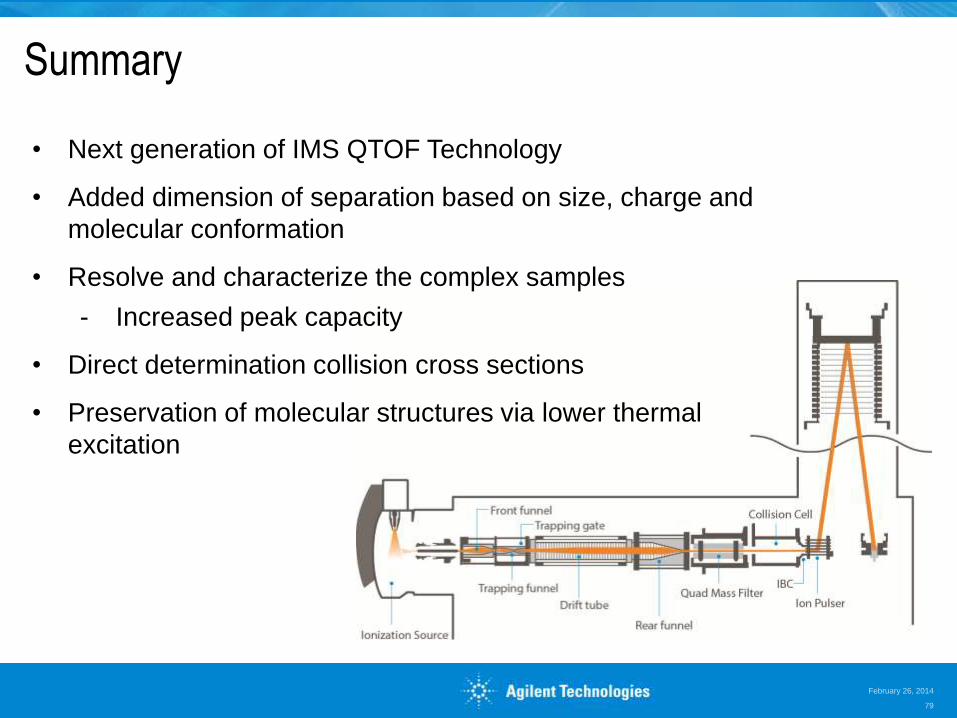
• Next generation of IMS QTOF Technology
• Added dimension of separation based on size, charge and
molecular conformation
• Resolve and characterize the complex samples
- Increased peak capacity
• Direct determination collision cross sections
• Preservation of molecular structures via lower thermal
excitation
Summary
February 26, 2014
79