NONPARAMETRIC STATISTICS Nonparametric statistics or distribution free statistics is use when the...
35
NONPARAMETRIC STATISTICS • Nonparametric statistics or distribution free statistics is use when the population from which the samples are selected is not normally distributed. • Can be used to test hypotheses that do not involve specific population parameters, such as μ, σ, or p.
-
Upload
doreen-armstrong -
Category
Documents
-
view
238 -
download
4
Transcript of NONPARAMETRIC STATISTICS Nonparametric statistics or distribution free statistics is use when the...
NONPARAMETRIC STATISTICS
• Nonparametric statistics or distribution free statistics is use when the population from which the samples are selected is not normally distributed.
• Can be used to test hypotheses that do not involve specific population parameters, such as μ, σ, or p.
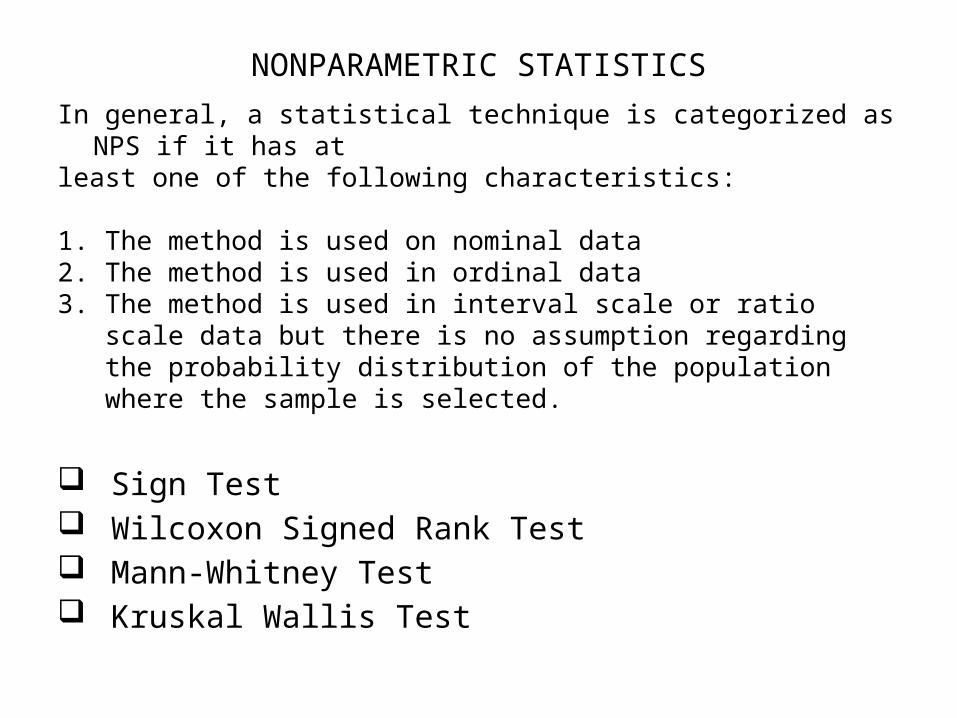
NONPARAMETRIC STATISTICS
In general, a statistical technique is categorized as NPS if it has at
least one of the following characteristics:
1. The method is used on nominal data2. The method is used in ordinal data3. The method is used in interval scale or ratio scale data but
there is no assumption regarding the probability distribution of the population where the sample is selected.
Sign Test Wilcoxon Signed Rank Test Mann-Whitney Test Kruskal Wallis Test
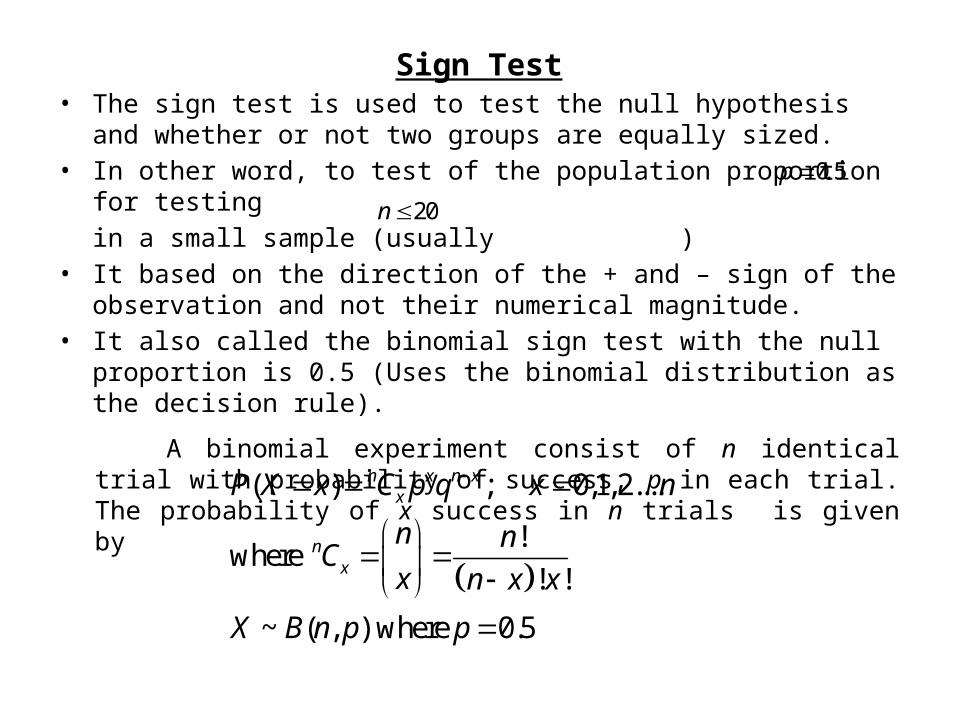
Sign Test• The sign test is used to test the null hypothesis and
whether or not two groups are equally sized.• In other word, to test of the population proportion for
testing in a small sample (usually )
• It based on the direction of the + and – sign of the observation and not their numerical magnitude.
• It also called the binomial sign test with the null proportion is 0.5 (Uses the binomial distribution as the decision rule).
A binomial experiment consist of n identical trial with probability of success, p in each trial. The probability of x success in n trials is given by
( ) ; 0,1, 2....
!where
! !
~ ( , ) where 0.5
n x n xx
nx
P X x C p q x n
n nC
x n x x
X B n p p
0 5p .
20n
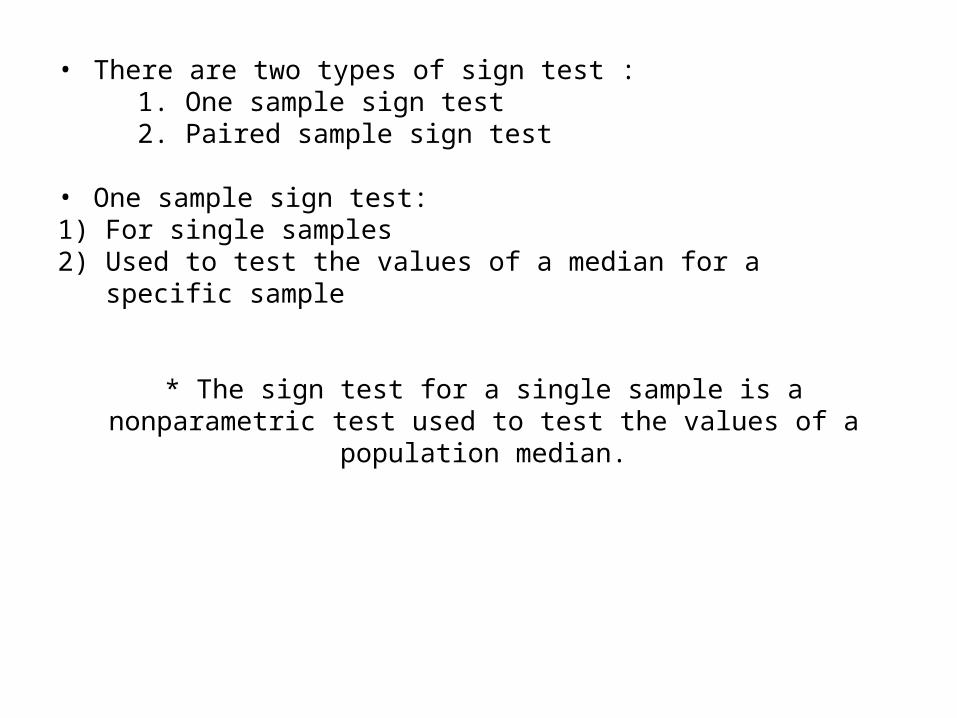
• There are two types of sign test : 1. One sample sign test 2. Paired sample sign test
• One sample sign test:1) For single samples2) Used to test the values of a median for a specific sample
* The sign test for a single sample is a nonparametric test used to test the values of a population median.
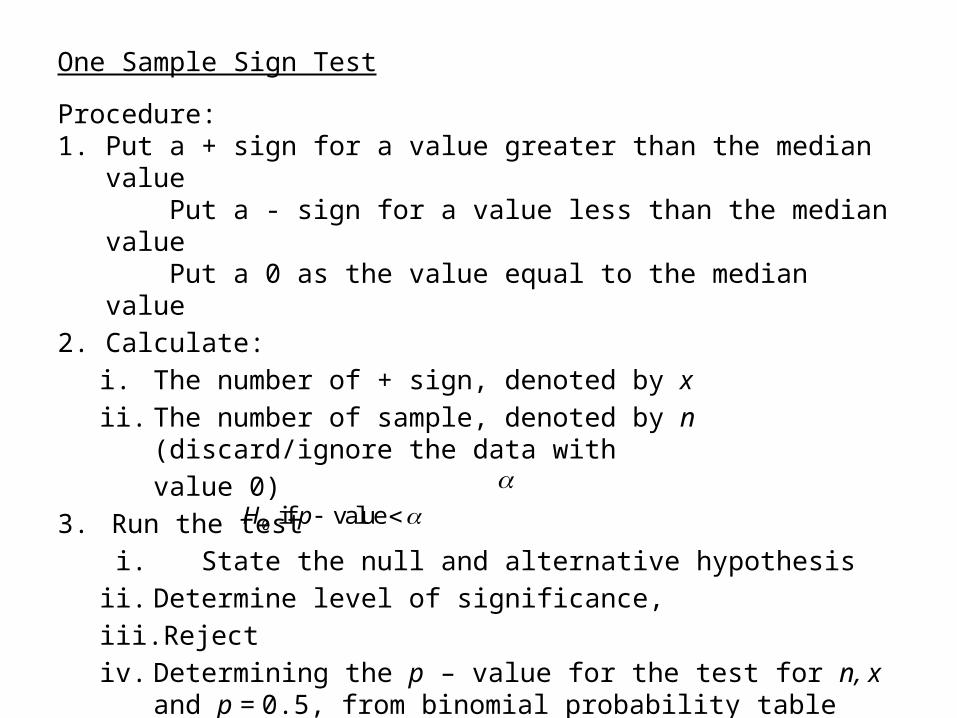
One Sample Sign Test
Procedure:1. Put a + sign for a value greater than the median value Put a - sign for a value less than the median value Put a 0 as the value equal to the median value2. Calculate:
i. The number of + sign, denoted by xii. The number of sample, denoted by n (discard/ignore
the data with value 0)
3. Run the test i. State the null and alternative hypothesisii. Determine level of significance, iii. Reject iv. Determining the p – value for the test for n, x and p = 0.5,
from binomial probability table base on the type of test being conducted
0 if valueH p
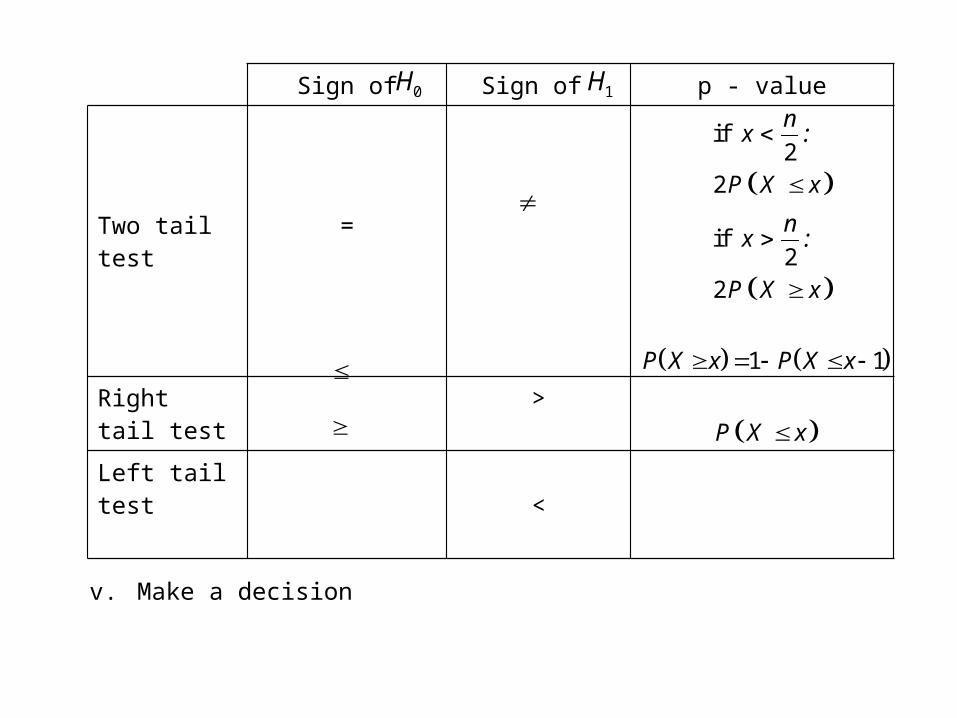
Sign of Sign of p - value
Two tail test
=
Right tail test
>
Left tail test <
0H 1H
if 2
2
if 2
2
nx :
P X x
nx :
P X x
1 1P X x P X x
P X x
v. Make a decision
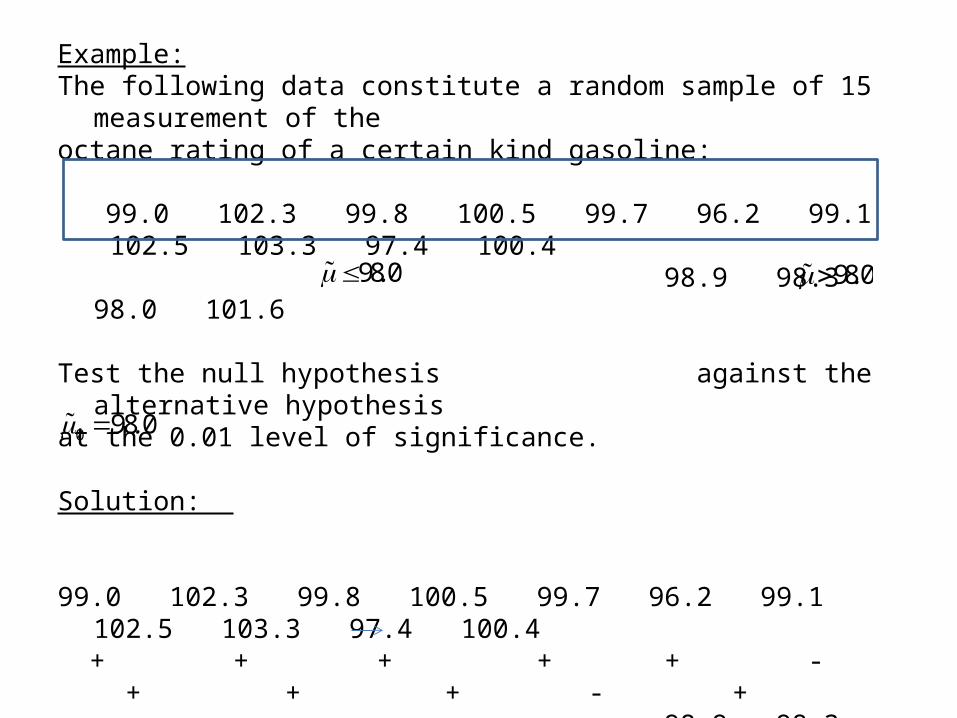
Example:The following data constitute a random sample of 15
measurement of the octane rating of a certain kind gasoline:
99.0 102.3 99.8 100.5 99.7 96.2 99.1 102.5 103.3 97.4 100.4
98.9 98.3 98.0 101.6
Test the null hypothesis against the alternative hypothesis
at the 0.01 level of significance.
Solution:
99.0 102.3 99.8 100.5 99.7 96.2 99.1 102.5 103.3 97.4 100.4
+ + + + + - + + + - +
98.9 98.3 98.0 101.6 + + 0 +Number of + sign, x = 12Number of sample, n = 14 (15 -1)p = 0.5
98 0. 98 0.
0 98 0.
1.
2.
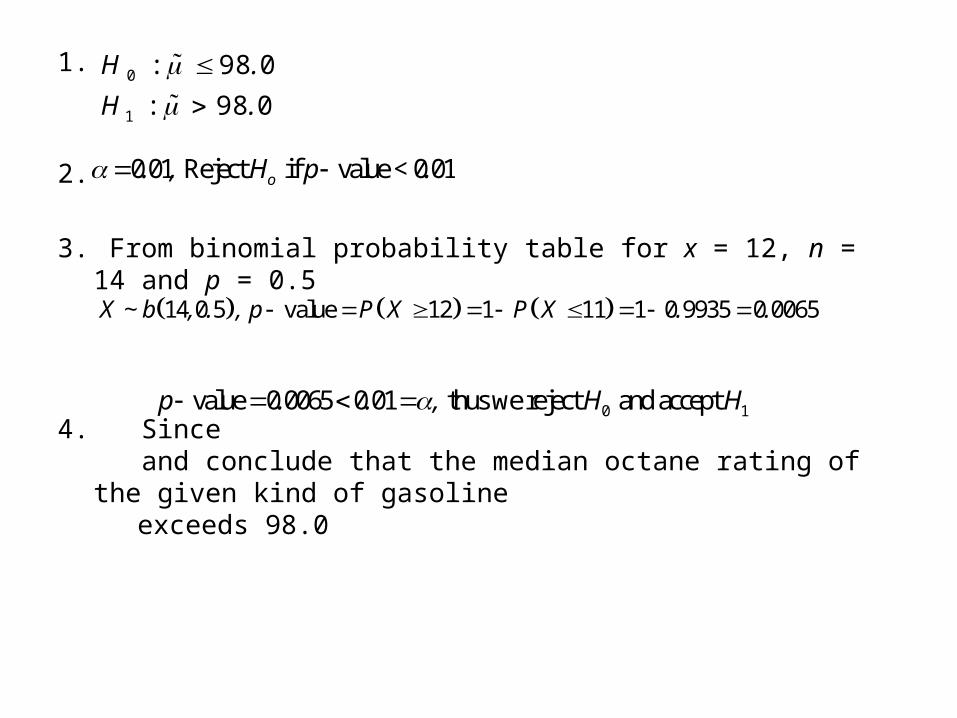
3. From binomial probability table for x = 12, n = 14 and p = 0.5
4. Since and conclude that the median octane rating of the given
kind of gasoline exceeds 98.0
0
1
: 98 0
: 98 0
H .
H .
0 01 Reject if value < 0 01o. , H p .
0 1value 0 0065 0 01 thus we reject and accept p . . , H H
14 0 5 value 12 1 11 1 0 9935 0 0065X ~ b , . , p P X P X . .
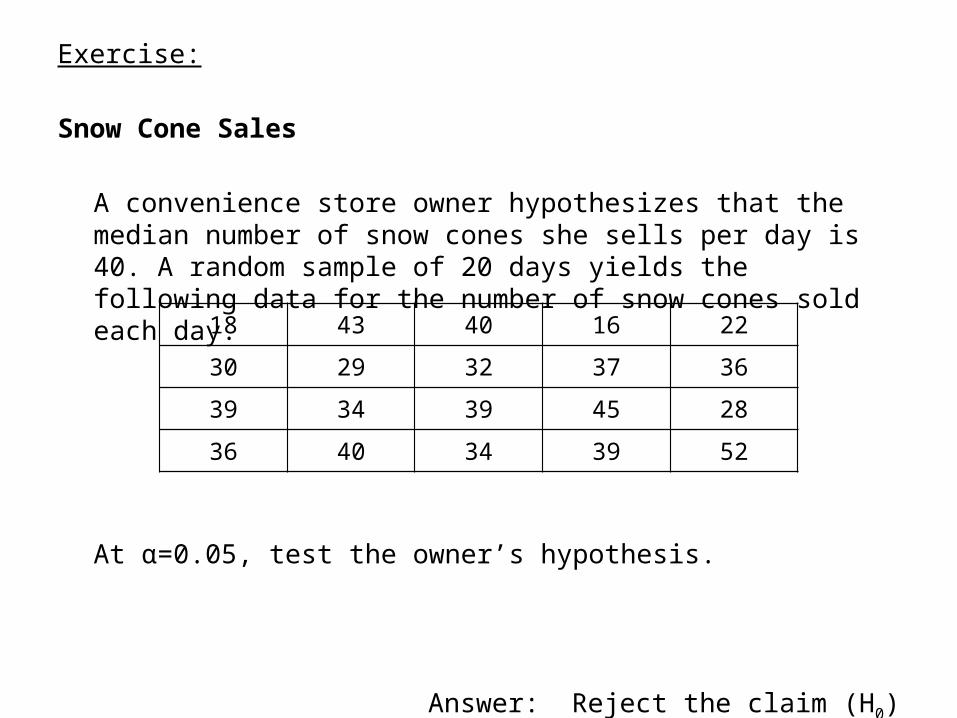
Exercise:
Snow Cone Sales
A convenience store owner hypothesizes that the median number of snow cones she sells per day is 40. A random sample of 20 days yields the following data for the number of snow cones sold each day.
At α=0.05, test the owner’s hypothesis.
Answer: Reject the claim (H0)
18 43 40 16 22
30 29 32 37 36
39 34 39 45 28
36 40 34 39 52
Wilcoxon Signed Rank Test
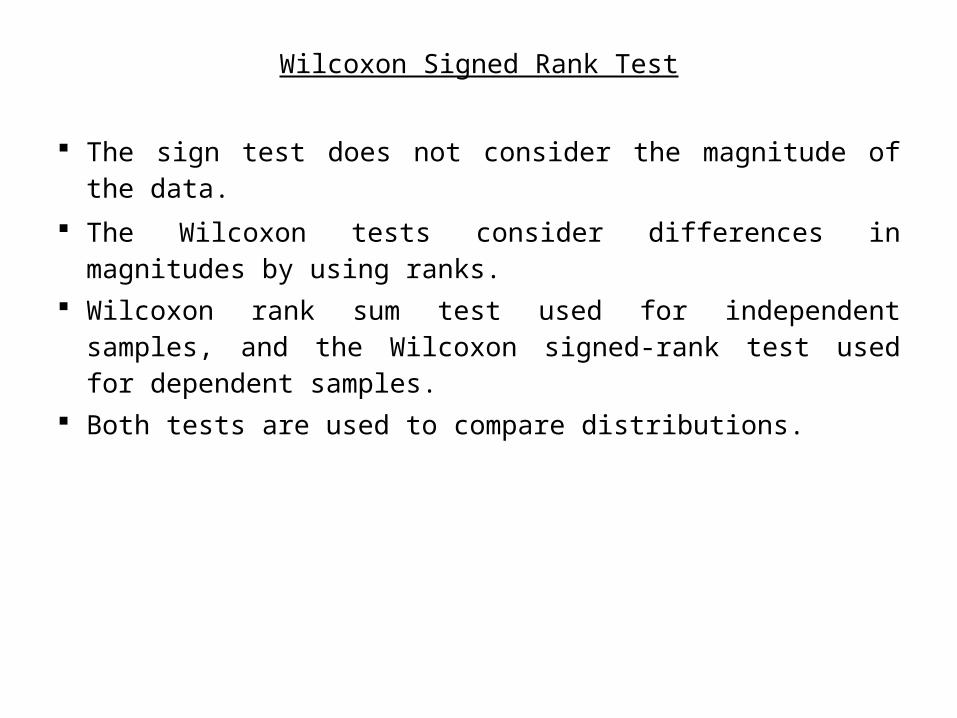
The sign test does not consider the magnitude of the data. The Wilcoxon tests consider differences in magnitudes by using ranks. Wilcoxon rank sum test used for independent samples, and the Wilcoxon
signed-rank test used for dependent samples. Both tests are used to compare distributions.
Wilcoxon Signed Rank Test
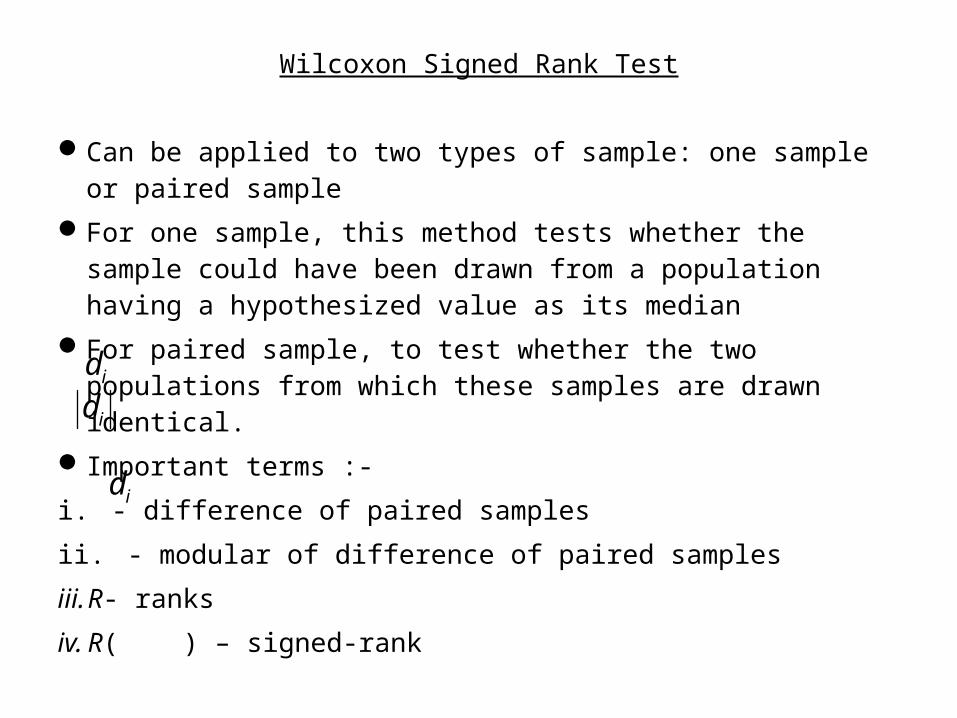
Can be applied to two types of sample: one sample or paired sampleFor one sample, this method tests whether the sample could have been
drawn from a population having a hypothesized value as its medianFor paired sample, to test whether the two populations from which these
samples are drawn identical. Important terms :-i. - difference of paired samplesii. - modular of difference of paired samplesiii. R- ranksiv. R( ) – signed-rank
id
id
id
Wilcoxon Signed Rank Test
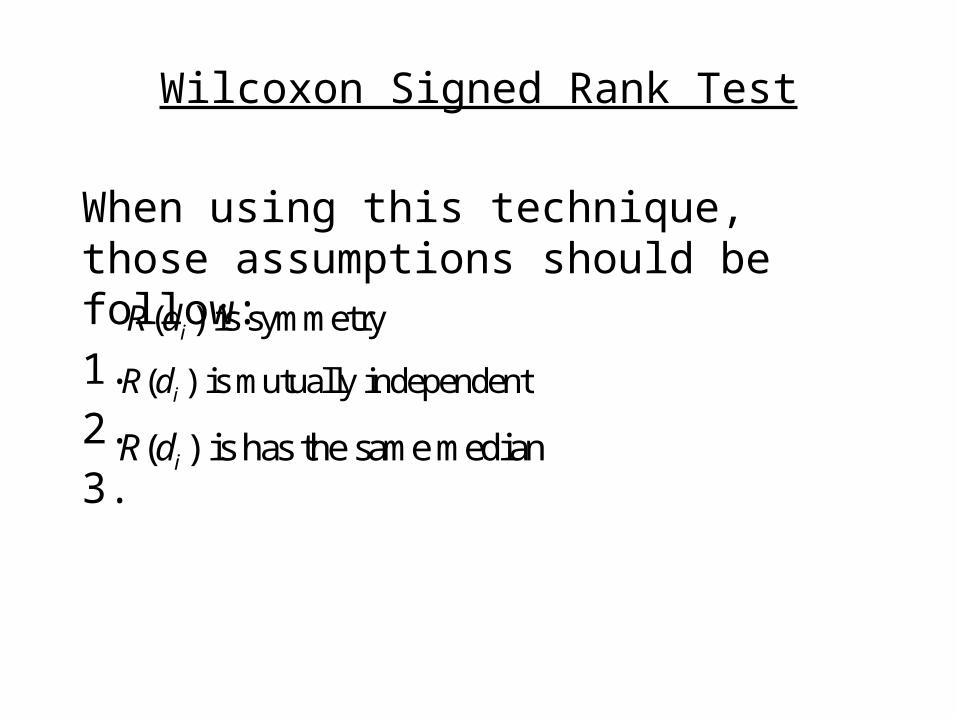
When using this technique, those assumptions should be follow:1. 2.3.
( ) is symmetryiR d
( ) is mutually independentiR d
( ) is has the same medianiR d
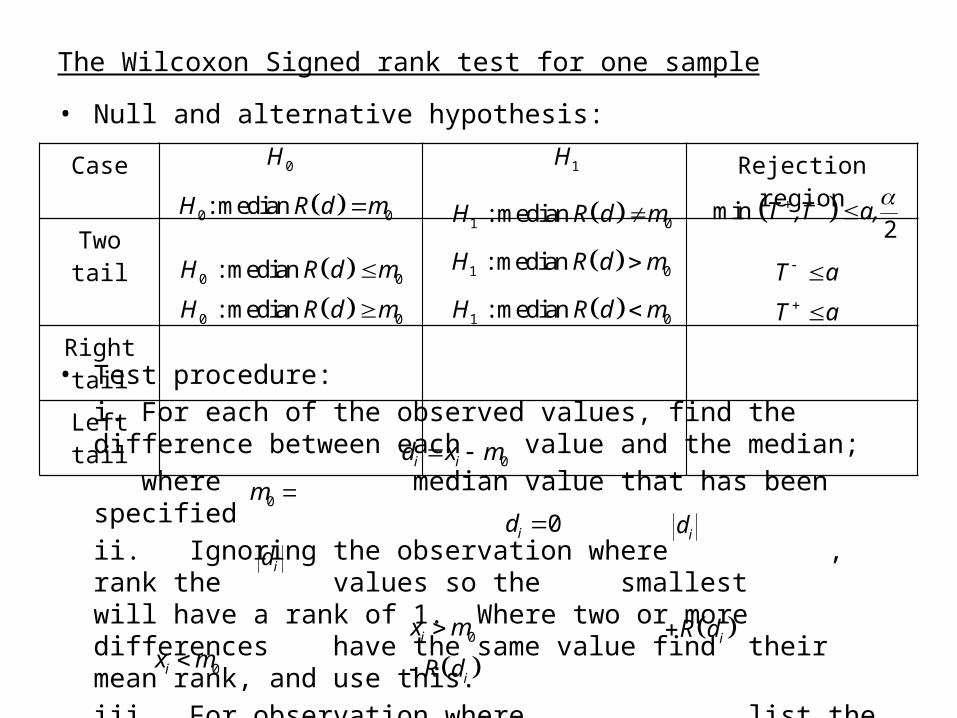
The Wilcoxon Signed rank test for one sample
• Null and alternative hypothesis:
• Test procedure:i. For each of the observed values, find the difference between each value and the median;
where median value that has been specifiedii. Ignoring the observation where , rank the values so the smallest will have a rank of 1. Where two or more differences have the same value find their mean rank, and use this. iii. For observation where , list the rank as column and list the rank as column
Case Rejection region
Two tail
Right tail
Left tail
0H 1H
0 0: median H R d m 1 0 : median H R d m
0 0 : median H R d m
0 0 : median H R d m
1 0 : median H R d m
1 0 : median H R d m
min 2
T ,T a,
T a
T a
0i id x m
0m 0id id
id
0ix m iR d0ix m iR d
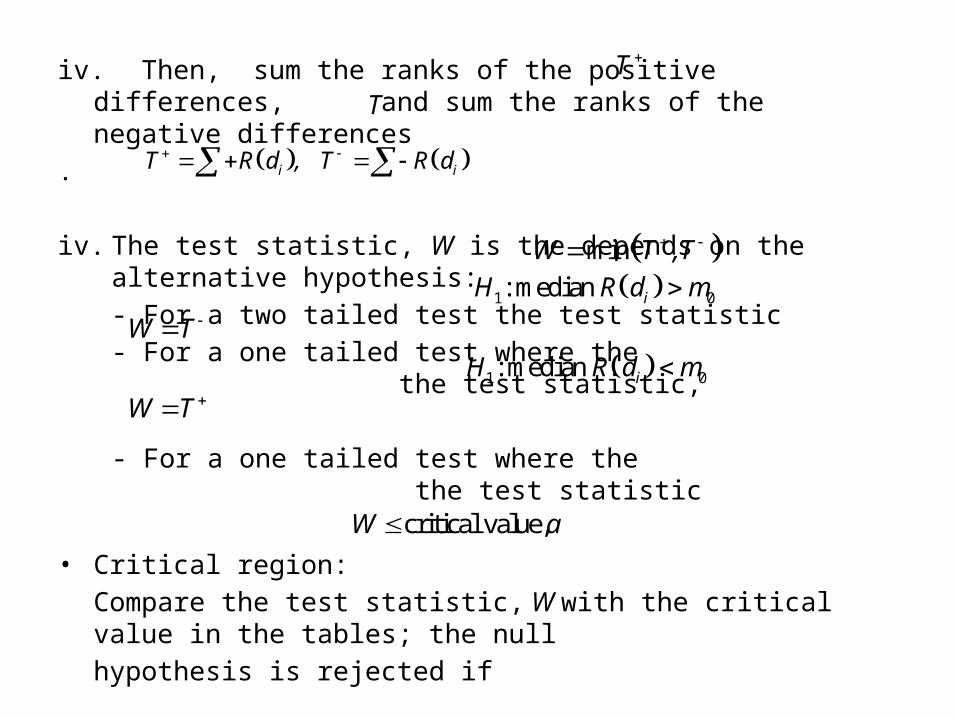
iv. Then, sum the ranks of the positive differences, and sum the ranks of the negative differences
.
iv. The test statistic, W is the depends on the alternative hypothesis:- For a two tailed test the test statistic - For a one tailed test where the the test statistic,
- For a one tailed test where the the test statistic
• Critical region:Compare the test statistic, W with the critical value in the tables; the null hypothesis is rejected if
• Make a decision
i iT R d , T R d
T
T
minW T ,T 1 0: median iH R d m
W T 1 0: median iH R d m
W T
critical value,W a
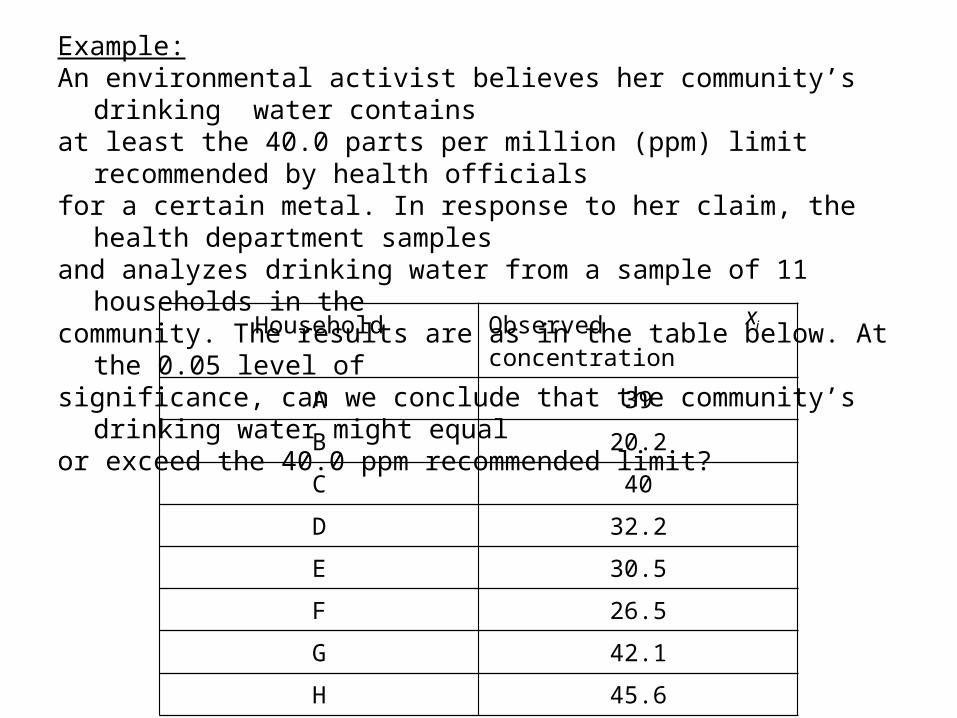
Example:An environmental activist believes her community’s drinking
water contains at least the 40.0 parts per million (ppm) limit recommended
by health officials for a certain metal. In response to her claim, the health
department samples and analyzes drinking water from a sample of 11 households
in the community. The results are as in the table below. At the 0.05
level of significance, can we conclude that the community’s drinking
water might equal or exceed the 40.0 ppm recommended limit?
Household Observed concentration
A 39
B 20.2
C 40
D 32.2
E 30.5
F 26.5
G 42.1
H 45.6
ix
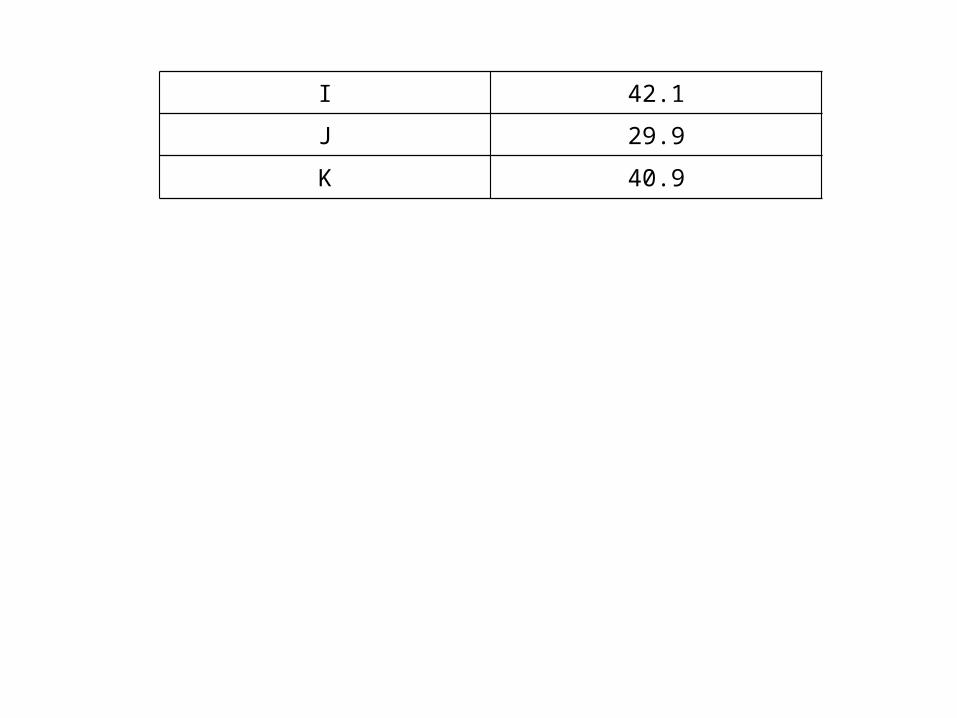
I 42.1
J 29.9
K 40.9
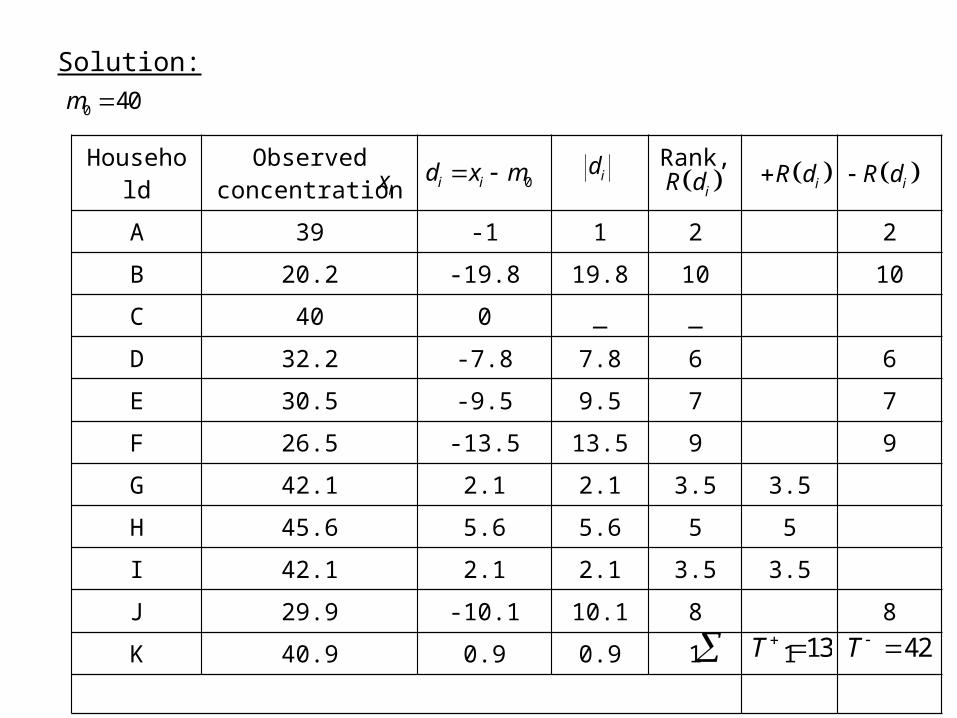
Solution:
0 40m
Household
Observed concentration
Rank,
A 39 -1 1 2 2
B 20.2 -19.8 19.8 10 10
C 40 0 _ _
D 32.2 -7.8 7.8 6 6
E 30.5 -9.5 9.5 7 7
F 26.5 -13.5 13.5 9 9
G 42.1 2.1 2.1 3.5 3.5
H 45.6 5.6 5.6 5 5
I 42.1 2.1 2.1 3.5 3.5
J 29.9 -10.1 10.1 8 8
K 40.9 0.9 0.9 1 1
ix 0i id x m id iR d iR d
iR d
13T 42T
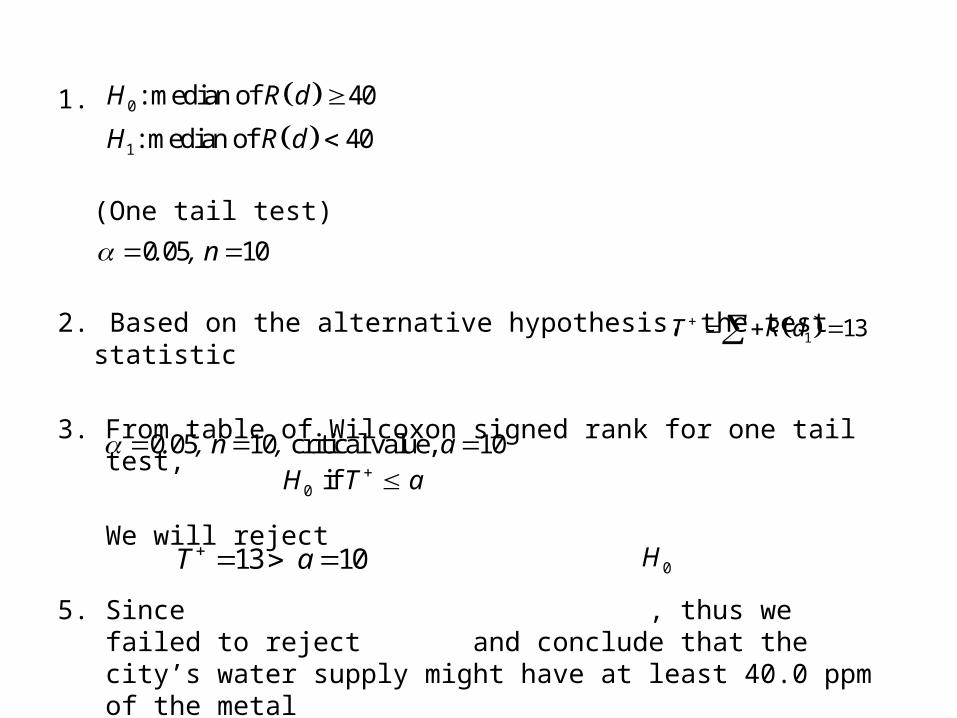
1.
(One tail test)
2. Based on the alternative hypothesis, the test statistic
3. From table of Wilcoxon signed rank for one tail test,
We will reject
5. Since , thus we failed to reject and conclude that the city’s water supply might have at least 40.0 ppm of the metal
0
1
: median of 40
: median of 40
H R d
H R d
0 05 10. , n
0 05 10 critical value, 10. , n , a
0 if H T a
13 10T a 0H
1 13T R d
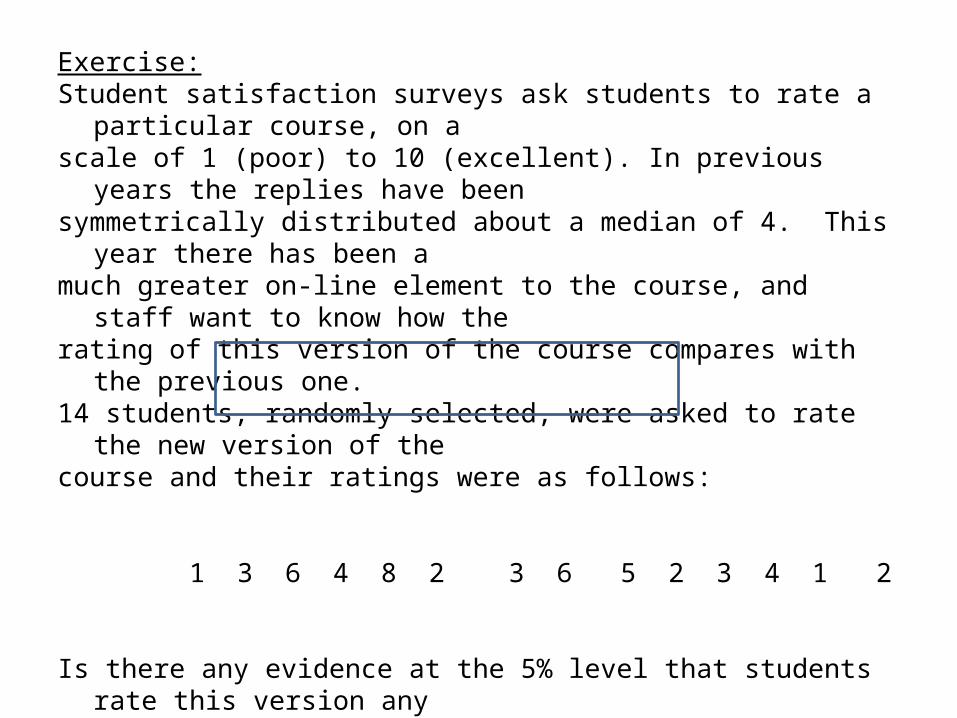
Exercise:Student satisfaction surveys ask students to rate a particular
course, on a scale of 1 (poor) to 10 (excellent). In previous years the replies
have been symmetrically distributed about a median of 4. This year
there has been a much greater on-line element to the course, and staff want to
know how the rating of this version of the course compares with the previous
one. 14 students, randomly selected, were asked to rate the new
version of the course and their ratings were as follows:
1 3 6 4 8 2 3 6 5 2 3 4 1 2
Is there any evidence at the 5% level that students rate this version any
differently?
Answer: Accept H0
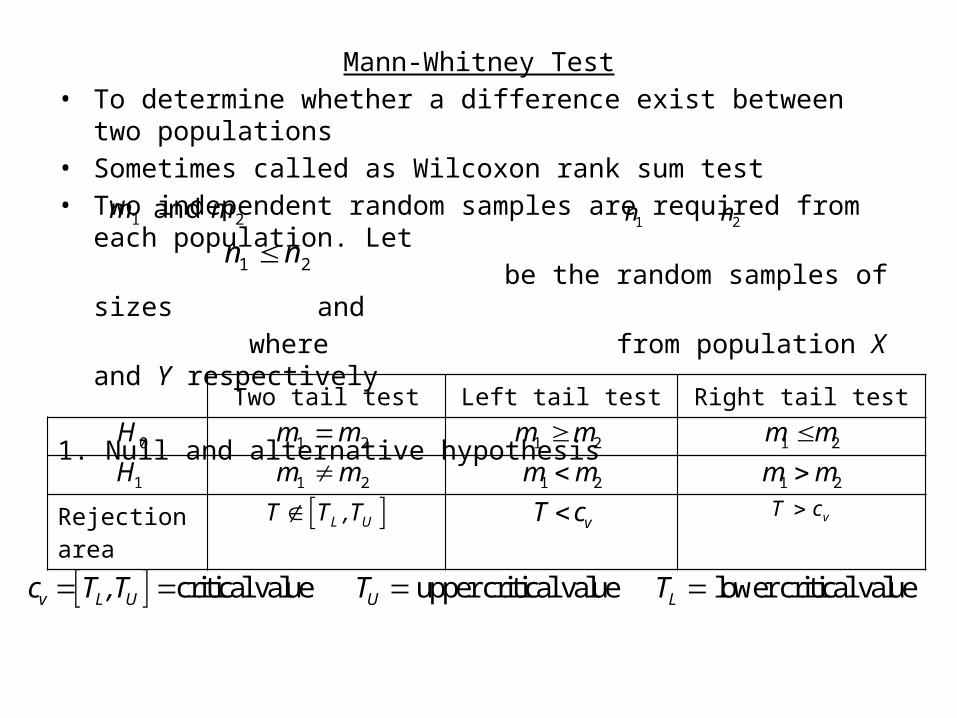
Mann-Whitney Test• To determine whether a difference exist between two
populations• Sometimes called as Wilcoxon rank sum test• Two independent random samples are required from each
population. Let be the random samples of sizes and where from population X and Y respectively
1. Null and alternative hypothesis
1 2 and m m
1 2n n
Two tail test Left tail test Right tail test
Rejection area
0H
1H1 2m m 1 2m m 1 2m m
1 2m m 1 2m m 1 2m m
L UT T ,T vT c vT c
critical value upper critical value lower critical valuev L U U Lc T ,T T T
1n 2n
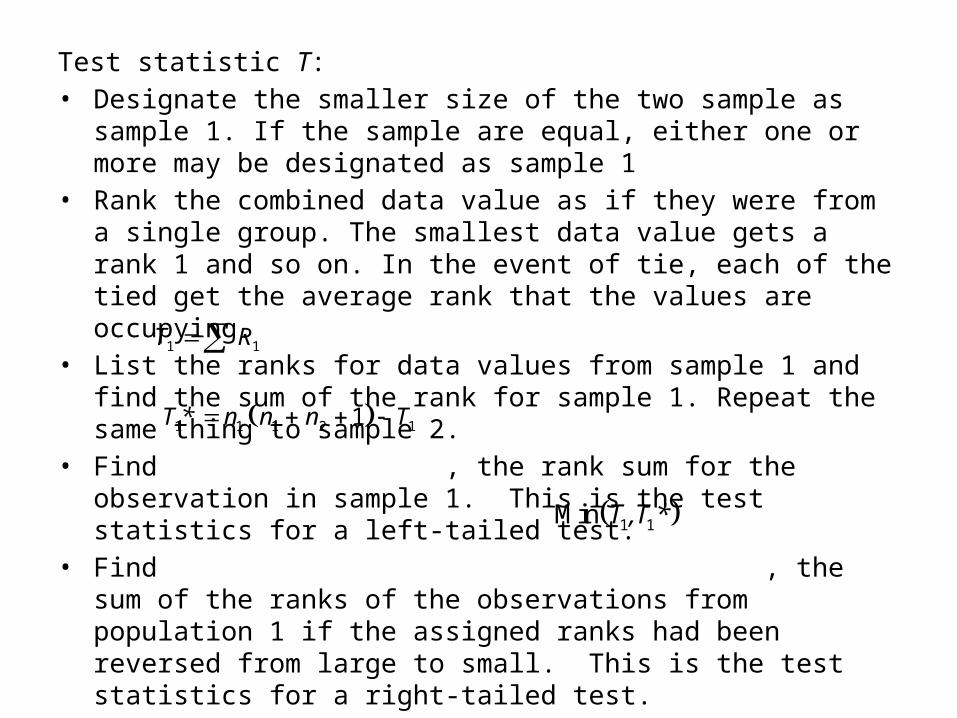
Test statistic T:• Designate the smaller size of the two sample as sample 1. If
the sample are equal, either one or more may be designated as sample 1
• Rank the combined data value as if they were from a single group. The smallest data value gets a rank 1 and so on. In the event of tie, each of the tied get the average rank that the values are occupying.
• List the ranks for data values from sample 1 and find the sum of the rank for sample 1. Repeat the same thing to sample 2.
• Find , the rank sum for the observation in sample 1. This is the test statistics for a left-tailed test.
• Find , the sum of the ranks of the observations from population 1 if the assigned ranks had been reversed from large to small. This is the test statistics for a right-tailed test.
• The test statistic for a two-tailed test is T, .
1 1T R
1 1Min T ,T *
1 1 1 2 11T * n n n T
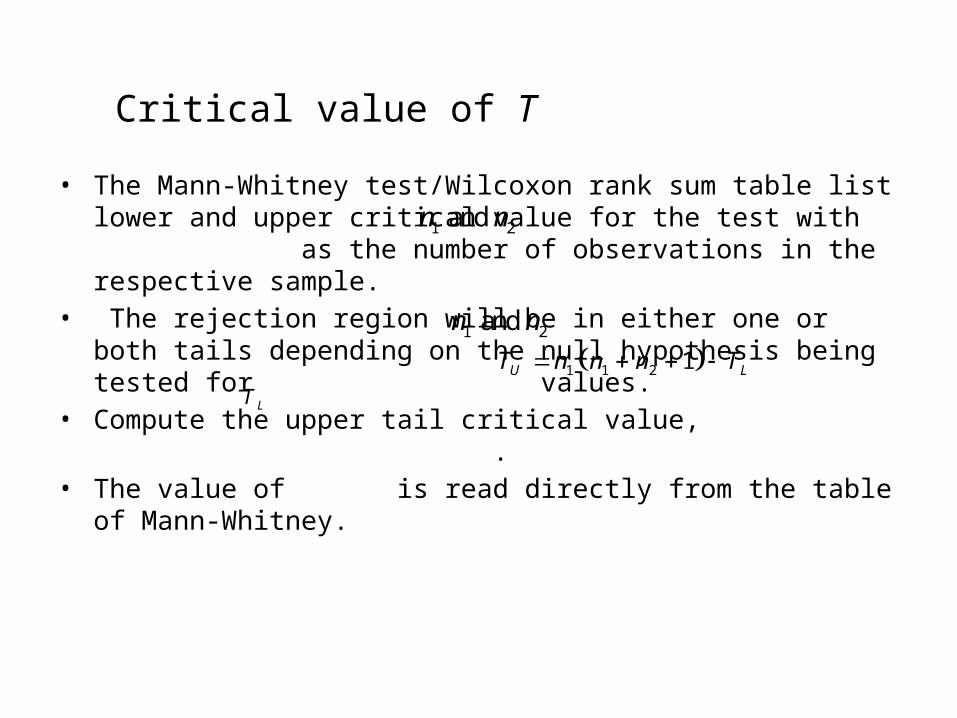
Critical value of T
• The Mann-Whitney test/Wilcoxon rank sum table list lower and upper critical value for the test with as the number of observations in the respective sample.
• The rejection region will be in either one or both tails depending on the null hypothesis being tested for values.
• Compute the upper tail critical value, .
• The value of is read directly from the table of Mann-Whitney.
1 2 and n n
1 2 and n n
1 1 2 1U LT n n n T
LT
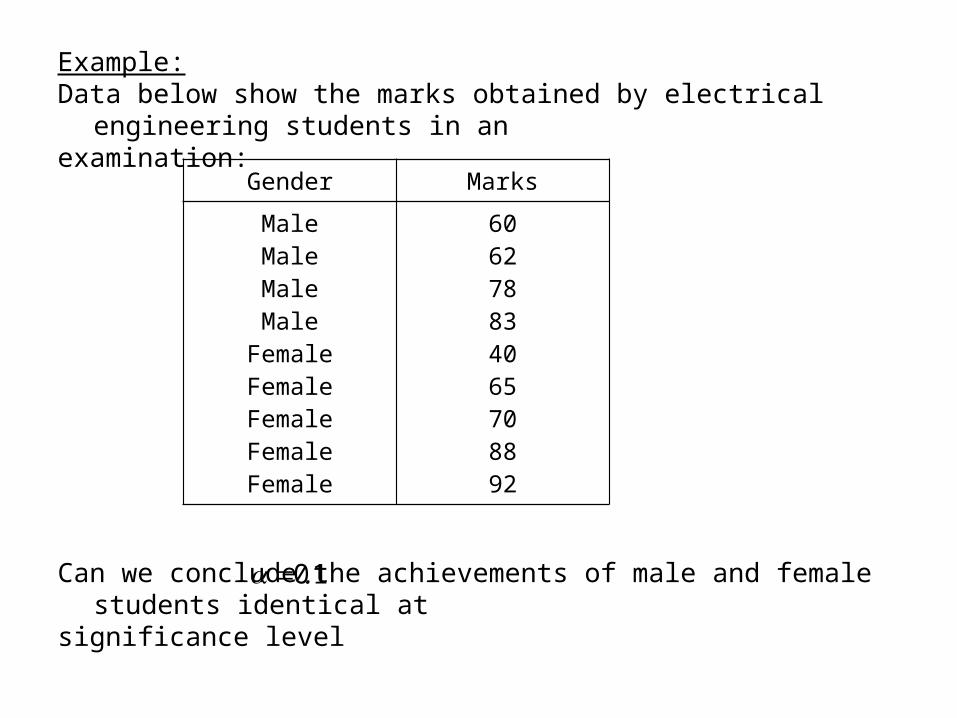
Example:Data below show the marks obtained by electrical engineering
students in an examination:
Can we conclude the achievements of male and female students identical at
significance level
Gender Marks
MaleMaleMaleMale
FemaleFemaleFemaleFemaleFemale
606278834065708892
0 1.
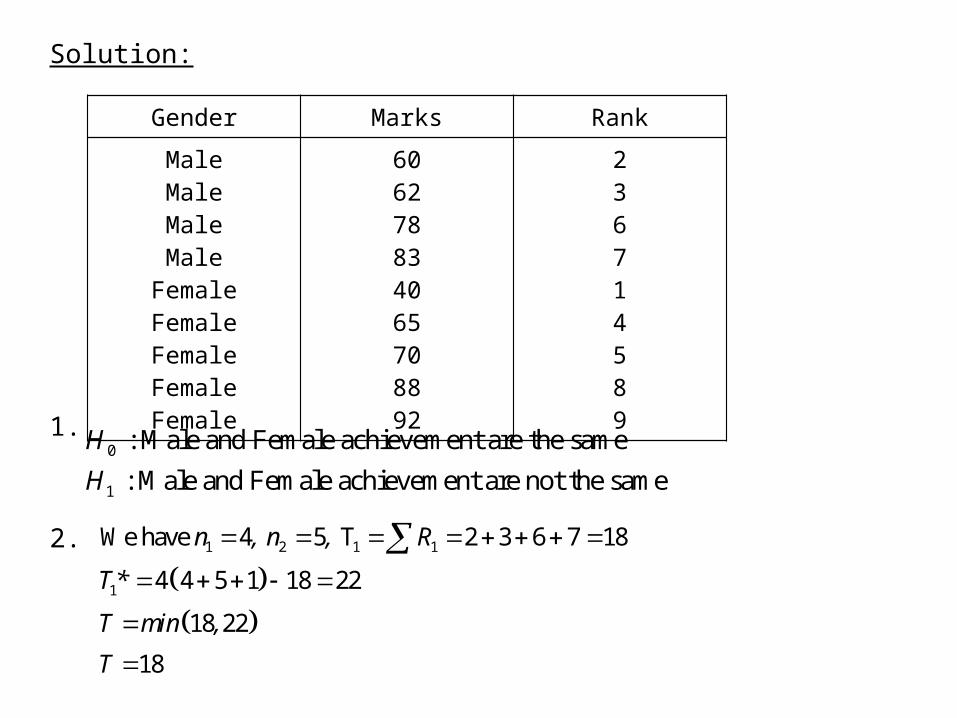
Gender Marks Rank
MaleMaleMaleMale
FemaleFemaleFemaleFemaleFemale
606278834065708892
236714589
0
1
: Male and Female achievement are the same
: Male and Female achievement are not the same
H
H
Solution:
1.
2.
1 2 1 1
1
We have 4 5 T 2 3 6 7 18
4 4 5 1 18 22
18 22
18
n , n , R
T *
T min ,
T
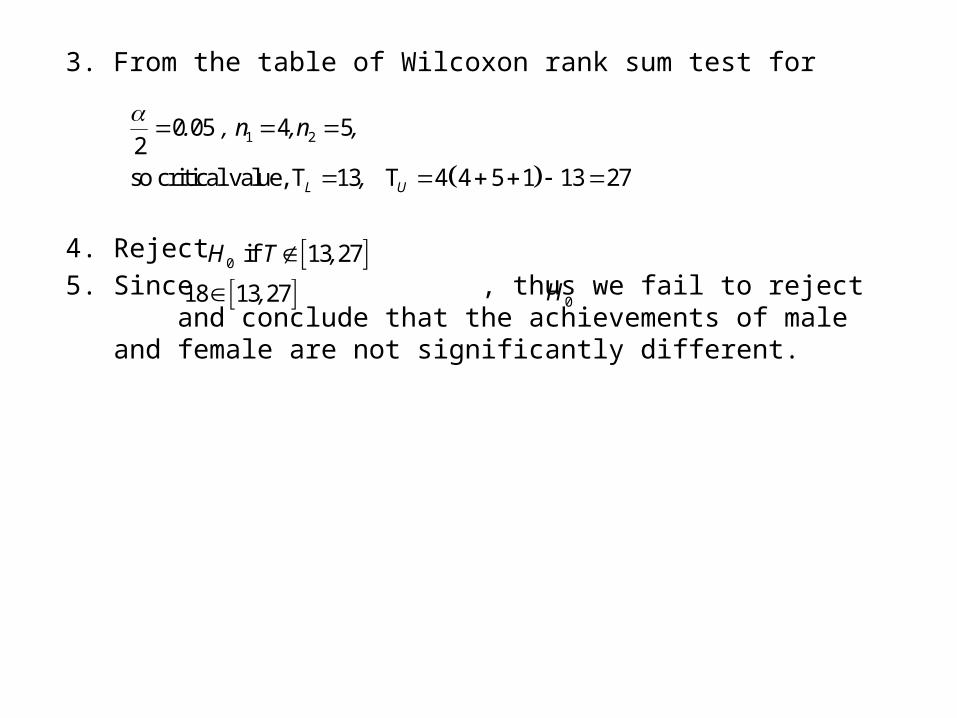
3. From the table of Wilcoxon rank sum test for
4. Reject 5. Since , thus we fail to reject and conclude
that the achievements of male and female are not significantly different.
1 20 05 4 5
2so critical value, T 13 T 4 4 5 1 13 27L U
. , n ,n ,
,
0 if 13 27H T ,
18 13 27, 0H
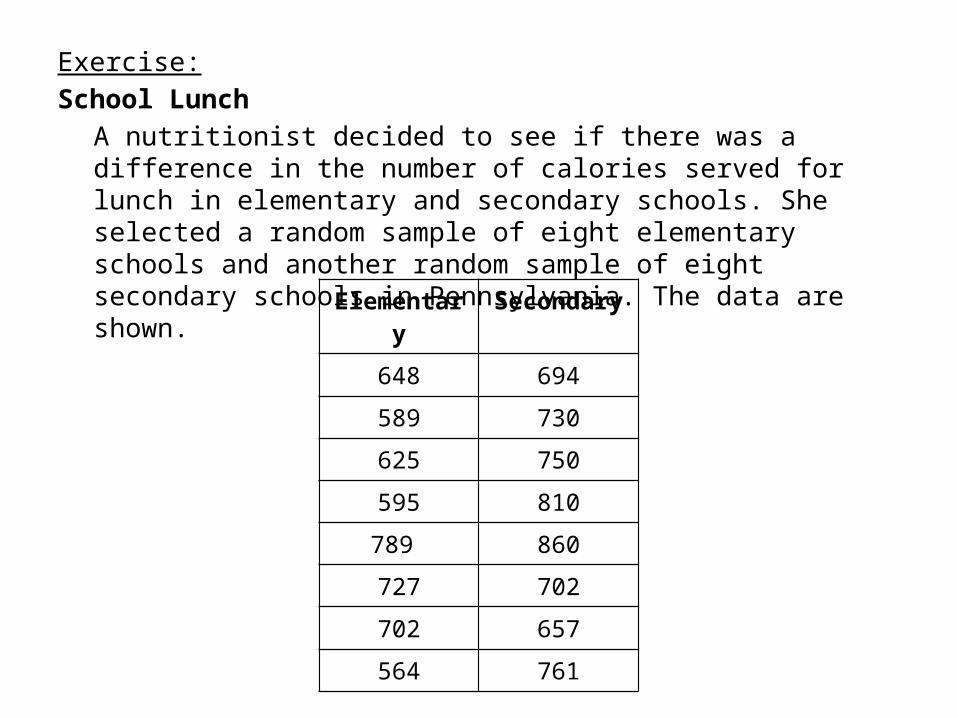
Exercise:School Lunch
A nutritionist decided to see if there was a difference in the number of calories served for lunch in elementary and secondary schools. She selected a random sample of eight elementary schools and another random sample of eight secondary schools in Pennsylvania. The data are shown.
Answer: Reject H0
Elementary Secondary
648 694
589 730
625 750
595 810
789 860
727 702
702 657
564 761
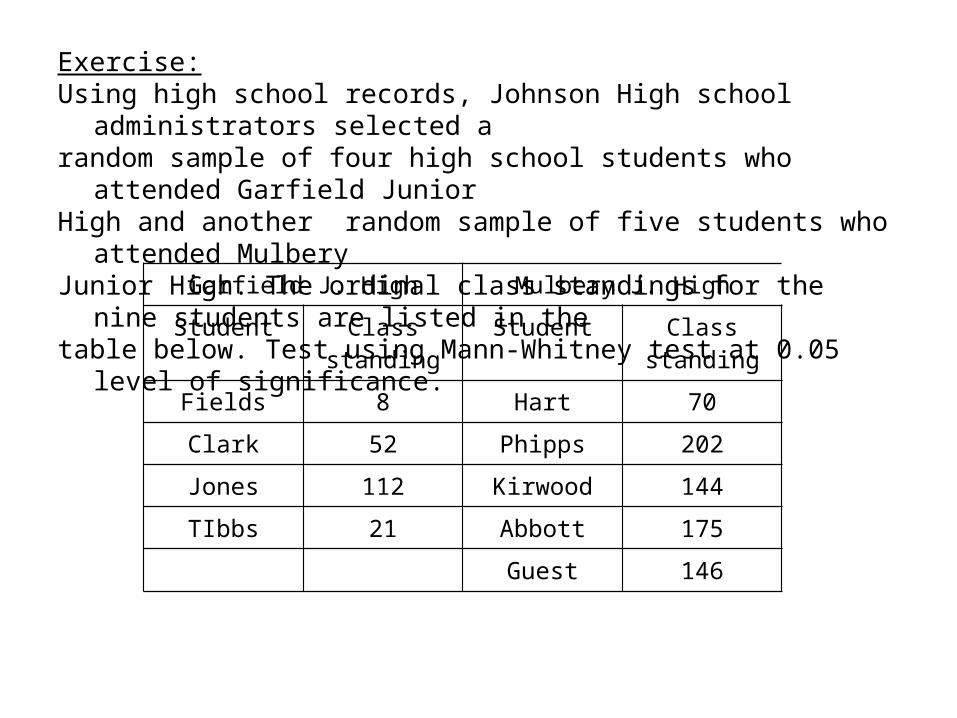
Exercise:Using high school records, Johnson High school administrators
selected a random sample of four high school students who attended
Garfield Junior High and another random sample of five students who
attended Mulbery Junior High. The ordinal class standings for the nine students
are listed in the table below. Test using Mann-Whitney test at 0.05 level of
significance.
Answer: Reject H0
Garfield J. High Mulbery J. High
Student Class standing
Student Class standing
Fields 8 Hart 70
Clark 52 Phipps 202
Jones 112 Kirwood 144
TIbbs 21 Abbott 175
Guest 146
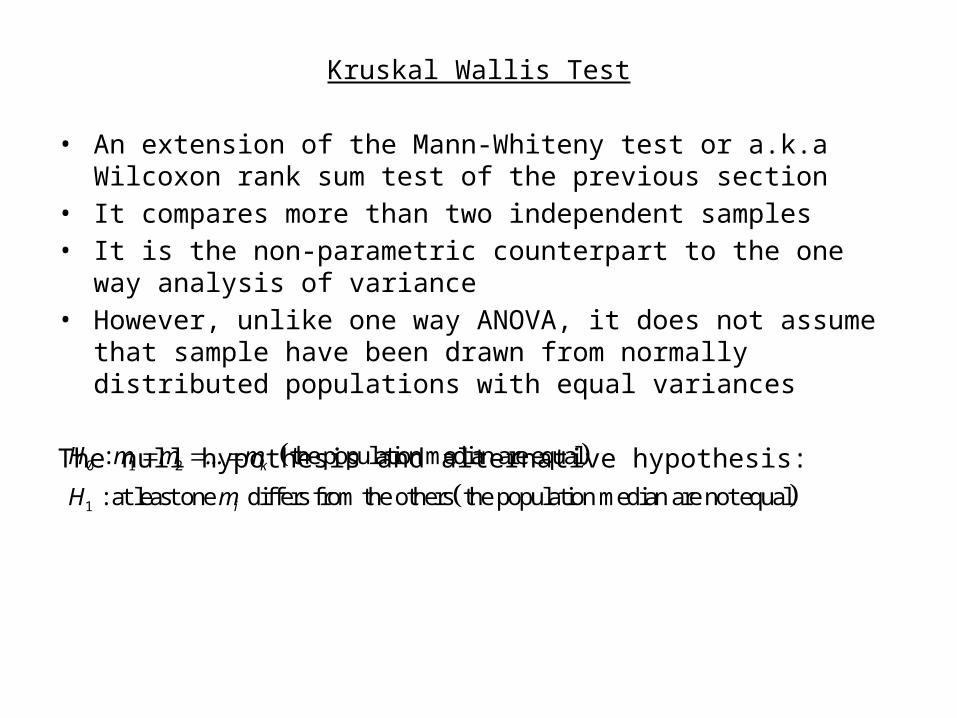
Kruskal Wallis Test
• An extension of the Mann-Whiteny test or a.k.a Wilcoxon rank sum test of the previous section
• It compares more than two independent samples• It is the non-parametric counterpart to the one way analysis
of variance• However, unlike one way ANOVA, it does not assume that
sample have been drawn from normally distributed populations with equal variances
The null hypothesis and alternative hypothesis:
0 1 2
1
: the population median are equal
: at least one differs from the others the population median are not equal
k
i
H m m ... m
H m
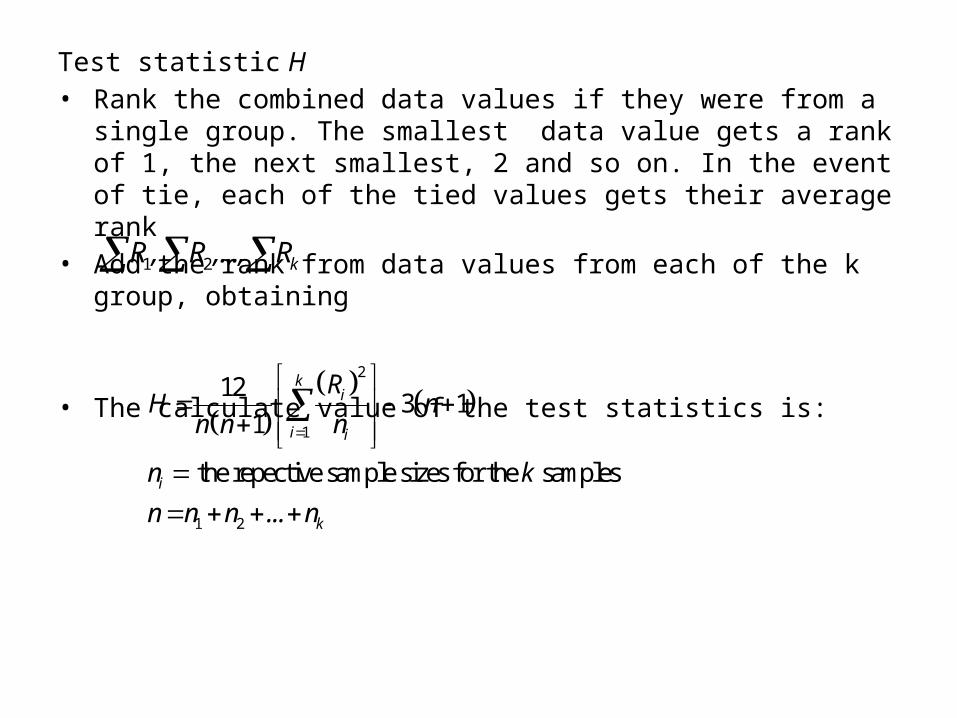
Test statistic H• Rank the combined data values if they were from a single
group. The smallest data value gets a rank of 1, the next smallest, 2 and so on. In the event of tie, each of the tied values gets their average rank
• Add the rank from data values from each of the k group, obtaining
• The calculate value of the test statistics is:
1 2 kR , R ,..., R
2
1
1 2
123 1
1
the repective sample sizes for the samples
ki
i i
i
k
RH n
n n n
n k
n n n ... n
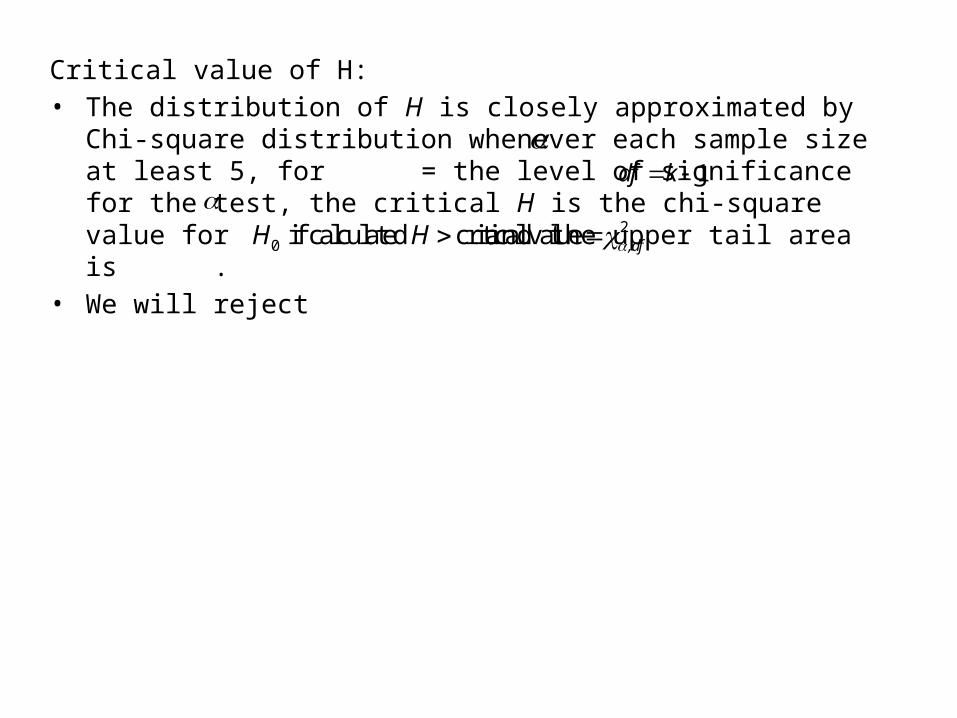
Critical value of H:• The distribution of H is closely approximated by Chi-square
distribution whenever each sample size at least 5, for = the level of significance for the test, the critical H is the chi-square value for and the upper tail area is .
• We will reject
1df k
2
0 if calculated critical value ,dfH H
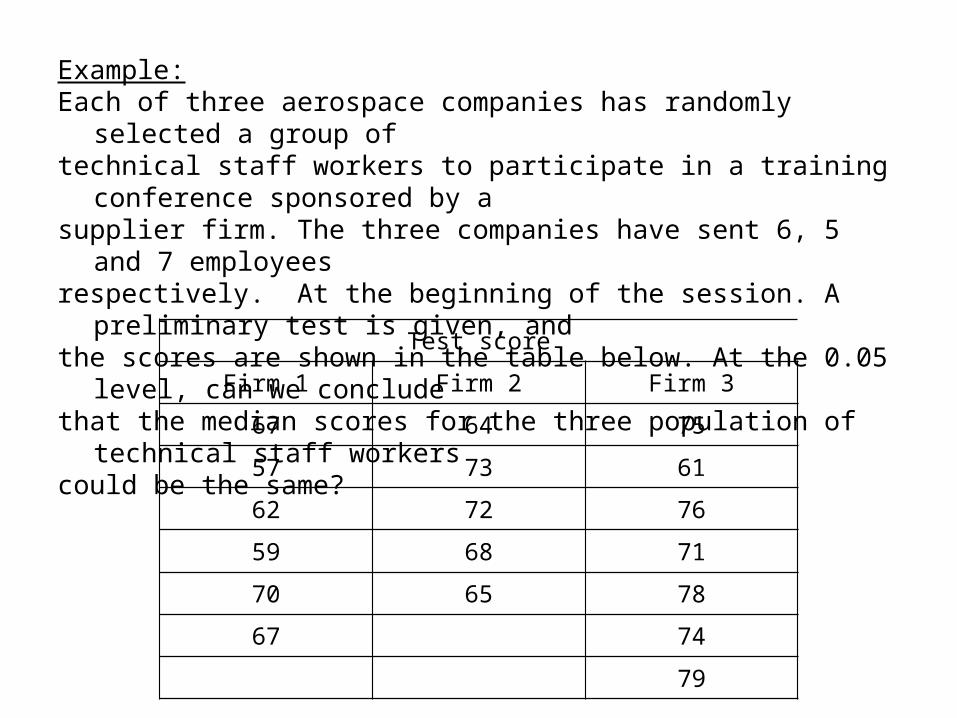
Example:Each of three aerospace companies has randomly selected a
group of technical staff workers to participate in a training conference
sponsored by a supplier firm. The three companies have sent 6, 5 and 7
employees respectively. At the beginning of the session. A preliminary
test is given, and the scores are shown in the table below. At the 0.05 level, can
we conclude that the median scores for the three population of technical
staff workers could be the same?
Test score
Firm 1 Firm 2 Firm 3
67 64 75
57 73 61
62 72 76
59 68 71
70 65 78
67 74
79
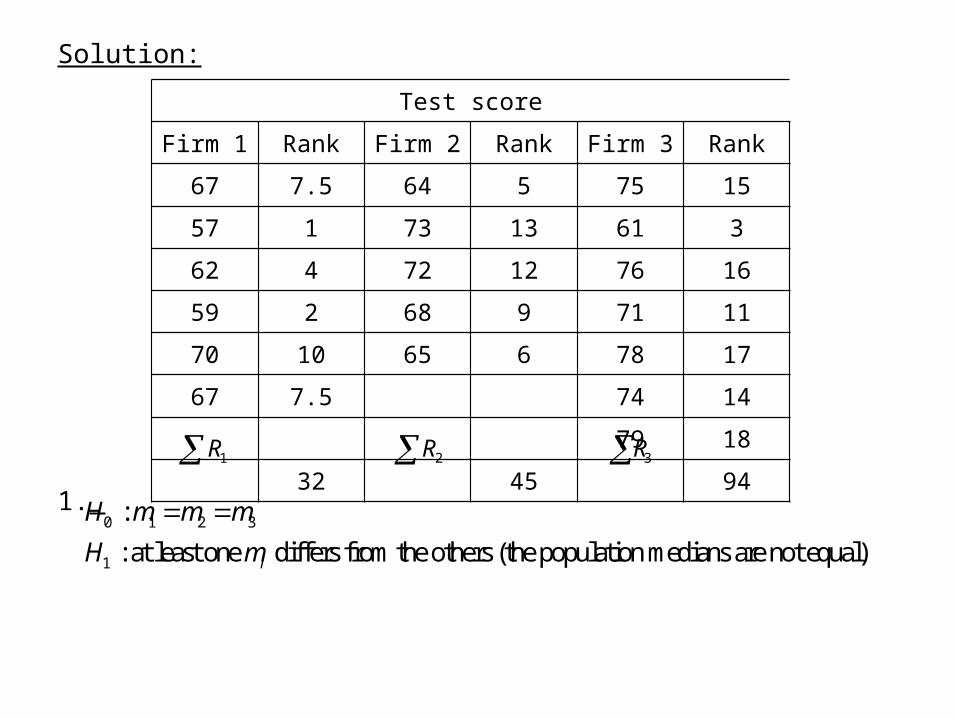
Solution:
1.
Test score
Firm 1 Rank Firm 2 Rank Firm 3 Rank
67 7.5 64 5 75 15
57 1 73 13 61 3
62 4 72 12 76 16
59 2 68 9 71 11
70 10 65 6 78 17
67 7.5 74 14
79 18
32 45 941R 2R 3R
0 1 2 3
1
:
: at least one differs from the others (the population medians are not equal)i
H m m m
H m
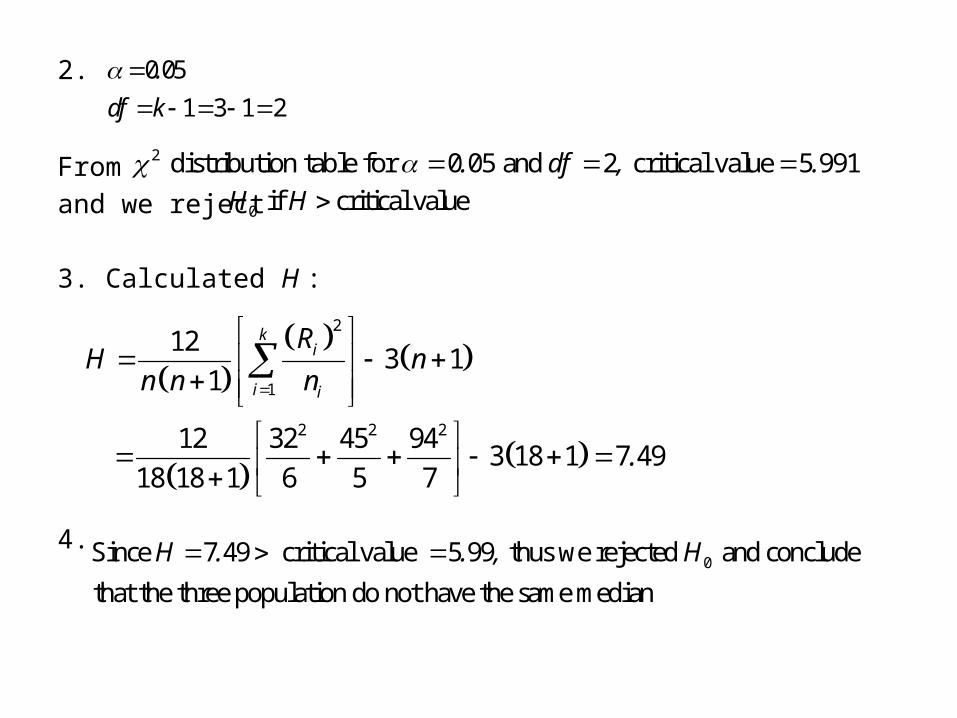
2.
Fromand we reject
3. Calculated H :
4.
0 05
1 3 1 2
.
df k
2 distribution table for 0 05 and 2 critical value 5 991. df , .
0 if critical valueH H
2
1
2 2 2
123 1
1
12 32 45 94 3 18 1 7 49
18 18 1 6 5 7
ki
i i
RH n
n n n
.
0Since 7 49 critical value 5 99 thus we rejected and conclude
that the three population do not have the same median
H . . , H
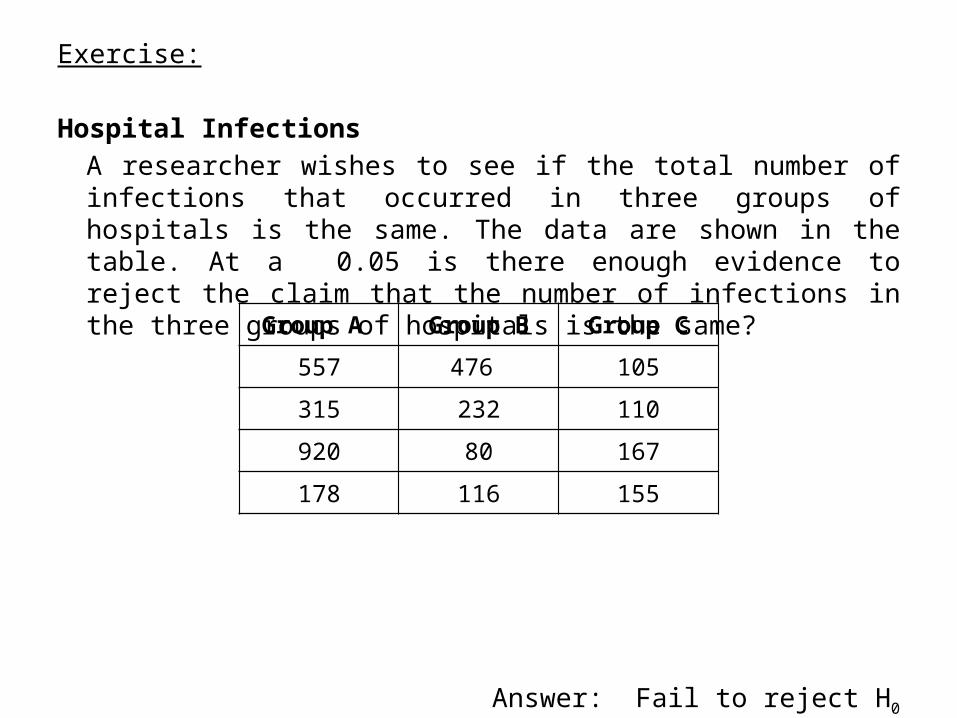
Exercise:
Hospital InfectionsA researcher wishes to see if the total number of infections that occurred in three groups of hospitals is the same. The data are shown in the table. At a 0.05 is there enough evidence to reject the claim that the number of infections in the three groups of hospitals is the same?
Answer: Fail to reject H0
Group A Group B Group C
557 476 105
315 232 110
920 80 167
178 116 155
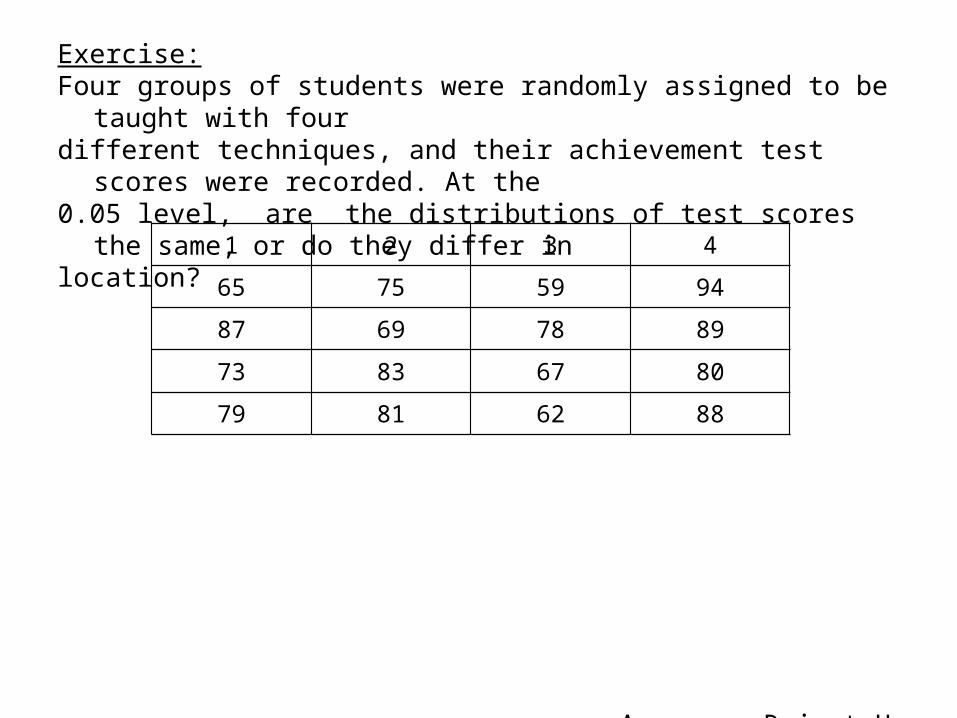
Exercise:Four groups of students were randomly assigned to be taught
with four different techniques, and their achievement test scores were
recorded. At the 0.05 level, are the distributions of test scores the same, or do
they differ in location?
Answer: Reject H0
1 2 3 4
65 75 59 94
87 69 78 89
73 83 67 80
79 81 62 88