Non-parametric Statistics - An Introduction for ... ·...
24
Non-parametric Statistics An Introduction for Experimentalists Sebastian Strasser University of Munich July 13, 2011
-
Upload
nguyendien -
Category
Documents
-
view
231 -
download
0
Transcript of Non-parametric Statistics - An Introduction for ... ·...
Non-parametric StatisticsAn Introduction for Experimentalists
Sebastian Strasser
University of Munich
July 13, 2011

2 Sebastian Strasser Non-parametric Statistics
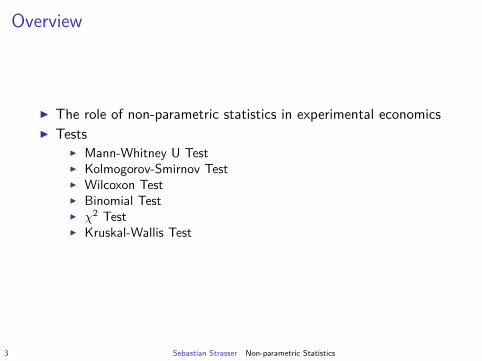
Overview
I The role of non-parametric statistics in experimental economicsI Tests
I Mann-Whitney U TestI Kolmogorov-Smirnov TestI Wilcoxon TestI Binomial TestI χ2 TestI Kruskal-Wallis Test
3 Sebastian Strasser Non-parametric Statistics
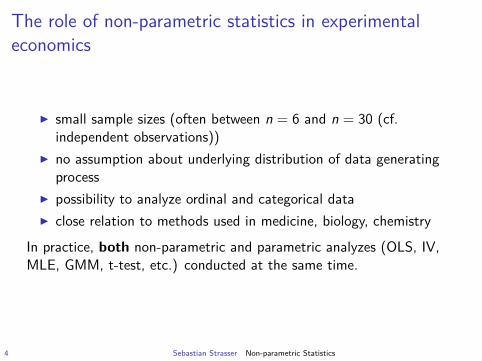
The role of non-parametric statistics in experimentaleconomics
I small sample sizes (often between n = 6 and n = 30 (cf.independent observations))
I no assumption about underlying distribution of data generatingprocess
I possibility to analyze ordinal and categorical dataI close relation to methods used in medicine, biology, chemistry
In practice, both non-parametric and parametric analyzes (OLS, IV,MLE, GMM, t-test, etc.) conducted at the same time.
4 Sebastian Strasser Non-parametric Statistics
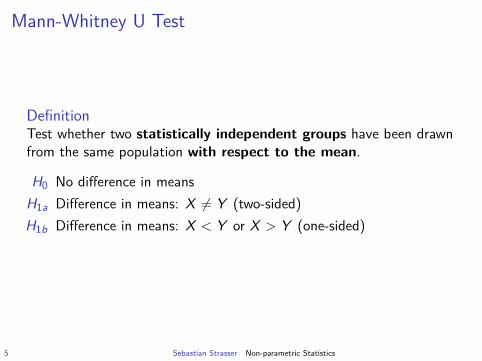
Mann-Whitney U Test
DefinitionTest whether two statistically independent groups have been drawnfrom the same population with respect to the mean.
H0 No difference in meansH1a Difference in means: X 6= Y (two-sided)H1b Difference in means: X < Y or X > Y (one-sided)
5 Sebastian Strasser Non-parametric Statistics
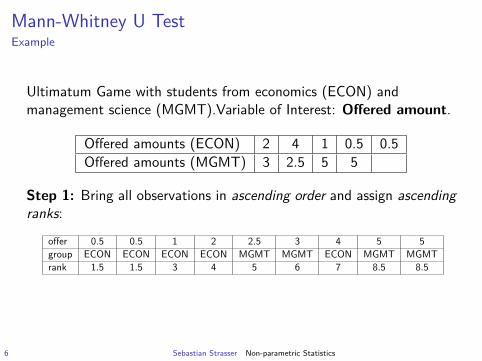
Mann-Whitney U TestExample
Ultimatum Game with students from economics (ECON) andmanagement science (MGMT).Variable of Interest: Offered amount.
Offered amounts (ECON) 2 4 1 0.5 0.5Offered amounts (MGMT) 3 2.5 5 5
Step 1: Bring all observations in ascending order and assign ascendingranks:
offer 0.5 0.5 1 2 2.5 3 4 5 5group ECON ECON ECON ECON MGMT MGMT ECON MGMT MGMTrank 1.5 1.5 3 4 5 6 7 8.5 8.5
6 Sebastian Strasser Non-parametric Statistics
Mann-Whitney U TestExample
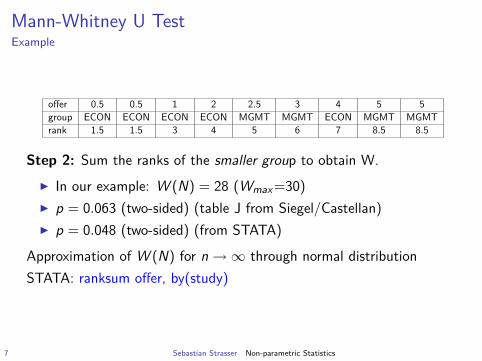
offer 0.5 0.5 1 2 2.5 3 4 5 5group ECON ECON ECON ECON MGMT MGMT ECON MGMT MGMTrank 1.5 1.5 3 4 5 6 7 8.5 8.5
Step 2: Sum the ranks of the smaller group to obtain W.I In our example: W (N) = 28 (Wmax=30)I p = 0.063 (two-sided) (table J from Siegel/Castellan)I p = 0.048 (two-sided) (from STATA)
Approximation of W (N) for n→∞ through normal distributionSTATA: ranksum offer, by(study)
7 Sebastian Strasser Non-parametric Statistics
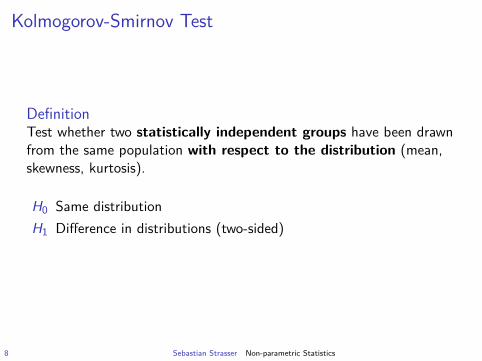
Kolmogorov-Smirnov Test
DefinitionTest whether two statistically independent groups have been drawnfrom the same population with respect to the distribution (mean,skewness, kurtosis).
H0 Same distributionH1 Difference in distributions (two-sided)
8 Sebastian Strasser Non-parametric Statistics
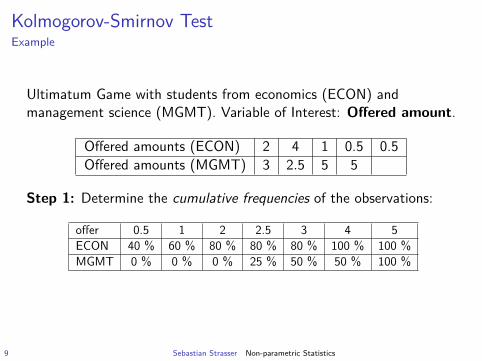
Kolmogorov-Smirnov TestExample
Ultimatum Game with students from economics (ECON) andmanagement science (MGMT). Variable of Interest: Offered amount.
Offered amounts (ECON) 2 4 1 0.5 0.5Offered amounts (MGMT) 3 2.5 5 5
Step 1: Determine the cumulative frequencies of the observations:
offer 0.5 1 2 2.5 3 4 5ECON 40 % 60 % 80 % 80 % 80 % 100 % 100 %MGMT 0 % 0 % 0 % 25 % 50 % 50 % 100 %
9 Sebastian Strasser Non-parametric Statistics
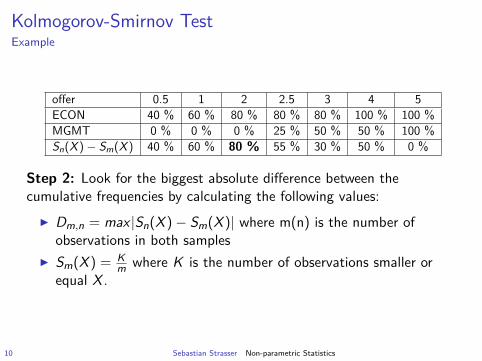
Kolmogorov-Smirnov TestExample
offer 0.5 1 2 2.5 3 4 5ECON 40 % 60 % 80 % 80 % 80 % 100 % 100 %MGMT 0 % 0 % 0 % 25 % 50 % 50 % 100 %Sn(X )− Sm(X ) 40 % 60 % 80 % 55 % 30 % 50 % 0 %
Step 2: Look for the biggest absolute difference between thecumulative frequencies by calculating the following values:
I Dm,n = max |Sn(X )− Sm(X )| where m(n) is the number ofobservations in both samples
I Sm(X ) = Km where K is the number of observations smaller or
equal X .
10 Sebastian Strasser Non-parametric Statistics

Kolmogorov-Smirnov TestExample
offer 0.5 1 2 2.5 3 4 5ECON 40 % 60 % 80 % 80 % 80 % 100 % 100 %MGMT 0 % 0 % 0 % 25 % 50 % 50 % 100 %Sn(X )− Sm(X ) 40 % 60 % 80 % 55 % 30 % 50 % 0 %
The test statistic is then given by m · n · Dm,n = 5 · 4 · 0.8 = 16I p = 0.10 (two-sided) (table LII from Siegel/Castellan)I p = 0.116 (two-sided) (from STATA)
Approximation for n→∞ through χ2 distributionSTATA: ksmirnov offer, by(study)Possibility to test against theoretical distribution
11 Sebastian Strasser Non-parametric Statistics
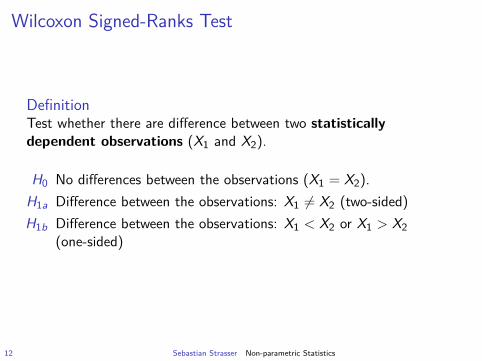
Wilcoxon Signed-Ranks Test
DefinitionTest whether there are difference between two statisticallydependent observations (X1 and X2).
H0 No differences between the observations (X1 = X2).H1a Difference between the observations: X1 6= X2 (two-sided)H1b Difference between the observations: X1 < X2 or X1 > X2
(one-sided)
12 Sebastian Strasser Non-parametric Statistics
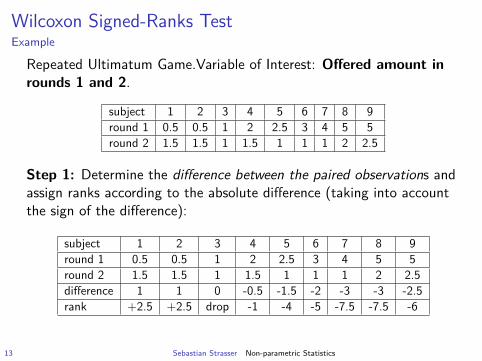
Wilcoxon Signed-Ranks TestExample
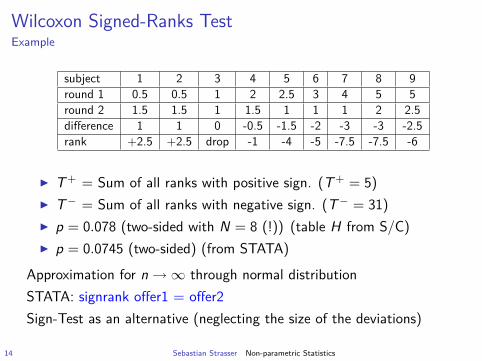
Repeated Ultimatum Game.Variable of Interest: Offered amount inrounds 1 and 2.
subject 1 2 3 4 5 6 7 8 9round 1 0.5 0.5 1 2 2.5 3 4 5 5round 2 1.5 1.5 1 1.5 1 1 1 2 2.5
Step 1: Determine the difference between the paired observations andassign ranks according to the absolute difference (taking into accountthe sign of the difference):
subject 1 2 3 4 5 6 7 8 9round 1 0.5 0.5 1 2 2.5 3 4 5 5round 2 1.5 1.5 1 1.5 1 1 1 2 2.5difference 1 1 0 -0.5 -1.5 -2 -3 -3 -2.5rank +2.5 +2.5 drop -1 -4 -5 -7.5 -7.5 -6
13 Sebastian Strasser Non-parametric Statistics
Wilcoxon Signed-Ranks TestExample
subject 1 2 3 4 5 6 7 8 9round 1 0.5 0.5 1 2 2.5 3 4 5 5round 2 1.5 1.5 1 1.5 1 1 1 2 2.5difference 1 1 0 -0.5 -1.5 -2 -3 -3 -2.5rank +2.5 +2.5 drop -1 -4 -5 -7.5 -7.5 -6
I T+ = Sum of all ranks with positive sign. (T+ = 5)I T− = Sum of all ranks with negative sign. (T− = 31)I p = 0.078 (two-sided with N = 8 (!)) (table H from S/C)I p = 0.0745 (two-sided) (from STATA)
Approximation for n→∞ through normal distributionSTATA: signrank offer1 = offer2Sign-Test as an alternative (neglecting the size of the deviations)
14 Sebastian Strasser Non-parametric Statistics
Binomial Test
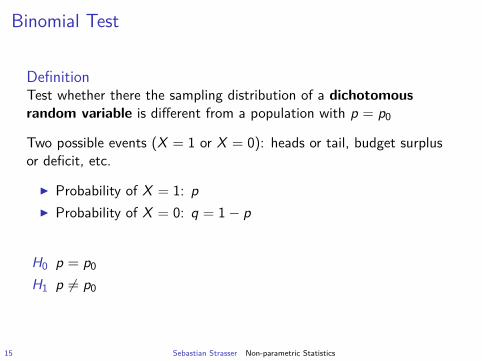
DefinitionTest whether there the sampling distribution of a dichotomousrandom variable is different from a population with p = p0
Two possible events (X = 1 or X = 0): heads or tail, budget surplusor deficit, etc.
I Probability of X = 1: pI Probability of X = 0: q = 1− p
H0 p = p0
H1 p 6= p0
15 Sebastian Strasser Non-parametric Statistics
Binomial TestExample
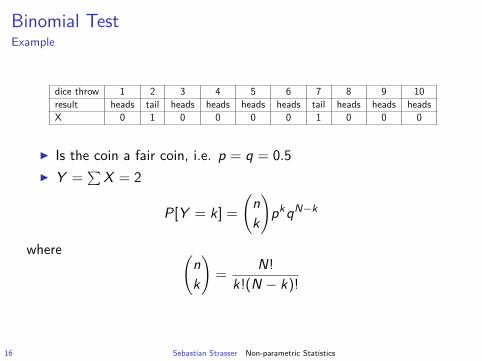
dice throw 1 2 3 4 5 6 7 8 9 10result heads tail heads heads heads heads tail heads heads headsX 0 1 0 0 0 0 1 0 0 0
I Is the coin a fair coin, i.e. p = q = 0.5I Y =
∑X = 2
P[Y = k] =
(nk
)pkqN−k
where (nk
)=
N!
k!(N − k)!
16 Sebastian Strasser Non-parametric Statistics
Binomial TestExample
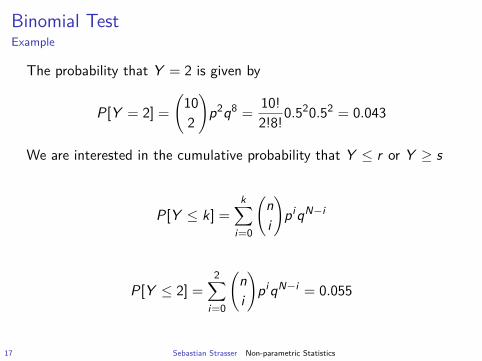
The probability that Y = 2 is given by
P[Y = 2] =
(102
)p2q8 =
10!2!8!0.5
20.52 = 0.043
We are interested in the cumulative probability that Y ≤ r or Y ≥ s
P[Y ≤ k] =k∑
i=0
(ni
)piqN−i
P[Y ≤ 2] =2∑
i=0
(ni
)piqN−i = 0.055
17 Sebastian Strasser Non-parametric Statistics

Binomial TestAnother Example
Systematic deviations of actual expenses from budget for R&D:
I 12 out of 32 negativeI p = 0.2153 hence not able to reject H0I STATA: bitest deviation==0.5
18 Sebastian Strasser Non-parametric Statistics
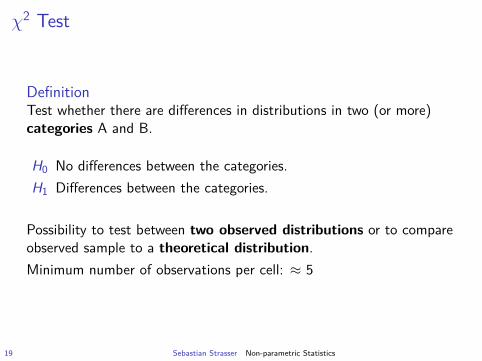
χ2 Test
DefinitionTest whether there are differences in distributions in two (or more)categories A and B.
H0 No differences between the categories.H1 Differences between the categories.
Possibility to test between two observed distributions or to compareobserved sample to a theoretical distribution.Minimum number of observations per cell: ≈ 5
19 Sebastian Strasser Non-parametric Statistics
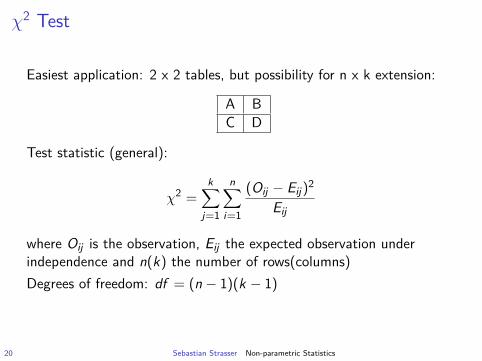
χ2 Test
Easiest application: 2 x 2 tables, but possibility for n x k extension:
A BC D
Test statistic (general):
χ2 =k∑
j=1
n∑i=1
(Oij − Eij)2
Eij
where Oij is the observation, Eij the expected observation underindependence and n(k) the number of rows(columns)Degrees of freedom: df = (n − 1)(k − 1)
20 Sebastian Strasser Non-parametric Statistics
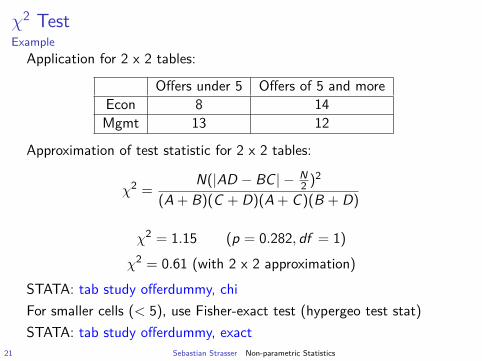
χ2 TestExample
Application for 2 x 2 tables:
Offers under 5 Offers of 5 and moreEcon 8 14Mgmt 13 12
Approximation of test statistic for 2 x 2 tables:
χ2 =N(|AD − BC | − N
2 )2
(A + B)(C + D)(A + C)(B + D)
χ2 = 1.15 (p = 0.282, df = 1)
χ2 = 0.61 (with 2 x 2 approximation)
STATA: tab study offerdummy, chiFor smaller cells (< 5), use Fisher-exact test (hypergeo test stat)STATA: tab study offerdummy, exact
21 Sebastian Strasser Non-parametric Statistics
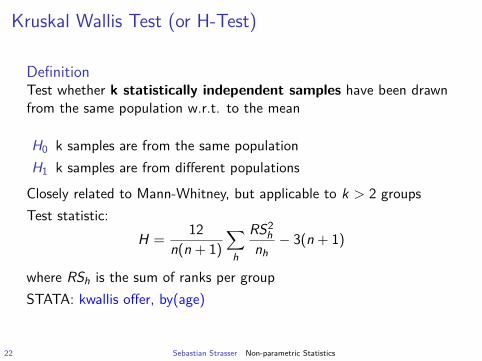
Kruskal Wallis Test (or H-Test)
DefinitionTest whether k statistically independent samples have been drawnfrom the same population w.r.t. to the mean
H0 k samples are from the same populationH1 k samples are from different populations
Closely related to Mann-Whitney, but applicable to k > 2 groupsTest statistic:
H =12
n(n + 1)∑
h
RS2h
nh− 3(n + 1)
where RSh is the sum of ranks per groupSTATA: kwallis offer, by(age)
22 Sebastian Strasser Non-parametric Statistics
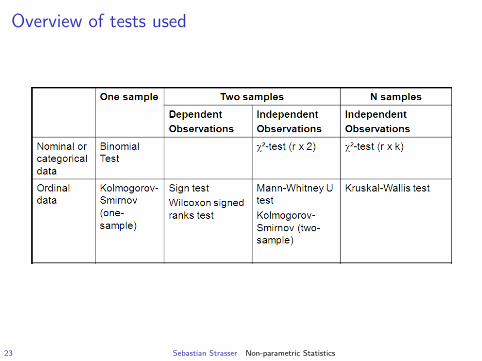
Overview of tests used
23 Sebastian Strasser Non-parametric Statistics
24 Sebastian Strasser Non-parametric Statistics