Nolwenn Le Gall 1 , Michel Pichavant 1 1 ISTO/CNRS, Orléans, France VUELCO conference Barcelona
20
Nolwenn Le Gall 1 , Michel Pichavant 1 1 ISTO/CNRS, Orléans, France VUELCO conference Barcelona
description
Bubble nucleation in H 2 O-CO 2 - bearing basaltic melts: results of high temperature decompression experiments. Nolwenn Le Gall 1 , Michel Pichavant 1 1 ISTO/CNRS, Orléans, France VUELCO conference Barcelona. Degassing of basaltic magmas ( Task 4.1). Δ P hn. - PowerPoint PPT Presentation
Transcript of Nolwenn Le Gall 1 , Michel Pichavant 1 1 ISTO/CNRS, Orléans, France VUELCO conference Barcelona
Nolwenn Le Gall1, Michel Pichavant1
1ISTO/CNRS, Orléans, France
VUELCO conference Barcelona
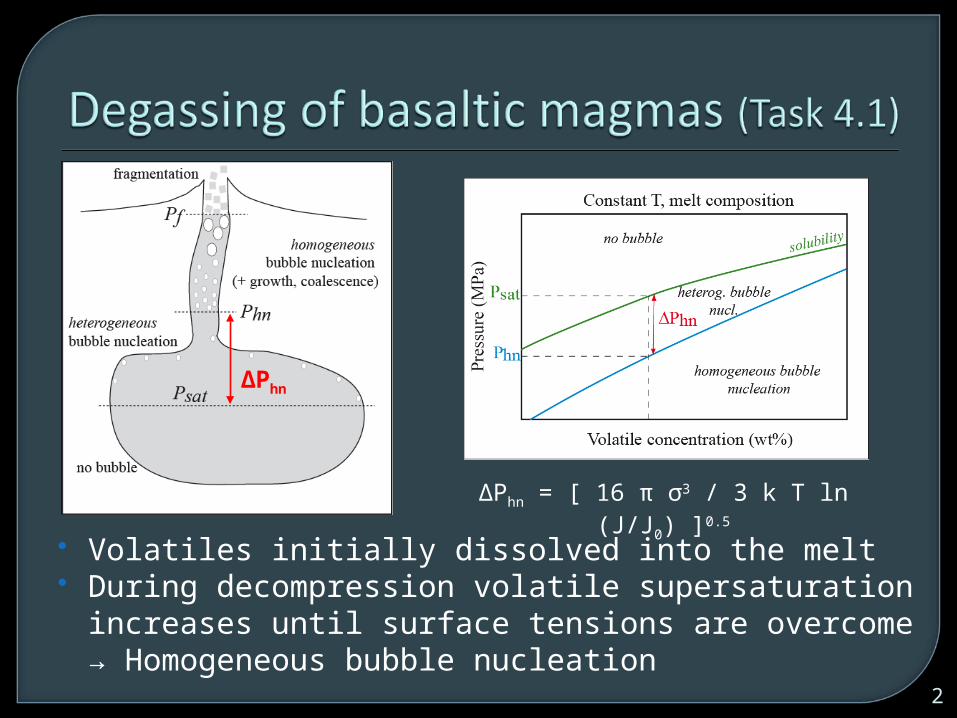
Volatiles initially dissolved into the melt During decompression volatile supersaturation increases until
surface tensions are overcome → Homogeneous bubble nucleation
2
ΔPhn
ΔPhn = [ 16 π σ3 / 3 k T ln (J/J0) ]0.5
3
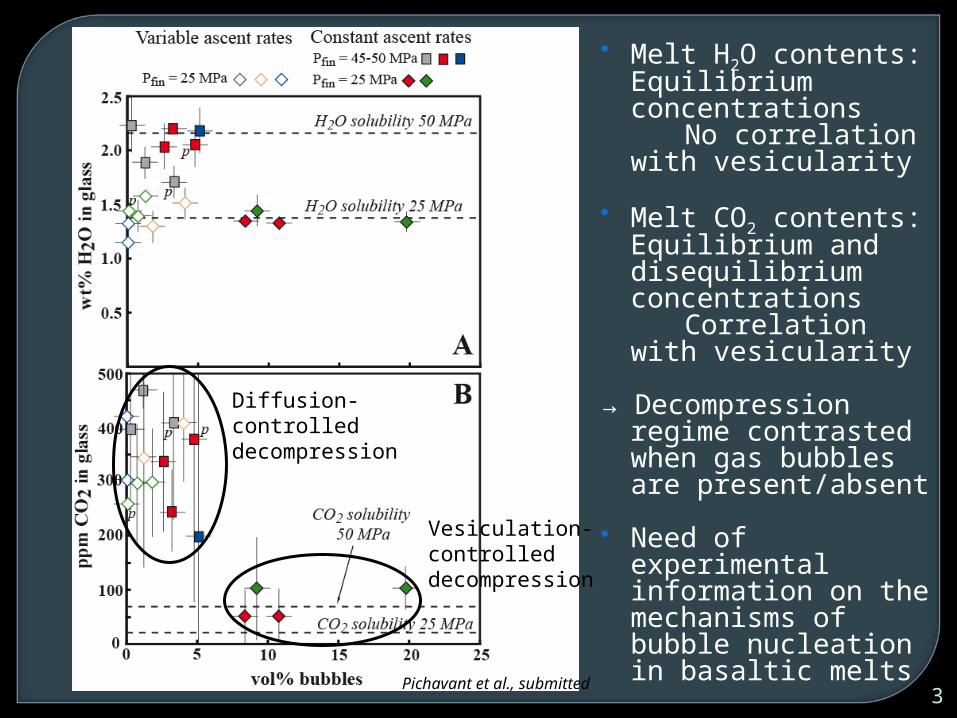
Melt H2O contents: Equilibrium concentrations
No correlation with vesicularity
Melt CO2 contents: Equilibrium and disequilibrium concentrations
Correlation with vesicularity
→ Decompression regime contrasted when gas bubbles are present/absent
Need of experimental information on the mechanisms of bubble nucleation in basaltic melts
Diffusion-controlled decompression
Vesiculation-controlled decompression
Pichavant et al., submitted
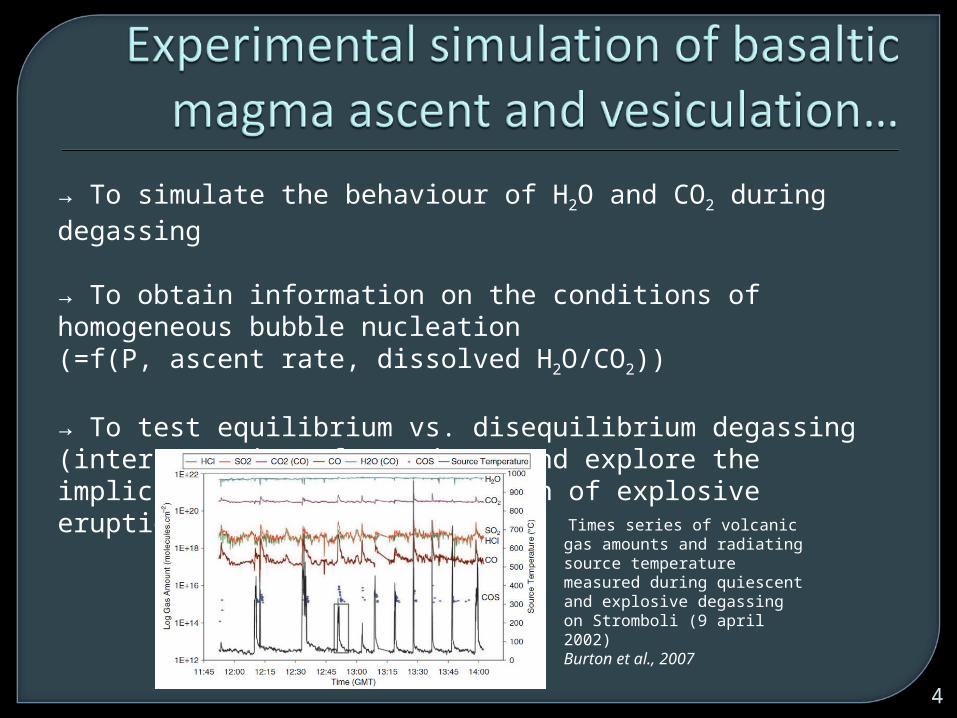
→ To simulate the behaviour of H2O and CO2 during degassing
→ To obtain information on the conditions of homogeneous bubble nucleation (=f(P, ascent rate, dissolved H2O/CO2))
→ To test equilibrium vs. disequilibrium degassing (interpretation of gas data) and explore the implications for the generation of explosive eruptions
4
Times series of volcanic gas amounts and radiating source temperature measured during quiescent and explosive degassing on Stromboli (9 april 2002) Burton et al., 2007
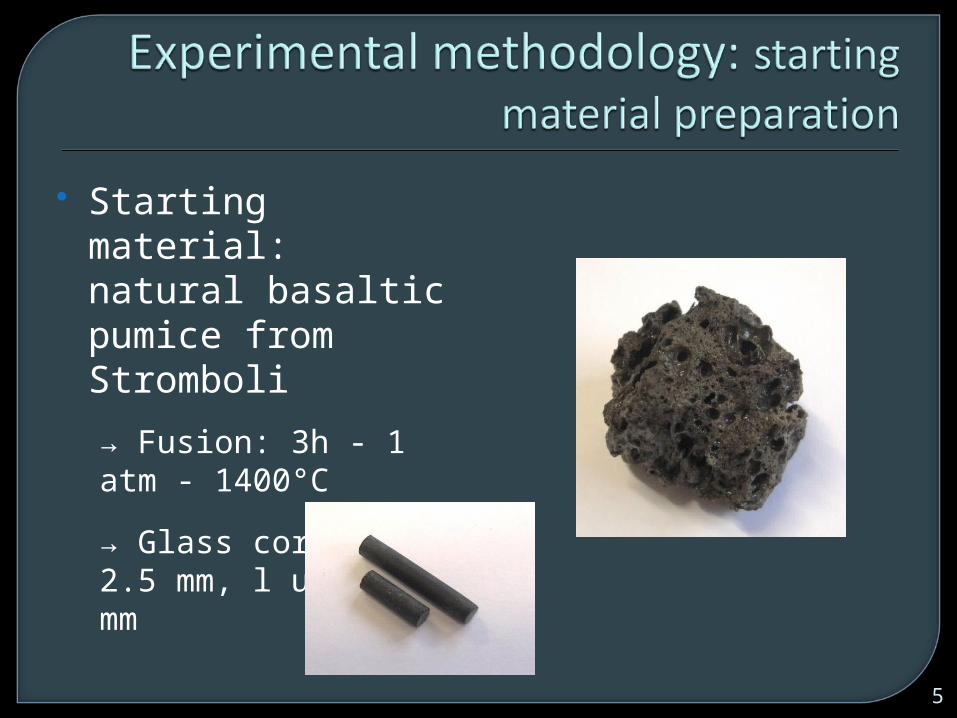
Starting material: natural basaltic pumice from Stromboli
→ Fusion: 3h - 1 atm - 1400°C
→ Glass coring: ø 2.5 mm, l up to 10 mm
5
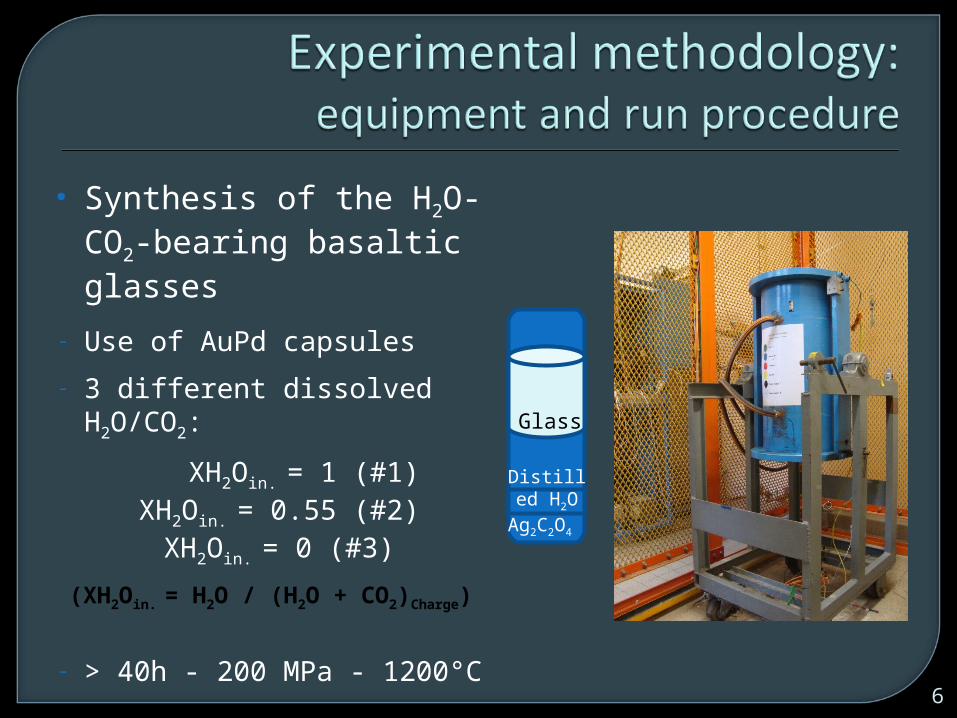
Synthesis of the H2O-CO2-bearing basaltic glasses
- Use of AuPd capsules
- 3 different dissolved H2O/CO2:
XH2Oin. = 1 (#1) XH2Oin. = 0.55 (#2)
XH2Oin. = 0 (#3)
(XH2Oin. = H2O / (H2O + CO2)Charge)
- > 40h - 200 MPa - 1200°C 6
Glass
Distilled H2O
Ag2C2O4
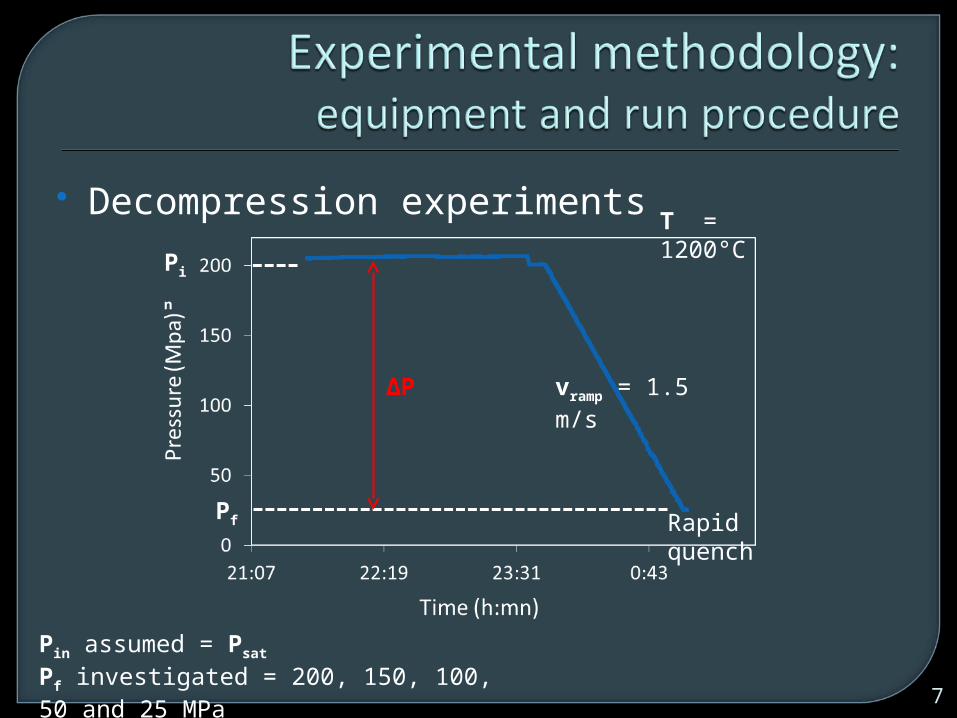
Decompression experimentsT = 1200°C
Pin
Pin assumed = Psat
Pf investigated = 200, 150, 100, 50 and 25 MPa
vramp = 1.5 m/s
Rapid quench
7
Pf
∆P
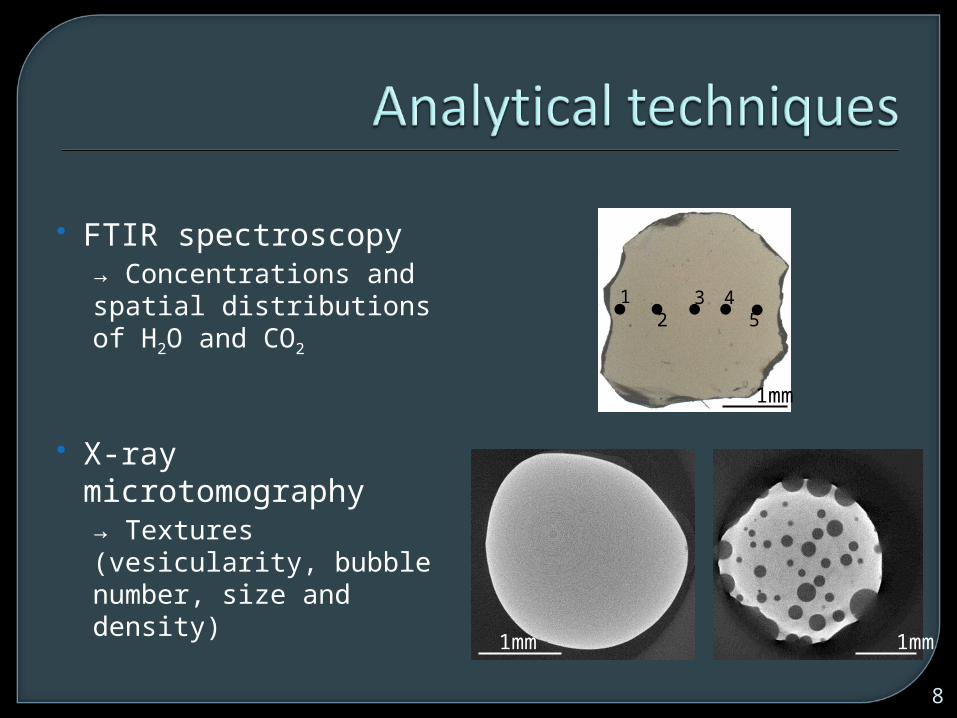
FTIR spectroscopy→ Concentrations and spatial distributions of H2O and CO2
X-ray microtomography→ Textures (vesicularity, bubble number, size and density)
8
1mm 1mm
1 2 3 4 5
1mm
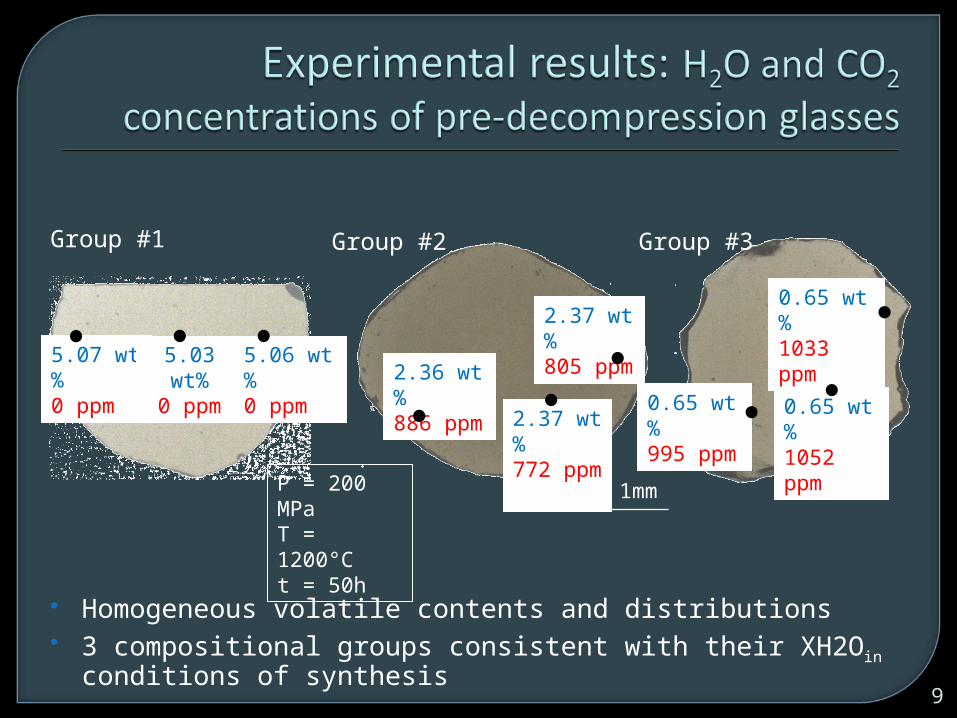
Homogeneous volatile contents and distributions 3 compositional groups consistent with their XH2Oin conditions of synthesis
5.07 wt%0 ppm
5.03 wt%0 ppm
5.06 wt%0 ppm 2.36 wt%
886 ppm2.37 wt%772 ppm
2.37 wt%805 ppm
0.65 wt%1033 ppm
0.65 wt%995 ppm
0.65 wt%1052 ppm
Group #1 Group #2 Group #3
1mmP = 200 MPaT = 1200°Ct = 50h
9
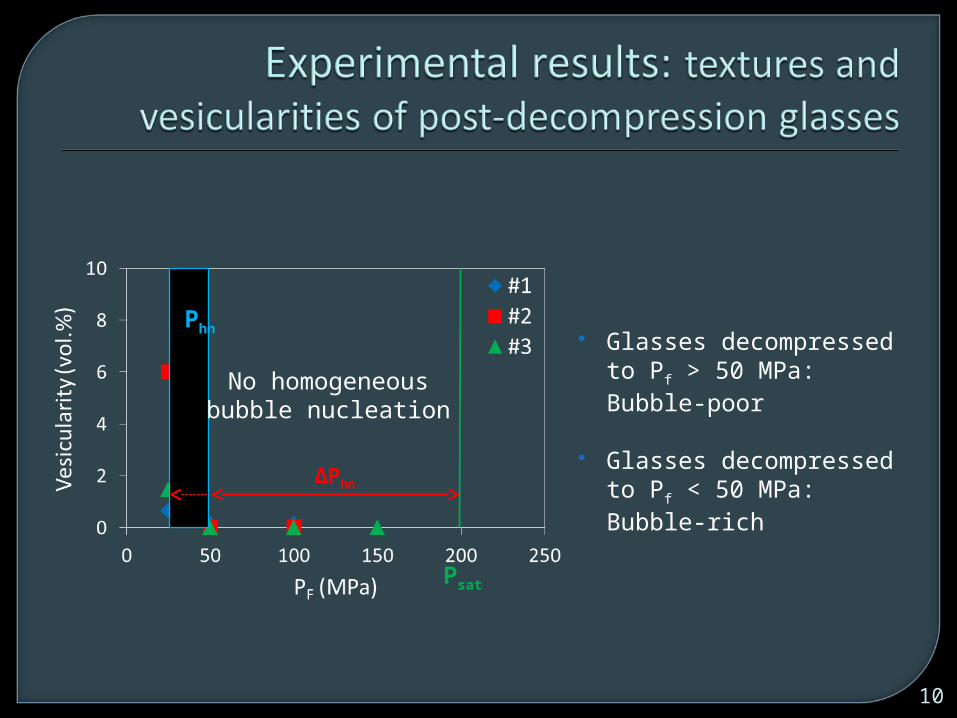
Glasses decompressed to Pf > 50 MPa: Bubble-poor
Glasses decompressed to Pf < 50 MPa: Bubble-rich
Phn
No homogeneous bubble nucleation
10
ΔPhn
Psat
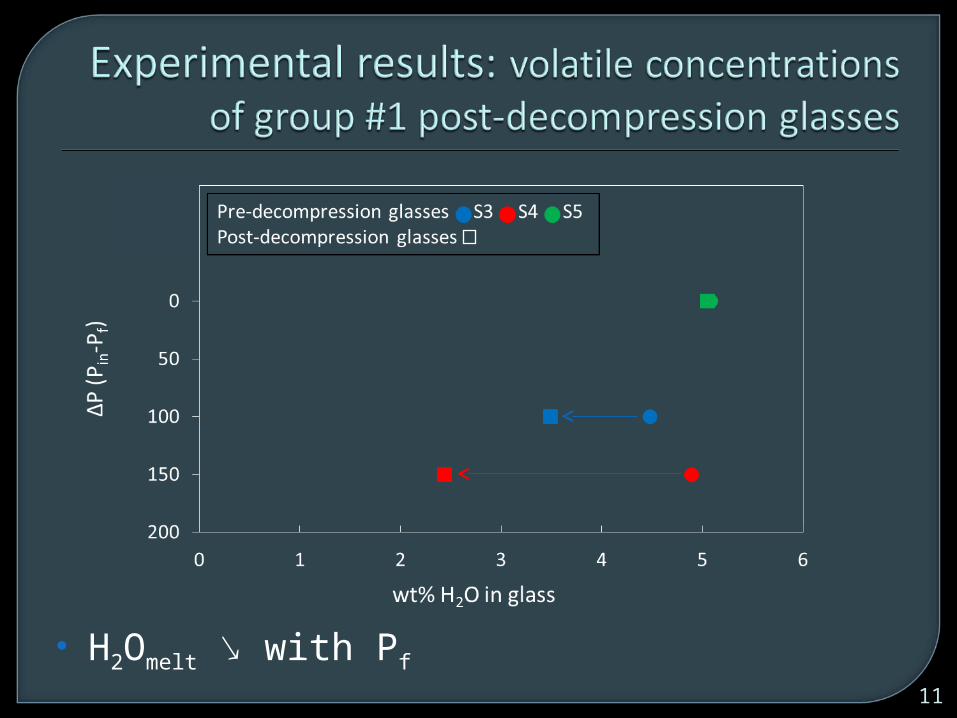
H2Omelt ↘ with Pf
11
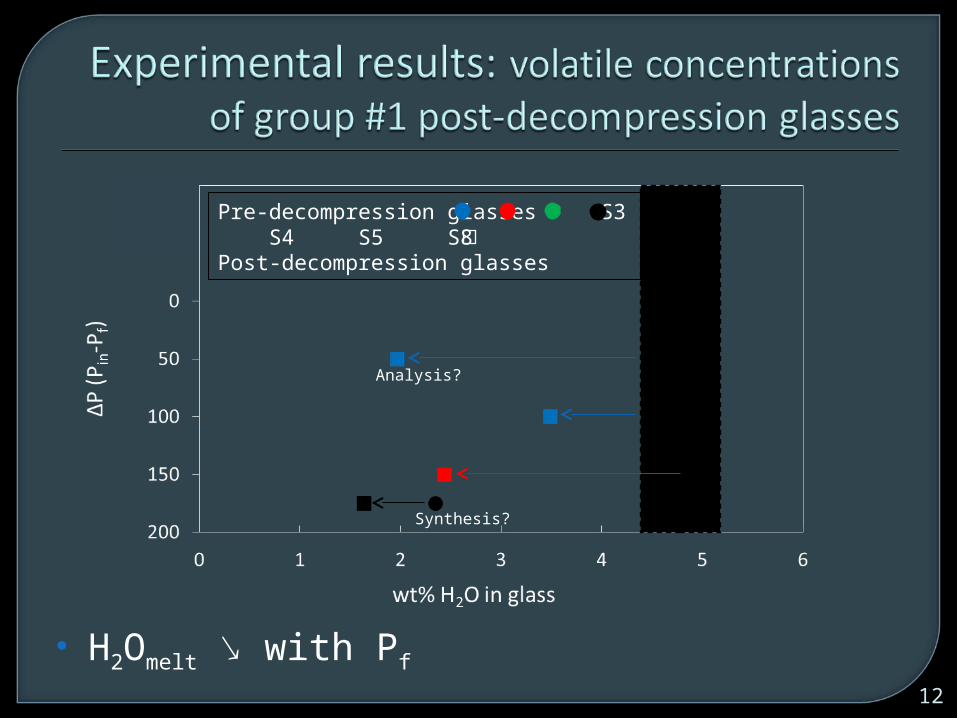
H2Omelt ↘ with Pf
12
Pre-decompression glasses S3 S4 S5 S8Post-decompression glasses
Analysis?
Synthesis?
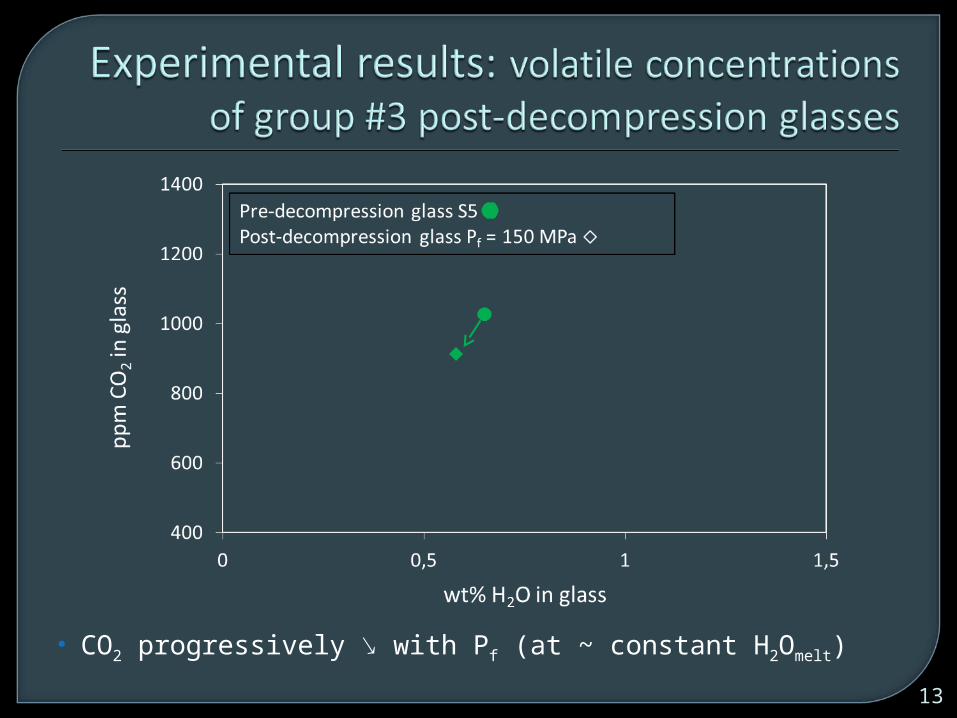
CO2 progressively ↘ with Pf (at ~ constant H2Omelt)13
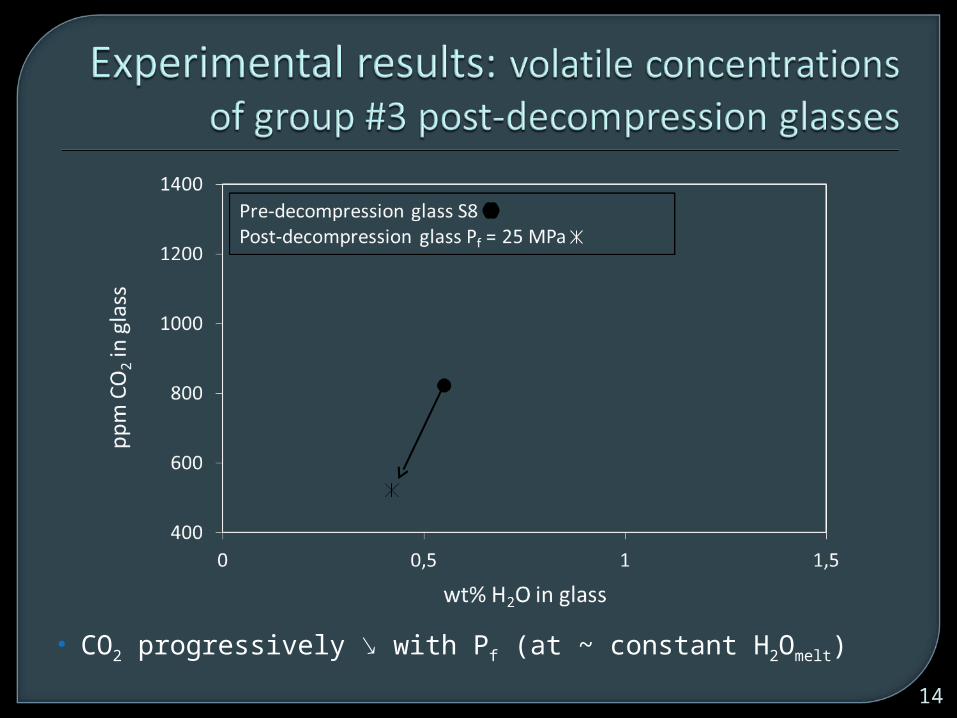
CO2 progressively ↘ with Pf (at ~ constant H2Omelt)14
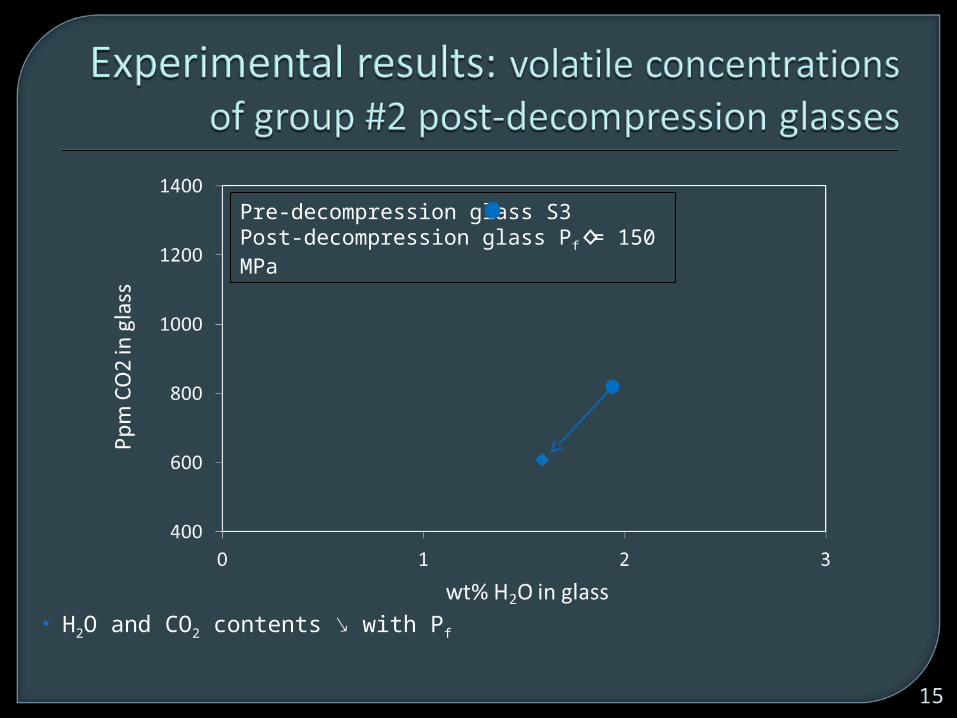
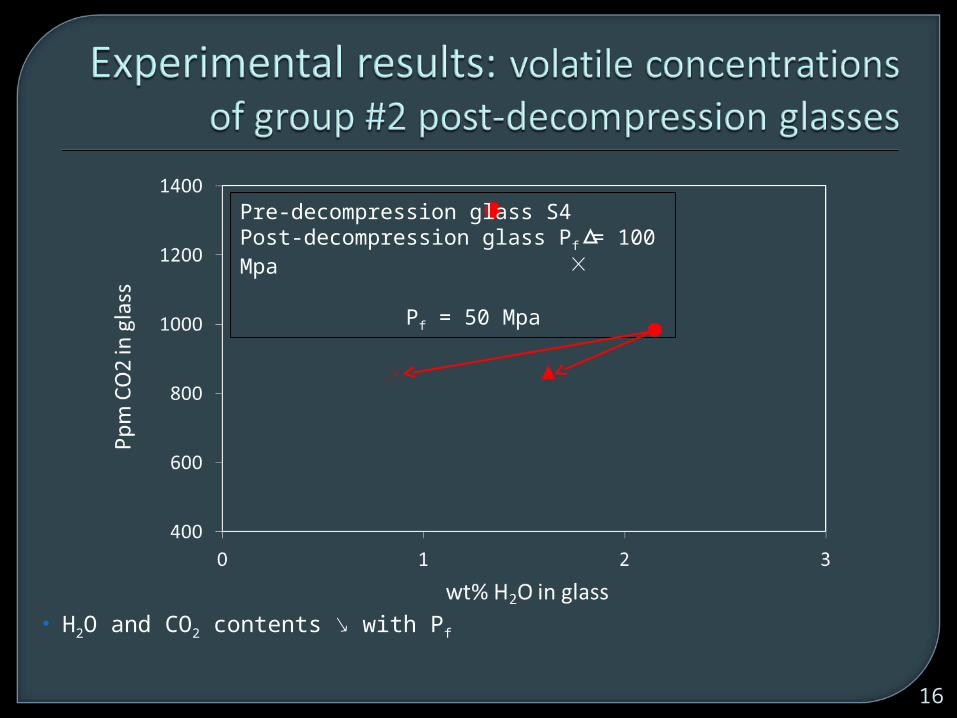
H2O and CO2 contents ↘ with Pf
15
Pre-decompression glass S3 Post-decompression glass Pf = 150 MPa
H2O and CO2 contents ↘ with Pf
16
Pre-decompression glass S4 Post-decompression glass Pf = 100 Mpa Pf = 50 Mpa
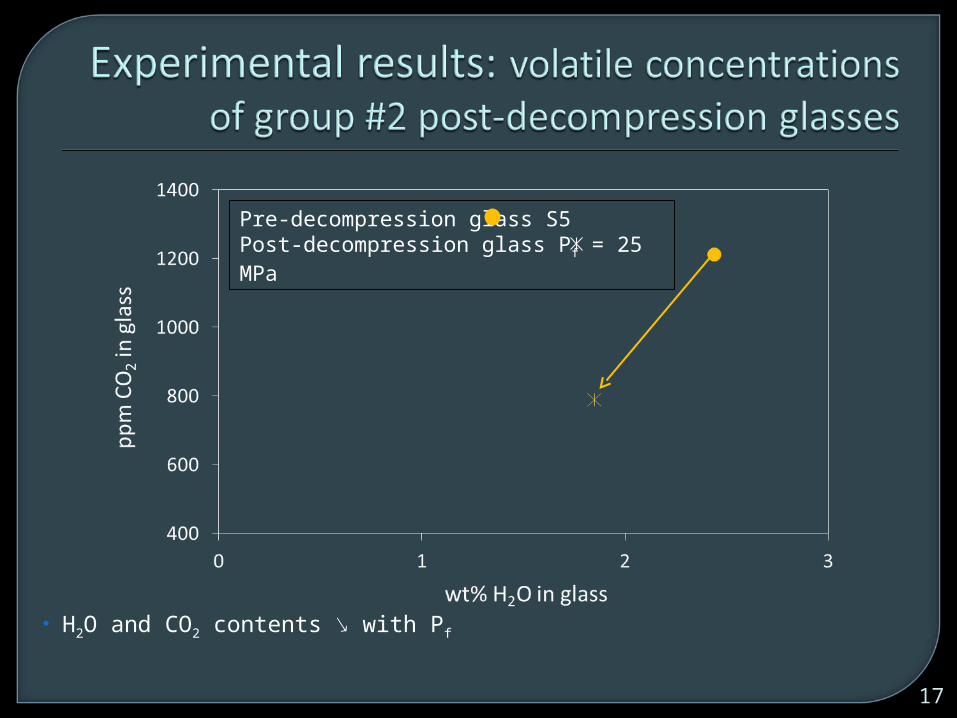
Pre-decompression glass S5 Post-decompression glass Pf = 25 MPa
H2O and CO2 contents ↘ with Pf
17
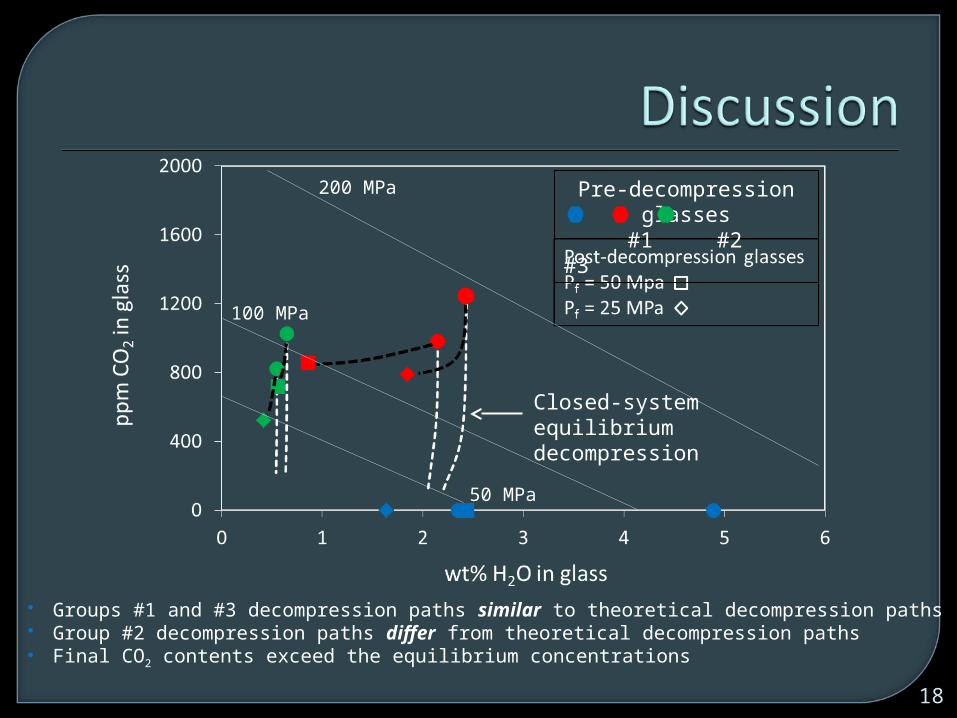
Groups #1 and #3 decompression paths similar to theoretical decompression paths Group #2 decompression paths differ from theoretical decompression paths Final CO2 contents exceed the equilibrium concentrations
18
Pre-decompression glasses #1 #2 #3
Closed-system equilibrium decompression
200 MPa
100 MPa
50 MPa
Homogeneous bubble nucleation occurs between 50 and 25 MPa → Large supersaturations are required: ∆Phn = 150 - 175 MPa
Both equilibrium and disequilibrium decompression paths can be obtained
Final glass compositions can be CO2 supersaturated
19
20