Nokia Mobile Telecommunications ΑΔΑΜ ΚΟΣΜΑΣ ΜΑΙΟΣ 2002.
39
Nokia Nokia Mobile Telecommunications Mobile Telecommunications ΑΔΑΜ ΚΟΣΜΑΣ ΑΔΑΜ ΚΟΣΜΑΣ ΜΑΙΟΣ 2002 ΜΑΙΟΣ 2002
-
Upload
eugenia-wilkins -
Category
Documents
-
view
222 -
download
2
Transcript of Nokia Mobile Telecommunications ΑΔΑΜ ΚΟΣΜΑΣ ΜΑΙΟΣ 2002.
Nokia Nokia Mobile TelecommunicationsMobile Telecommunications
ΑΔΑΜ ΚΟΣΜΑΣΑΔΑΜ ΚΟΣΜΑΣΜΑΙΟΣ 2002ΜΑΙΟΣ 2002
STRATEGY DESIGN
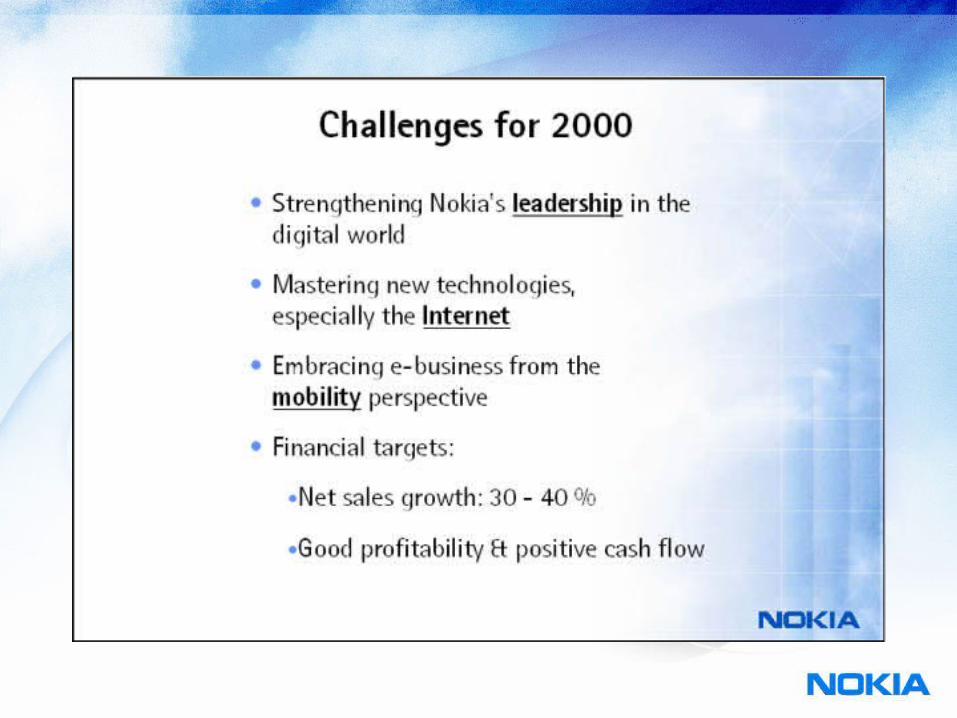
• VISION/STRATEGIC INTENT
• INTERNAL ANALYSIS
• EXTERNAL ANALYSIS
• IMPLEMENTATION

RELATED DIVERSIFICATION(1)
• OLD CORPORATE STRATEGY– GRADUAL CHANGE OF PRODUCTION
LINE TO RELATIVE BRANCHES• OLD PRODUCTION LINE
– CABLES PAPER WOOD– CABLE FACTORY DIVERSIFICATION TO
ELECTRONICS– ‘90s FOCUS IN TELECOM
RELATED DIVERSIFICATION(2)
• Old branch were profitable
• Diversification relied on old branches profits
• Trial and error procedure– Electronic branch became profitable in ‘80s– Focus on telecom due to low profits of
electronic branch.
RELATED DIVERSIFICATION(3)
• In 90s Nokia withdraws from paper and cable production
• Inter-organisational co-operations
• Acquisitions(domestic market firstly)
RELATED DIVERSIFICATION(4)
• Two strange key factors of success– public telecom operator– NMT
• Big and advanced market
• Offered business opportunities
• Head start for competitors
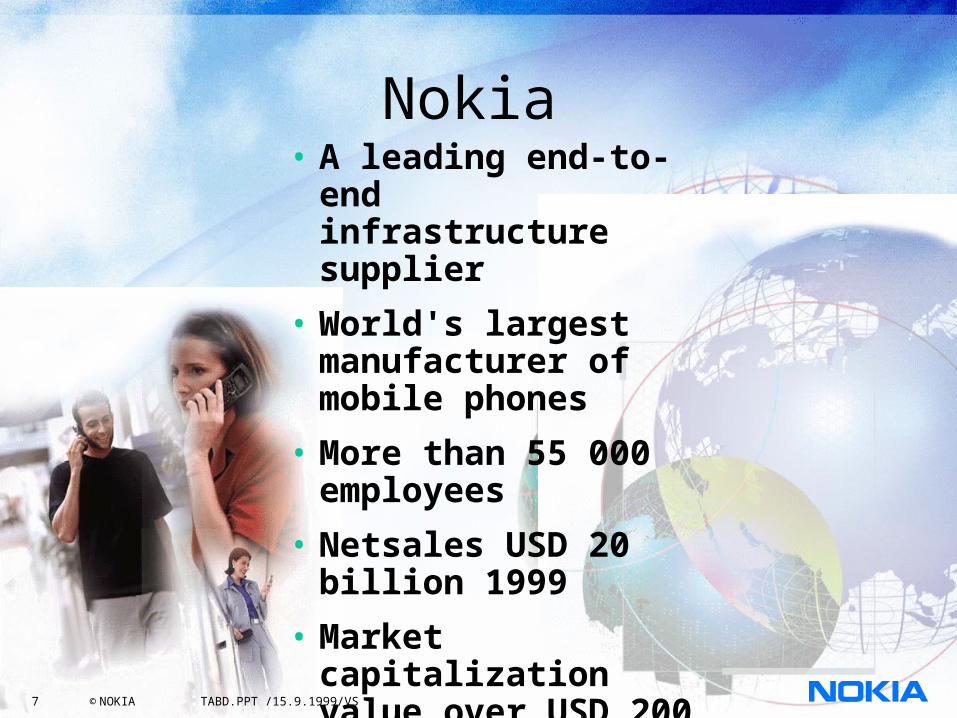
Nokia • A leading end-to-end
infrastructure supplier
• World's largest manufacturer of mobile phones
• More than 55 000 employees
• Netsales USD 20 billion 1999
• Market capitalization value over USD 200 billion
7 © NOKIA TABD.PPT /15.9.1999/VS
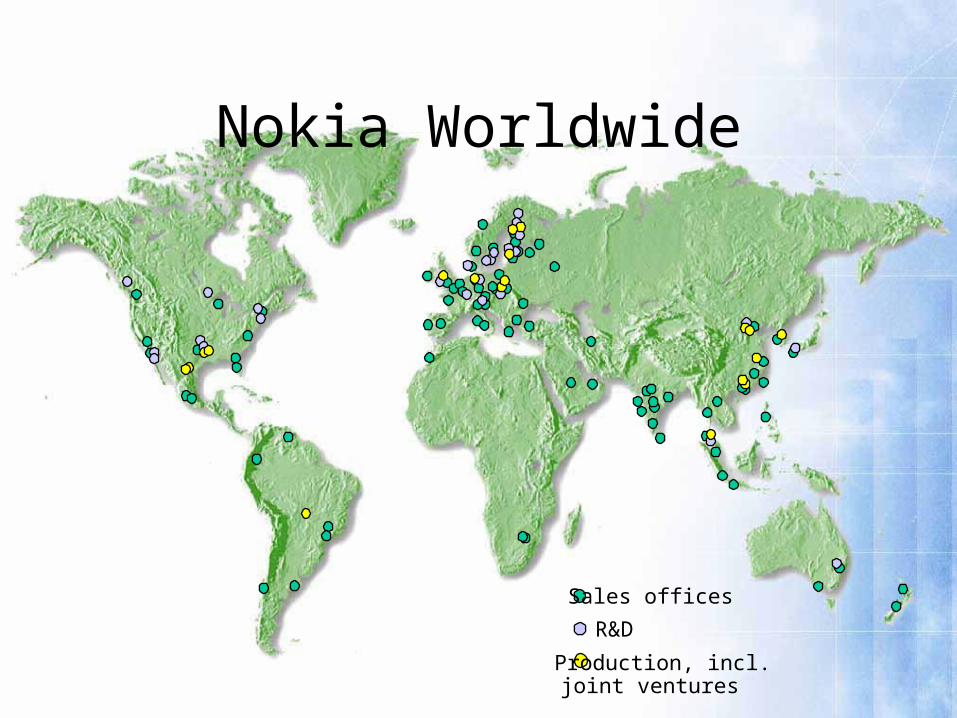
Sales offices
R&D
Production, incl. joint ventures
Nokia Worldwide
NOKIA GROUP BRANCHES
• NOKIA MOBILE PHONES
•NOKIA TELECOMMUNICATIONS
•NOKIA VENTURE
STRATEGIC VISION
• VISION’S DESCRIPTION IS SORT – “CONNECTING PEOPLE”
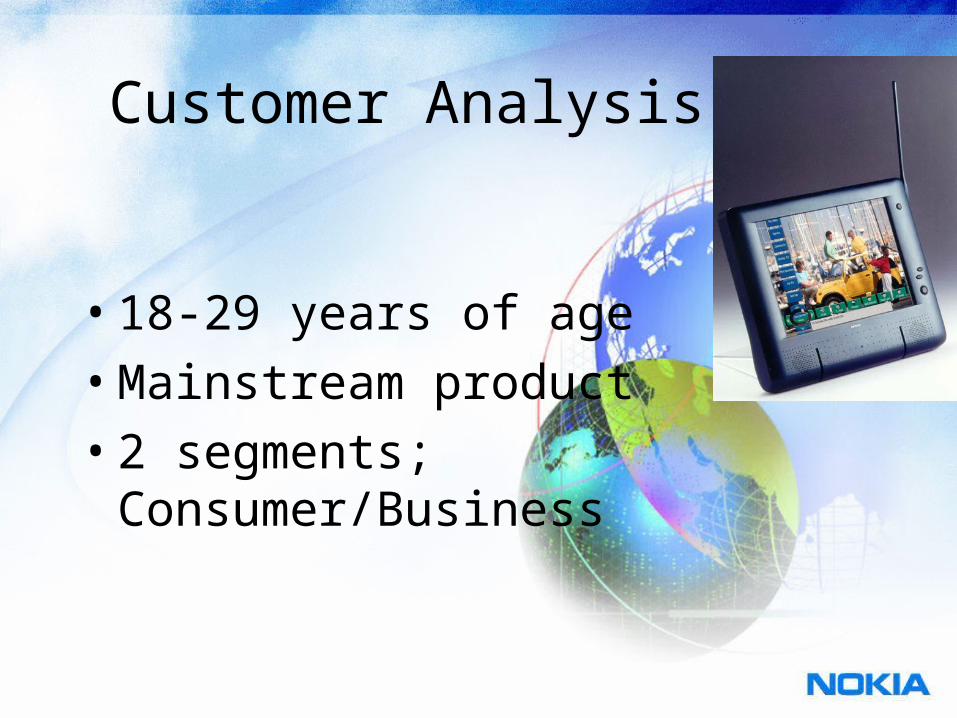
Customer Analysis
• 18-29 years of age
• Mainstream product
• 2 segments; Consumer/Business
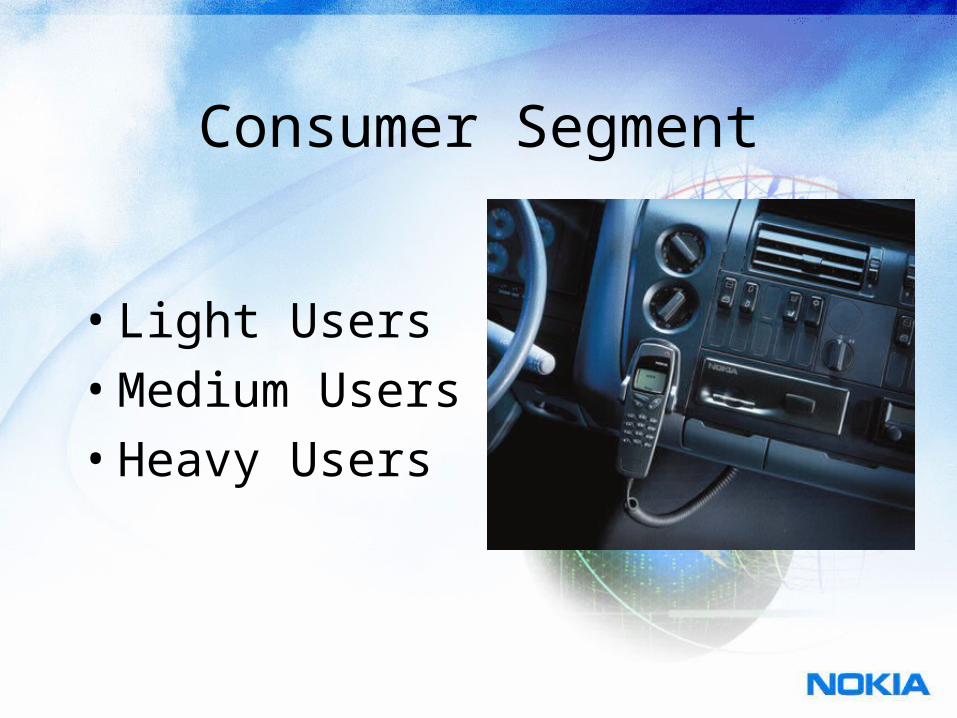
Consumer Segment
• Light Users
• Medium Users
• Heavy Users
Buying Behavior
• Light/Medium users– Price– Low information search– Package deals
• Heavy users– Functional & Psychological reasons– High information search
Business Segment
• Functional motive– Battery life, capabilities, etc.
• Buyers; Company or individual employees– Criteria
• Employees; capabilities, brand• Company; price, capabilities, provider deals
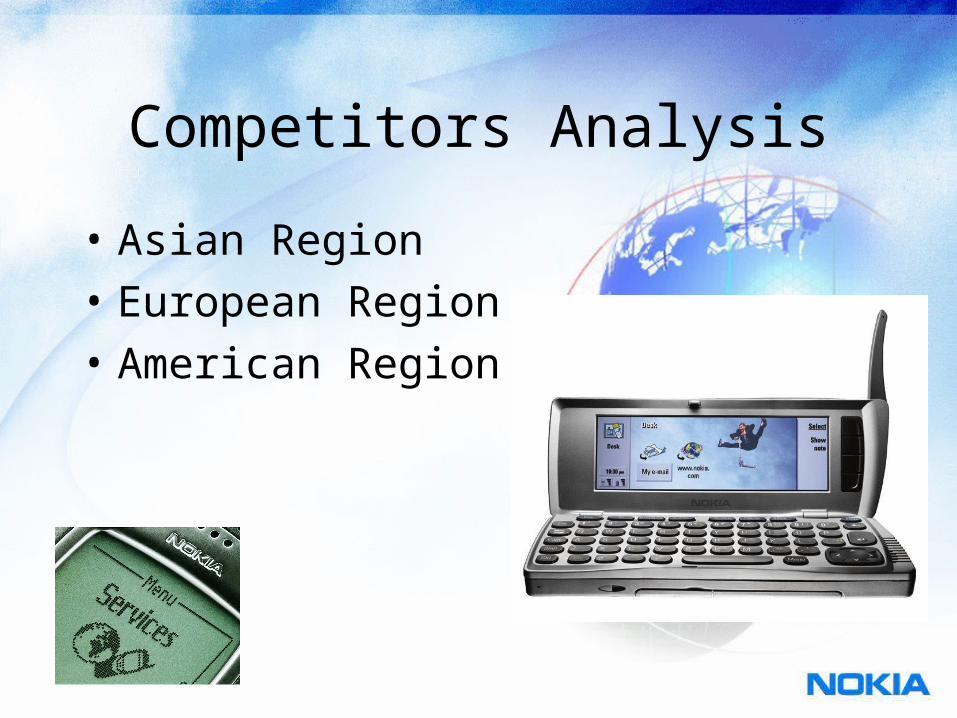
Competitors Analysis
• Asian Region
• European Region
• American Region
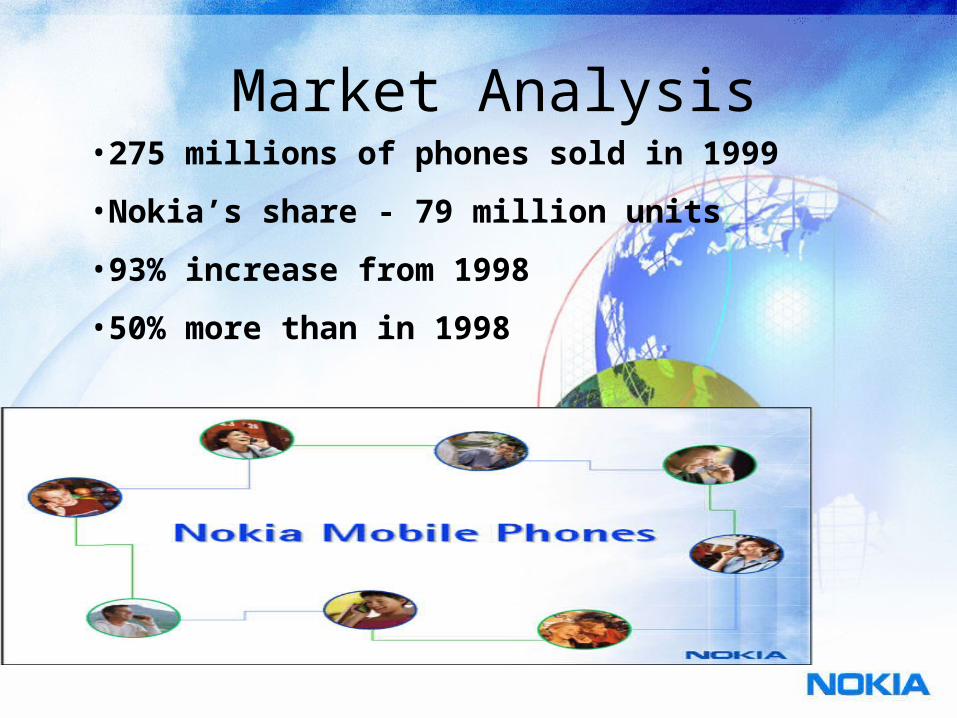
Market Analysis•275 millions of phones sold in 1999
•Nokia’s share - 79 million units
•93% increase from 1998
•50% more than in 1998
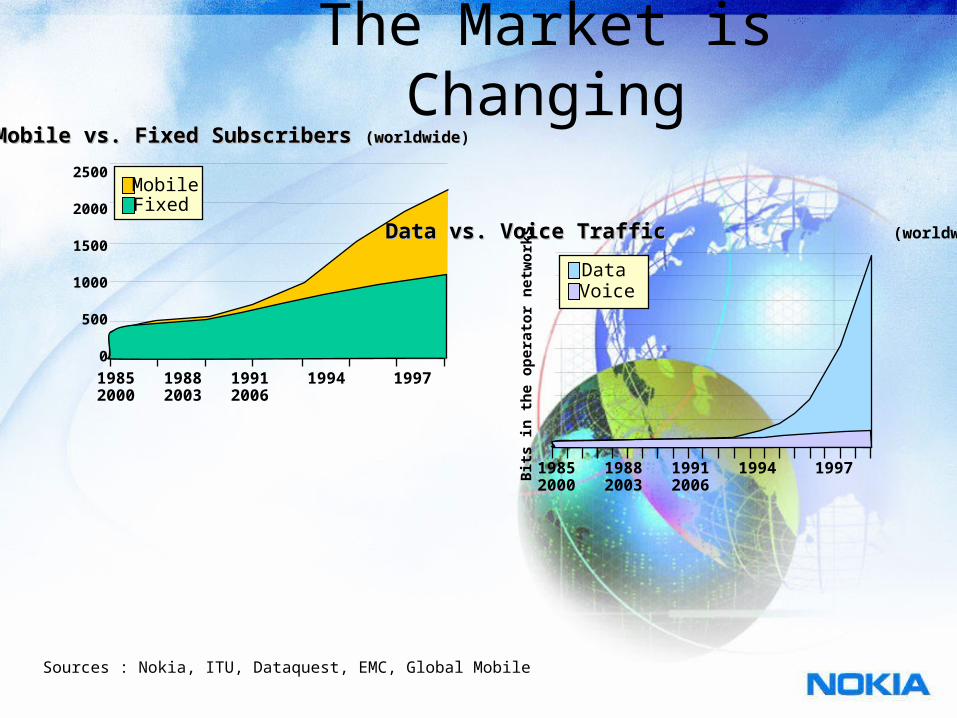
The Market is Changing
Sources : Nokia, ITU, Dataquest, EMC, Global Mobile
2500
2000
1500
1000
500
0
1985 1988 1991 1994 1997 2000 2003 2006
Mobile vs. Fixed Subscribers Mobile vs. Fixed Subscribers (worldwide(worldwide)
FixedMobile
Data vs. Voice TrafficData vs. Voice Traffic (worldwide)
Bi t
s in
th
e op
era t
or n
e tw
o rk
s
1985 1988 1991 1994 1997 2000 2003 2006
VoiceData
Millions
1996 1997 1998 1999 2000 2001 2002 2003 2004 2005
1,400
1,200
1,000
800
600
400
200
0
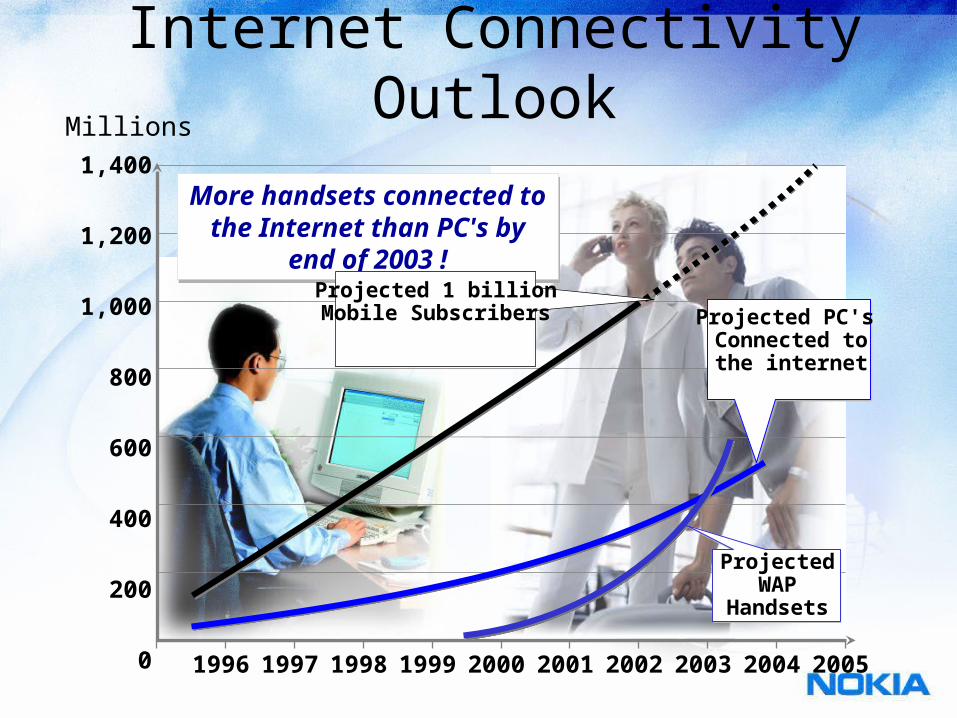
Internet Connectivity Outlook
More handsets connected to the Internet than PC's by end of
2003 !
More handsets connected to the Internet than PC's by end of
2003 !
Projected PC's Connected tothe internet
Projected WAP
Handsets
Projected 1 billionMobile Subscribers
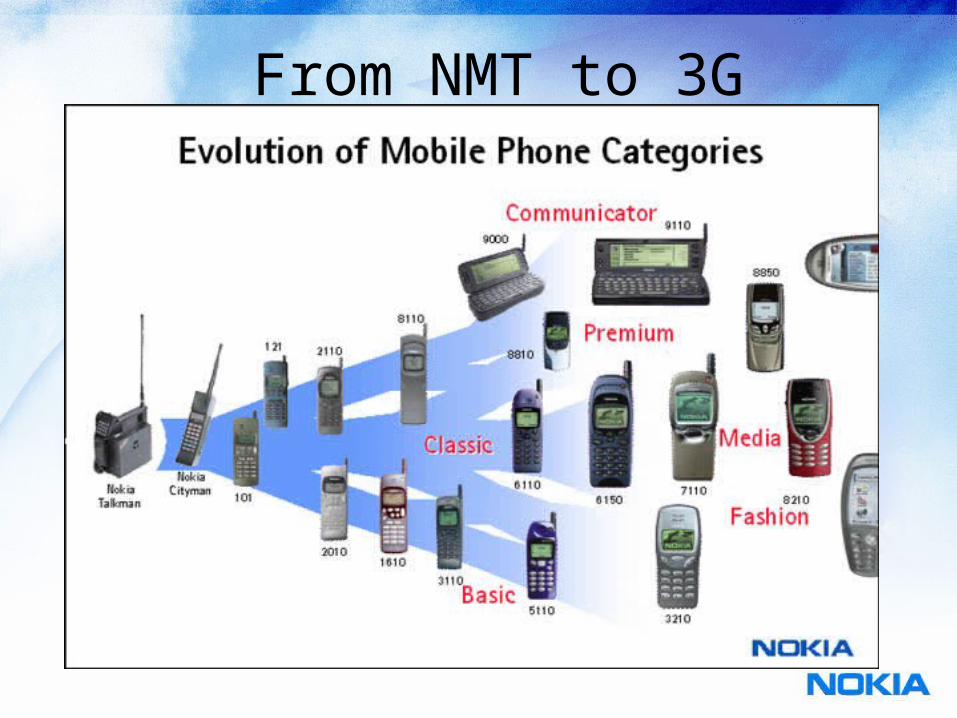
From NMT to 3G
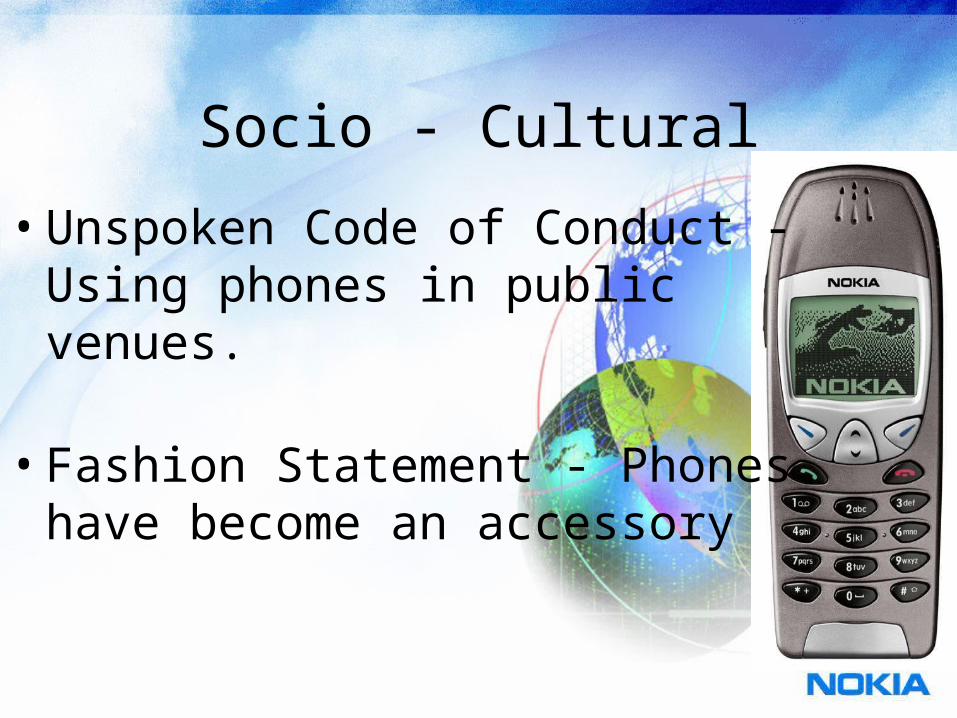
Socio - Cultural
• Unspoken Code of Conduct - Using phones in public venues.
• Fashion Statement - Phones have become an accessory
Political - Legal
• Medical device interference.
• Health problems - memory loss, brain cancer.
• Dangerous while operating a vehicle
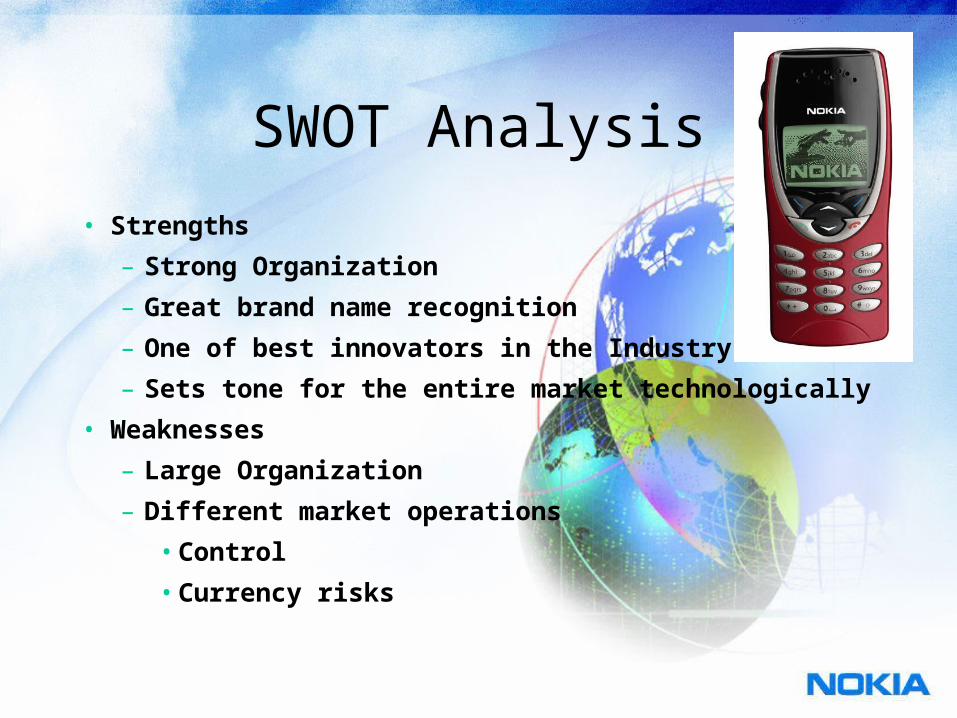
SWOT Analysis
• Strengths
– Strong Organization
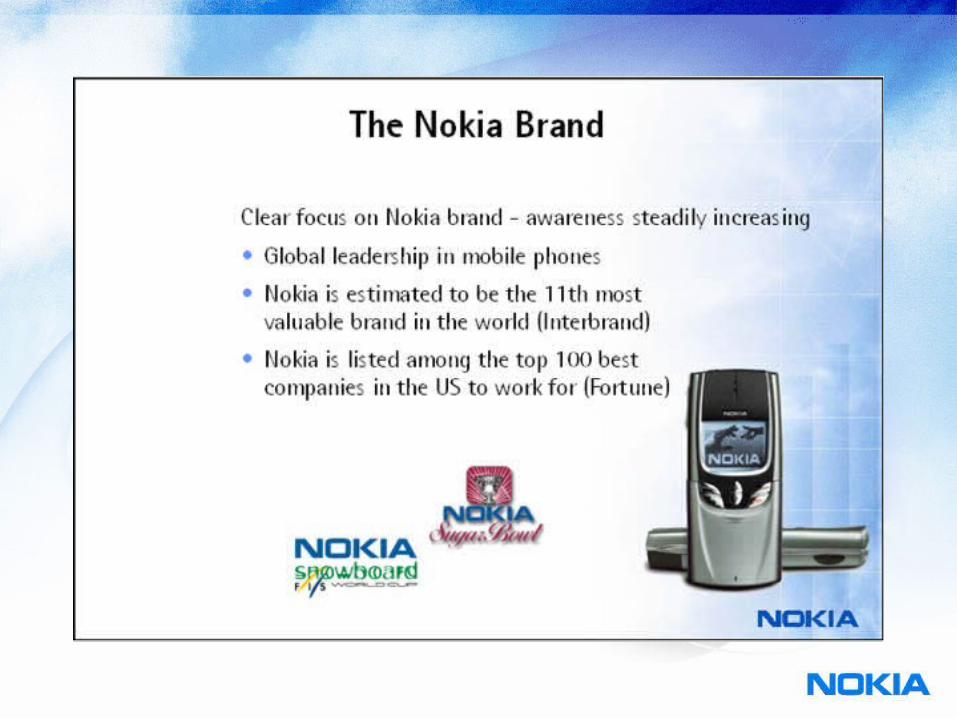
– Great brand name recognition
– One of best innovators in the Industry
– Sets tone for the entire market technologically
• Weaknesses
– Large Organization
– Different market operations
• Control
• Currency risks
SWOT Analysis• Opportunities
– New Markets
– Internet
• Threats
– Risk
– Changing Technology
– Increased competition
• Asia
• Europe
• USA
60% -
50% -
45% -
40% -
35% -
30% -
25% -
20% -
15% -
10% -
5 % -
0
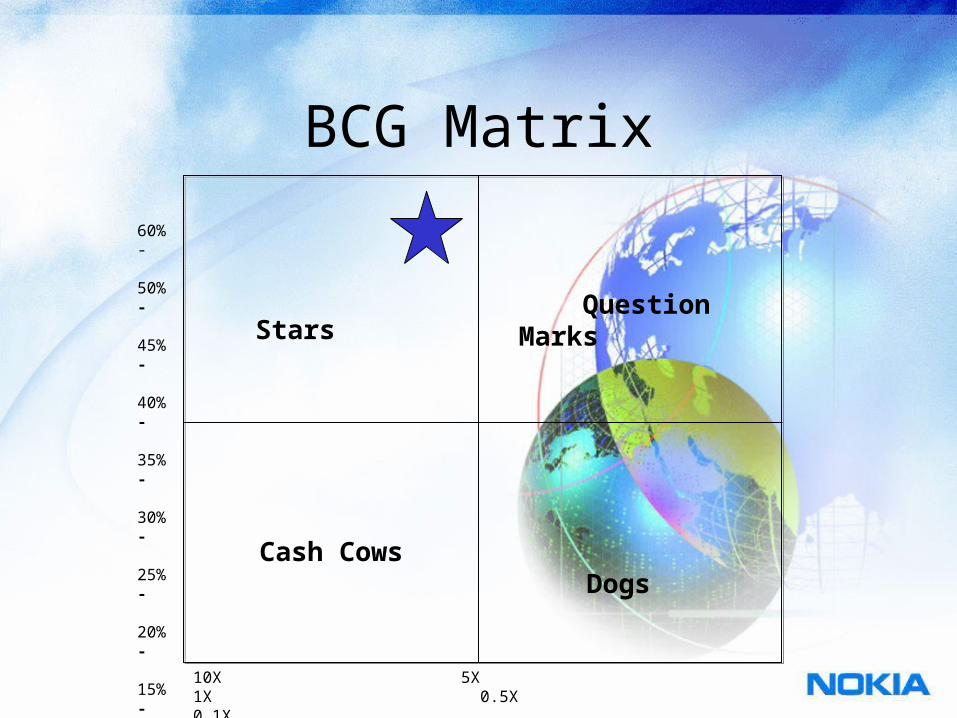
BCG Matrix
10X 5X 1X 0.5X 0.1X
Stars Question Marks
Cash Cows Dogs
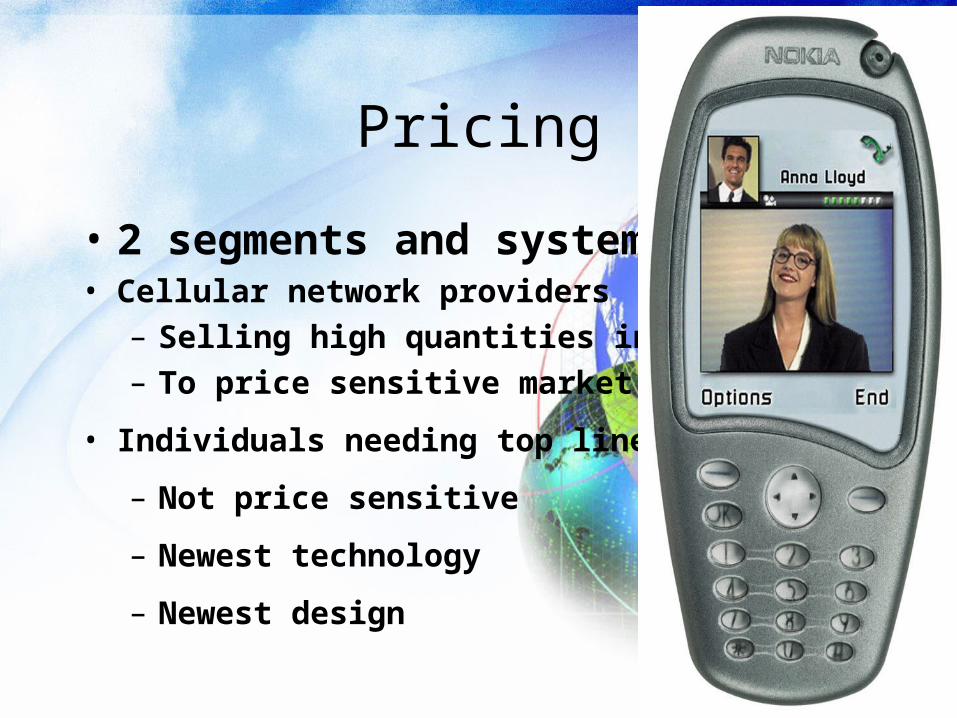
Pricing
• 2 segments and systems• Cellular network providers
– Selling high quantities in bulk
– To price sensitive market
• Individuals needing top line products
– Not price sensitive
– Newest technology
– Newest design
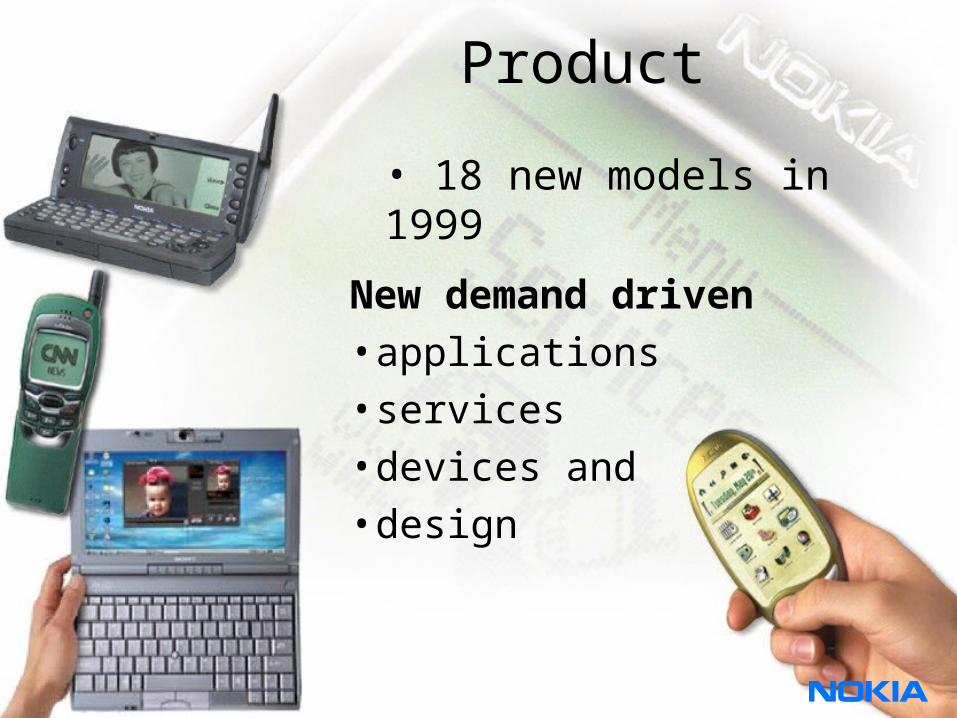
Product
New demand driven• applications• services• devices and• design
• 18 new models in 1999
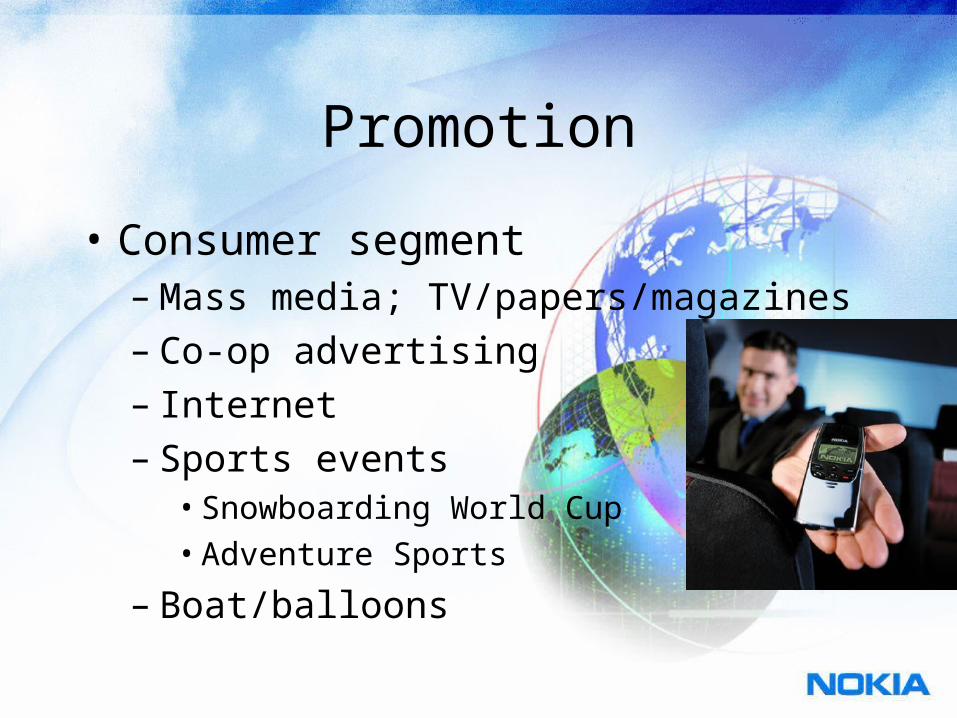
Promotion
• Consumer segment– Mass media; TV/papers/magazines– Co-op advertising– Internet– Sports events
• Snowboarding World Cup
• Adventure Sports
– Boat/balloons
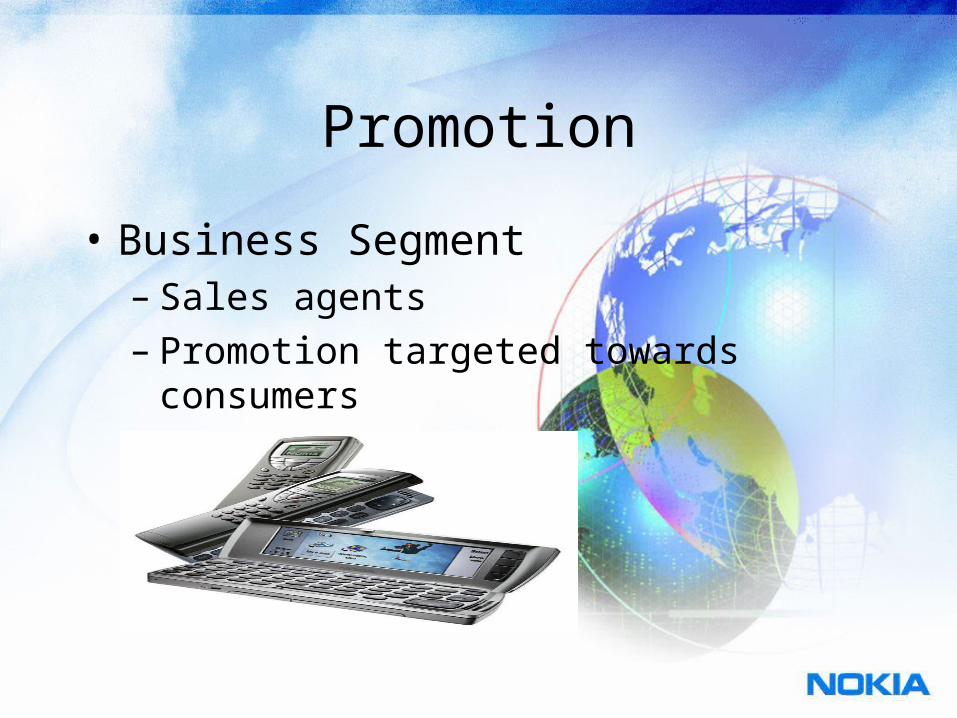
Promotion
• Business Segment– Sales agents – Promotion targeted towards consumers
Product-Market Expansion Strategy
• Currently in 130 different markets
• Joint ventures/distributor agreements
• Continue to expand as long as need and buying power exists.
• Expansion of GSM and 3G network.– China, UK, Philippines, Norway, Turkey
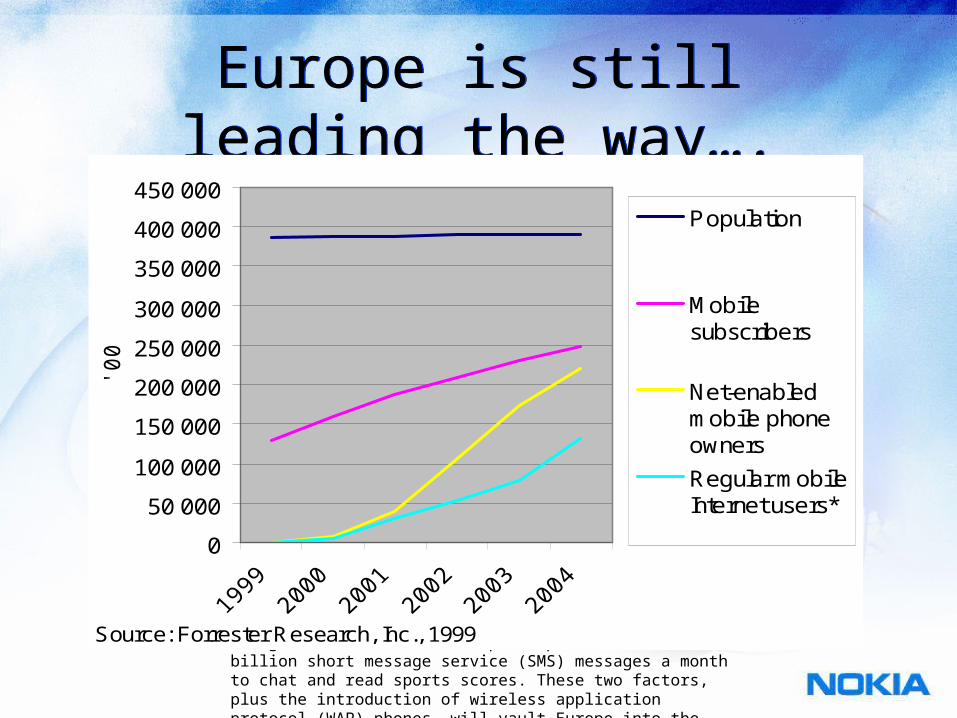
Europe is still leading the way….Europe is still leading the way….Forrester Predicts That One in ThreeEuropeans Will Access the Net ViaMobile Phone by 2004
AMSTERDAM, Netherlands--(BUSINESS WIRE) via NewsEdge Corporation --Europe stands on the brink of a revolution in Internet access. By 2004, one-third of all Europeans -- more than 219 million consumers -- will regularly use their mobile phones to access Internet services according to a new Report from Forrester Research B.V. (Nasdaq:FORR). Although the sites that will host these services are already being built, it remains unclear whether mobile operators will provide free and open access to these sites. Europeans lead the world in mobile phone use, with more than 117 million people in the EU carrying mobile phones. Many of these phones are already being used for data -- Europeans pass more than 2 billion short message service (SMS) messages a month to chat and read sports scores. These two factors, plus the introduction of wireless application protocol (WAP) phones, will vault Europe into the lead for mobile Internet access. (continues….) dated: 1999-12-16
0
50 000
100 000
150 000
200 000
250 000
300 000
350 000
400 000
450 000
'000
Population
Mobilesubscribers
Net-enabledmobile phoneowners
Regular mobileInternet users*
Source: Forrester Research, Inc., 1999
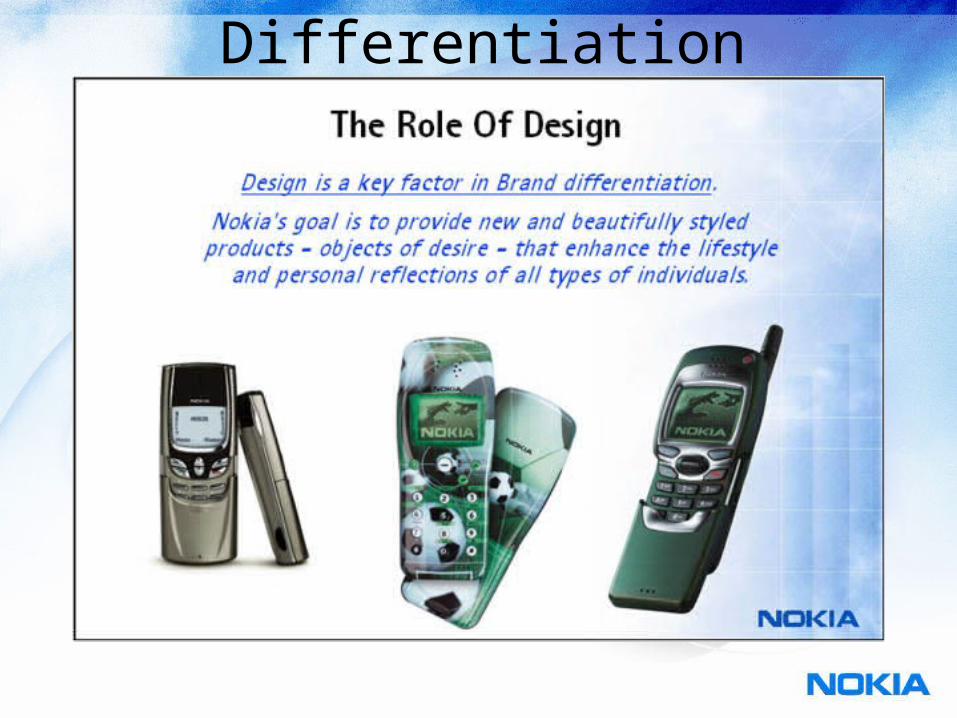
Differentiation
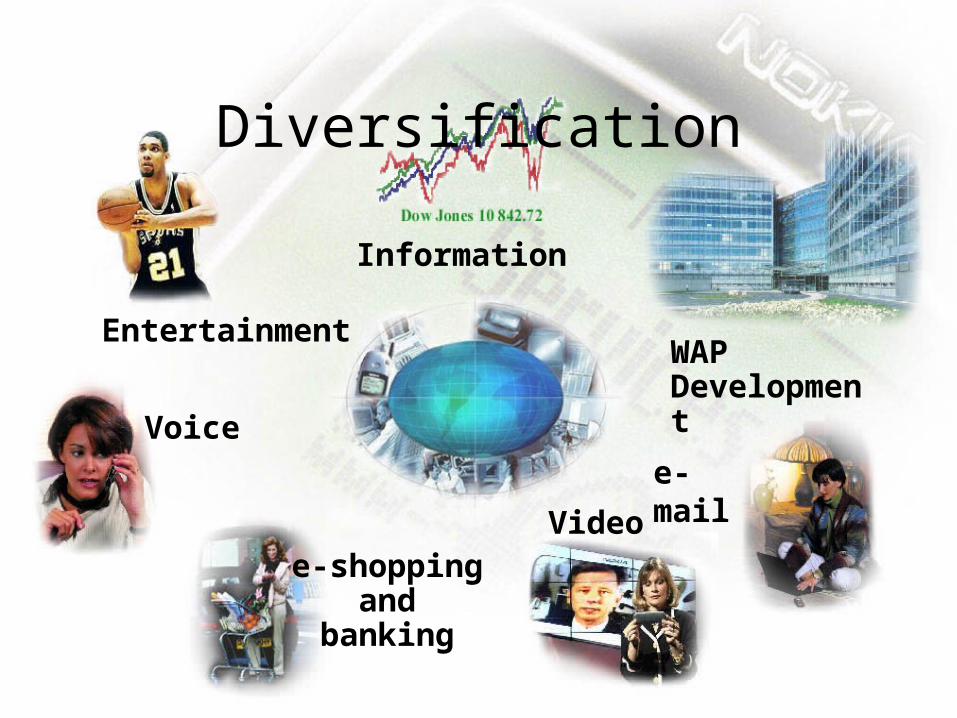
Diversification
Information
Entertainment
e-shoppingand
banking
Voice
WAP Development
Video
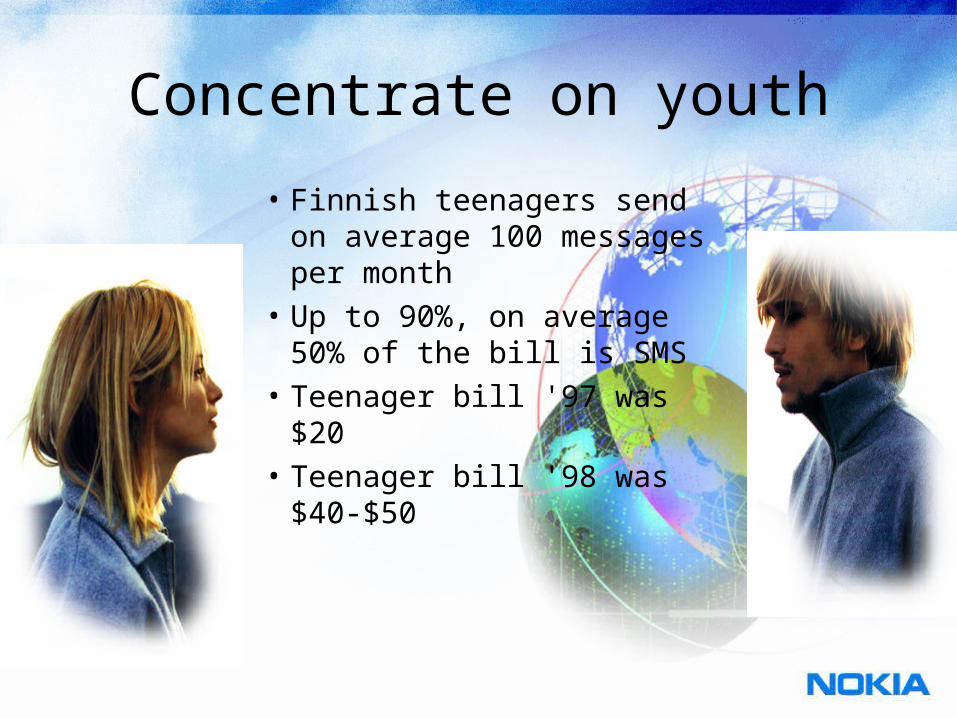
Concentrate on youth
• Finnish teenagers send on average 100 messages per month
• Up to 90%, on average 50% of the bill is SMS
• Teenager bill '97 was $20• Teenager bill '98 was $40-
$50
WE HAVE ONLY SEEN THE BEGINNING
Thank you