NF-kappa B controls energy homeostasis and … B controls energy homeostasis and metabolic...
18
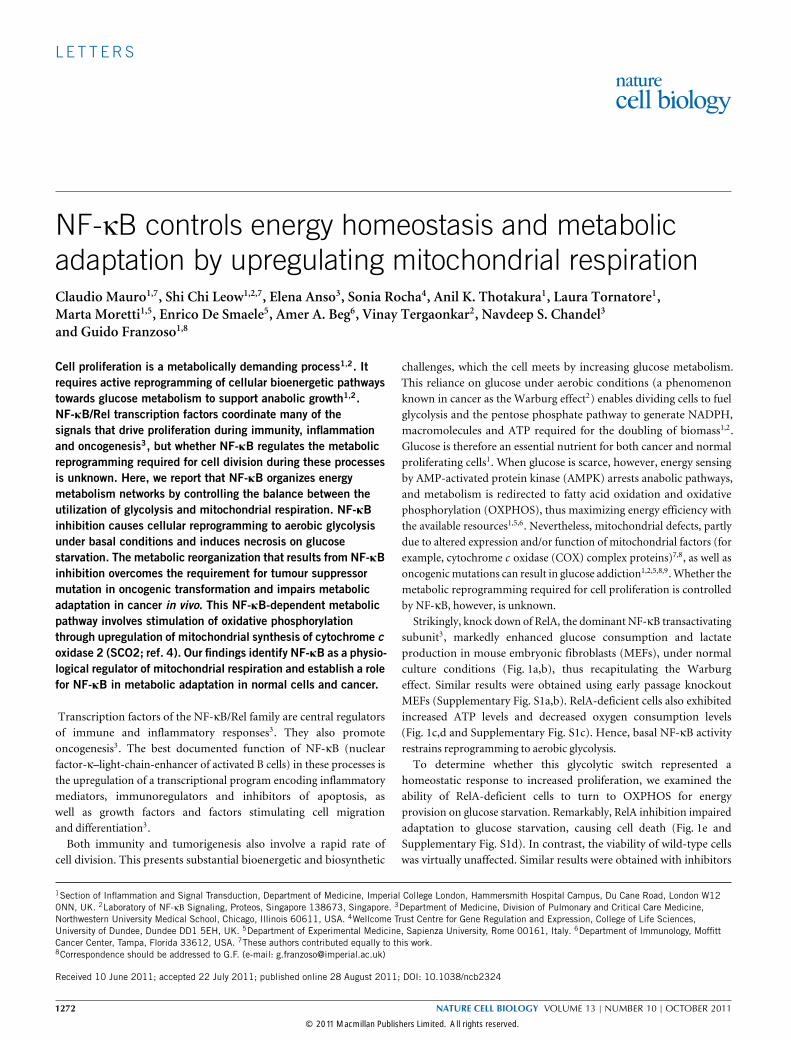
LETTERS NF-κB controls energy homeostasis and metabolic adaptation by upregulating mitochondrial respiration Claudio Mauro 1,7 , Shi Chi Leow 1,2,7 , Elena Anso 3 , Sonia Rocha 4 , Anil K. Thotakura 1 , Laura Tornatore 1 , Marta Moretti 1,5 , Enrico De Smaele 5 , Amer A. Beg 6 , Vinay Tergaonkar 2 , Navdeep S. Chandel 3 and Guido Franzoso 1,8 Cell proliferation is a metabolically demanding process 1,2 . It requires active reprogramming of cellular bioenergetic pathways towards glucose metabolism to support anabolic growth 1,2 . NF-κB/Rel transcription factors coordinate many of the signals that drive proliferation during immunity, inammation and oncogenesis 3 , but whether NF-κB regulates the metabolic reprogramming required for cell division during these processes is unknown. Here, we report that NF-κB organizes energy metabolism networks by controlling the balance between the utilization of glycolysis and mitochondrial respiration. NF-κB inhibition causes cellular reprogramming to aerobic glycolysis under basal conditions and induces necrosis on glucose starvation. The metabolic reorganization that results from NF-κB inhibition overcomes the requirement for tumour suppressor mutation in oncogenic transformation and impairs metabolic adaptation in cancer in vivo. This NF-κB-dependent metabolic pathway involves stimulation of oxidative phosphorylation through upregulation of mitochondrial synthesis of cytochrome c oxidase 2 (SCO2; ref. 4). Our findings identify NF-κB as a physio- logical regulator of mitochondrial respiration and establish a role for NF-κB in metabolic adaptation in normal cells and cancer. Transcription factors of the NF-κB/Rel family are central regulators of immune and inflammatory responses 3 . They also promote oncogenesis 3 . The best documented function of NF-κB (nuclear factor-κ–light-chain-enhancer of activated B cells) in these processes is the upregulation of a transcriptional program encoding inflammatory mediators, immunoregulators and inhibitors of apoptosis, as well as growth factors and factors stimulating cell migration and differentiation 3 . Both immunity and tumorigenesis also involve a rapid rate of cell division. This presents substantial bioenergetic and biosynthetic 1 Section of Inflammation and Signal Transduction, Department of Medicine, Imperial College London, Hammersmith Hospital Campus, Du Cane Road, London W12 0NN, UK. 2 Laboratory of NF-κB Signaling, Proteos, Singapore 138673, Singapore. 3 Department of Medicine, Division of Pulmonary and Critical Care Medicine, Northwestern University Medical School, Chicago, Illinois 60611, USA. 4 Wellcome Trust Centre for Gene Regulation and Expression, College of Life Sciences, University of Dundee, Dundee DD1 5EH, UK. 5 Department of Experimental Medicine, Sapienza University, Rome 00161, Italy. 6 Department of Immunology, Moffitt Cancer Center, Tampa, Florida 33612, USA. 7 These authors contributed equally to this work. 8 Correspondence should be addressed to G.F. (e-mail: [email protected]) Received 10 June 2011; accepted 22 July 2011; published online 28 August 2011; DOI: 10.1038/ncb2324 challenges, which the cell meets by increasing glucose metabolism. This reliance on glucose under aerobic conditions (a phenomenon known in cancer as the Warburg effect 2 ) enables dividing cells to fuel glycolysis and the pentose phosphate pathway to generate NADPH, macromolecules and ATP required for the doubling of biomass 1,2 . Glucose is therefore an essential nutrient for both cancer and normal proliferating cells 1 . When glucose is scarce, however, energy sensing by AMP-activated protein kinase (AMPK) arrests anabolic pathways, and metabolism is redirected to fatty acid oxidation and oxidative phosphorylation (OXPHOS), thus maximizing energy efficiency with the available resources 1,5,6 . Nevertheless, mitochondrial defects, partly due to altered expression and/or function of mitochondrial factors (for example, cytochrome c oxidase (COX) complex proteins) 7,8 , as well as oncogenic mutations can result in glucose addiction 1,2,5,8,9 . Whether the metabolic reprogramming required for cell proliferation is controlled by NF-κB, however, is unknown. Strikingly, knock down of RelA, the dominant NF-κB transactivating subunit 3 , markedly enhanced glucose consumption and lactate production in mouse embryonic fibroblasts (MEFs), under normal culture conditions (Fig. 1a,b), thus recapitulating the Warburg effect. Similar results were obtained using early passage knockout MEFs (Supplementary Fig. S1a,b). RelA-deficient cells also exhibited increased ATP levels and decreased oxygen consumption levels (Fig. 1c,d and Supplementary Fig. S1c). Hence, basal NF-κB activity restrains reprogramming to aerobic glycolysis. To determine whether this glycolytic switch represented a homeostatic response to increased proliferation, we examined the ability of RelA-deficient cells to turn to OXPHOS for energy provision on glucose starvation. Remarkably, RelA inhibition impaired adaptation to glucose starvation, causing cell death (Fig. 1e and Supplementary Fig. S1d). In contrast, the viability of wild-type cells was virtually unaffected. Similar results were obtained with inhibitors 1272 NATURE CELL BIOLOGY VOLUME 13 | NUMBER 10 | OCTOBER 2011 © 2011 Macmillan Publishers Limited. All rights reserved.
Transcript of NF-kappa B controls energy homeostasis and … B controls energy homeostasis and metabolic...
L E T T ERS
NF-κB controls energy homeostasis and metabolicadaptation by upregulating mitochondrial respirationClaudio Mauro1,7, Shi Chi Leow1,2,7, Elena Anso3, Sonia Rocha4, Anil K. Thotakura1, Laura Tornatore1,Marta Moretti1,5, Enrico De Smaele5, Amer A. Beg6, Vinay Tergaonkar2, Navdeep S. Chandel3
and Guido Franzoso1,8
Cell proliferation is a metabolically demanding process1,2. Itrequires active reprogramming of cellular bioenergetic pathwaystowards glucose metabolism to support anabolic growth1,2.NF-κB/Rel transcription factors coordinate many of thesignals that drive proliferation during immunity, inflammationand oncogenesis3, but whether NF-κB regulates the metabolicreprogramming required for cell division during these processesis unknown. Here, we report that NF-κB organizes energymetabolism networks by controlling the balance between theutilization of glycolysis and mitochondrial respiration. NF-κBinhibition causes cellular reprogramming to aerobic glycolysisunder basal conditions and induces necrosis on glucosestarvation. The metabolic reorganization that results from NF-κBinhibition overcomes the requirement for tumour suppressormutation in oncogenic transformation and impairs metabolicadaptation in cancer in vivo. This NF-κB-dependent metabolicpathway involves stimulation of oxidative phosphorylationthrough upregulation of mitochondrial synthesis of cytochrome coxidase 2 (SCO2; ref. 4). Our findings identify NF-κB as a physio-logical regulator of mitochondrial respiration and establish a rolefor NF-κB in metabolic adaptation in normal cells and cancer.
Transcription factors of the NF-κB/Rel family are central regulatorsof immune and inflammatory responses3. They also promoteoncogenesis3. The best documented function of NF-κB (nuclearfactor-κ–light-chain-enhancer of activated B cells) in these processes isthe upregulation of a transcriptional program encoding inflammatorymediators, immunoregulators and inhibitors of apoptosis, aswell as growth factors and factors stimulating cell migrationand differentiation3.Both immunity and tumorigenesis also involve a rapid rate of
cell division. This presents substantial bioenergetic and biosynthetic
1Section of Inflammation and Signal Transduction, Department of Medicine, Imperial College London, Hammersmith Hospital Campus, Du Cane Road, London W120NN, UK. 2Laboratory of NF-κB Signaling, Proteos, Singapore 138673, Singapore. 3Department of Medicine, Division of Pulmonary and Critical Care Medicine,Northwestern University Medical School, Chicago, Illinois 60611, USA. 4Wellcome Trust Centre for Gene Regulation and Expression, College of Life Sciences,University of Dundee, Dundee DD1 5EH, UK. 5Department of Experimental Medicine, Sapienza University, Rome 00161, Italy. 6Department of Immunology, MoffittCancer Center, Tampa, Florida 33612, USA. 7These authors contributed equally to this work.8Correspondence should be addressed to G.F. (e-mail: [email protected])
Received 10 June 2011; accepted 22 July 2011; published online 28 August 2011; DOI: 10.1038/ncb2324
challenges, which the cell meets by increasing glucose metabolism.This reliance on glucose under aerobic conditions (a phenomenonknown in cancer as the Warburg effect2) enables dividing cells to fuelglycolysis and the pentose phosphate pathway to generate NADPH,macromolecules and ATP required for the doubling of biomass1,2.Glucose is therefore an essential nutrient for both cancer and normalproliferating cells1. When glucose is scarce, however, energy sensingby AMP-activated protein kinase (AMPK) arrests anabolic pathways,and metabolism is redirected to fatty acid oxidation and oxidativephosphorylation (OXPHOS), thus maximizing energy efficiency withthe available resources1,5,6. Nevertheless, mitochondrial defects, partlydue to altered expression and/or function of mitochondrial factors (forexample, cytochrome c oxidase (COX) complex proteins)7,8, as well asoncogenicmutations can result in glucose addiction1,2,5,8,9.Whether themetabolic reprogramming required for cell proliferation is controlledby NF-κB, however, is unknown.Strikingly, knock down of RelA, the dominant NF-κB transactivating
subunit3, markedly enhanced glucose consumption and lactateproduction in mouse embryonic fibroblasts (MEFs), under normalculture conditions (Fig. 1a,b), thus recapitulating the Warburgeffect. Similar results were obtained using early passage knockoutMEFs (Supplementary Fig. S1a,b). RelA-deficient cells also exhibitedincreased ATP levels and decreased oxygen consumption levels(Fig. 1c,d and Supplementary Fig. S1c). Hence, basal NF-κB activityrestrains reprogramming to aerobic glycolysis.To determine whether this glycolytic switch represented a
homeostatic response to increased proliferation, we examined theability of RelA-deficient cells to turn to OXPHOS for energyprovision on glucose starvation. Remarkably, RelA inhibition impairedadaptation to glucose starvation, causing cell death (Fig. 1e andSupplementary Fig. S1d). In contrast, the viability of wild-type cellswas virtually unaffected. Similar results were obtained with inhibitors
1272 NATURE CELL BIOLOGY VOLUME 13 | NUMBER 10 | OCTOBER 2011
© 2011 Macmillan Publishers Limited. All rights reserved.
L E T T ERS
b c dns shRNARelA shRNA
Lacta
te p
rod
uctio
n
(mm
ol p
er
2.5
× 1
04 c
ells
)aG
luco
se c
onsum
ptio
n
(mm
ol p
er
2.5
× 1
04 c
ells
)
RelA
β-actin
ns s
hR
NA
Rel
A s
hR
NA
c-Rel
0
1
2
3
4
AT
P (nm
ol p
er
10
6 c
ells
)
Mito
cho
nd
rial O
2
co
nsum
ptio
n r
ate
(p
mo
l
per
min
per
2.5
× 1
04 c
ells
)
fg
ns shRNARelA shRNA
Days after GS
Lacta
te p
rod
uctio
n
(mm
ol p
er
2.5
× 1
04 c
ells
)
Mito
cho
nd
rial O
2
co
nsum
ptio
n r
ate
(p
mo
l
per
min
per
2.5
× 1
04 c
ells
)
Days after GS
ns shRNARelA shRNA
0 30 20 1
e
Perc
enta
ge o
f surv
ival
ns shRNA
RelA shRNA
Days after GS
RelA
β-actin
ns s
hR
NA
Rel
A s
hR
NA
ns shRNA
RelA shRNA
0 3 5
Days after GSP
erc
enta
ge o
f surv
ival
GSGS + SD
AT
P (nm
ol p
er
10
6 c
ells
)
Days after GS
ns shRNA
RelA shRNA∗∗
∗∗∗ ∗∗ ∗∗ ∗∗
Perc
enta
ge o
f surv
ival
GSGS + Rapa
ns s
hR
NA
Rel
A s
hR
NA
ns shRNA
RelA shRNA
GS GS + Rapa
ns shRNARelA shRNA
0
5
10
15
20
0
5
10
15
20
0
100
200
300
400
500
600
0
20
40
60
80
100
120
0 1 2 3 4 5 6
0
5
10
15
20
25
0 1 2 3 4 5 6
0
10
20
30
40
50
60
05
101520253035404550
020406080
100120140160
0
0.5
1.0
1.5
2.0
2.5
3.0
3.5
4.0
4.5
0 1 2 3 4 5 6
0
20
40
60
80
100
ns s
hR
NA
Rel
A s
hR
NA
0
20
40
60
80
100
h i j
ns shRNARelA shRNA
ns shRNARelA shRNA
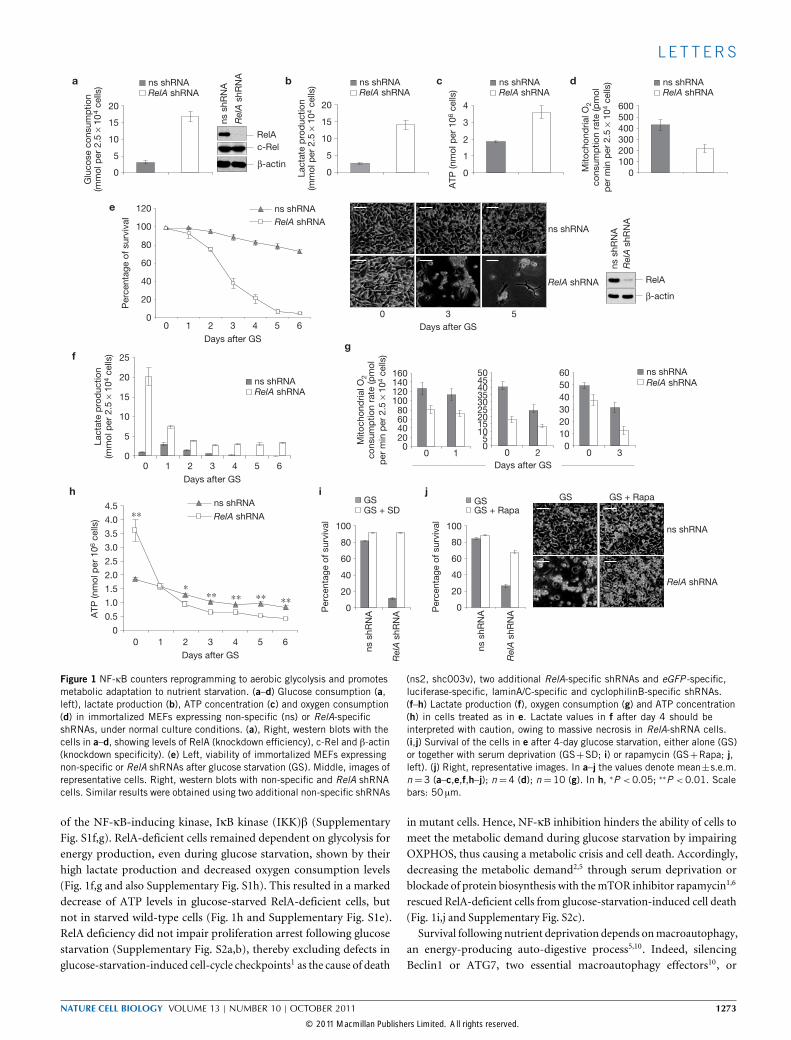
Figure 1 NF-κB counters reprogramming to aerobic glycolysis and promotesmetabolic adaptation to nutrient starvation. (a–d) Glucose consumption (a,left), lactate production (b), ATP concentration (c) and oxygen consumption(d) in immortalized MEFs expressing non-specific (ns) or RelA-specificshRNAs, under normal culture conditions. (a), Right, western blots with thecells in a–d, showing levels of RelA (knockdown efficiency), c-Rel and β-actin(knockdown specificity). (e) Left, viability of immortalized MEFs expressingnon-specific or RelA shRNAs after glucose starvation (GS). Middle, images ofrepresentative cells. Right, western blots with non-specific and RelA shRNAcells. Similar results were obtained using two additional non-specific shRNAs
(ns2, shc003v), two additional RelA-specific shRNAs and eGFP -specific,luciferase-specific, laminA/C-specific and cyclophilinB-specific shRNAs.(f–h) Lactate production (f), oxygen consumption (g) and ATP concentration(h) in cells treated as in e. Lactate values in f after day 4 should beinterpreted with caution, owing to massive necrosis in RelA-shRNA cells.(i,j) Survival of the cells in e after 4-day glucose starvation, either alone (GS)or together with serum deprivation (GS+SD; i) or rapamycin (GS+Rapa; j,left). (j) Right, representative images. In a–j the values denote mean±s.e.m.n=3 (a–c,e,f,h–j); n=4 (d); n=10 (g). In h, ∗P <0.05; ∗∗P <0.01. Scalebars: 50 µm.
of the NF-κB-inducing kinase, IκB kinase (IKK)β (SupplementaryFig. S1f,g). RelA-deficient cells remained dependent on glycolysis forenergy production, even during glucose starvation, shown by theirhigh lactate production and decreased oxygen consumption levels(Fig. 1f,g and also Supplementary Fig. S1h). This resulted in a markeddecrease of ATP levels in glucose-starved RelA-deficient cells, butnot in starved wild-type cells (Fig. 1h and Supplementary Fig. S1e).RelA deficiency did not impair proliferation arrest following glucosestarvation (Supplementary Fig. S2a,b), thereby excluding defects inglucose-starvation-induced cell-cycle checkpoints1 as the cause of death
in mutant cells. Hence, NF-κB inhibition hinders the ability of cells tomeet the metabolic demand during glucose starvation by impairingOXPHOS, thus causing a metabolic crisis and cell death. Accordingly,decreasing the metabolic demand2,5 through serum deprivation orblockade of protein biosynthesis with themTOR inhibitor rapamycin1,6
rescued RelA-deficient cells from glucose-starvation-induced cell death(Fig. 1i,j and Supplementary Fig. S2c).
Survival following nutrient deprivation depends onmacroautophagy,an energy-producing auto-digestive process5,10. Indeed, silencingBeclin1 or ATG7, two essential macroautophagy effectors10, or
NATURE CELL BIOLOGY VOLUME 13 | NUMBER 10 | OCTOBER 2011 1273
© 2011 Macmillan Publishers Limited. All rights reserved.
L E T T ERS
treatment with the macroautophagy inhibitors, 3-methyladenineand chloroquine10, induced toxicity in glucose-starved wild-typeMEFs to an extent similar to RelA inactivation (SupplementaryFig. S3a–c). However, neither the induction of the macroautophagyeffector, LC3 (ref. 10), nor the formation of macroautophagicvesicles10, was impaired by RelA inhibition during glucose starvation(Supplementary Fig. S3d,e). Instead, this inhibition basally inducedautophagic flux, shown by the enhanced rates of autophagosomeformation and degradation exhibited by untreated RelA small hair-pin RNA (shRNA) cells relative to control cells (SupplementaryFig. S3d–f, 0 h; see the increased levels of LC3 and eGFP–LC3punctate staining, and decreased levels of the autophagic cargoprotein p62 in RelA-shRNA cells not exposed to bafilomycin A1,inhibiting lysosomal vacuolar ATPase). Hence, defective macroau-tophagy is not responsible for the demise of glucose-starved RelA-deficient cells. Similarly, RelA-deficient and control cells exhibitedno obvious differences in glucose-starvation-induced caspase ac-tivation (Supplementary Fig. S4a), and blocking apoptosis usingcaspase-8-specific shRNAs or the pan-caspase inhibitor z-VADfmk
(ref. 10) failed to rescue the RelA-deficient cells from programmedcell death (PCD) after metabolic challenge (Supplementary Fig.S4b–d). Notably, RelA inactivation retained toxicity in glucose-starved Bax−/−/Bak−/− MEFs, which are refractory to apoptosis10
(Supplementary Fig. S4e,f). Starved RelA knocked-down cells alsoshowed morphological signs of necrosis, lacked nucleosomal frag-mentation, a hallmark of apoptosis, and their culture media con-tained elevated levels of the necrosis marker HMGB1 (ref. 10;Supplementary Fig. S4g; data not shown). Thus, NF-κB-affordedprotection during glucose starvation involves suppression of anecrotic death pathway.Adaptation to low glucose availability is orchestrated by the energy
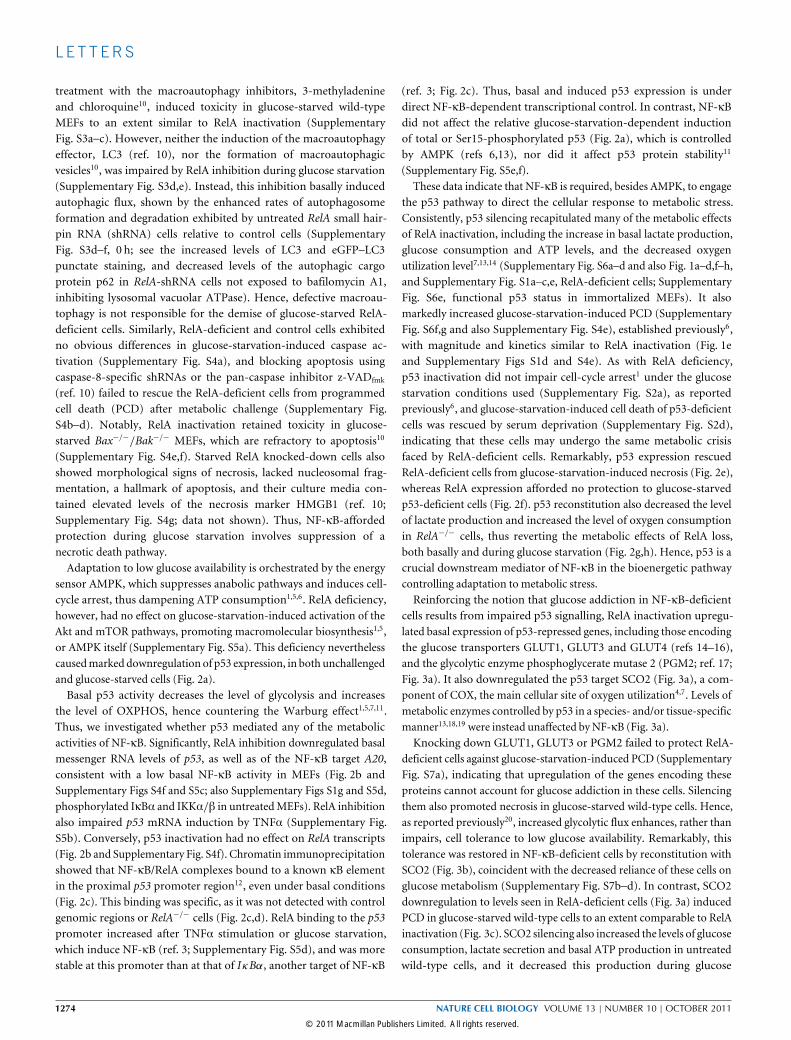
sensor AMPK, which suppresses anabolic pathways and induces cell-cycle arrest, thus dampening ATP consumption1,5,6. RelA deficiency,however, had no effect on glucose-starvation-induced activation of theAkt and mTOR pathways, promoting macromolecular biosynthesis1,5,or AMPK itself (Supplementary Fig. S5a). This deficiency neverthelesscausedmarked downregulation of p53 expression, in both unchallengedand glucose-starved cells (Fig. 2a).Basal p53 activity decreases the level of glycolysis and increases
the level of OXPHOS, hence countering the Warburg effect1,5,7,11.Thus, we investigated whether p53 mediated any of the metabolicactivities of NF-κB. Significantly, RelA inhibition downregulated basalmessenger RNA levels of p53, as well as of the NF-κB target A20,consistent with a low basal NF-κB activity in MEFs (Fig. 2b andSupplementary Figs S4f and S5c; also Supplementary Figs S1g and S5d,phosphorylated IκBα and IKKα/β in untreatedMEFs). RelA inhibitionalso impaired p53 mRNA induction by TNFα (Supplementary Fig.S5b). Conversely, p53 inactivation had no effect on RelA transcripts(Fig. 2b and Supplementary Fig. S4f). Chromatin immunoprecipitationshowed that NF-κB/RelA complexes bound to a known κB elementin the proximal p53 promoter region12, even under basal conditions(Fig. 2c). This binding was specific, as it was not detected with controlgenomic regions or RelA−/− cells (Fig. 2c,d). RelA binding to the p53promoter increased after TNFα stimulation or glucose starvation,which induce NF-κB (ref. 3; Supplementary Fig. S5d), and was morestable at this promoter than at that of IκBα, another target of NF-κB
(ref. 3; Fig. 2c). Thus, basal and induced p53 expression is underdirect NF-κB-dependent transcriptional control. In contrast, NF-κBdid not affect the relative glucose-starvation-dependent inductionof total or Ser15-phosphorylated p53 (Fig. 2a), which is controlledby AMPK (refs 6,13), nor did it affect p53 protein stability11
(Supplementary Fig. S5e,f).These data indicate that NF-κB is required, besides AMPK, to engage
the p53 pathway to direct the cellular response to metabolic stress.Consistently, p53 silencing recapitulated many of the metabolic effectsof RelA inactivation, including the increase in basal lactate production,glucose consumption and ATP levels, and the decreased oxygenutilization level7,13,14 (Supplementary Fig. S6a–d and also Fig. 1a–d,f–h,and Supplementary Fig. S1a–c,e, RelA-deficient cells; SupplementaryFig. S6e, functional p53 status in immortalized MEFs). It alsomarkedly increased glucose-starvation-induced PCD (SupplementaryFig. S6f,g and also Supplementary Fig. S4e), established previously6,with magnitude and kinetics similar to RelA inactivation (Fig. 1eand Supplementary Figs S1d and S4e). As with RelA deficiency,p53 inactivation did not impair cell-cycle arrest1 under the glucosestarvation conditions used (Supplementary Fig. S2a), as reportedpreviously6, and glucose-starvation-induced cell death of p53-deficientcells was rescued by serum deprivation (Supplementary Fig. S2d),indicating that these cells may undergo the same metabolic crisisfaced by RelA-deficient cells. Remarkably, p53 expression rescuedRelA-deficient cells from glucose-starvation-induced necrosis (Fig. 2e),whereas RelA expression afforded no protection to glucose-starvedp53-deficient cells (Fig. 2f). p53 reconstitution also decreased the levelof lactate production and increased the level of oxygen consumptionin RelA−/− cells, thus reverting the metabolic effects of RelA loss,both basally and during glucose starvation (Fig. 2g,h). Hence, p53 is acrucial downstream mediator of NF-κB in the bioenergetic pathwaycontrolling adaptation to metabolic stress.Reinforcing the notion that glucose addiction in NF-κB-deficient
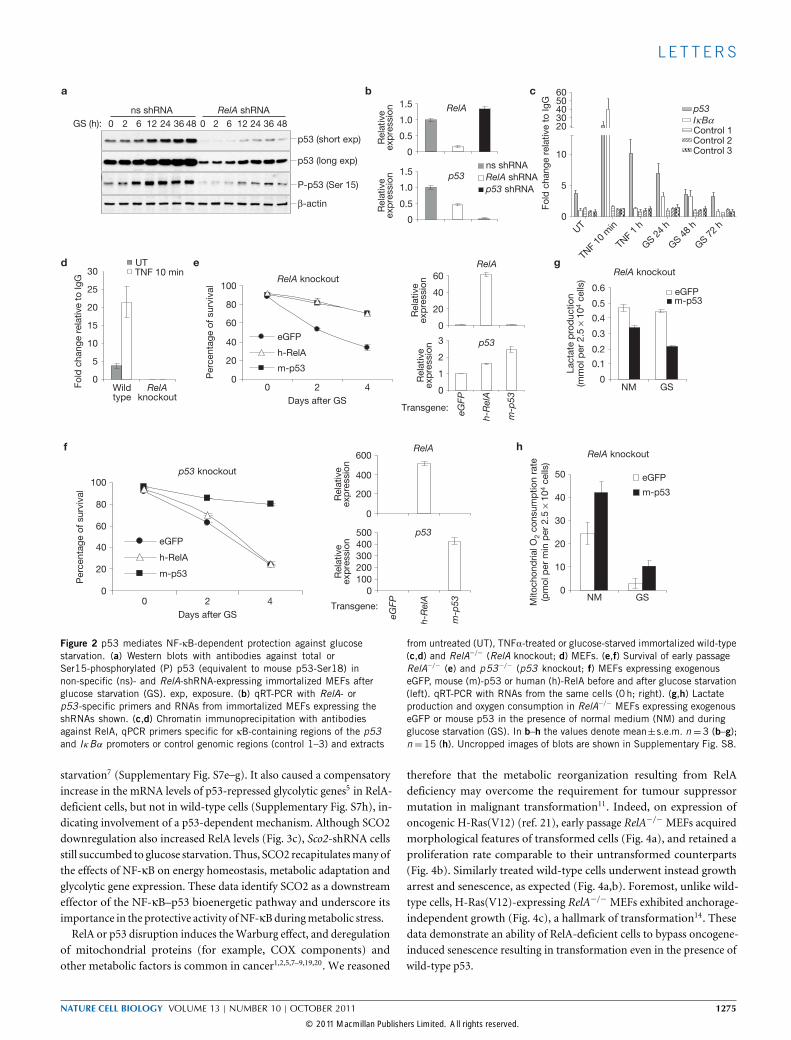
cells results from impaired p53 signalling, RelA inactivation upregu-lated basal expression of p53-repressed genes, including those encodingthe glucose transporters GLUT1, GLUT3 and GLUT4 (refs 14–16),and the glycolytic enzyme phosphoglycerate mutase 2 (PGM2; ref. 17;Fig. 3a). It also downregulated the p53 target SCO2 (Fig. 3a), a com-ponent of COX, the main cellular site of oxygen utilization4,7. Levels ofmetabolic enzymes controlled by p53 in a species- and/or tissue-specificmanner13,18,19 were instead unaffected byNF-κB (Fig. 3a).Knocking down GLUT1, GLUT3 or PGM2 failed to protect RelA-
deficient cells against glucose-starvation-induced PCD (SupplementaryFig. S7a), indicating that upregulation of the genes encoding theseproteins cannot account for glucose addiction in these cells. Silencingthem also promoted necrosis in glucose-starved wild-type cells. Hence,as reported previously20, increased glycolytic flux enhances, rather thanimpairs, cell tolerance to low glucose availability. Remarkably, thistolerance was restored in NF-κB-deficient cells by reconstitution withSCO2 (Fig. 3b), coincident with the decreased reliance of these cells onglucose metabolism (Supplementary Fig. S7b–d). In contrast, SCO2downregulation to levels seen in RelA-deficient cells (Fig. 3a) inducedPCD in glucose-starved wild-type cells to an extent comparable to RelAinactivation (Fig. 3c). SCO2 silencing also increased the levels of glucoseconsumption, lactate secretion and basal ATP production in untreatedwild-type cells, and it decreased this production during glucose
1274 NATURE CELL BIOLOGY VOLUME 13 | NUMBER 10 | OCTOBER 2011
© 2011 Macmillan Publishers Limited. All rights reserved.
L E T T ERS
Wild type
RelA knockout
Fo
ld c
han
ge r
ela
tive t
o Ig
G
UTTNF 10 min
eGFP
h-R
elA
m-p
53
Rela
tive
exp
ressio
n
Transgene:
p53
Rela
tive
exp
ressio
n
RelA
Days after GS
Perc
en
tag
e o
f su
rviv
al
p53 knockout
eGFP
m-p53
h-RelA
h
NM GS
eGFP
m-p53
RelA knockout
Mito
ch
on
drial O
2 c
on
su
mp
tio
n r
ate
(pm
ol p
er
min
per
2.5
× 1
04 c
ells
)
e gRelA knockout
Days after GS
0 2 4
Perc
en
tag
e o
f su
rviv
al
eGFP
m-p53
h-RelA
RelA
Rela
tive
exp
ressio
n
eGFP
h-R
elA
m-p
53
Rela
tive
exp
ressio
n
Transgene:
p53
Lacta
te p
rod
uctio
n
(mm
ol p
er
2.5
× 1
04 c
ells
)
eGFPm-p53
NM GS
RelA knockout
ns shRNA
RelA shRNA
p53 shRNA
RelA
Rela
tive
exp
ressio
n
p53
Rela
tive
exp
ressio
n
a
d
f
b
GS (h):
p53 (short exp)
P-p53 (Ser 15)
p53 (long exp)
β-actin
p53
Control 1Control 2Control 3
Fo
ld c
han
ge r
ela
tive t
o Ig
G
IκBα120 2 6 24 36 48120 2 6 24 36 48
ns shRNA RelA shRNA
0
5
10
2030405060
UT
TNF
10 m
in
TNF
1 h
GS 2
4 h
GS 4
8 h
GS 7
2 h
0
20
40
60
80
100
0
0.5
1.0
1.5
0
0.5
1.0
1.5
c
0
5
10
15
20
25
30
0
1
2
3
0
20
40
60
0
0.1
0.2
0.3
0.4
0.5
0.6
0 2 40
20
40
60
80
100
0
200
400
600
0
100
200
300
400
500
0
10
20
30
40
50
ακ
Figure 2 p53 mediates NF-κB-dependent protection against glucosestarvation. (a) Western blots with antibodies against total orSer15-phosphorylated (P) p53 (equivalent to mouse p53-Ser18) innon-specific (ns)- and RelA-shRNA-expressing immortalized MEFs afterglucose starvation (GS). exp, exposure. (b) qRT-PCR with RelA- orp53-specific primers and RNAs from immortalized MEFs expressing theshRNAs shown. (c,d) Chromatin immunoprecipitation with antibodiesagainst RelA, qPCR primers specific for κB-containing regions of the p53and IκBα promoters or control genomic regions (control 1–3) and extracts
from untreated (UT), TNFα-treated or glucose-starved immortalized wild-type(c,d) and RelA−/− (RelA knockout; d) MEFs. (e,f) Survival of early passageRelA−/− (e) and p53−/− (p53 knockout; f) MEFs expressing exogenouseGFP, mouse (m)-p53 or human (h)-RelA before and after glucose starvation(left). qRT-PCR with RNAs from the same cells (0 h; right). (g,h) Lactateproduction and oxygen consumption in RelA−/− MEFs expressing exogenouseGFP or mouse p53 in the presence of normal medium (NM) and duringglucose starvation (GS). In b–h the values denote mean±s.e.m. n=3 (b–g);n=15 (h). Uncropped images of blots are shown in Supplementary Fig. S8.
starvation7 (Supplementary Fig. S7e–g). It also caused a compensatoryincrease in the mRNA levels of p53-repressed glycolytic genes5 in RelA-deficient cells, but not in wild-type cells (Supplementary Fig. S7h), in-dicating involvement of a p53-dependent mechanism. Although SCO2downregulation also increased RelA levels (Fig. 3c), Sco2-shRNA cellsstill succumbed to glucose starvation. Thus, SCO2 recapitulatesmany ofthe effects of NF-κB on energy homeostasis, metabolic adaptation andglycolytic gene expression. These data identify SCO2 as a downstreameffector of the NF-κB–p53 bioenergetic pathway and underscore itsimportance in the protective activity ofNF-κBduringmetabolic stress.RelA or p53 disruption induces theWarburg effect, and deregulation
of mitochondrial proteins (for example, COX components) andother metabolic factors is common in cancer1,2,5,7–9,19,20. We reasoned
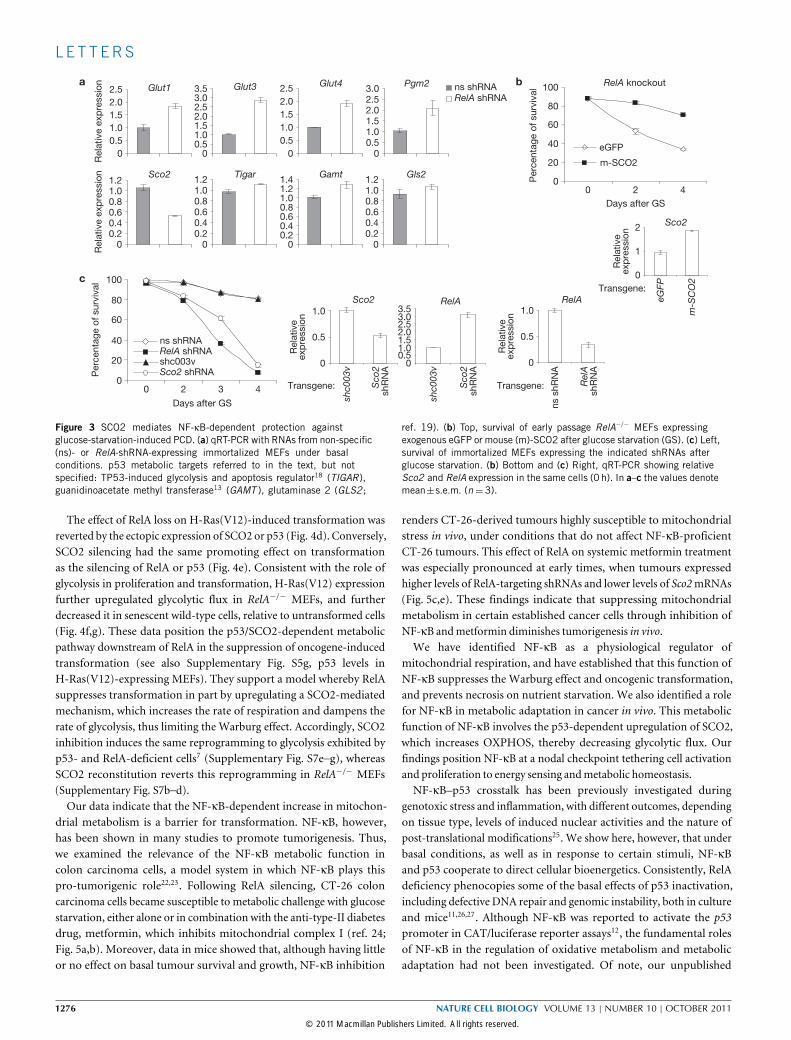
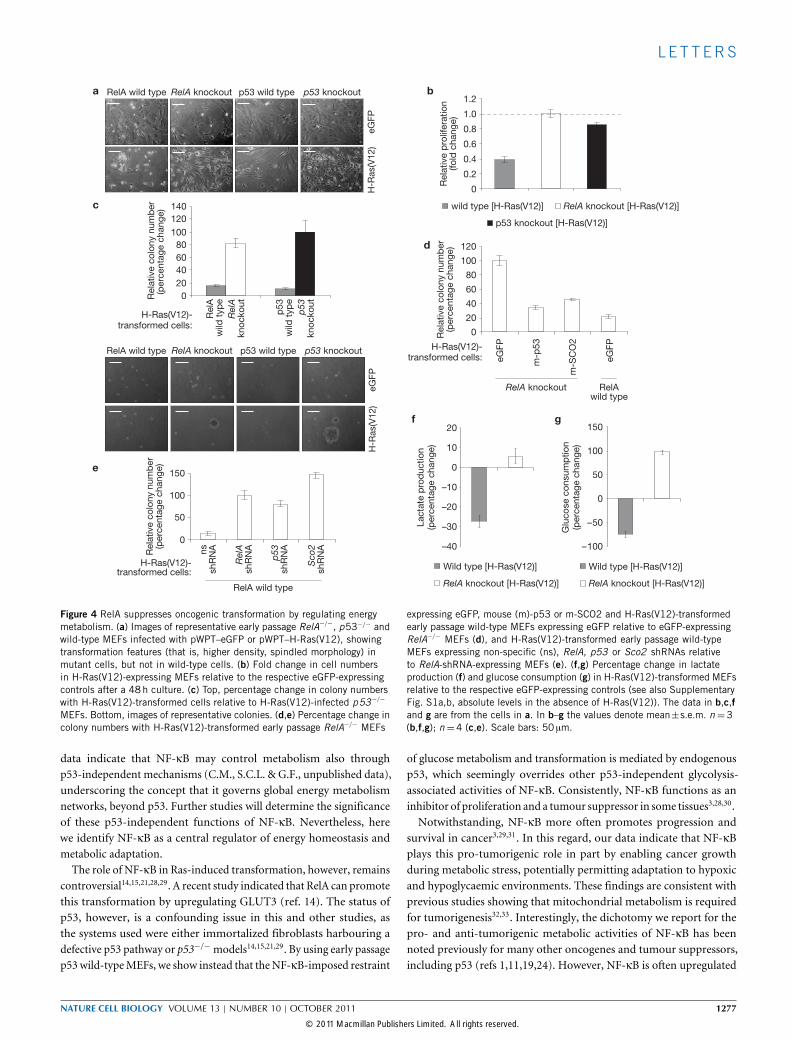
therefore that the metabolic reorganization resulting from RelAdeficiency may overcome the requirement for tumour suppressormutation in malignant transformation11. Indeed, on expression ofoncogenic H-Ras(V12) (ref. 21), early passage RelA−/− MEFs acquiredmorphological features of transformed cells (Fig. 4a), and retained aproliferation rate comparable to their untransformed counterparts(Fig. 4b). Similarly treated wild-type cells underwent instead growtharrest and senescence, as expected (Fig. 4a,b). Foremost, unlike wild-type cells, H-Ras(V12)-expressing RelA−/− MEFs exhibited anchorage-independent growth (Fig. 4c), a hallmark of transformation14. Thesedata demonstrate an ability of RelA-deficient cells to bypass oncogene-induced senescence resulting in transformation even in the presence ofwild-type p53.
NATURE CELL BIOLOGY VOLUME 13 | NUMBER 10 | OCTOBER 2011 1275
© 2011 Macmillan Publishers Limited. All rights reserved.
L E T T ERS
a b
c
ns shRNARelA shRNA
Glut1R
ela
tive e
xp
ressio
n Glut3 Glut4 Pgm2
Gamt Gls2Sco2 Tigar
eGFP
m-SCO2
Perc
en
tag
e o
f su
rviv
al
RelA knockout
Days after GS
Sco2
Rela
tive
exp
ressio
n
Transgene:
Perc
en
tag
e o
f su
rviv
al
Days after GS
0 2 3 4
ns shRNARelA shRNAshc003vSco2 shRNA
Sco2R
ela
tive
exp
ressio
n
Transgene:
RelA
shc0
03v
Sco
2 sh
RN
A
RelA
ns s
hR
NA
Rel
A
sh
RN
A
Transgene:
0
0.5
1.0
1.5
2.0
2.5
00.51.01.52.02.53.03.5
0
0.5
1.0
1.5
2.0
2.5
00.51.01.52.02.53.0
Rela
tive e
xp
ressio
n
00.20.40.60.81.01.2
00.20.40.60.81.01.2
00.20.40.60.81.01.21.4 0
20
40
60
80
100
0 2 4
eGFP
m-S
CO
20
1
2
0
20
40
60
80
100
0
0.5
1.0
shc0
03v
Sco
2 sh
RN
A
00.51.01.52.02.53.03.5
Rela
tive
exp
ressio
n
0
0.5
1.0
00.20.40.60.81.01.2
Figure 3 SCO2 mediates NF-κB-dependent protection againstglucose-starvation-induced PCD. (a) qRT-PCR with RNAs from non-specific(ns)- or RelA-shRNA-expressing immortalized MEFs under basalconditions. p53 metabolic targets referred to in the text, but notspecified: TP53-induced glycolysis and apoptosis regulator18 (TIGAR),guanidinoacetate methyl transferase13 (GAMT ), glutaminase 2 (GLS2 ;
ref. 19). (b) Top, survival of early passage RelA−/− MEFs expressingexogenous eGFP or mouse (m)-SCO2 after glucose starvation (GS). (c) Left,survival of immortalized MEFs expressing the indicated shRNAs afterglucose starvation. (b) Bottom and (c) Right, qRT-PCR showing relativeSco2 and RelA expression in the same cells (0 h). In a–c the values denotemean±s.e.m. (n=3).
The effect of RelA loss on H-Ras(V12)-induced transformation wasreverted by the ectopic expression of SCO2 or p53 (Fig. 4d). Conversely,SCO2 silencing had the same promoting effect on transformationas the silencing of RelA or p53 (Fig. 4e). Consistent with the role ofglycolysis in proliferation and transformation, H-Ras(V12) expressionfurther upregulated glycolytic flux in RelA−/− MEFs, and furtherdecreased it in senescent wild-type cells, relative to untransformed cells(Fig. 4f,g). These data position the p53/SCO2-dependent metabolicpathway downstream of RelA in the suppression of oncogene-inducedtransformation (see also Supplementary Fig. S5g, p53 levels inH-Ras(V12)-expressing MEFs). They support a model whereby RelAsuppresses transformation in part by upregulating a SCO2-mediatedmechanism, which increases the rate of respiration and dampens therate of glycolysis, thus limiting the Warburg effect. Accordingly, SCO2inhibition induces the same reprogramming to glycolysis exhibited byp53- and RelA-deficient cells7 (Supplementary Fig. S7e–g), whereasSCO2 reconstitution reverts this reprogramming in RelA−/− MEFs(Supplementary Fig. S7b–d).Our data indicate that the NF-κB-dependent increase in mitochon-
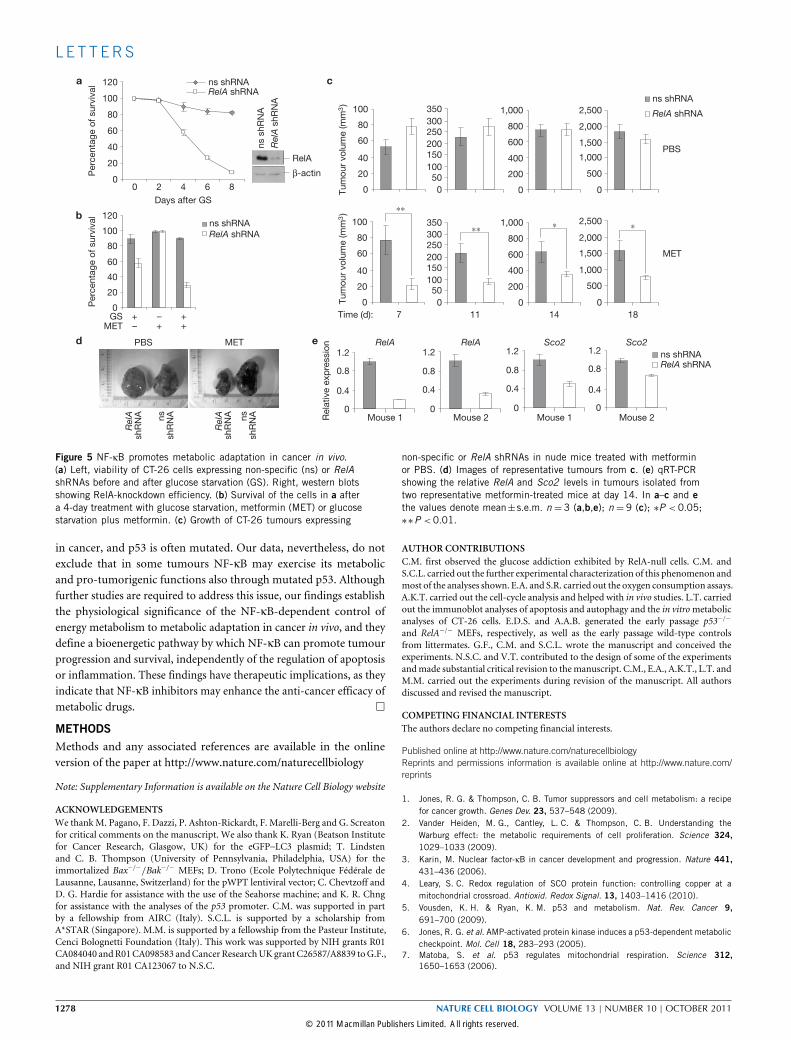
drial metabolism is a barrier for transformation. NF-κB, however,has been shown in many studies to promote tumorigenesis. Thus,we examined the relevance of the NF-κB metabolic function incolon carcinoma cells, a model system in which NF-κB plays thispro-tumorigenic role22,23. Following RelA silencing, CT-26 coloncarcinoma cells became susceptible to metabolic challenge with glucosestarvation, either alone or in combination with the anti-type-II diabetesdrug, metformin, which inhibits mitochondrial complex I (ref. 24;Fig. 5a,b). Moreover, data in mice showed that, although having littleor no effect on basal tumour survival and growth, NF-κB inhibition
renders CT-26-derived tumours highly susceptible to mitochondrialstress in vivo, under conditions that do not affect NF-κB-proficientCT-26 tumours. This effect of RelA on systemic metformin treatmentwas especially pronounced at early times, when tumours expressedhigher levels of RelA-targeting shRNAs and lower levels of Sco2mRNAs(Fig. 5c,e). These findings indicate that suppressing mitochondrialmetabolism in certain established cancer cells through inhibition ofNF-κB andmetformin diminishes tumorigenesis in vivo.We have identified NF-κB as a physiological regulator of
mitochondrial respiration, and have established that this function ofNF-κB suppresses the Warburg effect and oncogenic transformation,and prevents necrosis on nutrient starvation. We also identified a rolefor NF-κB in metabolic adaptation in cancer in vivo. This metabolicfunction of NF-κB involves the p53-dependent upregulation of SCO2,which increases OXPHOS, thereby decreasing glycolytic flux. Ourfindings position NF-κB at a nodal checkpoint tethering cell activationand proliferation to energy sensing andmetabolic homeostasis.NF-κB–p53 crosstalk has been previously investigated during
genotoxic stress and inflammation, with different outcomes, dependingon tissue type, levels of induced nuclear activities and the nature ofpost-translational modifications25. We show here, however, that underbasal conditions, as well as in response to certain stimuli, NF-κBand p53 cooperate to direct cellular bioenergetics. Consistently, RelAdeficiency phenocopies some of the basal effects of p53 inactivation,including defective DNA repair and genomic instability, both in cultureand mice11,26,27. Although NF-κB was reported to activate the p53promoter in CAT/luciferase reporter assays12, the fundamental rolesof NF-κB in the regulation of oxidative metabolism and metabolicadaptation had not been investigated. Of note, our unpublished
1276 NATURE CELL BIOLOGY VOLUME 13 | NUMBER 10 | OCTOBER 2011
© 2011 Macmillan Publishers Limited. All rights reserved.
L E T T ERS
Rela
tive p
rolif
era
tio
n
(fo
ld c
han
ge)
wild type [H-Ras(V12)] RelA knockout [H-Ras(V12)]
p53 knockout [H-Ras(V12)]
Rela
tive c
olo
ny n
um
ber
(perc
en
tag
e c
han
ge)
H-Ras(V12)- transformed cells:
e
Rela
tive c
olo
ny n
um
ber
(perc
en
tag
e c
han
ge)
H-Ras(V12)- transformed cells:
Rela
tive c
olo
ny n
um
ber
(perc
en
tag
e c
han
ge)
H-Ras(V12)- transformed cells:
Wild type [H-Ras(V12)]
Lacta
te p
rod
uctio
n
(perc
en
tag
e c
han
ge)
gf
Wild type [H-Ras(V12)]G
luco
se c
on
su
mp
tio
n
(perc
en
tag
e c
han
ge)
RelA wild type RelA knockout p53 wild type p53 knockout
RelA wild type RelA knockout p53 wild type p53 knockout
0
0.2
0.4
0.6
0.8
1.0
1.2
0
20
40
60
80
100
120
eG
FP
m-p
53
m-S
CO
2
eG
FP
ns
sh
RN
A
Rel
A
sh
RN
A
p53
sh
RN
A
Sco
2 sh
RN
A
0
50
100
150
–40
–30
–20
–10
0
10
20
–100
–50
0
50
100
150
RelA knockout RelA wild type
0
20
40
60
80
100
120
140
a
cR
elA
w
ild t
yp
e
Rel
A
kn
ocko
ut
p5
3
wild
typ
e
p53
kn
ocko
ut
H-R
as(V
12)
eG
FP
H-R
as(V
12)
eG
FP
RelA wild type RelA knockout [H-Ras(V12)] RelA knockout [H-Ras(V12)]
d
b
Figure 4 RelA suppresses oncogenic transformation by regulating energymetabolism. (a) Images of representative early passage RelA−/−, p53−/− andwild-type MEFs infected with pWPT–eGFP or pWPT–H-Ras(V12), showingtransformation features (that is, higher density, spindled morphology) inmutant cells, but not in wild-type cells. (b) Fold change in cell numbersin H-Ras(V12)-expressing MEFs relative to the respective eGFP-expressingcontrols after a 48h culture. (c) Top, percentage change in colony numberswith H-Ras(V12)-transformed cells relative to H-Ras(V12)-infected p53−/−
MEFs. Bottom, images of representative colonies. (d,e) Percentage change incolony numbers with H-Ras(V12)-transformed early passage RelA−/− MEFs
expressing eGFP, mouse (m)-p53 or m-SCO2 and H-Ras(V12)-transformedearly passage wild-type MEFs expressing eGFP relative to eGFP-expressingRelA−/− MEFs (d), and H-Ras(V12)-transformed early passage wild-typeMEFs expressing non-specific (ns), RelA, p53 or Sco2 shRNAs relativeto RelA-shRNA-expressing MEFs (e). (f,g) Percentage change in lactateproduction (f) and glucose consumption (g) in H-Ras(V12)-transformed MEFsrelative to the respective eGFP-expressing controls (see also SupplementaryFig. S1a,b, absolute levels in the absence of H-Ras(V12)). The data in b,c,fand g are from the cells in a. In b–g the values denote mean±s.e.m. n =3(b,f,g); n=4 (c,e). Scale bars: 50 µm.
data indicate that NF-κB may control metabolism also throughp53-independent mechanisms (C.M., S.C.L. & G.F., unpublished data),underscoring the concept that it governs global energy metabolismnetworks, beyond p53. Further studies will determine the significanceof these p53-independent functions of NF-κB. Nevertheless, herewe identify NF-κB as a central regulator of energy homeostasis andmetabolic adaptation.The role of NF-κB in Ras-induced transformation, however, remains
controversial14,15,21,28,29. A recent study indicated that RelA can promotethis transformation by upregulating GLUT3 (ref. 14). The status ofp53, however, is a confounding issue in this and other studies, asthe systems used were either immortalized fibroblasts harbouring adefective p53 pathway or p53−/−models14,15,21,29. By using early passagep53wild-typeMEFs, we show instead that theNF-κB-imposed restraint
of glucose metabolism and transformation is mediated by endogenousp53, which seemingly overrides other p53-independent glycolysis-associated activities of NF-κB. Consistently, NF-κB functions as aninhibitor of proliferation and a tumour suppressor in some tissues3,28,30.Notwithstanding, NF-κB more often promotes progression and
survival in cancer3,29,31. In this regard, our data indicate that NF-κBplays this pro-tumorigenic role in part by enabling cancer growthduring metabolic stress, potentially permitting adaptation to hypoxicand hypoglycaemic environments. These findings are consistent withprevious studies showing that mitochondrial metabolism is requiredfor tumorigenesis32,33. Interestingly, the dichotomy we report for thepro- and anti-tumorigenic metabolic activities of NF-κB has beennoted previously for many other oncogenes and tumour suppressors,including p53 (refs 1,11,19,24). However, NF-κB is often upregulated
NATURE CELL BIOLOGY VOLUME 13 | NUMBER 10 | OCTOBER 2011 1277
© 2011 Macmillan Publishers Limited. All rights reserved.
L E T T ERS
a c
b
ns s
hR
NA
RelA
β-actin
Rel
A s
hR
NA
Days after GS
Perc
en
tag
e o
f su
rviv
al
Perc
en
tag
e o
f su
rviv
al
ns shRNARelA shRNA
ns shRNA
RelA shRNA
PBS
MET
ns shRNA
RelA shRNA
Tu
mo
ur
vo
lum
e (m
m3)
∗∗
∗ ∗∗∗
PBS MET
ns
sh
RN
A
Rel
A
sh
RN
A ns
sh
RN
A
Rel
A
sh
RN
A
RelA Sco2 Sco2RelA
Mouse 2Mouse 1Mouse 2Mouse 1
ns shRNARelA shRNA
Rela
tive e
xp
ressio
n
0
20
40
60
80
100
120
0 2 4 6 8
0
20
40
60
80
100
120
+ – +GS– + +MET
0
20
40
60
80
100
0
50100
150200
250300
350
0
200
400
600
800
1,000
0
500
1,000
1,500
2,000
2,500
Tu
mo
ur
vo
lum
e (m
m3)
0
20
40
60
80
100
0
50100
150200
250300
350
0
200
400
600
800
1,000
0
500
1,000
1,500
2,000
2,500
18Time (d): 14117
0
0.4
0.8
1.2
0
0.4
0.8
1.2
0
0.4
0.8
1.2
0
0.4
0.8
1.2d e
Figure 5 NF-κB promotes metabolic adaptation in cancer in vivo.(a) Left, viability of CT-26 cells expressing non-specific (ns) or RelAshRNAs before and after glucose starvation (GS). Right, western blotsshowing RelA-knockdown efficiency. (b) Survival of the cells in a aftera 4-day treatment with glucose starvation, metformin (MET) or glucosestarvation plus metformin. (c) Growth of CT-26 tumours expressing
non-specific or RelA shRNAs in nude mice treated with metforminor PBS. (d) Images of representative tumours from c. (e) qRT-PCRshowing the relative RelA and Sco2 levels in tumours isolated fromtwo representative metformin-treated mice at day 14. In a–c and ethe values denote mean±s.e.m. n = 3 (a,b,e); n = 9 (c); ∗P < 0.05;∗∗P <0.01.
in cancer, and p53 is often mutated. Our data, nevertheless, do notexclude that in some tumours NF-κB may exercise its metabolicand pro-tumorigenic functions also through mutated p53. Althoughfurther studies are required to address this issue, our findings establishthe physiological significance of the NF-κB-dependent control ofenergy metabolism to metabolic adaptation in cancer in vivo, and theydefine a bioenergetic pathway by which NF-κB can promote tumourprogression and survival, independently of the regulation of apoptosisor inflammation. These findings have therapeutic implications, as theyindicate that NF-κB inhibitors may enhance the anti-cancer efficacy ofmetabolic drugs. �
METHODSMethods and any associated references are available in the onlineversion of the paper at http://www.nature.com/naturecellbiology
Note: Supplementary Information is available on the Nature Cell Biology website
ACKNOWLEDGEMENTSWe thankM. Pagano, F. Dazzi, P. Ashton-Rickardt, F. Marelli-Berg and G. Screatonfor critical comments on the manuscript. We also thank K. Ryan (Beatson Institutefor Cancer Research, Glasgow, UK) for the eGFP–LC3 plasmid; T. Lindstenand C. B. Thompson (University of Pennsylvania, Philadelphia, USA) for theimmortalized Bax−/−/Bak−/− MEFs; D. Trono (Ecole Polytechnique Fédérale deLausanne, Lausanne, Switzerland) for the pWPT lentiviral vector; C. Chevtzoff andD. G. Hardie for assistance with the use of the Seahorse machine; and K. R. Chngfor assistance with the analyses of the p53 promoter. C.M. was supported in partby a fellowship from AIRC (Italy). S.C.L. is supported by a scholarship fromA*STAR (Singapore). M.M. is supported by a fellowship from the Pasteur Institute,Cenci Bolognetti Foundation (Italy). This work was supported by NIH grants R01CA084040 andR01CA098583 andCancerResearchUKgrantC26587/A8839 toG.F.,and NIH grant R01 CA123067 to N.S.C.
AUTHOR CONTRIBUTIONSC.M. first observed the glucose addiction exhibited by RelA-null cells. C.M. andS.C.L. carried out the further experimental characterization of this phenomenon andmost of the analyses shown. E.A. and S.R. carried out the oxygen consumption assays.A.K.T. carried out the cell-cycle analysis and helped with in vivo studies. L.T. carriedout the immunoblot analyses of apoptosis and autophagy and the in vitrometabolicanalyses of CT-26 cells. E.D.S. and A.A.B. generated the early passage p53−/−
and RelA−/− MEFs, respectively, as well as the early passage wild-type controlsfrom littermates. G.F., C.M. and S.C.L. wrote the manuscript and conceived theexperiments. N.S.C. and V.T. contributed to the design of some of the experimentsandmade substantial critical revision to themanuscript. C.M., E.A., A.K.T., L.T. andM.M. carried out the experiments during revision of the manuscript. All authorsdiscussed and revised the manuscript.
COMPETING FINANCIAL INTERESTSThe authors declare no competing financial interests.
Published online at http://www.nature.com/naturecellbiologyReprints and permissions information is available online at http://www.nature.com/reprints
1. Jones, R. G. & Thompson, C. B. Tumor suppressors and cell metabolism: a recipefor cancer growth. Genes Dev. 23, 537–548 (2009).
2. Vander Heiden, M. G., Cantley, L. C. & Thompson, C. B. Understanding theWarburg effect: the metabolic requirements of cell proliferation. Science 324,1029–1033 (2009).
3. Karin, M. Nuclear factor-κB in cancer development and progression. Nature 441,431–436 (2006).
4. Leary, S. C. Redox regulation of SCO protein function: controlling copper at amitochondrial crossroad. Antioxid. Redox Signal. 13, 1403–1416 (2010).
5. Vousden, K. H. & Ryan, K. M. p53 and metabolism. Nat. Rev. Cancer 9,691–700 (2009).
6. Jones, R. G. et al. AMP-activated protein kinase induces a p53-dependent metaboliccheckpoint. Mol. Cell 18, 283–293 (2005).
7. Matoba, S. et al. p53 regulates mitochondrial respiration. Science 312,1650–1653 (2006).
1278 NATURE CELL BIOLOGY VOLUME 13 | NUMBER 10 | OCTOBER 2011
© 2011 Macmillan Publishers Limited. All rights reserved.
L E T T ERS
8. Cuezva, J. M. et al. The tumor suppressor function of mitochondria: translation intothe clinics. Biochim. Biophys. Acta 1792, 1145–1158 (2009).
9. Wu, M. et al. Multiparameter metabolic analysis reveals a close linkbetween attenuated mitochondrial bioenergetic function and enhancedglycolysis dependency in human tumor cells. Am. J. Physiol. Cell Physiol.292, 125–136 (2007).
10. Maiuri, M. C., Zalckvar, E., Kimchi, A. & Kroemer, G. Self-eating and self-killing: crosstalk between autophagy and apoptosis. Nat. Rev. Mol. Cell Biol. 8,741–752 (2007).
11. Vousden, K. H. & Prives, C. Blinded by the light: the growing complexity of p53. Cell137, 413–431 (2009).
12. Kirch, H. C. et al. Expression of human p53 requires synergistic activation oftranscription from the p53 promoter by AP-1, NF-κB and Myc/Max. Oncogene 18,2728–2738 (1999).
13. Ide, T. et al. GAMT, a p53-inducible modulator of apoptosis, is critical for theadaptive response to nutrient stress. Mol. Cell 36, 379–392 (2009).
14. Kawauchi, K., Araki, K., Tobiume, K. & Tanaka, N. p53 regulates glucose metabolismthrough an IKK-NF-κB pathway and inhibits cell transformation. Nat. Cell Biol. 10,611–618 (2008).
15. Meylan, E. et al. Requirement for NF-κB signalling in a mouse model of lungadenocarcinoma. Nature 462, 104–107 (2009).
16. Schwartzenberg-Bar-Yoseph, F., Armoni, M. & Karnieli, E. The tumor suppressor p53down-regulates glucose transporters GLUT1 and GLUT4 gene expression. CancerRes. 64, 2627–2633 (2004).
17. Kondoh, H. et al. Glycolytic enzymes can modulate cellular life span. Cancer Res.65, 177–185 (2005).
18. Bensaad, K. et al. TIGAR, a p53-inducible regulator of glycolysis and apoptosis. Cell126, 107–120 (2006).
19. Vousden, K. H. Alternative fuel—another role for p53 in the regulation of metabolism.Proc. Natl Acad. Sci. USA 107, 7117–7118 (2010).
20. Locasale, J. W., Cantley, L. C. & Vander Heiden, M. G. Cancer’s insatiable appetite.Nat. Biotechnol. 10, 916–917 (2009).
21. Hanson, J. L., Hawke, N. A., Kashatus, D. & Baldwin, A. S. The nuclear factor-κBsubunits RelA/p65 and c-Rel potentiate but are not required for Ras-induced cellulartransformation. Cancer Res. 64, 7248–7255 (2004).
22. Luo, J. L. et al. Inhibition of NF-κB in cancer cells converts inflammation-inducedtumour growth mediated by TNFα to TRAIL-mediated tumour regression. Cancer Cell.6, 297–305 (2004).
23. Greten, F. R. et al. IKKβ links inflammation and tumourigenesis in a mouse modelof colitis-associated cancer. Cell 118, 285–296 (2004).
24. Buzzai, M. et al. Systemic treatment with the antidiabetic drug metformin selectivelyimpairs p53-deficient tumor cell growth. Cancer Res. 67, 6745–6752 (2007).
25. Tergaonkar, V. & Perkins, N. D. p53 and NF-κB crosstalk: IKKα tips the balance.Mol. Cell 26, 158–159 (2007).
26. Sablina, A. A. et al. The antioxidant function of the p53 tumor suppressor. Nat. Med.11, 1306–1313 (2005).
27. Wang, J. et al. RelA/p65 functions to maintain cellular senescence by regulatinggenomic stability and DNA repair. EMBO Rep. 10, 1272–1278 (2009).
28. Dajee, M. et al. NF-κB blockade and oncogenic Ras trigger invasive human epidermalneoplasia. Nature 421, 639–643 (2003).
29. Gapuzan, M-E. R. et al. Immortalized fibroblasts from NF-κB RelA knockout miceshow phenotypic heterogeneity and maintain increased sensitivity to tumor necrosisfactor α after transformation by v-Ras. Oncogene 24, 6574–6583 (2005).
30. He, G. et al. Hepatocyte IKKβ/NF-κB inhibits tumor promotion and progressionby preventing oxidative stress-driven STAT3 activation. Cancer Cell. 17,286–297 (2010).
31. Bassères, D. S., Ebbs, A., Levantini, E. & Baldwin, A. S. Requirement of theNF-κB subunit p65/RelA for K-Ras-induced lung tumorigenesis. Cancer Res. 71,3537–3546 (2010).
32. Weinberg, F. et al. Mitochondrial metabolism and ROS generation are es-sential for Kras-mediated tumourigenicity. Proc. Natl Acad. Sci. USA 107,8788–8793 (2010).
33. Guo, J. Y. et al. Activated Ras requires autophagy to maintain oxidative metabolismand tumourigenesis. Genes Dev. 25, 460–470 (2011).
NATURE CELL BIOLOGY VOLUME 13 | NUMBER 10 | OCTOBER 2011 1279
© 2011 Macmillan Publishers Limited. All rights reserved.
METHODS DOI: 10.1038/ncb2324
METHODSAntibodies and reagents. The antibodies used for western blots were: anti-RelA,(1:10,000; Assay Design); anti-caspase-8 (1:1,000; Alexis); anti-PARP1 (1:100;Calbiochem); anti-p53 (1:2,000; Oncogene); anti-beclin1 (1:1,000), anti-p21(1:1,000; BD Biosciences); anti-HMGB1 (1:500; Abcam); anti-LC3 (1:100; Abgent);anti-ATG7 (1:200), anti-TSC2 (1:1,000), anti-P-TSC2 (1:1,000), anti-ACC (1:1,000),anti-P-ACC (1:1,000), anti-Akt (1:1,000), anti-P-Akt (1:1,000), anti-P-p53(Ser15) (1:1,000), anti-AMPKα (1:1,000), anti-P-AMPKα (1:1,000), anti-p70-S6K(1:1,000), anti-P-p70-S6K (1:2,000), anti-IKKβ (1:1,000), anti-P-IKKα/β (1:1,000),anti-caspase-3 (1:1,000), anti-caspase-9 (1:1,000), anti-P-IκBα (1:1,000), anti-c-Rel(1:1,000), anti-p38 (1:1,000), anti-P-p38 (1:1,000), anti-ERK1/2 (1:1,000), anti-P-ERK1/2 (1:1,000; Cell Signaling); anti-MDM2 (1:1,000), anti-β-actin (1:3,000;Santa Cruz Biotechnology); anti-p62 (1:1,000; Sigma-Aldrich); anti-RelA (1:1,000)and rabbit control IgG (1:1,000) for chromatin immunoprecipitation were fromSanta Cruz Biotechnology. Anti-BrdU (1:20) for cell-cycle analyses was fromeBioscience. The reagents used were: mouse TNFα (1,000Uml−1; Peprotech);the IKKβ inhibitor SC-514 (20 or 100 µM; Calbiochem); z-VADfmk (50 µM;Alexis); MG132 (0.5 or 50 µM), 3-methyladenine (5mM), chloroquine (5 µM),metformin (2mM), bafilomycin A1 (100 nM), daunorubicin (5 µM), cycloheximide(0.1 µgml−1 or 10 µgml−1; Sigma-Aldrich); rapamycin (100 nM; Calbiochem);BrdU (Roche); 7-AAD (BD Biosciences). Antimycin (1 µM) and rotenone (1 µM)used for mitochondrial oxygen consumption analyses were from Sigma-Aldrich.
Cell culture and lentiviral infections. Early passage RelA−/−, RelA+/+, p53−/−
and p53+/+ MEFs were derived from 14-day-old mouse embryos using standardmethods and used at passage (p)1 to p5. Immortalized wild-type and RelA−/−
MEFs were described previously34. Immortalized Bax−/−/Bak−/− MEFs wereprovided by C.B. Thompson. The CT-26 wild-type mouse colon carcinoma cellline was purchased from ATCC. Cells were cultured in high-glucose Dulbecco’smodified Eagle’s medium (DMEM; with glutamine, without sodium pyruvate)supplemented with 10% fetal bovine serum (FBS; Sigma-Aldrich), antibiotics(100 µgml−1 penicillin and 100 µgml−1 streptomycin) and 1mM glutamine.For glucose starvation, early passage MEFs were cultured in DMEM with noglucose (with glutamine, without sodium pyruvate), supplemented with 10%dialysed FBS (Sigma-Aldrich), antibiotics and 2mM sodium pyruvate. Glucosestarvation with immortalized MEFs was carried out in the same DMEMwith no glucose, supplemented with 10% FBS, antibiotics and 2mM sodiumpyruvate, in the presence of 6mM d-glucose, unless otherwise specified. Glucosestarvation with CT-26 wild-type cells was carried out as for immortalizedMEFs, in the presence of 14mM d-glucose. For serum deprivation, cellswere cultured in DMEM with no glucose, supplemented with antibioticsand 2mM sodium pyruvate, without FBS. Production of high-titre lentiviralpreparations in HEK293T cells and lentiviral infections were carried out asdescribed previously34,35.
Lentiviral vectors. The targeting shRNAs used are listed in SupplementaryTable SI. The DNA sequences encoding shRNAs specific for eGFP, fireflyluciferase and mouse RelA (RelA shRNA), caspase-8, beclin1, Atg7, p53 (p53shRNA, p53-2 shRNA), laminA/C and cyclophilinB, as well as the control non-specific sequences, ns and ns2, were introduced between the BamHI and HpaIrestriction sites of the lentiviral vector pLentiLox3.7 (ref. 35). A variant ofpLentiLox3.7 (pLL–red), expressing enhanced red fluorescent protein (eRFP), wasused to deliver non-specific and RelA-specific shRNAs to immortalized MEFsin Supplementary Fig. S3e. The DNA-coding sequences of the shRNAs specificfor mouse Glut1 (also known as Slc2a1), Glut3 (also known as Slc2a3), Pgm2or Sco2, and the additional RelA-specific sequences, RelA-2 shRNA and RelA-3shRNA, as well as the control sequence, shc003v, in the pLKO.1 lentiviral vectorwere purchased from Sigma-Aldrich. The pWPT lentiviral vector, expressingeGFP, has been described previously36. The full-length complementary DNAsof human H-Ras(V12), human RelA and mouse p53 were introduced betweenthe BamHI and SalI restriction sites of pWPT to replace eGFP. The cDNAsof mouse Sco2 and LC3 were purchased from Eurofins MWG Operon andobtained from K. Ryan, respectively, then cloned between the same restriction sitesof pWPT.
Measurements of glucose, lactate, ATP and oxygen. Glucose consumption,lactate secretion and intracellular ATP levels were measured as describedpreviously13,14. Briefly, cells were seeded onto 60-mm tissue-culture dishes, mediawere changed 6 h later and assays were carried out after a 48-h culture in normalmedium (basal determinations) or inmedium containing no or low glucose (glucosestarvation), as specified. Glucose and lactate concentrations were measured in theculture media using the Glucose Assay Kit and the Lactate Assay Kit II (Biovision),respectively, according to the manufacturer’s instructions. Glucose consumptionwas extrapolated by subtracting the measured glucose concentrations in the mediafrom the original 25mM glucose concentration. Intracellular ATP levels were
determined in cell lysates using the ATP Bioluminescent Somatic Cell Assay Kit(Sigma-Aldrich), according to the manufacturer’s instructions. Oxygen uptake wasmeasured in 24-well plates using a Seahorse XF24 extracellular flux analyser9. Cellswere seeded at 2–5× 10⁴ cells per well in 8.3 g l−1 DMEM base medium (pH7.4)supplemented with 200mM GlutaMax-1, 100mM Na pyruvate, 32mM NaCl and40 µM phenol red, in the presence of either 25mM (basal determinations) or 6mM(glucose starvation) glucose, and oxygen consumption was measured continuouslyas described previously9. Mitochondrial oxygen consumption rates were calculatedby subtracting the residual oxygen consumption in the cells after treatment withantimycin (1 µM) plus rotenone (1 µM). All values were finally normalized on aper-cell basis.
Soft-agar colony assays. Soft-agar colony formation was assessed using standardmethods14. Briefly, early passage MEFs were infected with the viruses indicated andpoured 6 days later at a density of 2×10⁴ cells per dish together with 0.5%-agaroseF12mediumonto a pre-solidified bottom layer of 0.5% agarose in the samemedium,in 60-mm tissue-culture dishes. Colony formation was assessed 3 weeks later.
Cell death and macroautophagy analyses. Cell viability and HMGB1 extracel-lular release were assessed by trypan blue exclusion assays and western blotting,respectively, as reported previously34,37. HMGB1 assessment was carried out both inmedia and cellular fractions. For the analyses of macroautophagy, cells were infectedwith pWPT–eGFP–LC3, expressing an eGFP fusion protein of LC3, and eGFP–LC3translocation was monitored as described previously38. Macroautophagic vesicleswere quantified by counting 100 cells and scoring as positive those showing any signsof punctuate, rather than diffuse, eGFP–LC3 fluorescence, using an inverted LeicaSP5 confocal microscope.
Cell-cycle analyses. Cell-cycle analyses were carried out using BrdU and 7-AADlabelling, as described previously39. Briefly, early passage or immortalized MEFswere seeded at a density of 1× 10⁶ cells per dish in 100-mm tissue-culture dishesand 24 h later either left untreated or subjected to glucose starvation (0mM and6mM glucose, respectively) for a further 48 h. Cells were then incubated withBrdU (30 µM) for 3 h, trypsinized, fixed in 70% ethanol and permeabilized with2N HCl and 0.5% Triton X-100, followed by neutralization in 0.1M sodium borate.Samples were finally stained with FITC-labelled anti-BrdU antibody and 7-AAD,and fluorescence signals were acquired using a FACS Caliber (Beckman).
Quantitative real-time polymerase-chain reaction. Total RNA was extractedwith Trizol, and purified using the PureLink RNA mini-kit (Invitrogen). RNA(1 µg) was added as a template to reverse-transcriptase reactions carried out usingthe GeneAmp RNA PCR Kit (Applied Biosystems). Quantitative real-time PCRs(qRT-PCRs) were carried out with the resulting cDNAs in triplicate using SYBRGreen PCR Master Mix (Applied Biosystems), the primers listed in SupplementaryTable SII and an ABI 7900 real-time PCR machine. Experimental Ct valueswere normalized to hypoxanthine–guanine phosphoribosyltransferase (HPRT), andrelative mRNA expression was calculated versus a reference sample.
Chromatin immunoprecipitation. Chromatin immunoprecipitationwas carriedout as described previously40. Briefly, unstimulated, TNFα-treated and glucose-starved immortalized RelA−/− and wild-type MEFs were treated with 1%formaldehyde for 10min at room temperature to crosslink protein–DNAcomplexes;then reactions were quenched using 125mM glycine. Chromatin extracts weresonicated with a Bioruptor sonicator (Diagenode), and protein–DNA complexeswere immunoprecipitated using anti-RelA or rabbit control IgG antibodies.Quantitative PCR (qPCR) assays were then carried out using anti-RelA and IgGprecipitates and the primers listed in Supplementary Table SII, encompassing theκB-containing regions of the p53 and IκBα promoters or control genomic regions(control 1–3), to assess RelA DNA-binding specificity. RelA-specific DNA bindingwas calculated relative to the background signal yielded by control IgG and expressedas fold change.
Mouse allografts. Early passage CT-26 wild-type cells expressing non-specific orRelA shRNAs were collected, washed twice with PBS, and resuspended in PBSat a concentration of 1× 10⁶ cells ml−1 before being inoculated subcutaneouslyinto both flanks (non-specific shRNA cells on the right flank, and RelA-shRNAcells on the left flank; 1× 10⁵ cells per flank) of nude mice (6-week-old females;Charles River). Metformin was dissolved in PBS (50mgml−1) and administeredintraperitoneally daily (250mg× kg body weight) from day 3 after tumour cellinjection. The control group received PBS, using the same administration scheduleand route. Tumour volume (mm3) was measured twice a week at the indicatedtimes and estimated from caliper measurements using the following formula:volume= A×B2/2 (with A being the larger diameter, and B the smaller diameterof the tumour). Experiments were carried out under the Home Office Authority(Cambridge, UK; PPL 70/6874).
NATURE CELL BIOLOGY
© 2011 Macmillan Publishers Limited. All rights reserved.
DOI: 10.1038/ncb2324 METHODS
Statistical analysis. Results are expressed as mean± s.e.m. from an appropriatenumber of samples as indicated in the figure legends. Student’s t -test was used todetermine statistical significance.
34. Pham, C. G. et al. Ferritin heavy chain upregulation by NF-κB inhibits TNFα-induced apoptosis by suppressing reactive oxygen species. Cell 119,529–542 (2004).
35. Yang, H. et al. TNF-α inhibits asbestos-induced cytotoxicity via a NF-κB-dependentpathway, a possible mechanism for asbestos-induced oncogenesis. Proc. Natl Acad.Sci. USA 103, 10397–10402 (2006).
36. Dull, T. et al. A third-generation lentivirus vector with a conditional packaging system.J. Virol. 72, 8463–8471 (1998).
37. Zong, W. X. et al. Alkylating DNA damage stimulates a regulated form of necroticcell death. Genes Dev. 18, 1272–1282 (2004).
38. Crighton, D. et al. DRAM, a p53-induced modulator of autophagy, is critical forapoptosis. Cell 126, 121–134 (2006).
39. Zinszner, H. et al. CHOP is implicated in programmed cell death in response toimpaired function of the endoplasmic reticulum. Genes Dev. 12, 982–995 (1998).
40. Fullwood, M. J. et al. An oestrogen-receptor-α-bound human chromatin interactome.Nature 462, 58–64 (2009).
NATURE CELL BIOLOGY
© 2011 Macmillan Publishers Limited. All rights reserved.
S U P P L E M E N TA RY I N F O R M AT I O N
WWW.NATURE.COM/NATURECELLBIOLOGY 1
DOI: 10.1038/ncb2324
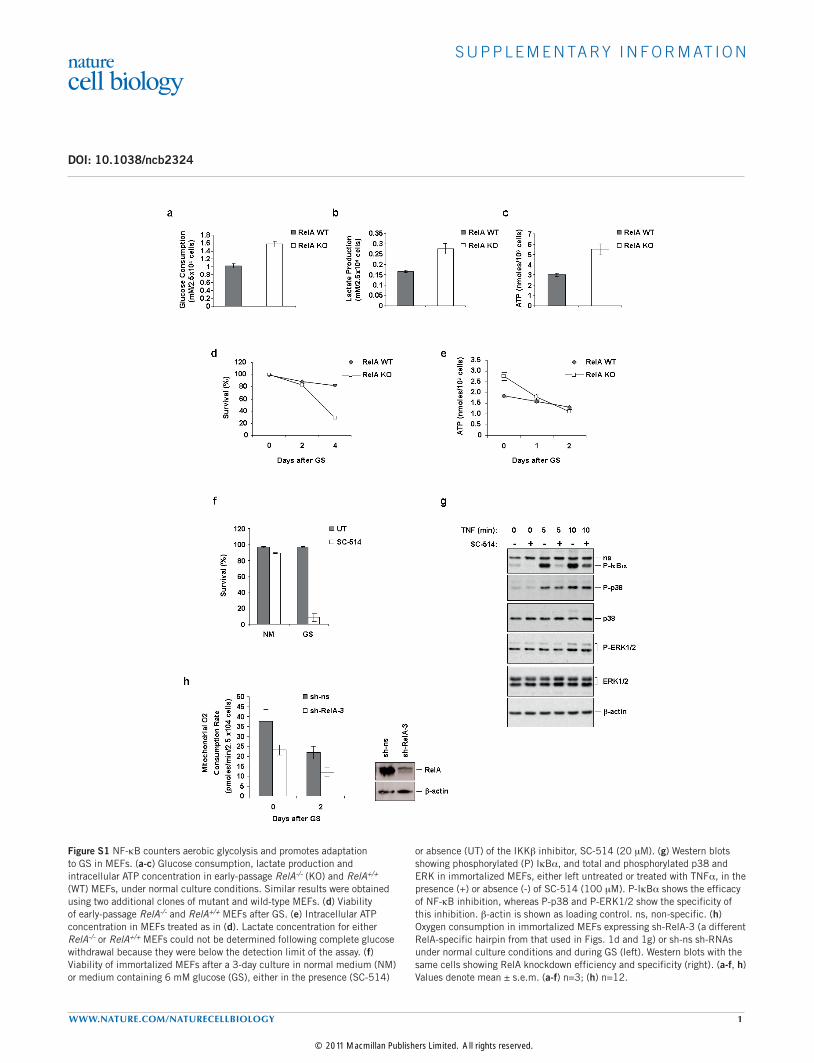
Figure S1 NF-kB counters aerobic glycolysis and promotes adaptation to GS in MEFs. (a-c) Glucose consumption, lactate production and intracellular ATP concentration in early-passage RelA-/- (KO) and RelA+/+ (WT) MEFs, under normal culture conditions. Similar results were obtained using two additional clones of mutant and wild-type MEFs. (d) Viability of early-passage RelA-/- and RelA+/+ MEFs after GS. (e) Intracellular ATP concentration in MEFs treated as in (d). Lactate concentration for either RelA-/- or RelA+/+ MEFs could not be determined following complete glucose withdrawal because they were below the detection limit of the assay. (f) Viability of immortalized MEFs after a 3-day culture in normal medium (NM) or medium containing 6 mM glucose (GS), either in the presence (SC-514)
or absence (UT) of the IKKb inhibitor, SC-514 (20 mM). (g) Western blots showing phosphorylated (P) IkBa, and total and phosphorylated p38 and ERK in immortalized MEFs, either left untreated or treated with TNFa, in the presence (+) or absence (-) of SC-514 (100 mM). P-IkBa shows the efficacy of NF-kB inhibition, whereas P-p38 and P-ERK1/2 show the specificity of this inhibition. b-actin is shown as loading control. ns, non-specific. (h) Oxygen consumption in immortalized MEFs expressing sh-RelA-3 (a different RelA-specific hairpin from that used in Figs. 1d and 1g) or sh-ns sh-RNAs under normal culture conditions and during GS (left). Western blots with the same cells showing RelA knockdown efficiency and specificity (right). (a-f, h) Values denote mean ± s.e.m. (a-f) n=3; (h) n=12.
© 2011 Macmillan Publishers Limited. All rights reserved.
S U P P L E M E N TA RY I N F O R M AT I O N
2 WWW.NATURE.COM/NATURECELLBIOLOGY
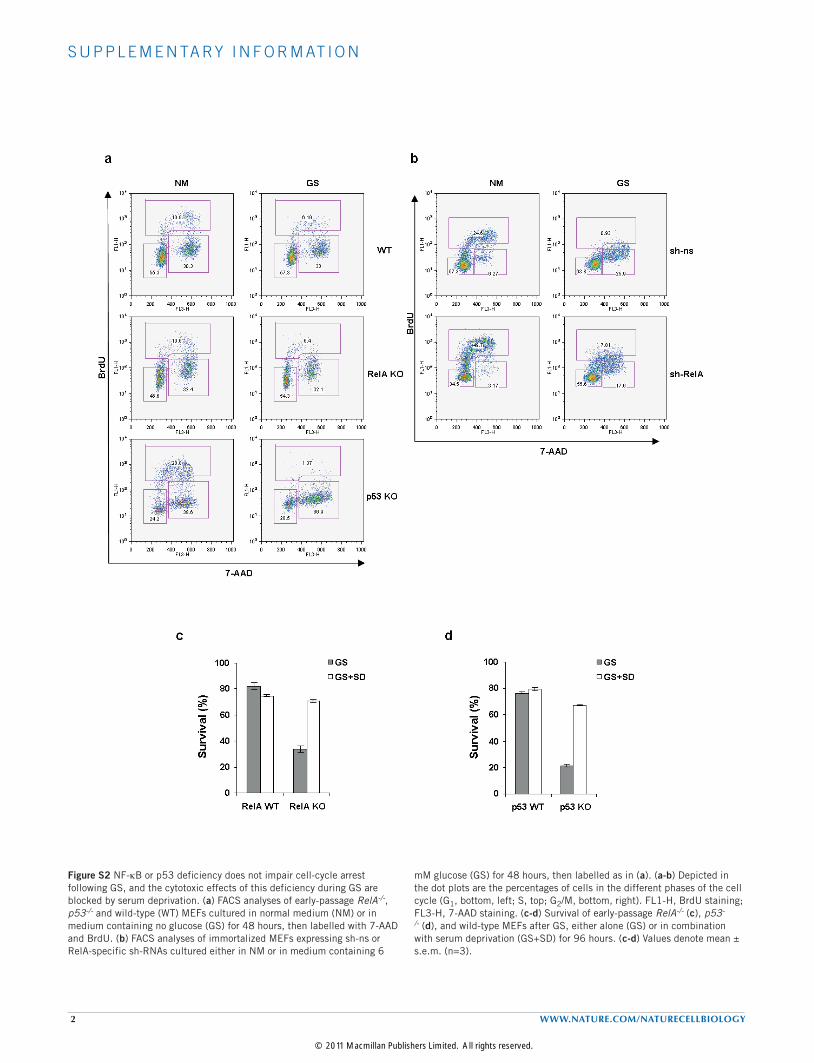
Figure S2 NF-kB or p53 deficiency does not impair cell-cycle arrest following GS, and the cytotoxic effects of this deficiency during GS are blocked by serum deprivation. (a) FACS analyses of early-passage RelA-/-, p53-/- and wild-type (WT) MEFs cultured in normal medium (NM) or in medium containing no glucose (GS) for 48 hours, then labelled with 7-AAD and BrdU. (b) FACS analyses of immortalized MEFs expressing sh-ns or RelA-specific sh-RNAs cultured either in NM or in medium containing 6
mM glucose (GS) for 48 hours, then labelled as in (a). (a-b) Depicted in the dot plots are the percentages of cells in the different phases of the cell cycle (G1, bottom, left; S, top; G2/M, bottom, right). FL1-H, BrdU staining; FL3-H, 7-AAD staining. (c-d) Survival of early-passage RelA-/- (c), p53-/- (d), and wild-type MEFs after GS, either alone (GS) or in combination with serum deprivation (GS+SD) for 96 hours. (c-d) Values denote mean ± s.e.m. (n=3).
© 2011 Macmillan Publishers Limited. All rights reserved.
S U P P L E M E N TA RY I N F O R M AT I O N
WWW.NATURE.COM/NATURECELLBIOLOGY 3
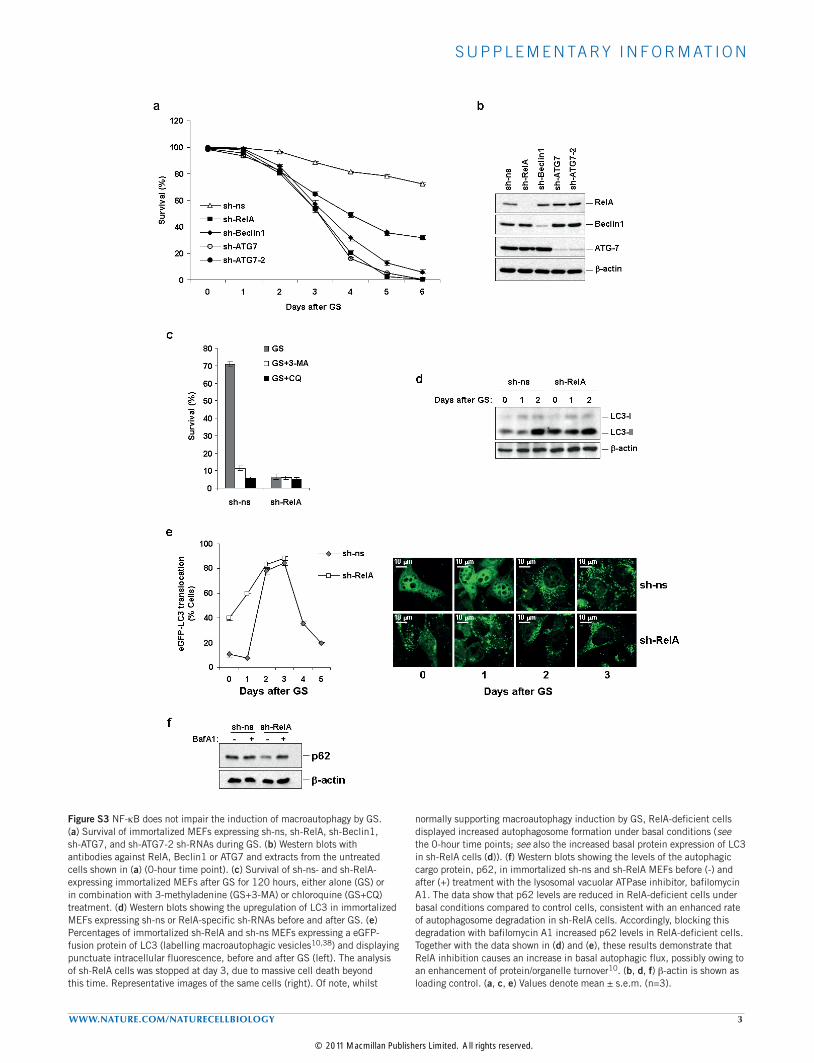
Figure S3 NF-kB does not impair the induction of macroautophagy by GS. (a) Survival of immortalized MEFs expressing sh-ns, sh-RelA, sh-Beclin1, sh-ATG7, and sh-ATG7-2 sh-RNAs during GS. (b) Western blots with antibodies against RelA, Beclin1 or ATG7 and extracts from the untreated cells shown in (a) (0-hour time point). (c) Survival of sh-ns- and sh-RelA-expressing immortalized MEFs after GS for 120 hours, either alone (GS) or in combination with 3-methyladenine (GS+3-MA) or chloroquine (GS+CQ) treatment. (d) Western blots showing the upregulation of LC3 in immortalized MEFs expressing sh-ns or RelA-specific sh-RNAs before and after GS. (e) Percentages of immortalized sh-RelA and sh-ns MEFs expressing a eGFP-fusion protein of LC3 (labelling macroautophagic vesicles10,38) and displaying punctuate intracellular fluorescence, before and after GS (left). The analysis of sh-RelA cells was stopped at day 3, due to massive cell death beyond this time. Representative images of the same cells (right). Of note, whilst
normally supporting macroautophagy induction by GS, RelA-deficient cells displayed increased autophagosome formation under basal conditions (see the 0-hour time points; see also the increased basal protein expression of LC3 in sh-RelA cells (d)). (f) Western blots showing the levels of the autophagic cargo protein, p62, in immortalized sh-ns and sh-RelA MEFs before (-) and after (+) treatment with the lysosomal vacuolar ATPase inhibitor, bafilomycin A1. The data show that p62 levels are reduced in RelA-deficient cells under basal conditions compared to control cells, consistent with an enhanced rate of autophagosome degradation in sh-RelA cells. Accordingly, blocking this degradation with bafilomycin A1 increased p62 levels in RelA-deficient cells. Together with the data shown in (d) and (e), these results demonstrate that RelA inhibition causes an increase in basal autophagic flux, possibly owing to an enhancement of protein/organelle turnover10. (b, d, f) b-actin is shown as loading control. (a, c, e) Values denote mean ± s.e.m. (n=3).
© 2011 Macmillan Publishers Limited. All rights reserved.
S U P P L E M E N TA RY I N F O R M AT I O N
4 WWW.NATURE.COM/NATURECELLBIOLOGY
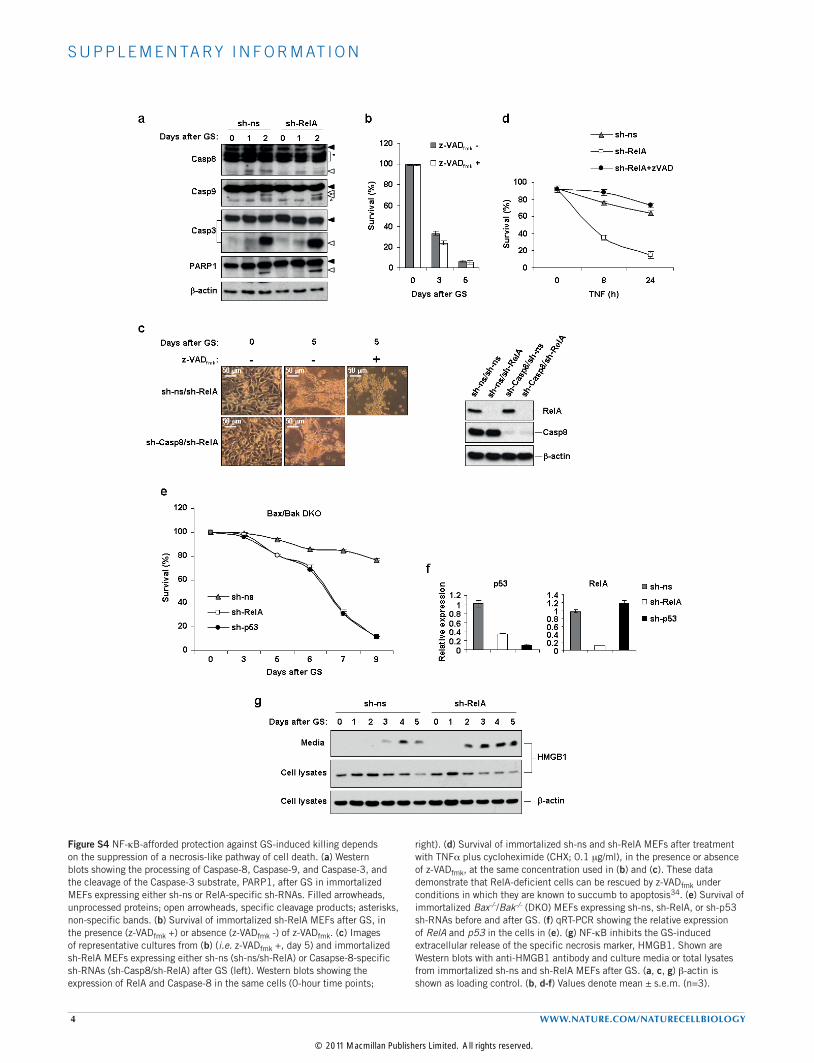
Figure S4 NF-kB-afforded protection against GS-induced killing depends on the suppression of a necrosis-like pathway of cell death. (a) Western blots showing the processing of Caspase-8, Caspase-9, and Caspase-3, and the cleavage of the Caspase-3 substrate, PARP1, after GS in immortalized MEFs expressing either sh-ns or RelA-specific sh-RNAs. Filled arrowheads, unprocessed proteins; open arrowheads, specific cleavage products; asterisks, non-specific bands. (b) Survival of immortalized sh-RelA MEFs after GS, in the presence (z-VADfmk +) or absence (z-VADfmk -) of z-VADfmk. (c) Images of representative cultures from (b) (i.e. z-VADfmk +, day 5) and immortalized sh-RelA MEFs expressing either sh-ns (sh-ns/sh-RelA) or Casapse-8-specific sh-RNAs (sh-Casp8/sh-RelA) after GS (left). Western blots showing the expression of RelA and Caspase-8 in the same cells (0-hour time points;
right). (d) Survival of immortalized sh-ns and sh-RelA MEFs after treatment with TNFa plus cycloheximide (CHX; 0.1 mg/ml), in the presence or absence of z-VADfmk, at the same concentration used in (b) and (c). These data demonstrate that RelA-deficient cells can be rescued by z-VADfmk under conditions in which they are known to succumb to apoptosis34. (e) Survival of immortalized Bax-/-/Bak-/- (DKO) MEFs expressing sh-ns, sh-RelA, or sh-p53 sh-RNAs before and after GS. (f) qRT-PCR showing the relative expression of RelA and p53 in the cells in (e). (g) NF-kB inhibits the GS-induced extracellular release of the specific necrosis marker, HMGB1. Shown are Western blots with anti-HMGB1 antibody and culture media or total lysates from immortalized sh-ns and sh-RelA MEFs after GS. (a, c, g) b-actin is shown as loading control. (b, d-f) Values denote mean ± s.e.m. (n=3).
© 2011 Macmillan Publishers Limited. All rights reserved.
S U P P L E M E N TA RY I N F O R M AT I O N
WWW.NATURE.COM/NATURECELLBIOLOGY 5
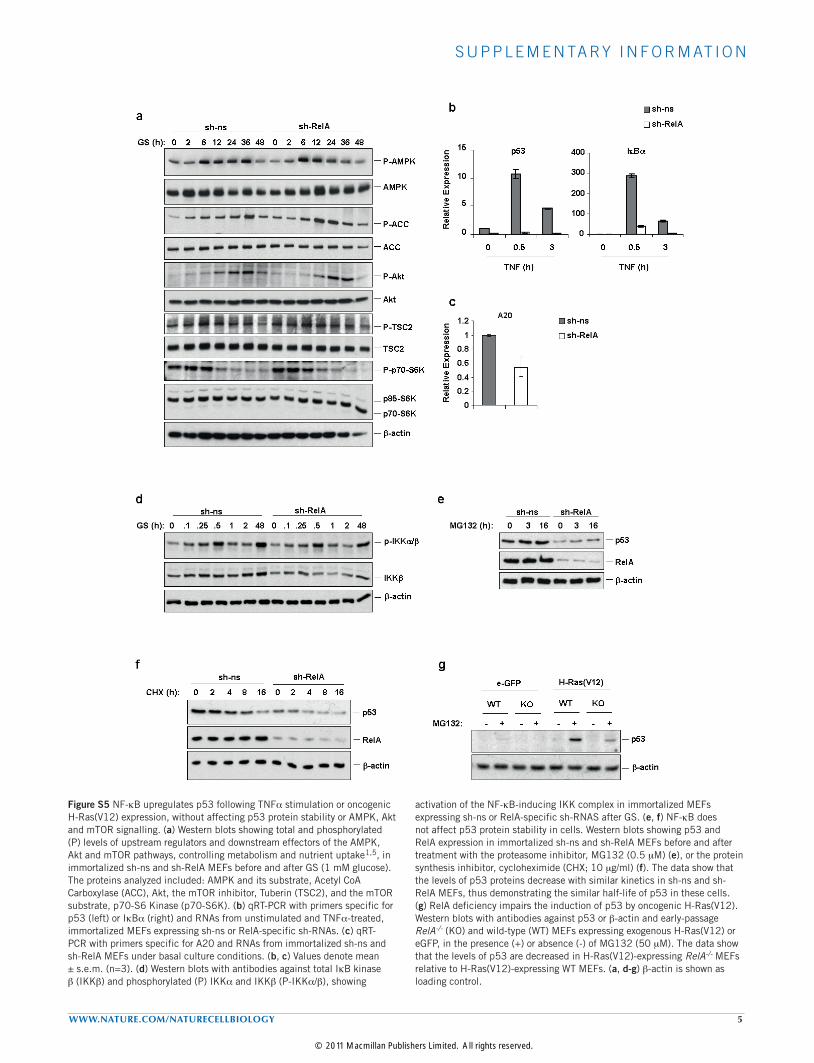
Figure S5 NF-kB upregulates p53 following TNFa stimulation or oncogenic H-Ras(V12) expression, without affecting p53 protein stability or AMPK, Akt and mTOR signalling. (a) Western blots showing total and phosphorylated (P) levels of upstream regulators and downstream effectors of the AMPK, Akt and mTOR pathways, controlling metabolism and nutrient uptake1,5, in immortalized sh-ns and sh-RelA MEFs before and after GS (1 mM glucose). The proteins analyzed included: AMPK and its substrate, Acetyl CoA Carboxylase (ACC), Akt, the mTOR inhibitor, Tuberin (TSC2), and the mTOR substrate, p70-S6 Kinase (p70-S6K). (b) qRT-PCR with primers specific for p53 (left) or IkBa (right) and RNAs from unstimulated and TNFa-treated, immortalized MEFs expressing sh-ns or RelA-specific sh-RNAs. (c) qRT-PCR with primers specific for A20 and RNAs from immortalized sh-ns and sh-RelA MEFs under basal culture conditions. (b, c) Values denote mean ± s.e.m. (n=3). (d) Western blots with antibodies against total IkB kinase b (IKKb) and phosphorylated (P) IKKa and IKKb (P-IKKa/b), showing
activation of the NF-kB-inducing IKK complex in immortalized MEFs expressing sh-ns or RelA-specific sh-RNAS after GS. (e, f) NF-kB does not affect p53 protein stability in cells. Western blots showing p53 and RelA expression in immortalized sh-ns and sh-RelA MEFs before and after treatment with the proteasome inhibitor, MG132 (0.5 mM) (e), or the protein synthesis inhibitor, cycloheximide (CHX; 10 mg/ml) (f). The data show that the levels of p53 proteins decrease with similar kinetics in sh-ns and sh-RelA MEFs, thus demonstrating the similar half-life of p53 in these cells. (g) RelA deficiency impairs the induction of p53 by oncogenic H-Ras(V12). Western blots with antibodies against p53 or b-actin and early-passage RelA-/- (KO) and wild-type (WT) MEFs expressing exogenous H-Ras(V12) or eGFP, in the presence (+) or absence (-) of MG132 (50 mM). The data show that the levels of p53 are decreased in H-Ras(V12)-expressing RelA-/- MEFs relative to H-Ras(V12)-expressing WT MEFs. (a, d-g) b-actin is shown as loading control.
© 2011 Macmillan Publishers Limited. All rights reserved.
S U P P L E M E N TA RY I N F O R M AT I O N
6 WWW.NATURE.COM/NATURECELLBIOLOGY
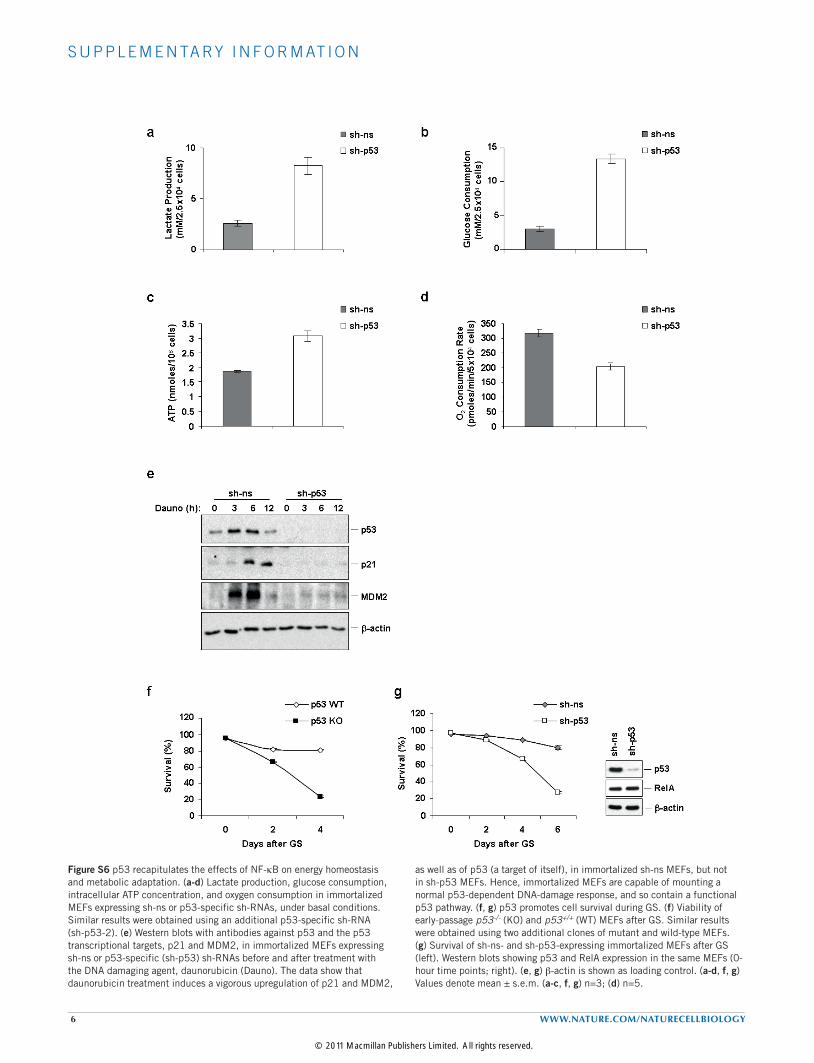
Figure S6 p53 recapitulates the effects of NF-kB on energy homeostasis and metabolic adaptation. (a-d) Lactate production, glucose consumption, intracellular ATP concentration, and oxygen consumption in immortalized MEFs expressing sh-ns or p53-specific sh-RNAs, under basal conditions. Similar results were obtained using an additional p53-specific sh-RNA (sh-p53-2). (e) Western blots with antibodies against p53 and the p53 transcriptional targets, p21 and MDM2, in immortalized MEFs expressing sh-ns or p53-specific (sh-p53) sh-RNAs before and after treatment with the DNA damaging agent, daunorubicin (Dauno). The data show that daunorubicin treatment induces a vigorous upregulation of p21 and MDM2,
as well as of p53 (a target of itself), in immortalized sh-ns MEFs, but not in sh-p53 MEFs. Hence, immortalized MEFs are capable of mounting a normal p53-dependent DNA-damage response, and so contain a functional p53 pathway. (f, g) p53 promotes cell survival during GS. (f) Viability of early-passage p53-/- (KO) and p53+/+ (WT) MEFs after GS. Similar results were obtained using two additional clones of mutant and wild-type MEFs. (g) Survival of sh-ns- and sh-p53-expressing immortalized MEFs after GS (left). Western blots showing p53 and RelA expression in the same MEFs (0-hour time points; right). (e, g) b-actin is shown as loading control. (a-d, f, g) Values denote mean ± s.e.m. (a-c, f, g) n=3; (d) n=5.
© 2011 Macmillan Publishers Limited. All rights reserved.
S U P P L E M E N TA RY I N F O R M AT I O N
WWW.NATURE.COM/NATURECELLBIOLOGY 7
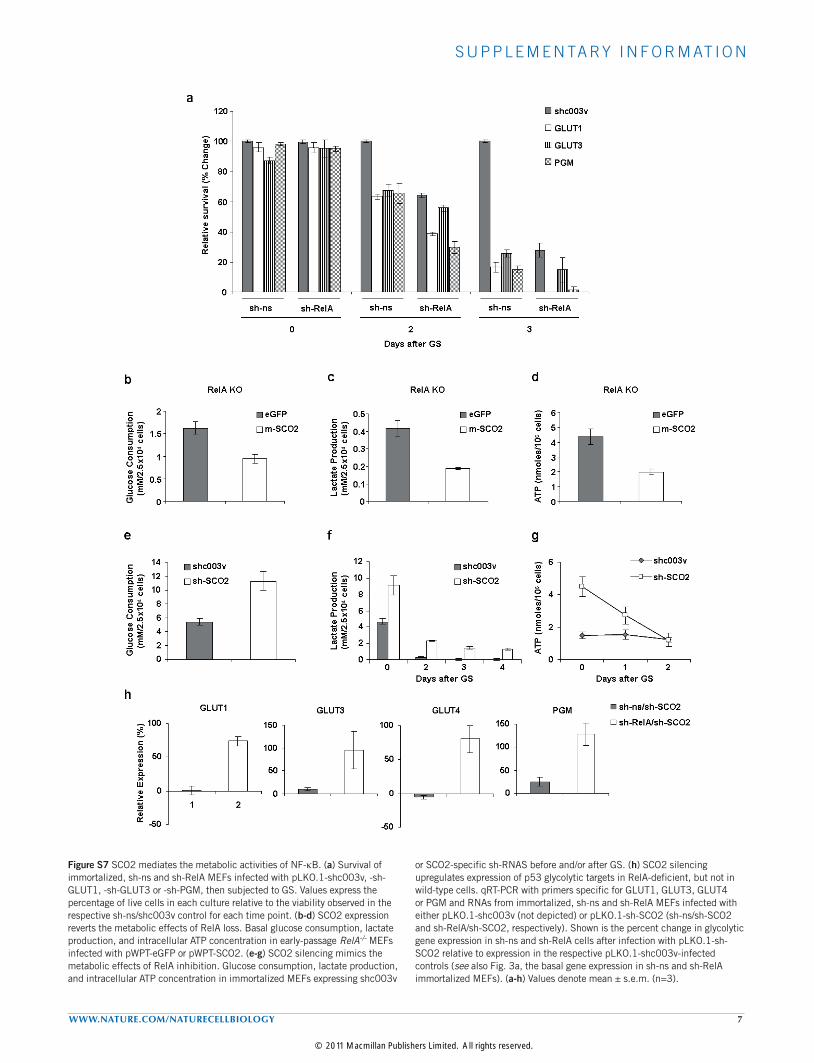
Figure S7 SCO2 mediates the metabolic activities of NF-kB. (a) Survival of immortalized, sh-ns and sh-RelA MEFs infected with pLKO.1-shc003v, -sh-GLUT1, -sh-GLUT3 or -sh-PGM, then subjected to GS. Values express the percentage of live cells in each culture relative to the viability observed in the respective sh-ns/shc003v control for each time point. (b-d) SCO2 expression reverts the metabolic effects of RelA loss. Basal glucose consumption, lactate production, and intracellular ATP concentration in early-passage RelA-/- MEFs infected with pWPT-eGFP or pWPT-SCO2. (e-g) SCO2 silencing mimics the metabolic effects of RelA inhibition. Glucose consumption, lactate production, and intracellular ATP concentration in immortalized MEFs expressing shc003v
or SCO2-specific sh-RNAS before and/or after GS. (h) SCO2 silencing upregulates expression of p53 glycolytic targets in RelA-deficient, but not in wild-type cells. qRT-PCR with primers specific for GLUT1, GLUT3, GLUT4 or PGM and RNAs from immortalized, sh-ns and sh-RelA MEFs infected with either pLKO.1-shc003v (not depicted) or pLKO.1-sh-SCO2 (sh-ns/sh-SCO2 and sh-RelA/sh-SCO2, respectively). Shown is the percent change in glycolytic gene expression in sh-ns and sh-RelA cells after infection with pLKO.1-sh-SCO2 relative to expression in the respective pLKO.1-shc003v-infected controls (see also Fig. 3a, the basal gene expression in sh-ns and sh-RelA immortalized MEFs). (a-h) Values denote mean ± s.e.m. (n=3).
© 2011 Macmillan Publishers Limited. All rights reserved.
S U P P L E M E N TA RY I N F O R M AT I O N
8 WWW.NATURE.COM/NATURECELLBIOLOGY
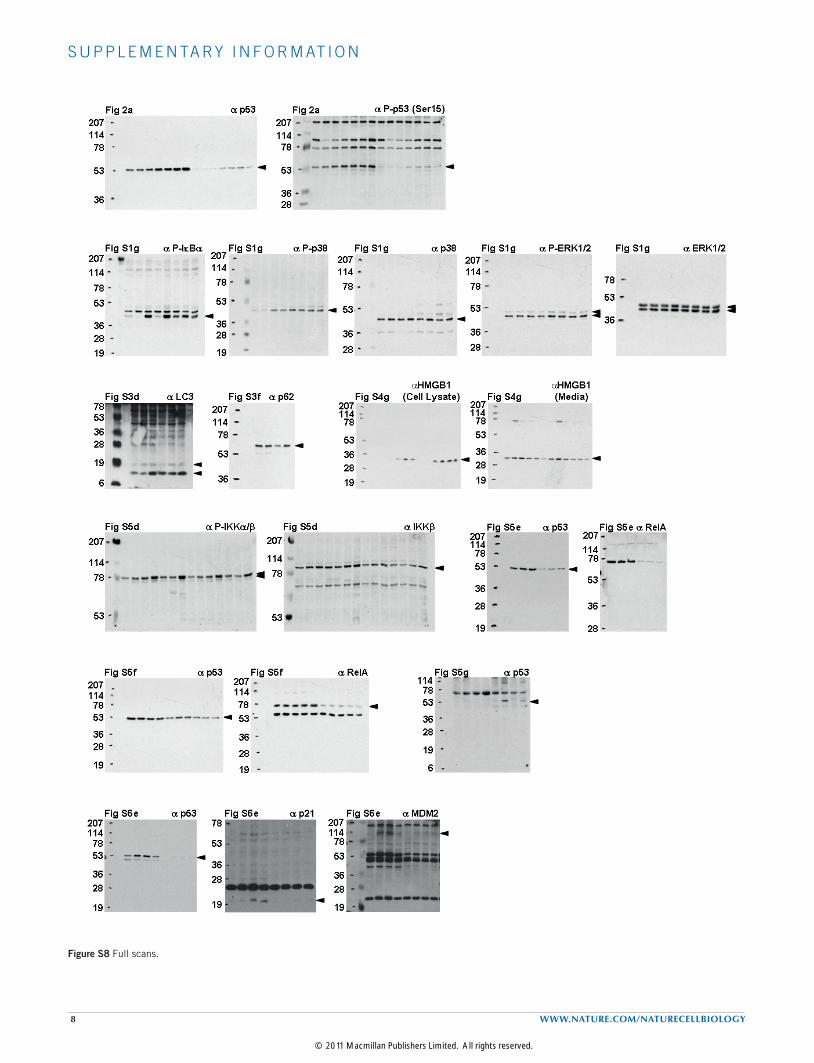
Figure S8 Full scans.
© 2011 Macmillan Publishers Limited. All rights reserved.