New Development of ²-Chitosan from Jumbo Squid Pens (Dosidicus
210
Transcript of New Development of ²-Chitosan from Jumbo Squid Pens (Dosidicus

AN ABSTRACT OF THE DISSERTATION OF
Jooyeoun Jung for the degree of Doctor of Philosophy in Food Science and Technology
presented on May 29, 2013.
Title: New Development of β-Chitosan from Jumbo Squid Pens (Dosidicus gigas) and its
Structural, Physicochemical, and Biological Properties
Abstract approved: _____________________________________
Yanyun Zhao
β-chitin/chitosan extracted from newly utilized jumbo squid (Dosidicus gigas) pens were
investigated in respect to their physicochemical properties, polymeric structures,
deacetylation and depolymerization characteristics, and antioxidant and antibacterial
activities. These functional properties were further compared with α-chitin/chitosan
prepared from shrimp shells. Due to the low mineral content (< 1%) and negligible
pigment in squid pens, demineralization and depigmentation steps could be omitted when
extracting β-chitin. Molecular weight (Mw) and moisture content of deproteinized β-
chitin were significantly higher than those of α-chitin. Crystallographic structure of β-
chitin was distinguished from that of α-chitin, in which β-chitin had less inter-molecular
hydrogen bond than α-chitin along with lower crystallinity (CI). β-chitin could convert
into α-form as the result of alkali treatment, and the resulted α-chitin exerted significantly
higher moisture absorption ability than the native α-chitin, thus retaining higher
susceptibility of native β-chitin by means of the polymorphic destruction. The Kurita
method using NaOH was an effective deacetylation treatment to obtain β-chitosan with
high Mw and a wide range of DDA, and cellulase was more susceptible than lysozyme to
degrade β-chitosan for obtaining low Mw of product. To obtain similar DDA of α- and β-
chitosan, lower concentrations of NaOH and shorter reaction times were required for β-
chitin than that for α-chitin. In addition, β-chitosan was more susceptible to cellulase
hydrolysis than α-chitosan. High Mw (280-300 kDa) of β-chitosan exerted extremely
lower half maximal effective concentrations (EC50) than α-chitosan, i.e., higher
antioxidant activity based on DPPH radical scavenging activity and reducing ability. The
75% DDA/31 kDa β-chitosan exerted higher inhibition against E. coli (lower MIC) than
that of 75% DDA/31 kDa α-chitosan, whereas opposite result was observed in 90%
DDA/74-76 kDa α- and β-chitosan. This difference could be due to the impact of the
different structural properties between α- and β-chitosan on chitosan conformations in the
solution, altering the surface phenomenon of protonated chitosan with negatively charged
bacterial cells in the suspension. Therefore, jumbo squid pens can be commercially
employed to extract functional β-chitin/chitosan with desirable structural,
physicochemical, and biological activities.
© Copyright by Jooyeoun Jung
May 29, 2013
All Rights Reserved
New Development of β-Chitosan from Jumbo Squid Pens (Dosidicus gigas) and its
Structural, Physicochemical, and Biological Properties
by
Jooyeoun Jung
A DISSERTATION
submitted to
Oregon State University
in partial fulfillment of the requirements for the
degree of
Doctor of Philosophy
Presented May 29, 2013
Commencement June 2013
Doctor of Philosophy dissertation of Jooyeoun Jung presented on May 29, 2013.
APPROVED:
_________________________________________________ Major Professor, representing Food Science and Technology
_________________________________________________ Chair of the Department of Food Science and Technology
_________________________________________________
Dean of the Graduate School
I understand that my dissertation will become part of the permanent collection of Oregon
State University libraries. My signature below authorizes release of my dissertation to
any reader upon request.
________________________________________________________________________ Jooyeoun Jung, Author
ACKNOWLEDGEMENTS
I would like to express my sincere appreciation to my advisor, Dr. Yanyun Zhao for
her constant guidance, encouragement and support throughout my study at Oregon State
University. Through participation in multiple research projects, I have learned a robust
skillset, while the numerous one-on-one meetings with Dr. Zhao and weekly lab meetings
have improved my problem solving and critical thinking skills.
I would like to thank Dr. Mark Daeschel, Dr. John Simonsen, Dr. Sean Burrows and
Dr. Christopher Beaudry for taking time to serve on my graduate committee and give
advices and suggestions for improving my research. Special thanks go to Dr. Daeschel
for allowing me use of his lab facility for microbial study and to Dr. John Simonsen for
advising me use of FT-IR and other instrumentals in his lab.
Thanks to Mr. Mark Ludlow at Dosidicus LLC, USA for the donation of jumbo squid
pens, to Dr. George Cavender for assistances whenever I faced difficulties, and to Dr.
Jingyun Duan for teaching me to run various lab equipment. I also greatly appreciate Dr.
Robert McGorrin, Brian Yorgey, Jeff Clawson, and office staffs in the Food Science and
Technology Department for providing assistances whenever I had a need, my lab mates
for the support and the positive environment, and my friends in Corvallis for the
friendship.
Last but certainly not least, I would like to thank my parents and family in Korea.
Dad, thanks for financial support and trusting me during such a long way. Mom, thank
you for your sacrifices - whenever I needed you, you always came to help me, trusted
me, and gave me everything I wanted. Thanks to my sister for taking care of family
instead of me in Korea. Thanks to my brother for being patient and nice to me all the time.
Thanks to all my friends in Korea. Their remarkable support and encouragement have
made this possible.
CONTRIBUTION OF AUTHORS
Dr. Yanyun Zhao assisted with the experimental design, data analysis, and writing of
each chapter. Dr. John Simonsen assisted with data collection of Fourier-Transform
infrared (FT-IR) spectroscopy. Dr. George Cavender was involved with the data analysis
and writing of Appendix I.
TABLE OF CONTENTS
CHAPTER 1: INTRODUCTION TO CURRENT WORK .................................................1
References ........................................................................................................................4
CHAPTER 2: FEASIBILITY OF USING SQUID PENS AS THE RAW MATERIAL OF
PREPARING β-CHITIN/CHITOSAN AND THEIR DIFFERENCES FROM α-
CHITIN/CHITOSAN: A LITERATURE REVIEW ........................................................11
Abstract...........................................................................................................................12
Introduction ....................................................................................................................13
Common Definitions ......................................................................................................14
Methods ..........................................................................................................................16
Different Characteristics between β-Chitin/Chitosan and α-Chitin/Chitosan ................18
Conclusion ......................................................................................................................30
References ......................................................................................................................32
CHAPTER 3: CHARACTERISTICS OF DEACETYLATION AND
DEPOLYMERIZATION OF β-CHITIN FROM JUMBO SQUID PENS (DOSIDICUS
GIGAS) PENS ....................................................................................................................46
Abstract...........................................................................................................................47
Introduction ....................................................................................................................48
Materials and Methods ...................................................................................................51
Results and Discussion ...................................................................................................57
Conclusions ....................................................................................................................65
Acknowledgement ..........................................................................................................66
References ......................................................................................................................67
CHAPTER 4: ALKALI OR ACID INDUCED CHANGED IN THE STRUCTURE,
MOISTURE ABSORPTION ABILITY AND DEACETYLATION REACTION OF β-
CHITIN EXTRACTED FROM JUMBO SQUID (DOSIDICUS GIGAS) PENS IN
COMPARISON WITH α-CHITIN FROM SHRIMP SHELLS ........................................79
Abstract...........................................................................................................................80
Introduction ....................................................................................................................81
Materials and Methods ...................................................................................................83
Results and Discussion ...................................................................................................86
Conclusions ....................................................................................................................94
Acknowledgement ..........................................................................................................94
References ......................................................................................................................96
CHAPTER 5: COMPARISON IN ANTIOXIDANT ACTION BETWEEN α-
CHITOSAN and β-CHITOSAN AT A WIDE RANGE OF MOLECULAR WEIGHT
AND CHITOSAN CONCENTRATION.........................................................................106
Abstract.........................................................................................................................107
Introduction ..................................................................................................................108
Materials and Methods .................................................................................................109
Results .........................................................................................................................115
Discussion ....................................................................................................................118
Conclusions ..................................................................................................................122
References ....................................................................................................................124
CHAPTER 6: IMPACT OF THE STRUCTURAL DIFFERENCES BETWEEN α- AND
β-CHITOSAN ON THEIR DEPOLYMERIZING REACTION AND ANTIBACTERIAL
ACTIVITY.......................................................................................................................133
Abstract.........................................................................................................................134
Introduction ..................................................................................................................135
Materials and Methods .................................................................................................136
Results and Discussion .................................................................................................142
Acknowledgement ........................................................................................................148
References ....................................................................................................................149
CHAPTER 7: OVERALL CONCLUSIONS...................................................................158
APPENDIX I: THE CONTRIBUTION OF ACIDULANT TO THE
ANTIBACTRERIAL ACTIVITY OF ACID SOLUBLE α- AND β-CHITOSAN
SOLUTIONS AND THEIR FILMS ................................................................................160
Abstract........................................................................................................................161
Introduction .................................................................................................................163
Materials and Methods ................................................................................................164
Results and Discussion ................................................................................................170
Conclusions .................................................................................................................177
Acknowledgement .......................................................................................................178
References ...................................................................................................................179
LIST OF TABLES
Table 2.1 The list of originated nature sources and species of α- and β-chitin ................39
Table 2.2 Comparison of deproteinizing treatments between α- and β-chitin ...................40
Table 2.3 Comparison of the degree of deacetylation (DDA, %) between α- and β-chitin
............................................................................................................................................41
Table 2.4 Comparison of the structural characteristics and physicochemical properties .42
Table 3.1 L9 standard orthogonal array of different contributing factors ........................70
Table 3.2 Intrinsic viscosity, molecular mass and degree of deacetylation ......................71
Table 3.3 Intrinsic viscosity, molecular mass, and degree of deacetylation .....................72
Table 3.4 Analysis of variance (ANOVA) results (P=0.05) .............................................73
Table 3.5 Effect of initial molecular mass of chitosan, type of enzyme............................74
Table 3.6 Effect of initial molecular mass of chitosan, type of enzyme............................75
Table 4.1 The proximate compositions of α- and β-chitin.................................................98
Table 4.2 Comparison of crystallinity index (CI, %), relative intensities (RI, %) ............99
Table 4.3 Changes of moisture absorption ability (%) of α- and β-chitin ......................100
Table 4.4 Degree of deacetylation (DDA) and molecular weight (Mw) ........................101
Table 5.1 Differences in molecular weight (Mw), and coil-overlap concentration (C*)
..........................................................................................................................................127
Table 5.2 Analysis of variance (ANOVA) table (P=0.05) for analyzing main effect .....128
Table 5.3 The multiple comparison using Tukey's Studentized Range (HSD) Test .......129
Table 5.4 Half maximal effective concentrations (EC50, mg/mL) .................................130
Table 6.1 Mw of different degrees of deacetylation (DDA, %) of α- and β-chitosan ....152
Table 6.2 Crystallinity (CI, %), d-spacing (d, Å ), and relative intensity (RI, %) ...........153
Table 6.3 Inhibition ratio (IR, %) and minimum inhibitory concentration (MIC, %) ....154
Table 7.1 Analysis of variance (ANOVA) (P=0.05) ......................................................182
Table 7.2 Assessment of bacterial cellular leakage by β-galactosidase assay ................183
Table 7.3 Percentage of inhibition (PI, %) of chitosan films against E. coli ..................184
LIST OF FIGURES
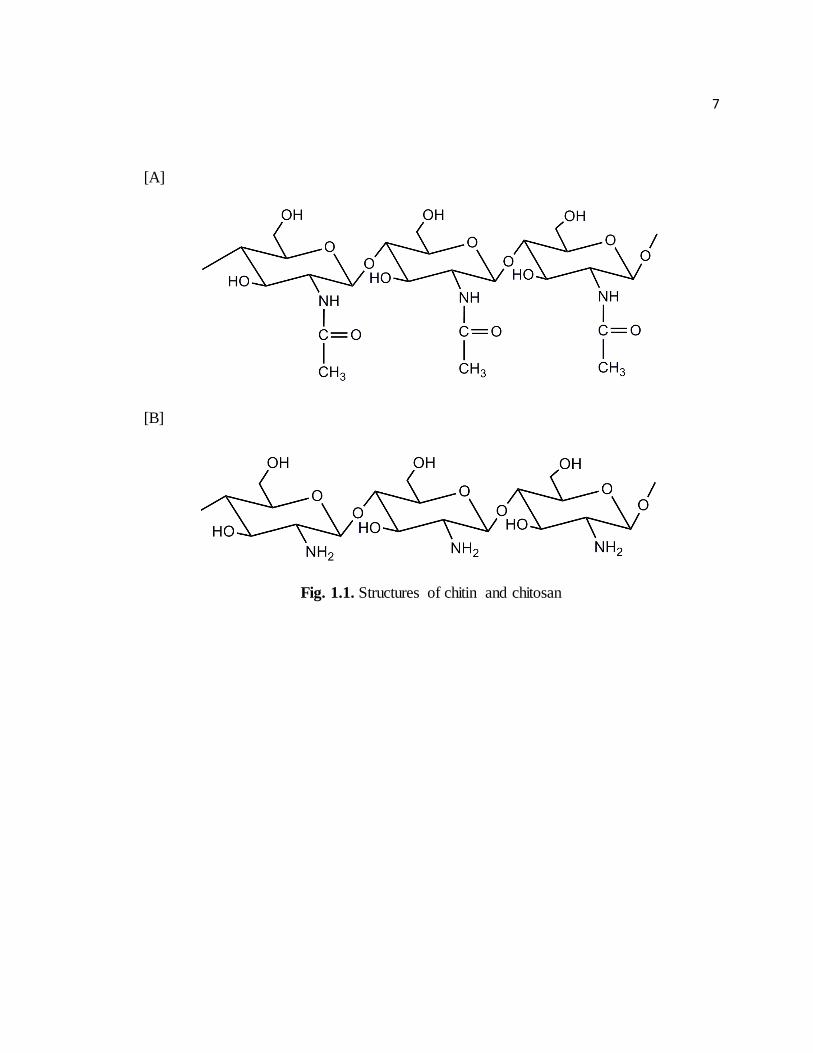
Fig. 1.1 Structures of chitin and chitosan .........................................................................10
Fig. 2.1 Important structural, physicochemical properties and biological activities ........43
Fig. 2.2 The comparison of FT-IR spectra ........................................................................44
Fig. 2.3 Differences in the extraction procedures between α- and β-chitin/chitosan ........45
Fig. 3.1 The ratio of depolymerization in chitosan treated with 1% cellulose or lysozyme
............................................................................................................................................76
Fig. 3.2 The decreasing ratio of viscosity in 1% (w/v) chitosan solution .........................77
Fig. 3.3 The reducing end formation from 1% chitosan solution .....................................78
Fig. 4.1 The comparison of FT-IR spectra ......................................................................102
Fig. 4.2 Comparison of X-ray diffraction patterns of α- (A) and β- (B) chitin................103
Fig. 4.3 Comparison of X-ray diffraction patterns of α- (A) and β- (B) chitin................104
Fig. 4.4 The comparison of FT-IR spectra of α- (A) and β-chitin (B) ............................105
Fig. 5.1 Transmittance (T, %) of different molecular weights .......................................131
Fig. 5.2 Effect of DDA on measured antioxidant activity of α- and β-chitosan .............132
Fig. 6.1 Partial FT-IR spectra (2400-3700 cm-1) ............................................................155
Fig. 6.2 Partial FT-IR spectra (2400-3700 cm-1) .............................................................156
Fig. 6.3 The hydrophillicity of L. innocua and E. coli ....................................................157
Fig. 7.1 The additioanl inhibition (%) .............................................................................185
Fig. 7.2 Adsorptive ratios (%) of 4-5 and 300-320 kDa chitosan solutions ....................186
Fig. 7.3 Comparison of FT-IR spectra and crystallinity index (CI) ................................187
Fig. 7.4 Comparison of FT-IR spectra and crystallinity index (CI) ................................188
CHAPTER 1
INTRODUCTION TO CURRENT WORK
Chitin is a polymer linked N-acetyl-D-glucosamine and D-glucosamine by β-(1-4)
glycosidic bonds. Chitosan polymer, deacetylated form of chitin, is predominantly
occupied with D-glucosamine (Fig. 1.1). It is difficult to obtain fully deacetylated or
acetylated forms, and two terms including degree of acetylation (DA, %) or degree of
deacetylation (DDA, %) are interchangeable depending on the determined monomers.
Although chitin and chitosan can be extracted from various aquatic organisms,
terrestrial organisms, and some microorganisms 1, commercial α-chitin/chitosan are
mostly extracted from crustacean wastes (e.g., crab, shrimp, or krill shells) 2-4. Hence,
most of chitin/chitosan studies are based upon α-chitin/chitosan extracted from readily
accessible crustacean shells. In contrast, study of β-chitin/chitosan has been sparse,
probably due to relatively low source of the materials for extracting β-chitin/chitosan.
Squid pens, feather-shaped internal structure in squid species including Loligo
lessonicana, Loligo formosana, Loligo vulgaris, Ommasterphes bartrami, and Illex
argentines, are the only marine sources for isolating β-chitin/chitosan that have
distinguished structures and physicochemical properties from α-chitin/chitosan5-11. In
particular, jumbo squid (Dosidicus gigas) pens have received our attention because of
increased catch of this squid speice (from 14 tons in 1974 to over 250,000 tons in 2005)
12 unique functionality, and limited previous research.
To date, β-chitin/chitosan extracted from other species of squids have been studied
for their optimal deproteinization or deacetylation conditions to produce chitin or
chitosan 5-9, 13-20 , structures and physicochemical changes during deprotenization or
2
deacetylation processes including the conversion phenomenon from β-chitin to α-chitin 5-
7, 10, 11, 13, 21-23 , chitosan derivatives 24, 25 and nanofibers 26, 27, and applications as wound
dressing and scaffolds in tissue engineering or biodegradable films 8, 26, 28-32. However,
only a few studies reported antioxidant and antimicrobial activities of β-chitosan 33, 34. So
far, no reporting study compared the biological activity between α- and β-chitosan and its
coordination with their polymeric structures and physicochemical properties. Hence, it is
necessary to investigate the feasibility of using jumbo squid pens as a source of material
to produce functional β-chitin/chitosan, its structural, physicochemical, and biological
properties in comparison with α-chitin/chitosan isolated from crustacean shells7, 13, 23.This
dissertation research sought to quantify the differences in the structural, physicochemical,
and biological properties between α- and β-chitin/chitosan extracted from shrimp shells
and jumbo squid pens, respectively. Initiating the study by investigating the deacetylation
and depolymerization characteristics of newly employed raw material (jumbo squid pens),
further studies were carried for comparing alkali or acid-induced structural modifications
and biological activities of β-chitin/chitosan with those of commercial α-chitin/chitosan
in association with their different structural properties.
The work is divided into seven chapters, including this introduction. Chapter 2
provides an in-depth review to discuss the different characteristics of β-chitin/chitosan in
terms of their resources, extraction methods and procedures, structural, physicochemical,
and biological properties. Chapter 3 examins the deacetylation and depolymerization
characteristics of β-chitin from jumbo squid (Dosidicus gigas) pens to obtain samples
with different DDA and Mw, and the optimal deacetylation and depolymerization
conditions for desirable β-chitin/chitosan is further investigated. This article was
3
published in Carbohydrate Research in 2011 35. Chapter 4 investigates alkali or acid-
induced structural modifications, moisture absorption ability, and deacetylating reactions
of β-chitin and compared with those of α-chitin. Although the polymorphic destruction of
α-chitin and the conversion of the β-form to the α-form as the result of alkali and acid
treatments have been investigated in previous studies 36-39, no study was attempted to
compare alkali or acid induced polymorphic changes between the two forms of chitin.
This manuscript has been submitted to Food Chemistry in 2013. Chapter 5 examines the
antioxidant action of α- and β-chitosan prepared with different Mw and concentrations
through determining 1,1-diphenyl-2-picrylhydrazyl (DPPH) radical scavenging activity,
reducing ability, chelating ability, and hydroxyl radical scavenging activity. This chapter
was published in Bioorganic & Medicinal Chemistry in 2012 40. Chapter 6 investigates
the depolymerizing reactions of β-chitosan in comparison with α-chitosan and their
antibacterial action against Listeria innocua and Escherichia coli by studying the
minimum inhibitory concentration (MIC) and inhibition ratios (IR, %). Strucural
properties of derived α- and β-chitosan are also investigated by using Fourier-Transform
infrared (FT-IR) spectroscopy and X-ray diffraction (XRD). This chapter was submitted
to Journal of Agricultural and Food Chemistry in 2013. Chapter 7 summarizes the
important findings of this dissertation study and offered insights of future research
opportunities and speculates as to how such areas may best be explored. Appendix I
includes further examination about the contribution of acidulant type to the antibacterial
activity of acid-soluble α- and β-chitosan solution and film as a series of the studies to
investigate the antibacterial action of β-chitosan. This manuscript was submitted to the
International Journal of Food Microbiology in 2013.
4
REFERENCES
1. Tokura, S.; Tamura, H.; Editor- in-Chief: Johannis, P. K., 2.14 Chitin and chitosan. In Comprehensive Glycoscience, Elsevier: Oxford, 2007; 449-475.
2. Mojarrad, J. S.; Nemati, M.; Valizadeh, H.; Ansarin, M.; Bourbour, S.,
Preparation of glucosamine from exoskeleton of shrimp and predicting production yield by response surface methodology. Journal of Agricultural and Food
Chemistry 2007, 55 (6), 2246-2250. 3. Chang, K. L. B.; Tsai, G., Response Surface Optimization and Kinetics of
Isolating Chitin from Pink Shrimp (Solenocera melantho) Shell Waste. Journal of
Agricultural and Food Chemistry 1997, 45 (5), 1900-1904. 4. Xu, Y.; Gallert, C.; Winter, J., Chitin purification from shrimp wastes by
microbial deproteination and decalcification. Applied Microbiology and Biotechnology 2008, 79 (4), 687-697.
5. Tolaimate, A.; Desbrieres, J.; Rhazi, M.; Alagui, A., Contribution to the
preparation of chitins and chitosans with controlled physico-chemical properties. Polymer 2003, 44 (26), 7939-7952.
6. Chandumpai, A.; Singhpibulporn, N.; Faroongsarng, D.; Sornprasit, P., Preparation and physico-chemical characterization of chitin and chitosan from the pens of the squid species, Loligo lessoniana and Loligo formosana. Carbohydrate
Polymers 2004, 58 (4), 467-474. 7. Kurita, K.; Tomita, K.; Tada, T.; Ishii, S.; Nishimura, S.I.; Shimoda, K., Squid
chitin as a potential alternative chitin source: Deacetylation behavior and characteristic properties. Journal of Polymer Science Part A: Polymer Chemistry 1993, 31 (2), 485-491.
8. Kurita, K.; Kaji, Y.; Mori, T.; Nishiyama, Y., Enzymatic degradation of β-chitin: susceptibility and the influence of deacetylation. Carbohydrate Polymers 2000,
42 (1), 19-21. 9. Lamarque, G.; Cretenet, M.; Viton, C.; Domard, A., New route of deacetylation
of α- and β-chitins by means of freeze-pump out-thaw cycles. Biomacromolecules
2005, 6 (3), 1380-1388. 10. Minke, R.; Blackwell, J., The structure of α-chitin. Journal of Molecular Biology
1978, 120 (2), 167-181. 11. Dweltz, N. E., The structure of β-chitin. Biochimica et Biophysica Acta 1961, 51
(2), 283-294.
12. Marina, J., By-products From jumbo squid (Dosidicus gigas): A new source of collagen bio-plasticizer INTECH: 2012
13. Abdou, E. S.; Nagy, K. S. A.; Elsabee, M. Z., Extraction and characterization of chitin and chitosan from local sources. Bioresource Technology 2008, 99 (5), 1359-1367.
14. Delezuk, J. A. d. M.; Cardoso, M. B.; Domard, A.; Campana-Filho, S. P., Ultrasound-assisted deacetylation of beta-chitin: influence of processing
parameters. Polymer International 2011 60 (6), 903-909.
5
15. Hien, N. Q.; Phu, D. V.; Duy, N. N.; Lan, N. T. K., Degradation of chitosan in solution by gamma irradiation in the presence of hydrogen peroxide.
Carbohydrate Polymers 2012, 87 (1), 935-938. 16. Lamarque, G.; Viton, C.; Domard, A., Comparative study of the first
heterogeneous deacetylation of α- and β-chitins in a multistep process.
Biomacromolecules 2004, 5 (3), 992-1001. 17. Lamarque, G.; Viton, C.; Domard, A., Comparative study of the second and third
heterogeneous deacetylations of α- and β-chitins in a multistep process. Biomacromolecules 2004, 5 (5), 1899-1907.
18. Lamarque, G.; Chaussard, G.; Domard, A., Thermodynamic aspects of the
heterogeneous deacetylation of β-chitin: Reaction mechanisms. Biomacromolecules 2007, 8 (6), 1942-1950.
19. Santhosh, S.; Sini, T. K.; Mathew, P. T., Variation in properties of chitosan prepared at different alkali concentrations from squid pen and shrimp shell. International Journal of Polymeric Materials and Polymeric Biomaterials 2010,
59 (4), 286-291. 20. Youn, D. K.; No, H. K.; Prinyawiwatkul, W., Preparation and characteristics of
squid pen β-chitin prepared under optimal deproteinisation and demineralisation condition. International Journal of Food Science & Technology 2012, 48 (3), 571-577.
21. Lima, I. S.; Airoldi, C., A thermodynamic investigation on chitosan-divalent cation interactions. Thermochimica Acta 2004, 421 (1??), 133-139.
22. Cárdenas, G.; Cabrera, G.; Taboada, E.; Miranda, S. P., Chitin characterization by SEM, FTIR, XRD, and 13C cross polarization/mass angle spinning NMR. Journal of Applied Polymer Science 2004, 93 (4), 1876-1885.
23. Jang, M.K.; Kong, B.G.; Jeong, Y.I.; Lee, C. H.; Nah, J.W., Physicochemical characterization of α-chitin, β-chitin, and γ-chitin separated from natural resources.
Journal of Polymer Science Part A: Polymer Chemistry 2004, 42 (14), 3423-3432. 24. Chen, Q.; Wu, Y.; Pu, Y.; Zheng, Z.; Shi, C.; Huang, X., Synthesis and
characterization of quaternized β-chitin. Carbohydrate Research 2010, 345 (11),
1609-1612. 25. Huang, J.; Chen, W.W.; Hu, S.; Gong, J.Y.; Lai, H.W.; Liu, P.; Mei, L.H.; Mao,
J.W., Biochemical activities of 6-carboxy β-chitin derived from squid pens. Carbohydrate Polymers 2012, 91 (1), 191-197.
26. Kumar, P. T. S.; Abhilash, S.; Manzoor, K.; Nair, S. V.; Tamura, H.; Jayakumar,
R., Preparation and characterization of novel β-chitin/nanosilver composite scaffolds for wound dressing applications. Carbohydrate Polymers 2010, 80 (3),
761-767. 27. Nam, Y. S.; Park, W. H.; Ihm, D.; Hudson, S. M., Effect of the degree of
deacetylation on the thermal decomposition of chitin and chitosan nanofibers.
Carbohydrate Polymers 2010, 80 (1), 291-295. 28. Chen, J. L.; Zhao, Y., Effect of Molecular weight, acid, and plasticizer on the
physicochemical and antibacterial properties of β-chitosan based films. Journal of Food Science 2012, 77 (5), E127-E136.
6
29. Oh, H.; Nam, K., Invited paper: Application of chitin and chitosan toward electrochemical hybrid device. Electronic Materials Letters 2011, 7 (1), 13-16.
30. Rachtanapun, P.; Jakkaew, M.; Suriyatem, R., Characterization of chitosan and carboxymethyl chitosan films from various sources and molecular sizes. Advanced Materials Research 2012, 417-420.
31. Sudheesh Kumar, P. T.; Srinivasan, S.; Lakshmanan, V.K.; Tamura, H.; Nair, S. V.; Jayakumar, R., β-chitin hydrogel/nano hydroxyapatite composite scaffolds for
tissue engineering applications. Carbohydrate Polymers 2011, 85 (3), 584-591. 32. Zhong, Y.; Li, Y.; Zhao, Y., Physicochemical, microstructural, and antibacterial
properties of β-chitosan and kudzu starch composite films. Journal of Food
Science 2012, 77 (10), E280-E286. 33. Huang, J.; Zhao, D.; Hu, S.; Mao, J.; Mei, L., Biochemical activities of low
molecular weight chitosans derived from squid pens. Carbohydrate Polymers 2011, 87 (3), 2231-2236.
34. Sukmark, T.; Rachtanapun, P.; Rachtanapun, C., Antimicrobial activity of
oligomer and polymer chitosan from difference sources against foodborne pathogenic bacteria. Kasetsart Journal (Natural Sciences) 2011, 45, 636-643.
35. Jung, J.; Zhao, Y., Characteristics of deacetylation and depolymerization of β-chitin from jumbo squid (Dosidicus gigas) pens. Carbohydrate Research 2011, 346 (13), 1876-1884.
36. Feng, F.; Liu, Y.; Hu, K., Influence of alkali-freezing treatment on the solid state structure of chitin. Carbohydrate Research 2004, 339 (13), 2321-2324.
37. Liu, Y.; Liu, Z.; Pan, W.; Wu, Q., Absorption behaviors and structure changes of chitin in alkali solution. Carbohydrate Polymers 2008, 72 (2), 235-239.
38. Saito, Y.; Putaux, J. L.; Okano, T.; Gaill, F.; Chanzy, H., Structural aspects of the
swelling of β-chitin in HCl and its conversion into α-chitin. Macromolecules 1997, 30 (13), 3867-3873.
39. Noishiki, Y.; Takami, H.; Nishiyama, Y.; Wada, M.; Okada, S.; Kuga, S., Alkali-induced conversion of β-chitin to α-chitin. Biomacromolecules 2003, 4 (4), 896-899.
40. Jung, J.; Zhao, Y., Comparison in antioxidant action between α-chitosan and β-chitosan at a wide range of molecular weight and chitosan concentration.
Bioorganic & Medicinal Chemistry 2012, 20 (9), 2905-2911.
7
[A]
[B]
Fig. 1.1. Structures of chitin and chitosan
8
CHAPTER 2
FEASIBILITY OF USING SQUID PENS AS THE RAW MATERIAL OF PREPARING
β-CHITIN/CHITOSAN AND THEIR DIFFERENCES FROM α-CHITIN/CHITOSAN:
A LITERATURE REVIEW
Jung, J., Zhao, Y. To be submitted to Review in Carbohydrate Polymers
9
ABSTRACT
This review focused on discussing the unique characteristics of β-chitin/chitosan by
comparing with α-chitin/chitosan in respect to their structure, preparing procedures, and
physicochemical and biological properties. There are several commercial advantages for
obtaining β-chitin/chitosan from squid pens. The amount of mineral and carotenoid in
squid pens is negligible and derived β-chitin is more susceptible to alkali deproteinizing
and deacetylating reactions due to its loose crystallographic structure and lower
crystallinity (CI), compared with α-chitin. The antioxidant and the antimicrobial activities
of β-chitosan could be compatible with or even better than those of α-chitosan based on a
few previous studies. Therefore, further utilization to the large-scale production of β-
chitin/chitosan from squid pens and development of in-depth understanding of its
functionalities are necessary and important.
10
INTRODUCTION
Chitin was first identified in 1884 1. The subsequent research has found three
different forms of chitin including α-, β-, and γ-forms. These three forms of chitin occur
in the exoskeleton of arthropods or in the cell walls of fungi and yeast, but the
commercial α-chitin/chitosan have been extracted from crustacean shells only 2. Hence,
scientific studies have been based upon α-chitin/chitosan extracted from readily
accessible crab or shrimp shells.
The squid pen has feather-shaped internal structure in squid species and contains β-
chitin 3. Previously, β-chitin was extracted from the following squid species: Loligo sp.,
Ommasterphes bartrami, and Illex argentines 4-7. However, the commercial harvest of
jumbo squids (Dosidicus gigas) has been increased from 14 tons in 1974 to over 250,000
tons in 2005 8, and its utilization was less than 11% of the total catch 9. In addition, the
valuable components including collagen, gelatin, chitin, and chitosan are disposed despite
its affordability and nutritional values 10, 11. Hence, the development of new β-
chitin/chitosan is able to enhance the utilization of jumbo squid pens, which need the
fundamental investigations to understand their structures and functional properties in
comparison with chitin and chitosan extracted from crustacean shells and other squid
species. It has been also demonstrated that the different nature sources and species are
able to alter the functional properties of resulting chitin and chitosan 1, 12-15. Therefore,
these studies can not only increase the utilization of squid pens, but also differentiate the
characteristics of chitin and chitosan extracted from various nature sources and species.
Studies about β-chitin/chitosan have been rare in comparison with α-chitin/chitosan in
association with the lower commercial demand to squid. However, it has been
11
demonstrated that α- and β-chitin are distinguished based on their polymorphic structures
16-18. Due to the structural differences, α- and β-chitin responded differently to alkali
deprotenization and deactylation, resulting in α- and β-chitosan with different functional
properties, specifically in the degree of solubility and chitosan conformations in the
solution (Fig. 2.1) 4, 6, 7, 19-21, which can indirectly impact their biological activities.
This review discussed the originated sources, structures, physicochemical properties,
extraction procedures, and biological activities of β-chitin/chitosan and compared with
those of α-chitin/chitosan. The important definitions and analytical methods widely
applied in chitin and chitosan studies were also reviewed.
COMMON DEFINITION
When chitosan is extracted from chitin by using strong alkali treatment in the
deacetylation process, the unique polymorphic structures of α- and β-chitin may no
longer exist due to structural modifications. However, the term of α- and β-chitosan was
used to distinguish chitosan extracted from different nature sources, following its original
form of chitin. Previously, the term of α- and β-chitosan has been applied in a few studies
22-26.
Three parameters, such as degree of deacetylation (DDA), molecular weight (Mw),
and crystallinity (CI), have been investigated in chitin and chitosan studies in respect to
the structures, physicochemical properties, and biological activities. However, terms
indicated in previous studies have been variously described, thus must be defined before
any discussions. The following terms are of note:
12
Chitin and Chitosan: Chitin consists of about 60-100% of N-acetyl-D-
glucosaminemonomer (NADG) in the polymeric chains. Chitosan is extracted from chitin
by hydrolyzing acetyl groups (COCH3) from NADG and forming D-glucosamine (DG).
The amount of NADG in chitosan usually becomes less than 40-50%. Chitin is classified
into α- and β-form based on the crystallographic properties of polymorphic structures.
However, chitosan extracted from α- and β-chitin may no longer retain the unique crystal
structure of α- and β-form due to the destructions of aligned polymeric sheets by means
of alkali treatments. Despite the concern that α- or β-chitosan was unable to represent the
polymorphic characteristic of α- and β-chitin, derived chitosan from each form of chitin
was described with α- or β-chitosan, following their original forms of chitin, to
distinguish chitosan obtained from different marine sources and the form of chitin.
Molecular Weight (Mw): In polymers such as chitin and chitosan, four different
types of Mw including weight-average molecular weight (Mw), number-average
molecular weight (Mn), viscosity-average molecular weight (Mv), and z-average
molecular weight (Mz) can be determined and represented differently in the distribution
of Mw. Mz is relatively higher than Mw, Mw is lower than Mn, and Mv is close to Mw
but slightly lower than Mn 27. As a polymer is generally a mixture of various molecular
weights and sizes, it is difficult to measure apparent Mw of polymer. The relative Mw or
Mv has been determined to achieve the comparative investigation among prepared
chitosan samples.
13
Degree of Deacetylation (DDA): DDA and degree of acetylation (DA) represent the
amount of either DG or NADG monomer in polymeric chains of chitin and chitosan,
respectively. They can be measured by colloidal titration methods, UV spectroscopy,
Fourier-transform infrared (FT-IR) spectroscopy, and X-ray diffraction (XRD). DDA and
DA are interchangeable by the following equation: DDA (%) = 100-DA (%).
Crystallinity (CI): Semi-crystalline chitin and chitosan have amorphous and
crystalline regions. Parallel and antiparallel alignments of polymeric chains or sheets
form crystallographic structures with various crystal planes, and the portion of crystal
regions in the polymorphic structure in chitin and chitosan is described as CI.
CI of chitin and chitosan are important as the reactivity and solubility increase with
decrease of CI 28. Hence, CI can be indirectly related to biological properties of chitosan
solutions due to its influence on the degree of solubility and chitosan conformations in
the solution. CI can be determined through the FT-IR and XRD, typically ranging 10-
80%. However, it is difficult to fully understand the polymorphic characteristics of chitin
and chitosan based on CI alone. Hence, structural properties of chitin and chitosan have
been interpreted using CI and crystallographic structures including the orientation of the
molecular chains, crystal distance, and the crystal imperfection along with chitosan
conformations and interactions between amorphous chains.
METHODS
It is important in the studies of chitin and chitosan that the viscosity-average Mw,
DDA, and polymorphic structures are appropriately analyzed and interpreted due to their
14
effects on the functional properties of chitin and chitosan. Following is a brief
introduction on the instrumental methods frequently used.
Ubbelohde Capillary Viscometer: Intrinsic viscosity [η] was measured by using the
Ubbelohde capillary viscometer and the viscosity-average Mw was calculated by using
Mark-Houwink-Sakurada (MHS) equation: [η] = K (Mw) a, where K and a are constants
and depend on the solution used to solubilize chitin and chitosan 29-32. The constant
values (k and a) for MHS equation were selected based on the preliminarily study, in
which relativeMw was the closest to the Mw of commercial chitosan. Hence, relative Mw
can be compared among prepared chitin and chitosan samples.
Fourier Transforms Infrared (FT-IR) Spectroscopy: Using FT-IR, the crystal
structure of α-chitin was able to be distinguished with that of β-chitin by means of the
presence of C=O band around at ~1620-1660 cm-1. The peaks of C=O band in α-chitin
were split into 1627 and 1660 cm-1 due to the presence of strong inter-sheet hydrogen
bonds, whereas those in β-chitin were shifted to a single peak at 1656 cm-1 as no inter-
sheet hydrogen bond was formed with C=O (Fig. 2.2) 27. Hence, the crystallographic α-
chitin was rigid and highly stable by means of strong inter-molecular hydrogen bonds,
whereas β-chitin was more reactive due to much weaker inter-molecular hydrogen bonds
20, 33, 34. Moreover, the assigned bands between 2200 and 3700 cm-1 attributed to the
vibration of OH or NH and CH stretching, indicating intra- or inter-molecular hydrogen
bonds and available OH groups dissociated from hydrogen bonds of hydroxymethyl
(CH2OH) groups in chitosan. FT-IR was also able to determine DDA using adequate
15
equations for different samples 35, 36. CI of chitin and chitosan could be also estimated by
comparing peak intensities between the two functional groups, such as CH bending and
C-CH3 deformation (A1382) and CH stretching (A2920) 37.
X-ray Diffraction (XRD): Similar to FT-IR, XRD was able to determine CI of chitin
and chitosan 37, 38. The form of chitin was able to be identified based on the image plate
of XRD, representing different diffraction patterns 39. The investigation of XRD patterns
at a wide angle (5-40 º, 2θ) could interpret the polymorphic structures and modifications
based on the shape, the shift, and the intensity of appeared peaks 40, 41. In addition, the d-
spacing representing the space distance within the crystal plane, the apparent crystal size
(Dap), and the relative intensity (%) of various crystal planes (e.g. (020), (110), (120),
(101), and (103)) were further examined to analyze the crystal properties of chitin and
chitosan 42.
DIFFERENT CHARACTERISTICS BETWEEN β-CHITIN/CHITOSAN AND α-
CHITIN/CHITOSAN
Since α-chitin/chitosan are commercially produced 43, most of studies have fairly
focused on α-chitin/chitosan. In contrast, β-chitin/chitosan is not commercially available
so far, thus their studies have received much less attention despite the industrial
advantage and unique characteristics in structures and functional properties. To explore
the investigation of β-chitin/chitosan, this review discussed structures, physicochemical
properties, the extraction methods and procedures, and biological activities of β-
chitin/chitosan and compared with those of α-chitin/chitosan.
16
Originated Nature Sources of α- and β-Chitin and their Polymorphic Structures:
Table 2.1 summarizes the originated sources of α- and β-chitin. The α-chitin has more
extensive nature sources than β-chitin. So far, β-chitin is mainly extracted from a few
species of squid, including Loligo sp., Todarodes sp., and Oligobrachia sp.
The polymorphic structures of α- and β-chitin have been investigated by Dwelts 17,
Minke 16, Gardener 44, and Blackwell 18 since 1960s. Subsequent researches were varied
depending on the originated source and species, the extraction method, and the chemical
derivative. Regarding to the properties of crystal structures, α-chitin has antiparallel
polymeric sheets, making rigid formation by means of inter-sheet hydrogen bonds,
whereas β-chitin consists of loose-packed crystal structure due to much weaker hydrogen
bonds between the parallel polymeric sheets 16-19. It was also demonstrated that
crystallinity (CI) of α-chitin (28.3%) was higher than that of β-chitin (20.8%) 45.
Moreover, α- and β-chitin has different crystallographic characteristics. The α-chitin has
the orthorhombic unit cell with dimensions of a=0.476 nm, b=1.885 nm, and c=1.028 nm
and a space group of P21212, whereas β-chitin shows the monoclinic unit with dimensions
of a=0.485 nm, b=0.926 nm, and c=1.038 and a space group of P21. Hence, β-chitin has
distinguished polymorphic structures from α-chitin, and these structural differences are
strongly associated with other characteristics of chitin/chitosan, such as physicochemical
properties, extraction procedures, and biological activities.
Reactivity of α- and β-Chitin toward Solvents and the Relationship with its
Polymorphic Structure: To extract chitosan from natural sources, acid and alkali
treatments are commonly applied to prepared raw materials. The extracting conditions

17
depend on the form of chitin due to the different polymorphic properties and its impact
on the reactivity of chitin toward applied acidic or alkali solvents. β-Chitin has been
found more reactive to acid and alkali treatments than α-chitin since applied solutions are
easily able to penetrate into loose crystal structure and lower CI of β-chitin. Kurita et al.
(1993 and 1994) found that unlike α-chitin, β-chitin could be swelled in methanol and
pyridine solutions, was more susceptible to alkali solutions, and the derived β-chitosan
had lower CI and loose crystallites than α-chitosan after the deacetylation process 6, 7.
The similar result was observed by Kumirska et al. (2010) 46. Therefore, the utilization of
squid pens can be cost-effective for producing β-chitin/chitosan since it needs smaller
amount of reagents and shorter reaction times than crustacean shells to produce α-
chitin/chitosan.
Extraction Procedures: Fig. 2.3 illustrates the extraction procedures of α- and β-
chitin/chitosan from crustacean shells and squid pens, respectively. Typically, five
consecutive processes are required to extract α-chitosan from crab and shrimp shells,
including demineralization, deproteinization, decoloration, deacetylation, and
depolymerization 2, 47, 48 49-51. In contrast, only three stages are necessary to isolate β-
chitosan from squid pens, including deprotenization, deacetylation, and depolymerization
due to the ignorable mineral content and pigment in squid pens 4, 32, 52. The extraction of
β-chitin/chitosan from squid pens can be beneficial to the industrial-scale production
since it reduces the chemical usage, production cost and time 43. The following sections
compared different extraction procedures between α- and β-chitin and discussed the
structural and physicochemical properties of resulted products.
18
Deproteinization: To produce α- and β-chitin, deprotenization process is required to
eliminate proteins greatly presented in both crustacean shells and squid pens. According
to Abdou et al. (2008), the amount of protein was ~35% in shrimp shells, ~17% in crab
shells, and ~45% in squid pens, respectively 52. Proteins are soluble in alkali pH, hence
lower concentration of alkali treatment under milder temperature can be applied to
solubilize protein, whereas the insolubilized chitin is obtained after filtration and drying
of the samples. However, for isolating α-chitin from crustacean shells, further processes
including the demineralization and decoloration are required.
The optimal deprotenization conditions to obtain α- and β-chitin from different nature
sources and species from previous studies are summarized in Table 2.2 4, 13, 20, 53-58. Lower
NaOH concentrations and temperatures are needed to prepare β-chitin in comparison with
that for preparing α-chitin, which might be related to the different polymorphic properties
between α- and β-chitin as described above. The alkali deproteinization could be more
susceptible to β-chitin than α-chitin since β-chitin had loose-packed crystallographic
structures and lower CI.
It has been found that the deproteinizing reaction is divided into two stages (possibly
three stages for crustacean shells) along with different reaction rate constants in each
stage. According to Chaussard et al. (2004), 90% of proteins was eliminated from squid
pens within 15 min in the first stage, whereas shrimp shells needed more than 2 h to reach
the equivalent level of proteins similar to squid pens 55. Hence, crustacean shells required
three stages with longer reaction times than squid pens. In addition, β-chitin was
successfully extracted from squid pens during the first stage of the process, thus the
second stage had slow slop of the reaction constant rate. Likewise, the reaction rate
19
constant of the first stage was 10 times higher in squid pens than in shrimp shells 55, 59.
Therefore, the deproteinization of squid pens can be cost-effective as it requires smaller
amounts of reagent and shorter reaction times than that of crustacean shells.
It is generally believed that the alkali treatment during the deproteinization process
could induce the degradation of Mw and increase of DDA in resulting chitin 60-62.
However, α- and β-chitin were successfully obtained from spider crab shells, shrimp
shells, and squid pens under the treatment of 0.3 N NaOH, preserving the original DA
(94-100%) with no polymorphic modifications 21. Moreover, biological methods
including enzymatic treatments 63, 64 and microbial processes using Lactobacillus 65, 66 or
Pseudomonas aeruginosa K-187 67 have been applied to alternate chemical treatments.
According to No et al. (2003), the deproteinization of chitin enhanced the quality of
derived chitosan, showing that fat or dye-binding capacities and antibacterial activity
improved in chitosan extracted after the deproteinization process, compared with chitosan
without the process 32. Therefore, both crustacean shells and squid pens require the
deproteinization process to prepare functional α- and β-chitin, but the optimal treatment
conditions can depend on the originated nature sources and species.
Demineralization: This process removes greater amount of minerals existing in the
crustacean shells. According to Kurita (2006), krill, crab, and shrimp shells consist of 20-
50% mineral contents 68. In contrast, mineral content in squid specie of Loligo vulgaris
was only 1.70% 13 and slightly different depending on squid species 4. By reason of this
unique characteristic in squid pens, Chandumpai et al. (2004) 4, Chaussard et al. (2004) 59,
and Lamarque et al. (2004) 19, 69 successfully produced acceptable β-chitin from squid
20
pens without the demineralization process. Therefore, the utilization of squid pens as the
raw material of β-chitin/chitosan can assist not only to reduce the extracting costs as the
demineralization step is not required, but also to produce higher Mw of β-chitin in
comparison with α-chitin causing the acid hydrolysis during the demineralization process.
Similarly, Tolaimate et al. (2003) demonstrated that Mw of β-chitin is 2-3 times higher
than that of α-chitin.
Decoloration: α-chitin/chitosan can be tinted due to the presence of carotenoid (e.g.
astaxanthin) compounds in the crustacean shells 53, 70, therefore, the decoloration step is
required to eliminate carotenoids to produce commercially acceptable chitin and chitosan.
In contrast, β-chitin/chitosan extracted from squid pens is neither pigmented nor
contaminated by heavy metals since the amount of carotenoid is negligible in squid pens
32, 52. According to Tolaimate et al. (2003) and Abdou et al. (2008), colorless β-chitin was
successfully extracted from squid pens without the decoloration process, whereas the
crustacean shells had to process pinkish α-chitin under the bleaching or the oxidizing
treatment (KMnO4 + oxalic acid + H2SO4) 13, 52.
Deacetylation: To obtain chitosan, chitin is deacetylated by using strong alkali
treatments. The N-aceetyl-D-glucosamine (NADG) monomer in polymeric chains of
chitin are hydrolyzed and transformed into D-glucosamine (DG) in polymeric chains of
chitosan. The deacetylation has been commonly done by two methods, homogeneous and
heterogeneous processes based on deacetylating mechanisms. For the homogenous
deacetylation, swelling and dissolving of chitin suspended in the intermediate
21
concentrations of alkali solutions led to homogenous amorphous polymorphic chitin
through freeze-thaw cycle, and resulted in chitosan with the regular distribution of the
residual N-acetyl-D-glucosamine along the polymeric chains 71. In contrast, the
heterogeneous deacetylation at high concentrations of alkalis (40-50% NaOH or KOH)
with high temperature (~90-100 ºC) was more rapidly induced in amorphous regions than
crystallographic parts and the residual COCH3 groups were randomly distributed along
the polymeric chains. The heterogeneous deactylation has been widely investigated and
used in the industrial extraction.
The optimal deacetylating treatments have been studied in α- and β-chitin to produce
high DDA of chitosan. Focher et al. (1990) successfully extracted almost free N-acetyl
groups of α-chitosan by the treatment of 40% NaOH for 30-270 sec at the saturated high
temperature stream (140-190 °C) 37. Similarly, high DDA of α-chitosan was isolated from
black tiger shrimp shells under the treatment of 50% NaOH for 45 min at 100 ºC by using
the intermediate washing 72. In addition, preconditioning with 0.016 M benzoic acid to α-
chitin helped to increase DDA of α-chitosan 73. The deacetylation process altered not
only DDA, but also structures, physicochemical properties, and biological activities of α-
chitosan. According to Burkhanova et al. (2000), the crystal structure of α-chitin was
largely degraded into amorphous α-chitosan as the result of strong alkali treatments. It
was also reported that the inter-molecular hydrogen bonds weakened as DDA increased 74.
The polymorphic structure and DDA of chitosan extracted from lobster chitin were
similar to those of commercial chitosan extracted from crab and shrimp shells 75. Tajik et
al. (2008) applied different deacetylating treatments to α-chitin, demonstrating that
physicochemical (e.g., minerals, nitrogen, and Mw) and biological properties (e.g., water-
22
binding capacity and antibacterial activity) of α-chitosan depended on the combination of
treatment conditions 43. Similarly, Hongpattarakere et al. (2008) reported that the
antibacterial activity of chitosan was enhanced in higher DDA of chitosan processed in
higher concentration of alkali and temperatures with longer reaction times 76. However,
since the Mw of chitosan could be decreased with prolonging reaction times, the
deacetylating time should be adjusted to extract high Mw with acceptable DDA57. The
enzymatic deacetylation was also utilized to alternate chemical methods for lessening the
polymer degradation and environmental concern 77.
With regards to β-chitin, high DDA and Mw of β-chitosan could be extracted by
using two different types of reagents, so-called Kurita method with NaOH and
Broussignac method with KOH 78. Similar to α-chitin, Methacanon et al. (2003)
demonstrated that DDA of β-chitosan increases with higher alkali concentrations and
temperatures along with longer reaction times. In addition, various optimum conditions
for obtaining 90% DD chitosan were predicted from the best fit regression equation79.
Recently, Delezuk et al. (2011) extracted high DDA (~93%) of β-chitosan by using the
ultrasound-assisted deacetylation method for 30 min at 50–80 ºC 80. In addition to the
changes of DDA and Mw, structural and physicochemical properties of the resulted β-
chitosan were altered after the deacetylation of β-chitin. Chandumpai et al. (2003)
reported that chitosan obtained from squid pens was classified as ‘Class III: moderately
hygroscopic’, where moisture contents of β-chitosan essentially increased under the
condition of 80% relative humidity 4. Chen et al. (2004) investigated the structural
changes of chitosan at different DDAs and found that a specific absorption peak of NH2
in FT-IR spectrum significantly increases as DDA increased. XRD patterns of
23
deacetylated chitosan with DD values of 17.5 and 44.7% have three significant
diffraction peaks, whereas there are only two diffraction peaks in chitosan with higher
DDA of 76.5 and 94.7% since the crystallographic structure of chitosan collapsed in high
DDA of β-chitosan 4, 81.
The deacetylating characteristics and resulting chitosan can be different between α-
and β-chitin due to the impact of different polymorphic structures on the alkali reactions.
DDA of derived chitosan was compared between α- and β-chitin processed under same
treatment conditions and is summarized in Table 2.3. Overall, it was observed that DDA
of β-chitosan was higher than that of α-chitosan. As previously mentioned, the
crystallographic structure of β-chitin is less rigid with much weaker inter-molecular
hydrogen bonds than that of α-chitin, allowing alkali solutions to penetrate easier into
crystal lattice of β-chitin 4, 13, 19. Hence, the same deacetylating treatment was able to
produce higher DDA of chitosan in β-chitin than chitosan from α-chitin. Similarly, Rhazi
et al. (2000) demonstrated that β-chitin was more reactive to alkali treatments than α-
chitin, obtaining higher DDA of β-chitosan within 2 h. No further increase of DDA
appeared after 2 h, and Mw of β-chitosan degraded with prolonging reaction times 21.
Tolaimate et al. (2003) reported that Mw and DDA of β-chitosan was higher than those of
α-chitosan under the same deacetylating treatment 13. By deacetylating at 121 ºC for 15
min, β-chitosan with about 90% DDA was extracted from squid pens, and DDA of β-
chitosan was higher than that of α-chitosan 52. To extract similar DDA of α- and β-
chitosan, β-chitin required lower NaOH concentrations and shorter reaction times 82. The
structural modifications were also compared between α- and β-chitin during the
deacetylation process. The crystallographic β-chitin became amorphous faster and easier
24
by means of milder treatments along with a statistical distribution of DG and NADG in
the polymeric chains of β-chitosan. In contrast, the deacetylating reaction of α-chitin was
mainly induced in amorphous regions and each monomer was randomly distributed along
the polymeric chains of α-chitosan, causing less polymorphic modification in comparison
with β-chitin 19, 69. The influence of NaOH concentration (30-55% (w/v)) and sodium
hydroxide hydrates depended on the form of chitin, reporting that mono- and di-hydrates
were more reactive in β-chitin than in α-chitin83.
In summary, DDA of chitosan extracted from β-chitin was higher than that of
chitosan from α-chitin under the same deacetylating conditions. Likewise, the
deacetylating treatment of β-chitin could be relatively milder than that for α-chitin to
prepare similar DDA of chitosan. Therefore, structural and physicochemical properties of
α- and β-chitosan can be different since α- and β-chitin are able to respond differently to
the deacetylation process due to the different structures between the two forms of chitin.
Depolymerization: The depolymerization process is selectively carried out to
produce a certain range of Mw, depending on purposes of applications. It has been
reported that the influence of Mw on the biological activities of chitosan varies with
several factors 84-89. As it was reported, Mw of native chitin/chitosan is larger than 1000
kDa, the depolymerizing process is required to produce the commercial chitosan with
Mw of 100-200 kDa 88, 90. Hence, α- and β-chitosan need to process the depolymerization
step to enhance their functionality.
Enzymatic, chemical, and physical hydrolysis are the three common methods for
deploymerization of chitosan. Although the chemical method is faster and cheaper than
25
other methods, it has limited control over the extent of hydrolysis due to its harsh
conditions as well as environmental concern of using high concentrations of chemical
reagents 91. The physical method can result in irregular Mw, but it is safe and easy to
handle 92. Finally, the enzymatic method is able to compensate the disadvantages referred
in other two methods and is more applicable as it controls the extent of reaction with less
environmental and safety concerns.
The depolymerization of β-chitosan has been investigated in a few studies. The
chemical hydrolysis by using hydrogen peroxide induced much faster degradation of β-
chitosan than the ultrasonic hydrolysis, and resulted in high efficiency similar to the
enzymatic hydrolysis 93. Kurita et al. (2000) investigated the impact of DDA on the
depolymerizating efficiency of β-chitosan processed in lysozyme hydrolysis. The
degradation of β-chitin was greater with decreasing DDA due to the higher affinity of
lysozyme to lower DDA of β-chitosan 94. The ultrasound-assisted depolymerizing method
could produce lower Mw β-chitosan, lasting primary structures of chitosan 95. In addition,
Trichoderma harzianum chitinase hydrolysis was able to produce oligosaccharides (< 10
kDa) from β-chitosan, which exerted high antibacterial effects against various bacterial
strains 24.
The depolymerization reaction between α- and β-chitosan can be different due to their
different structural properties, which in turn may impact the degree of solubility and
chitosan conformations in the solution. However, no previous study has demonstrated the
different characteristics of depolymerizing reactions between α- and β-chitosan.
26
Biological Properties: Since the different structural and physicochemical properties
between α- and β-chitin can alter the degree of deacetylation and/or chitosan
conformations in the solution (Table 2.4), the biological activity of the resulting chitosan
can vary depending on the form of chitosan. The antioxidant and antimicrobial activities
were the two biological functionalities discussed in this review as they are the most
interesting functional properties of chitosan. To exert antioxidant properties, the hydroxyl
(OH) groups in C3 and C5 and amino (NH2) groups in C2 need to donate available
hydrogen and unpaired electrons to scavenge free radicals and to chelate metal ions for
preventing oxidative stress 24, 96, 97. Antimicrobial mechanisms of chitosan have been
proposed as the interactions between the protonated amino groups (NH3+) and negatively
charged cell membranes 98, the destruction of the cell wall by chelation of the metals 99,
and the formation of a physical barrier preventing the uptake of nutrients into the cell,
resulted in cell death due to the alteration of cell permeability 100. Hence, the functional
OH and NH2 groups in DG and NADG monomers are responsible for exerting the
antioxidant and antimicrobial effect in chitosan 97. However, the polymorphic structures
of chitosan consisting of crystallographic region with strong inter-molecular hydrogen
bonds and amorphous regions with interactions between polymeric chains can alter the
antioxidant and antimicrobial activities of chitosan solution. Regarding to the availability
of those functional groups, hydrogen or unpaired electrons can be less available as the
result of forming hydrogen bonds and the interactions of polymeric chains in the solution.
For these reasons, the antioxidant and antimicrobial activities can be different between α-
and β-chitosan since the derived α- and β-chitosan through the deacetylation and
depolymerization processes can have different polymorphic structures at similar DDA
27
and Mw. However, no previous studies have compared the antioxidant and antimicrobial
properties between α-and β-chitosan prepared with similar DDA and Mw.
Antioxidant and antimicrobial studies of β-chitosan have been rare in comparison
with those of α-chitosan. Huang et al. (2011) investigated the effect of Mw on antioxidant
activity of β-chitosan and demonstrated that the radical scavenging activity, the ferrous
ion chelation, and the reducing power are higher in 9-13 kDa samples than those in
higher Mw of β-chitosan 85. The same researchers also found that the TEMPO (2,2,6,6-
tetramethylpiperidine -1-oxyl radical)-mediated 6-carboxyl β-chitin derivative (T-β-chitin)
enhances the radical scavenging activity and ferrous ion chelating ability 101. On the
subject of the antimicrobial activity in β-chitosan, a 220 kDa sample greatly inhibited the
growth of Streptococcus mutans GS-5 among 10-426 kDa, and the inhibitory effect
against various oral Streptococcus species was increased at higher DDA of β-chitosan 102.
According to Lin et al. (2009), 90% DDA of chitooligosaccharides (COS, <10 kDa)
derived from β-chitosan prevented the growth of all Gram-negative strains, whereas it
was only effective to Staphylococcus xylosus among various Gram-positive strains 24.
However, Huang et al. (2011) demonstrated the opposite trend in respect to the effects of
DDA and Mw versus the findings of Shimojoh et al. (1996) and Lin et al. (2009). They
found that antimicrobial activity was enhanced in higher Mw and lower DDA of β-
chitosan and Staphylococcus aureus (Gram-positive strain) was more susceptible to β-
chitosan than Escherichia coli (Gram-negative strain).
In respect to the antimicrobial properties, Kim et al. (2007) compared the antibacterial
effects of α- and β-chitosan coating solutions. Among 282, 440, 746, and 1,110 kDa of α-
chitosan and 577 kDa of β-chitosan, 282 kDa of α-chitosan solubilized in pH 4.5 solution
28
exerted the highest inhibitory effect against S. enteritidis and also preserved the internal
quality of eggs 103, whereas β-chitosan showed higher antibacterial effect against S.
aureus, B. cereus, and B. subtilis than α-chitosan. In addition, 50-80 kDa β-chitosan
exerted stronger antibacterial activity against V. parahaemolyticus than 1200-1700 kDa
of β-chitosan 88.
In the application studies, the different characteristics have been found between α-
and β-chitosan. To develop water-soluble chitosan by using the Maillard reaction, it was
observed that α-chitosan can be more suitable than β-chitosan since the derived water-
soluble α-chitosan exerted higher yield and solubility than β-chitosan 104. However, Oh et
al. (2011) indicated that β-chitosan was able to form physical hydrogel unlike α-chitosan
since the loose crystallographic β-chitosan was more able to accept water through the
lattice and to swell in water than rigid crystallographic α-chitosan 105. According to Chen
et al. (2012), β-chitosan films showed the compatible physicochemical properties and
antibacterial activity to α-chitosan films 26.
In summary, the biological properties of α-chitosan are well known. Various factors,
including physicochemical properties of chitosan (DDA and Mw), microbial
characteristics (microbial species and its hydrophilicity), and environmental conditions
(pH and temperatures) have been investigated in association with the biological
properties of α-chitosan. However, the biological activities of β-chitosan are rarely
investigated and the limited results are controversial. Hence, it is necessary to fully
understanding the biological activities of β-chitosan in respect to its structural differences
from α-chitosan.
29
CONCLUSION
Due to the unique chemical composition of squid pens with negligible amounts of
mineral and carotenoid, producing β-chitin/chitosan can be cost-effective as the
demineralization and decoloration processes are not required in comparison with
preparing α-chitosan from crustacean shells. In addition, the polymorphic β-chitin with
loose crystallographic structures and lower CI are more susceptible to the alkali
deproteinization and deacetylation reactions than the rigid crystallographic α-chitin, thus
resulted in different structures and functional properties between derived α- and β-
chitosan. Despite the commercial advantages of preparing β-chitin/chitosan and their
functional properties, the studies on β-chitin/chitosan have been paid much less attention
than the studies on α-chitin/chitosan. Therefore, it is important to investigate the
functional properties, especially the antioxidant and antimicrobial activities, in
association with the structural properties of β-chitosan.
30
REFERENCES
1. Rinaudo, M., Chitin and chitosan: Properties and applications. Progress in Polymer Science 2006, 31 (7), 603-632.
2. Arbia, W.; Arbia, L.; Adour, L.; Amrane, A., Chitin extraction from crustacean
shells by biological methods: A review. Food Technology Biotechnology. 2012, 50 (4).
3. Kurita, K., Controlled functionalization of the polysaccharide chitin. Progress in Polymer Science 2001, 26 (9), 1921-1971.
4. Chandumpai, A.; Singhpibulporn, N.; Faroongsarng, D.; Sornprasit, P.,
Preparation and physico-chemical characterization of chitin and chitosan from the pens of the squid species, Loligo lessoniana and Loligo formosana. Carbohydrate
Polymers 2004, 58 (4), 467-474. 5. Lavall, R. L.; Assis, O. B. G.; Campana-Filho, S. P., β-Chitin from the pens of
Loligo sp.: Extraction and characterization. Bioresource Technology 2007, 98 (13),
2465-2472. 6. Kurita, K.; Tomita, K.; Tada, T.; Ishii, S.; Nishimura, S.I.; Shimoda, K., Squid
chitin as a potential alternative chitin source: Deacetylation behavior and characteristic properties. Journal of Polymer Science Part A: Polymer Chemistry 1993, 31 (2), 485-491.
7. Kurita, K.; Ishii, S.; Tomita, K.; Nishimura, S.I.; Shimoda, K., Reactivity characteristics of squid β-chitin as compared with those of shrimp chitin: High
potentials of squid chitin as a starting material for facile chemical modifications. Journal of Polymer Science Part A: Polymer Chemistry 1994, 32 (6), 1027-1032.
8. Marina, J., By-products from jumbo squid (Dosidicus gigas): A new source of
collagen bo-plasticizer INTECH: 2012. 9. Luna-Raya, M. C.; Urciaga-Garcia, J. I.; Salinas-Zavala, C. A.; Cisneros-Mata, M.
A.; Beltran-Morales, L. F., Diagnostico del consumo del calamar gigante en Mexico yen Sonora. Economia, Sociedad y Territorio 2006, 6 (22), 535-560.
10. De la Cruz Gonzalez, F.; Aragon Noriega, A.; Urciaga Garcia, J. I.; Salinas
Zavala, C.; Cisneros Mata, M. A.; Beltran Morales, L. F., Analisis socioeconomico de las pesquerias de camaron y calamar gigante en el noroeste de
Mexico. Interciencia 2007, 32 (3), 144-150. 11. Kim, S.-K.; Mendis, E., Bioactive compounds from marine processing byproducts:
A review. Food Research International 2006, 39 (4), 383-393.
12. Synowiecki, J.; Al-Khateeb, N. A., Production, properties, and some new applications of chitin and its derivatives. Critical reviews in Food Science and
Nutrition 2003, 43 (2), 145-171. 13. Tolaimate, A.; Desbrieres, J.; Rhazi, M.; Alagui, A., Contribution to the
preparation of chitins and chitosans with controlled physico-chemical properties.
Polymer 2003, 44 (26), 7939-7952. 14. Aranaz, I.; Mengibar, M.; Harris, R.; Panos, I.; Miralles, B.; Acosta, N.; Galed, G.;
Heras, A., Functional Characterization of Chitin and Chitosan. Current Chemical Biology 2009, 3 (2), 203-230.
31
15. Domard, A., A perspective on 30 years research on chitin and chitosan. Carbohydrate Polymers 2012, 84 (2), 696-703.
16. Minke, R.; Blackwell, J., The structure of α-chitin. Journal of Molecular Biology 1978, 120 (2), 167-181.
17. Dweltz, N. E., The structure of β-chitin. Biochimica et Biophysica Acta 1961, 51
(2), 283-294. 18. Blackwell, J., Structure of β-chitin or parallel chain systems of poly-β-(1→4)-N-
acetyl-D-glucosamine. Biopolymers 1969, 7 (3), 281-298. 19. Lamarque, G.; Viton, C.; Domard, A., Comparative study of the first
heterogeneous deacetylation of α- and β-Chitins in a multistep process.
Biomacromolecules 2004, 5 (3), 992-1001. 20. Jang, M.K.; Kong, B.-G.; Jeong, Y.I.; Lee, C. H.; Nah, J.W., Physicochemical
characterization of α-chitin, β-chitin, and γ-chitin separated from natural resources. Journal of Polymer Science Part A: Polymer Chemistry 2004, 42 (14), 3423-3432.
21. Rhazi, M.; Desbrières, J.; Tolaimate, A.; Alagui, A.; Vottero, P., Investigation of
different natural sources of chitin: influence of the source and deacetylation process on the physicochemical characteristics of chitosan. Polymer International
2000, 49 (4), 337-344. 22. Byun, S. M.; Youn, D. K.; No, H. K.; Hong, J. H.; W., P., Comparison of selected
physicochemical and functional properties of squid pen β-chitosans prepared
without and with demineralization process. Journal of Chitin and Chitosan 2012, 17 (2), 75-79.
23. Huang, J.; Mao, J. W.; Hu, S.; Zhao, D. K.; Mei, L. H.; Liu, S. W.; Wu, Y. F.; Fang, S.; Shao, Q., Ultrasonic-assisted preparation, characterization and antibacterial activity of β-chitosan from squid pens. Advanced Materials Research
2011, 236-238, 282-287. 24. Lin, S.B.; Chen, S.H.; Peng, K.C., Preparation of antibacterial
chitooligosaccharide by altering the degree of deacetylation of β-chitosan in a Trichoderma harzianum chitinase-hydrolysing process. Journal of the Science of Food and Agriculture 2009, 89 (2), 238-244.
25. Zhong, Y.; Li, Y.; Zhao, Y., Physicochemical, microstructural, and antibacterial properties of β-chitosan and kudzu starch composite films. Journal of Food
Science 2012, 77 (10), E280-E286. 26. Chen, J. L.; Zhao, Y., Effect of molecular weight, acid, and plasticizer on the
physicochemical and antibacterial properties of β-chitosan based films. Journal of
Food Science 2012, 77 (5), E127-E136. 27. Nairn, J., Chapter 3: Polymer molecular weight. 2003.
28. Du, J.; Hsieh, Y.L., PEGylation of chitosan for improved solubility and fiber formation via electrospinning. Cellulose 2007, 14 (6), 543-552.
29. Wang, W.; Bo, S.; Li, S.; Qin, W., Determination of the Mark-Houwink equation
for chitosans with different degrees of deacetylation. International Journal of Biological Macromolecules 1991, 13 (5), 281-285.
30. Kasaai, M. R., Calculation of Mark-Houwink-Sakurada (MHS) equation viscometric constants for chitosan in any solvent-temperature system using
32
experimental reported viscometric constants data. Carbohydrate Polymers 2007, 68 (3), 477-488.
31. Liu, Y.; Liu, Z.; Pan, W.; Wu, Q., Absorption behaviors and structure changes of chitin in alkali solution. Carbohydrate Polymers 2008, 72 (2), 235-239.
32. No, H. K.; Lee, S. H.; Park, N. Y.; Meyers, S. P., Comparison of physicochemical,
binding, and antibacterial properties of chitosans prepared without and with deproteinization process. Journal of Agricultural and Food Chemistry 2003, 51
(26), 7659-7663. 33. Saito, Y.; Putaux, J. L.; Okano, T.; Gaill, F.; Chanzy, H., Structural aspects of the
swelling of β-chitin in HCl and its Conversion into α-chitin. Macromolecules
1997, 30 (13), 3867-3873. 34. Cárdenas, G.; Cabrera, G.; Taboada, E.; Miranda, S. P., Chitin characterization by
SEM, FTIR, XRD, and 13C cross polarization/mass angle spinning NMR. Journal of Applied Polymer Science 2004, 93 (4), 1876-1885.
35. Fei Liu, X.; Lin Guan, Y.; Zhi Yang, D.; Li, Z.; De Yao, K., Antibacterial action
of chitosan and carboxymethylated chitosan. Journal of Applied Polymer Science 2001, 79 (7), 1324-1335.
36. Dong, Y.; Xu, C.; Wang, J.; Wu, Y.; Wang, M.; Ruan, Y., Influence of degree of deacetylation on critical concentration of chitosan/dichloroacetic acid liquid-crystalline solution. Journal of Applied Polymer Science 2002, 83 (6), 1204-1208.
37. Focher, B.; Beltrame, P. L.; Naggi, A.; Torri, G., Alkaline N-deacetylation of chitin enhanced by flash treatments: Reaction kinetics and structure modifications.
Carbohydrate Polymers 1990, 12 (4), 405-418. 38. Ogawa, K.; Yui, T.; Okuyama, K., Three D structures of chitosan. International
Journal of Biological Macromolecules 2004, 34 (1-2), 1-8.
39. Noishiki, Y.; Takami, H.; Nishiyama, Y.; Wada, M.; Okada, S.; Kuga, S., Alkali-Induced Conversion of β-chitin to α-chitin. Biomacromolecules 2003, 4 (4), 896-
899. 40. Abdel-Fattah, W. I.; Jiang, T.; El-Bassyouni, G. E.T.; Laurencin, C. T., Synthesis,
characterization of chitosans and fabrication of sintered chitosan microsphere
matrices for bone tissue engineering. Acta Biomaterialia 2007, 3 (4), 503-514. 41. Yulianti, E.; Karo, A. K.; Susita, L.; Sudaryanto, Synthesis of electrolyte polymer
based on natural polymer chitosan by ion implantation technique. Procedia Chemistry 2012, 4 (0), 202-207.
42. Feng, F.; Liu, Y.; Hu, K., Influence of alkali-freezing treatment on the solid state
structure of chitin. Carbohydrate Research 2004, 339 (13), 2321-2324. 43. Tajik, H.; Moradi, M.; Rohani, S.; Erfani, A.; Jalali, F., Preparation of chitosan
from brine shrimp (Artemia urmiana) cyst shells and effects of different chemical processing sequences on the physicochemical and functional properties of the product. Molecules 2008, 13 (6), 1263-1274.
44. Gardner, K. H.; Blackwell, J., Refinement of the structure of β-chitin. Biopolymers 1975, 14 (8), 1581-1595.
45. Lima, I. S.; Airoldi, C., A thermodynamic investigation on chitosan-divalent cation interactions. Thermochimica Acta 2004, 421 (1??), 133-139.
33
46. Kumirska, J.; Czerwicka, M.; Kaczynski, Z.; Bychowska, A.; Brzozowski, K.; Thoming, J.; Stepnowski, P., Application of spectroscopic methods for structural
analysis of chitin and chitosan. Marine Drugs 2010, 8 (5), 1567-1636. 47. Shahidi, F.; Abuzaytoun, R., Chitin, chitosan, and co-products: Chemistry,
production, applications, and health effects. In Advances in Food and Nutrition
Research, Academic Press: 2005; 49, 93-135. 48. Tharanathan, R. N.; Kittur, F. S., Chitin: The undisputed biomolecule of great
potential. Critical Reviews in Food Science and Nutrition 2003, 43 (1), 61-87. 49. No, H. K.; Hur, E. Y., Control of foam formation by antifoam during
demineralization of crustacean shell in preparation of chitin. Journal of
Agricultural and Food Chemistry 1998, 46 (9), 3844-3846. 50. Bautista, J.; Jover, M.; Gutierrez, J. F.; Corpas, R.; Cremades, O.; Fontiveros, E.;
Iglesias, F.; Vega, J., Preparation of crayfish chitin by in situ lactic acid production. Process Biochemistry 2001, 37 (3), 229-234.
51. Choorit, W.; Patthanamanee, W.; Manurakchinakorn, S., Use of response surface
method for the determination of demineralization efficiency in fermented shrimp shells. Bioresource Technology 2008, 99 (14), 6168-6173.
52. Abdou, E. S.; Nagy, K. S. A.; Elsabee, M. Z., Extraction and characterization of chitin and chitosan from local sources. Bioresource Technology 2008, 99 (5), 1359-1367.
53. No, H. K.; Meyers, S. P.; Lee, K. S., Isolation and characterization of chitin from crawfish shell waste. Journal of Agricultural and Food Chemistry 1989, 37 (3),
575-579. 54. Chang, K. L. B.; Tsai, G., Response surface optimization and kinetics of isolating
chitin from pink shrimp (Solenocera melantho) shell waste. Journal of
Agricultural and Food Chemistry 1997, 45 (5), 1900-1904. 55. Percot, A.; Viton, C.; Domard, A., Characterization of shrimp shell
deproteinization. Biomacromolecules 2003, 4 (5), 1380-1385. 56. Naznin, R., Extraction of chitin and chitosan from shrimp (Metapenaeus
monoceros) shell by chemical method. Pakistanian Journal Biological Science
2005, 8 (7), 1051-1054. 57. Yen, M.T.; Yang, J.H.; Mau, J.L., Physicochemical characterization of chitin and
chitosan from crab shells. Carbohydrate Polymers 2009, 75 (1), 15-21. 58. Yildiz, B.; Sengul, B.; Ali, G.; Levent, I.; Seval, B. K.; Soner, C.; Habil, U. K.,
Chitin-chitosan yields of fresh water crab (Potamon potamios, Olivier 1804) shell.
Pakistanian Veterinary Journal 2010, 30 (4), 4. 59. Chaussard, G.; Domard, A., New Aspects of the extraction of chitin from squid
pens. Biomacromolecules 2004, 5 (2), 559-564. 60. Kjartansson, G. T.; Zivanovic, S.; Kristbergsson, K.; Weiss, J., Sonication-
assisted extraction of chitin from North Atlantic shrimps (Pandalus borealis).
Journal of Agricultural and Food Chemistry 2006, 54 (16), 5894-5902. 61. Healy, M.; Green, A.; Healy, A., Bioprocessing of marine crustacean shell waste.
Acta Biotechnologica 2003, 23 (2-3), 151-160.
34
62. Wang, S.L.; Chio, S.H., Deproteinization of shrimp and crab shell with the protease of Pseudomonas Aeruginosa K-187. Enzyme and Microbial Technology
1998, 22 (7), 629-633. 63. Valdez-Pea, A.; Espinoza-Perez, J.; Sandoval-Fabian, G.; Balagurusamy, N.;
Hernandez-Rivera, A.; De-la-Garza-Rodriguez, I.; Contreras-Esquivel, J.,
Screening of industrial enzymes for deproteinization of shrimp head for chitin recovery. Food Science and Biotechnology 2010, 19 (2), 553-557.
64. Synowiecki, J.; Al-Khateeb, N. A. A. Q., The recovery of protein hydrolysate during enzymatic isolation of chitin from shrimp crangon processing discards. Food Chemistry 2000, 68 (2), 147-152.
65. Jung, W. J.; Jo, G. H.; Kuk, J. H.; Kim, Y. J.; Oh, K. T.; Park, R. D., Production of chitin from red crab shell waste by successive fermentation with Lactobacillus
paracasei KCTC-3074 and Serratia marcescens FS-3. Carbohydrate Polymers 2007, 68 (4), 746-750.
66. Rao, M. S.; Muoz, J.; Stevens, W. F., Critical factors in chitin production by
fermentation of shrimp biowaste. Applied Microbiology and Biotechnology 2000, 54 (6), 808-813.
67. Oh, Y.S.; Shih, I.L.; Tzeng, Y.M.; Wang, S.L., Protease produced by Pseudomonas aeruginosa K-187 and its application in the deproteinization of shrimp and crab shell wastes. Enzyme and Microbial Technology 2000, 27 (1-2),
3-10. 68. Kurita, K., Chitin and Chitosan: Functional biopolymers from marine crustaceans.
Marine Biotechnology 2006, 8 (3), 203-226. 69. Lamarque, G.; Viton, C.; Domard, A., Comparative study of the second and third
heterogeneous deacetylations of α- and β-Chitins in a multistep process.
Biomacromolecules 2004, 5 (5), 1899-1907. 70. Shahidi, F.; Synowiecki, J., Isolation and characterization of nutrients and value-
added products from snow crab (Chionoecetes opilio) and shrimp (Pandalus borealis) processing discards. Journal of Agricultural and Food Chemistry 1991, 39 (8), 1527-1532.
71. Nemtsev, S. V.; Gamzazade, A. I.; Rogozhin, S. V.; Bykova, V. M.; Bykov, V. P., Deacetylation of chitin under homogeneous conditions. Applied Biochemistry and
Microbiology 2002, 38 (6), 521-526. 72. Benjakul, S.; Wisitwuttikul, P., Improvement of deacetylation of chitin from
black tiger shrimp (Penaeus monodon) carapace and shell. Asean Food J. 1994.
73. Toan, N. V.; Ng, C.-H.; Aye, K. N.; Trang, T. S.; Stevens, W. F., Production of high-quality chitin and chitosan from preconditioned shrimp shells. Journal of
Chemical Technology & Biotechnology 2006, 81 (7), 1113-1118. 74. Burkhanova, N. D.; Yugai, S. M.; Pulatova, K. P.; Nikononvich, G. V.; Milusheva,
R. Y.; Voropaeva, N. L.; Rashidova, S. S., Structural Investigations of Chitin and
Its Deacetylation Products. Chemistry of Natural Compounds 2000, 36 (4), 352-355.
75. Cervera, M. F.; Heinmki, J.; Rsnen, M.; Maunu, S. L.; Karjalainen, M.; Acosta, O. M. N.; Colarte, A. I.; Yliruusi, J., Solid-state characterization of chitosans derived from lobster chitin. Carbohydrate Polymers 2004, 58 (4), 401-408.
35
76. Hongpattarakere, T.; Riyaphan, O., Effect of deacetylation conditions on antimicrobial activity of chitosans prepared from carapace of black tiger shrimp
(Penaeus monodon). Songklanakarin J. Sci. Technol. 2008, 30 (1), 1-9. 77. Martinou, A.; Kafetzopoulos, D.; Bouriotis, V., Chitin deacetylation by enzymatic
means: monitoring of deacetylation processes. Carbohydrate Research 1995, 273
(2), 235-242. 78. Tolaimate, A.; Desbrires, J.; Rhazi, M.; Alagui, A.; Vincendon, M.; Vottero, P.,
On the influence of deacetylation process on the physicochemical characteristics of chitosan from squid chitin. Polymer 2000, 41 (7), 2463-2469.
79. Methacanon, P.; Prasitsilp, M.; Pothsree, T.; Pattaraarchachai, J., Heterogeneous
N-deacetylation of squid chitin in alkaline solution. Carbohydrate Polymers 2003, 52 (2), 119-123.
80. Delezuk, J. A. d. M.; Cardoso, M. B.; Domard, A.; Campana-Filho, S. P., Ultrasound-assisted deacetylation of beta-chitin: influence of processing parameters. Polymer International 2011, 60 (6), 903-909.
81. Chen, C.H.; Wang, F.Y.; Ou, Z.P., Deacetylation of β-chitin. I. Influence of the deacetylation conditions. Journal of Applied Polymer Science 2004, 93 (5), 2416-
2422. 82. Santhosh, S.; Sini, T. K.; Mathew, P. T., Variation in properties of chitosan
prepared at different alkali concentrations from squid pen and shrimp shell.
International Journal of Polymeric Materials and Polymeric Biomaterials 2010,
59 (4), 286-291.
83. Lamarque, G.; Chaussard, G.; Domard, A., Thermodynamic aspects of the heterogeneous deacetylation of β-chitin: Reaction Mechanisms. Biomacromolecules 2007, 8 (6), 1942-1950.
84. Lin, S.B.; Lin, Y.C.; Chen, H.H., Low molecular weight chitosan prepared with the aid of cellulase, lysozyme and chitinase: Characterisation and antibacterial
activity. Food Chemistry 2009, 116 (1), 47-53. 85. Huang, J.; Zhao, D.; Hu, S.; Mao, J.; Mei, L., Biochemical activities of low
molecular weight chitosans derived from squid pens. Carbohydrate Polymers
2011, 87 (3), 2231-2236. 86. Jeon, Y.J.; Park, P.J.; Kim, S.K., Antimicrobial effect of chitooligosaccharides
produced by bioreactor. Carbohydrate Polymers 2001, 44 (1), 71-76. 87. No, H. K.; Young Park, N.; Ho Lee, S.; Meyers, S. P., Antibacterial activity of
chitosans and chitosan oligomers with different molecular weights. International
Journal of Food Microbiology 2002, 74 (1-2), 65-72. 88. Sukmark, T.; Rachtanapun, P.; Rachtanapun, C., Antimicrobial activity of
oligomer and polymer chitosan from difference sources against foodborn pathogenic bacteria. Kasetsart Journal (Nature Science) 2011, 45, 636-643.
89. Yen, M.T.; Yang, J.H.; Mau, J.L., Antioxidant properties of chitosan from crab
shells. Carbohydrate Polymers 2008, 74 (4), 840-844. 90. Li, Q.; Dunn, E. T.; Grandmaison, E. W.; Goosen, M. F. A., Applications and
properties of chitosan. Journal of Bioactive and Compatible Polymers 1992, 7 (4), 370-397.
36
91. Kim, S.K.; Rajapakse, N., Enzymatic production and biological activities of chitosan oligosaccharides (COS): A review. Carbohydrate Polymers 2005, 62 (4),
357-368. 92. Tsao, C. T.; Chang, C. H.; Lin, Y. Y.; Wu, M. F.; Han, J. L.; Hsieh, K. H., Kinetic
study of acid depolymerization of chitosan and effects of low molecular weight
chitosan on erythrocyte rouleaux formation. Carbohydrate Research 2011, 346 (1), 94-102.
93. Chang, K. L. B.; Tai, M.-C.; Cheng, F.-H., Kinetics and Products of the Degradation of Chitosan by Hydrogen Peroxide. Journal of Agricultural and Food Chemistry 2001, 49 (10), 4845-4851.
94. Kurita, K.; Kaji, Y.; Mori, T.; Nishiyama, Y., Enzymatic degradation of β-chitin: susceptibility and the influence of deacetylation. Carbohydrate Polymers 2000,
42 (1), 19-21. 95. Popa-Nita, S.; Lucas, J.-M.; Ladaviere, C.; David, L.; Domard, A., Mechanisms
involved during the ultrasonically induced depolymerization of chitosan:
Characterization and control. Biomacromolecules 2009, 10 (5), 1203-1211. 96. Kim, K. W.; Thomas, R. L., Antioxidative activity of chitosans with varying
molecular weights. Food Chemistry 2007, 101 (1), 308-313. 97. Xie, W.; Xu, P.; Liu, Q., Antioxidant activity of water-soluble chitosan
derivatives. Bioorganic & Medicinal Chemistry Letters 2001, 11 (13), 1699-1701.
98. Tsai, G. J.; Su, W.H., Antibacterial activity of shrimp chitosan against Escherichia coli. Journal of Food Protection 1999, 62 (3), 239-243.
99. Cuero, R. G.; Osuji, G.; Washington, A., N-carboxymethylchitosan inhibition of aflatoxin production: Role of zinc. Biotechnology Letters 1991, 13 (6), 441-444.
100. Fernandez-Saiz, P.; Lagaron, J. M.; Ocio, M. J., Optimization of the biocide
properties of chitosan for its application in the design of active films of interest in the food area. Food Hydrocolloids 2009, 23 (3), 913-921.
101. Huang, J.; Chen, W.W.; Hu, S.; Gong, J.Y.; Lai, H.W.; Liu, P.; Mei, L.H.; Mao, J.W., Biochemical activities of 6-carboxy β-chitin derived from squid pens. Carbohydrate Polymers 2011, 91 (1), 191-197.
102. Shimojoh, M.; Masai, K.; Kurita, K., Bactericidal effects of chitosan from squid pens on oral Streptococci. Nippon Nogeikagaku Kaishi 1996, 70 (7), 787-792.
103. Kim, S. H.; No, H. K.; Prinyawiwatkul, W., Effect of molecular weight, type of chitosan, and chitosan solution pH on the shelf-life and quality of coated eggs. Journal of Food Science 2007, 72 (1), S044-S048.
104. Chung, Y.C.; Kuo, C.L.; Chen, C.C., Preparation and important functional properties of water-soluble chitosan produced through Maillard reaction.
Bioresource Technology 2005, 96 (13), 1473-1482. 105. Oh, H.; Nam, K., Invited paper: Application of chitin and chitosan toward
electrochemical hybrid device. Electronic Materials Letters 2011, 7 (1), 13-16.
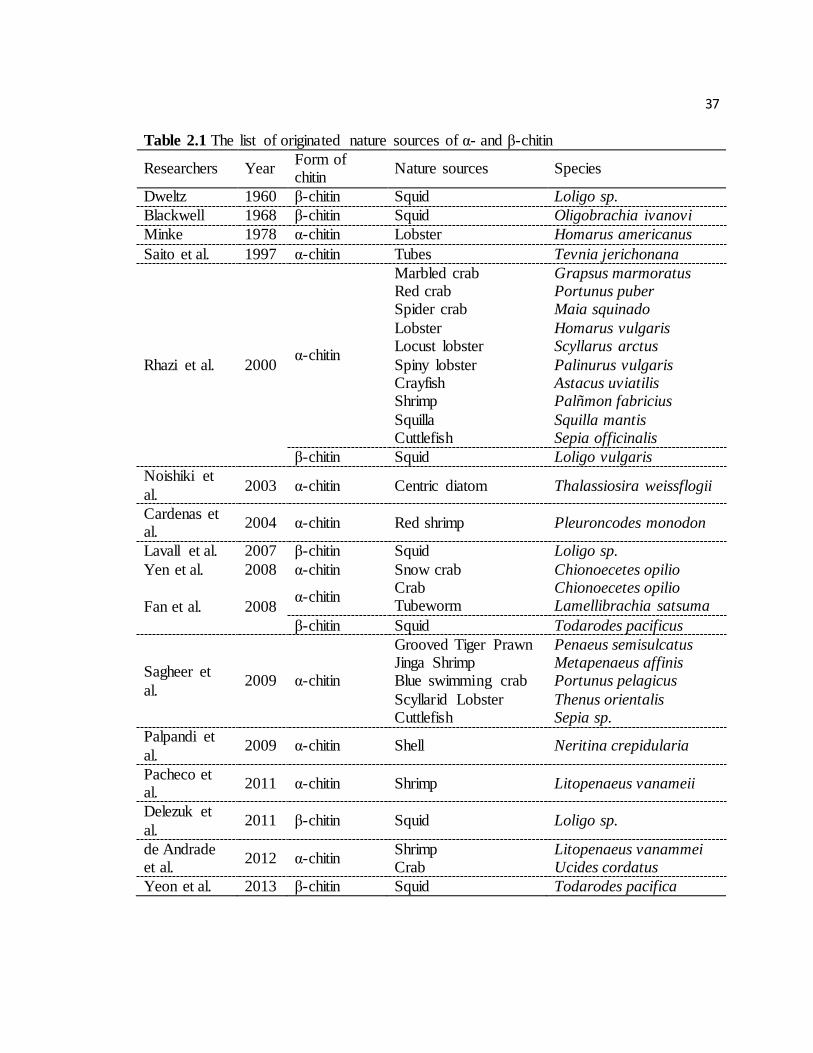
37
Table 2.1 The list of originated nature sources of α- and β-chitin
Researchers Year Form of chitin
Nature sources Species
Dweltz 1960 β-chitin Squid Loligo sp.
Blackwell 1968 β-chitin Squid Oligobrachia ivanovi
Minke 1978 α-chitin Lobster Homarus americanus
Saito et al. 1997 α-chitin Tubes Tevnia jerichonana
Rhazi et al. 2000 α-chitin
Marbled crab Red crab Spider crab
Lobster Locust lobster
Spiny lobster Crayfish Shrimp
Squilla Cuttlefish
Grapsus marmoratus Portunus puber Maia squinado
Homarus vulgaris Scyllarus arctus
Palinurus vulgaris Astacus uviatilis Palñmon fabricius
Squilla mantis Sepia officinalis
β-chitin Squid Loligo vulgaris
Noishiki et
al. 2003 α-chitin Centric diatom Thalassiosira weissflogii
Cardenas et al.
2004 α-chitin Red shrimp Pleuroncodes monodon
Lavall et al. 2007 β-chitin Squid Loligo sp.
Yen et al. 2008 α-chitin Snow crab Chionoecetes opilio
Fan et al. 2008 α-chitin
Crab Tubeworm
Chionoecetes opilio Lamellibrachia satsuma
β-chitin Squid Todarodes pacificus
Sagheer et
al. 2009 α-chitin
Grooved Tiger Prawn Jinga Shrimp Blue swimming crab
Scyllarid Lobster Cuttlefish
Penaeus semisulcatus Metapenaeus affinis Portunus pelagicus
Thenus orientalis Sepia sp.
Palpandi et
al. 2009 α-chitin Shell Neritina crepidularia
Pacheco et al.
2011 α-chitin Shrimp Litopenaeus vanameii
Delezuk et
al. 2011 β-chitin Squid Loligo sp.
de Andrade et al.
2012 α-chitin Shrimp Crab
Litopenaeus vanammei Ucides cordatus
Yeon et al. 2013 β-chitin Squid Todarodes pacifica
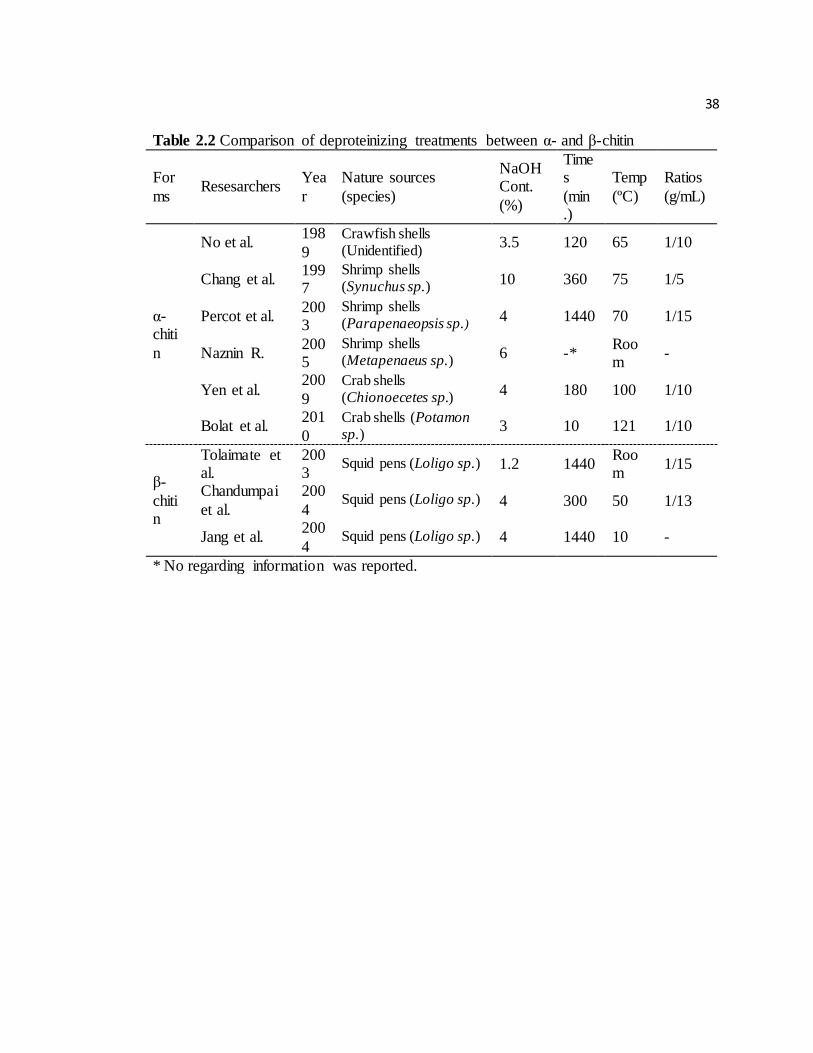
38
Table 2.2 Comparison of deproteinizing treatments between α- and β-chitin
For
ms Resesarchers
Yea
r
Nature sources
(species)
NaOH Cont.
(%)
Times
(min.)
Temp
(ºC)
Ratios
(g/mL)
α-chiti
n
No et al. 198
9
Crawfish shells (Unidentified)
3.5 120 65 1/10
Chang et al. 1997
Shrimp shells (Synuchus sp.) 10 360 75 1/5
Percot et al. 2003
Shrimp shells (Parapenaeopsis sp.) 4 1440 70 1/15
Naznin R. 2005
Shrimp shells (Metapenaeus sp.) 6 -*
Room
-
Yen et al. 200
9
Crab shells (Chionoecetes sp.) 4 180 100 1/10
Bolat et al. 201
0
Crab shells (Potamon sp.)
3 10 121 1/10
β-
chitin
Tolaimate et al.
2003
Squid pens (Loligo sp.) 1.2 1440 Room
1/15
Chandumpai
et al.
200
4 Squid pens (Loligo sp.) 4 300 50 1/13
Jang et al. 200
4 Squid pens (Loligo sp.) 4 1440 10 -
* No regarding information was reported.
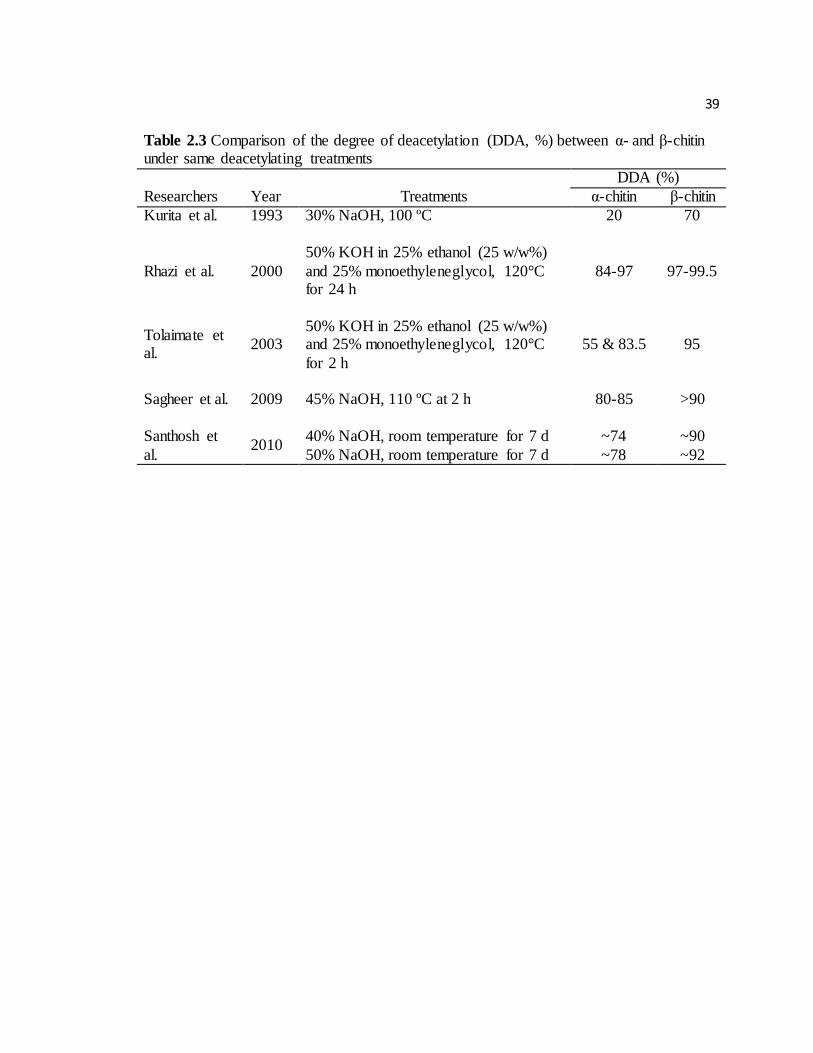
39
Table 2.3 Comparison of the degree of deacetylation (DDA, %) between α- and β-chitin under same deacetylating treatments
DDA (%)
Researchers Year Treatments α-chitin β-chitin
Kurita et al. 1993 30% NaOH, 100 ºC 20 70
Rhazi et al. 2000
50% KOH in 25% ethanol (25 w/w%)
and 25% monoethyleneglycol, 120°C for 24 h
84-97 97-99.5
Tolaimate et al.
2003 50% KOH in 25% ethanol (25 w/w%) and 25% monoethyleneglycol, 120°C
for 2 h
55 & 83.5 95
Sagheer et al. 2009 45% NaOH, 110 ºC at 2 h 80-85 >90
Santhosh et
al. 2010
40% NaOH, room temperature for 7 d ~74 ~90
50% NaOH, room temperature for 7 d ~78 ~92
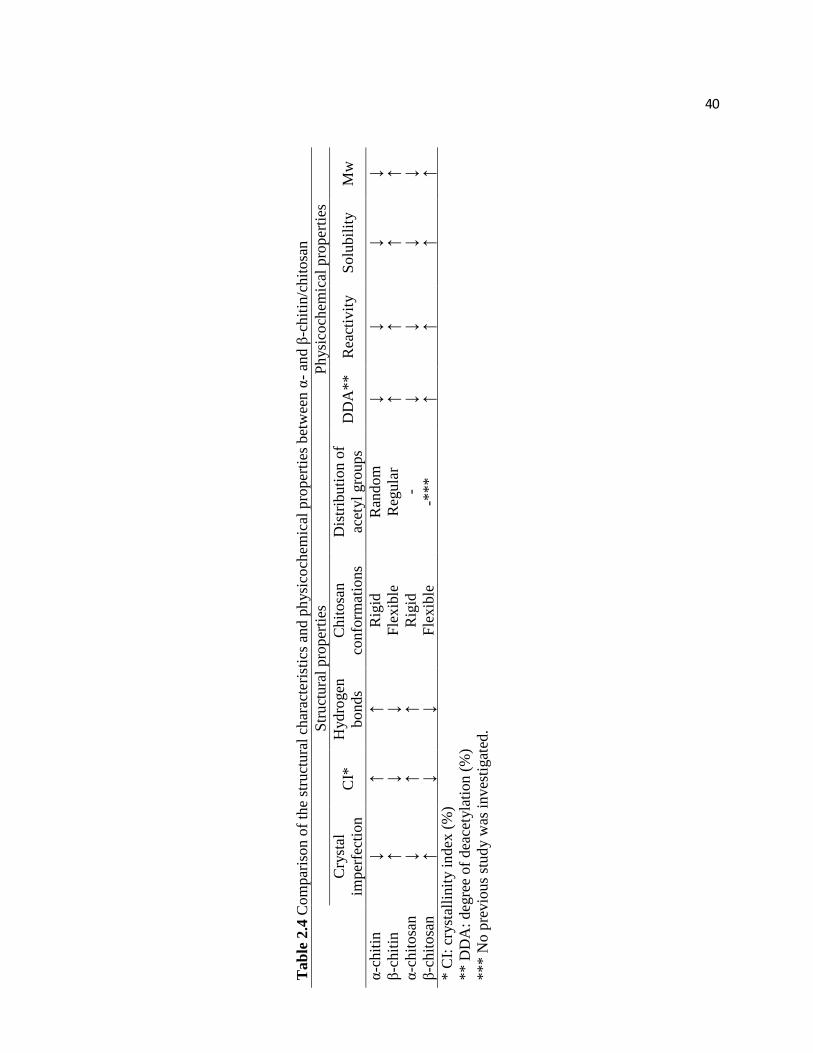
40
Ta
ble
2.4
Co
mp
aris
on
of
the
stru
ctu
ral
char
acte
rist
ics
and p
hysi
coch
emic
al p
rop
erti
es b
etw
een
α-
and
β-c
hit
in/c
hit
osa
n
S
tru
ctu
ral
pro
per
ties
P
hysi
coch
emic
al p
rop
erti
es
Cry
stal
imp
erfe
ctio
n
CI*
H
yd
rogen
bo
nd
s
Ch
ito
san
con
form
atio
ns
Dis
trib
uti
on
of
acet
yl
gro
up
s D
DA
**
R
eact
ivit
y
So
lub
ilit
y
Mw
α-c
hit
in
↓
↑
↑
Rig
id
Ran
do
m
↓
↓
↓
↓
β-c
hit
in
↑
↓
↓
Fle
xib
le
Reg
ula
r ↑
↑
↑
↑
α-c
hit
osa
n
↓
↑
↑
Rig
id
- ↓
↓
↓
↓
β-c
hit
osa
n
↑
↓
↓
Fle
xib
le
-**
*
↑
↑
↑
↑
* C
I: c
ryst
alli
nit
y i
nd
ex (
%)
**
DD
A:
deg
ree
of
dea
cety
lati
on
(%
)
**
* N
o p
rev
iou
s st
ud
y w
as i
nv
esti
gat
ed.
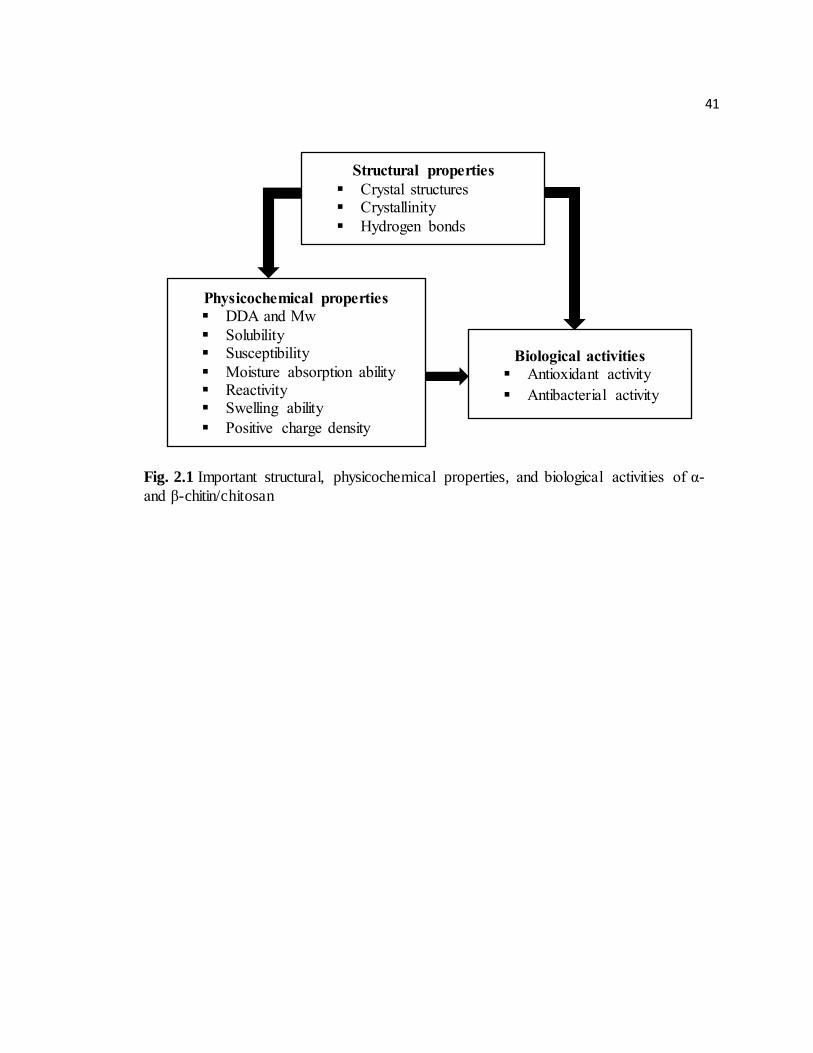
41
Fig. 2.1 Important structural, physicochemical properties, and biological activities of α-
and β-chitin/chitosan
Structural properties
Crystal structures Crystallinity
Hydrogen bonds
Physicochemical properties DDA and Mw
Solubility Susceptibility
Moisture absorption ability Reactivity Swelling ability
Positive charge density
Biological activities Antioxidant activity
Antibacterial activity
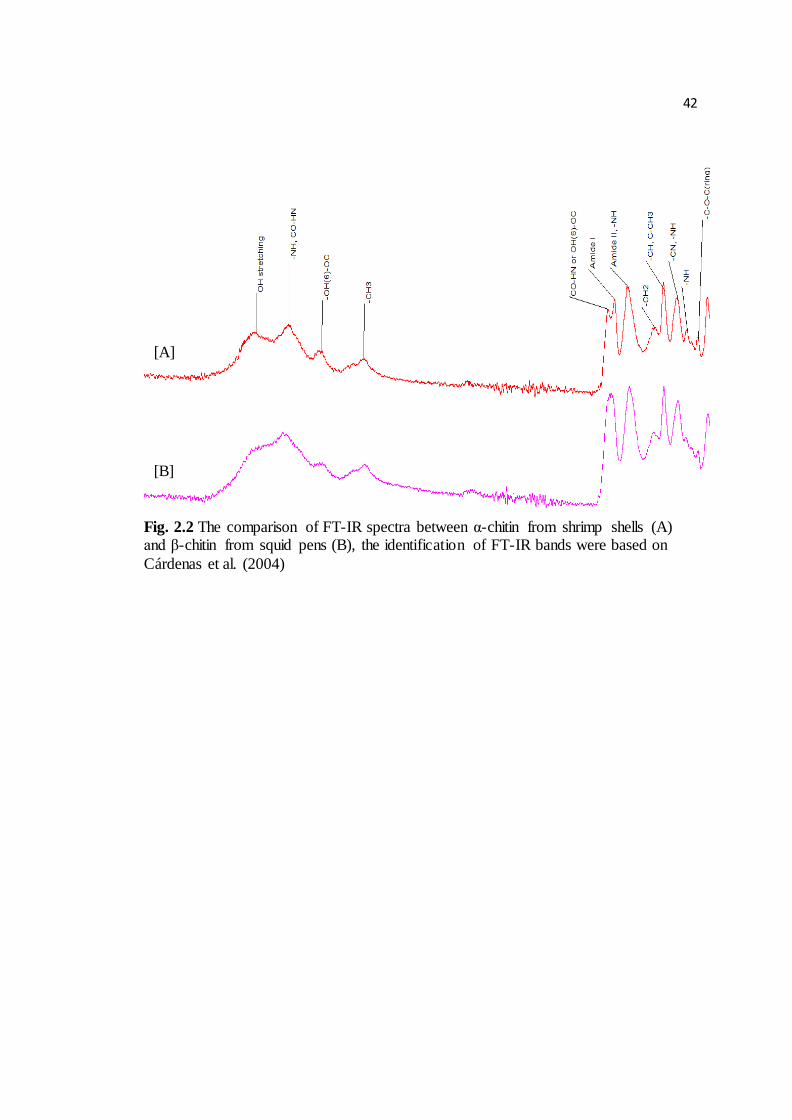
42
Fig. 2.2 The comparison of FT-IR spectra between α-chitin from shrimp shells (A) and β-chitin from squid pens (B), the identification of FT-IR bands were based on
Cárdenas et al. (2004)
[A]
[B]
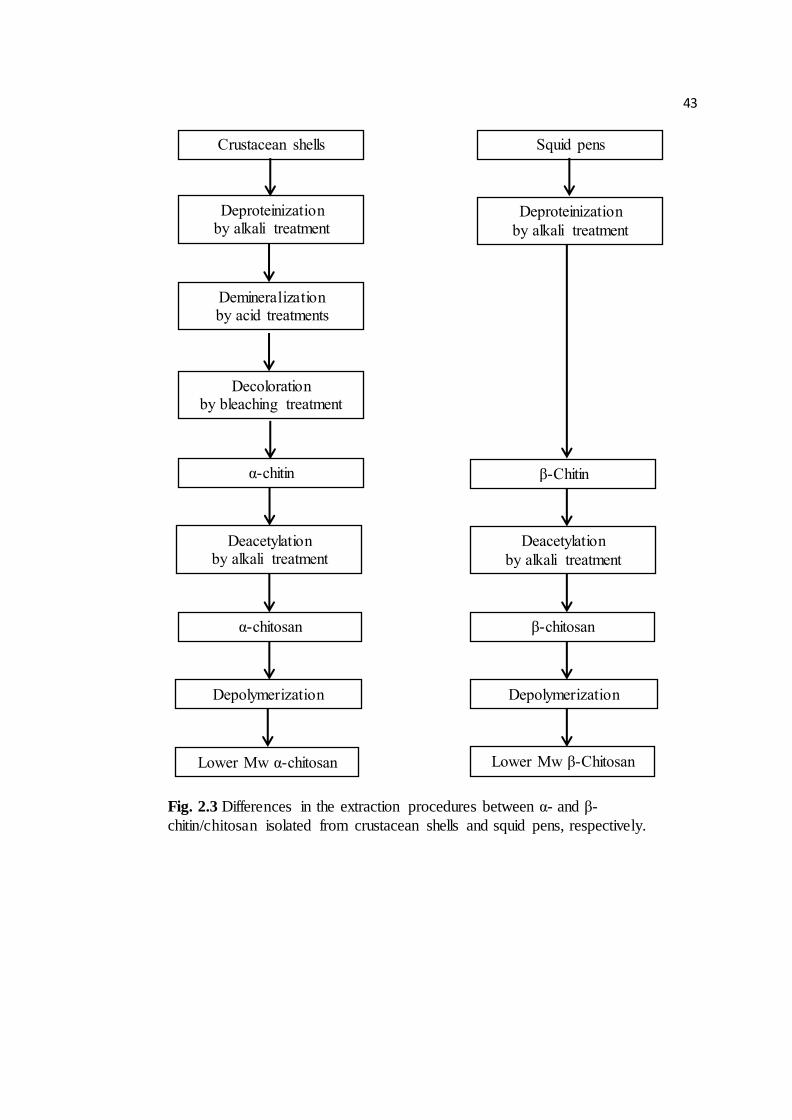
43
Fig. 2.3 Differences in the extraction procedures between α- and β-
chitin/chitosan isolated from crustacean shells and squid pens, respectively.
Squid pens
Deproteinization
by alkali treatment
Deacetylation
by alkali treatment
β-chitosan
Depolymerization
β-Chitin
Lower Mw β-Chitosan
Crustacean shells
Deproteinization by alkali treatment
Deacetylation by alkali treatment
α-chitosan
Depolymerization
α-chitin
Lower Mw α-chitosan
Demineralization by acid treatments
Decoloration by bleaching treatment
44
CHAPTER 3
CHARACTERISTICS OF DEACETYLATION AND DEPOLYMERIZATION OF
β-CHITIN FROM JUMBO SQUID PENS (DOSIDICUS GIGAS) PENS
Jung, J., Zhao, Y. Published in Carbohydrate Research 2011, 346, 1876-1884.
45
ABSTRACT
The jumbo squid (Dosidicus gigas) pens are good sources of β-chitin. Compared with
α-chitin that are usually obtained from shrimp and crab shells, β-chitin is more soluble
and reactive to solvent due to its parallel structure and no inter-hydrogen bonding,
making it more reactive and affinitive toward solvents, thus more applicable.
However, no reported study has investigated the deacetylation and depolymerization
characteristics of β-chitin from jumbo squid pens to obtain β-chitosan. This study
evaluated the deacetylation process of β-chitin from jumbo squid pens by using strong
alkaline reagent of NaOH or KOH. Taguchi design with the orthogonal array was
employed to identify the contributing factors on molecular mass (MM) and degree of
deacetylation (DDA) of obtained chitosan, including reagent concentration (40, 50%),
treatment temperature (60, 90 °C), time (2, 4, 6 h), and step (1, 2, 3) for NaOH
treatment and temperature (90, 120 °C), time (2, 4, 6 h), and step (1, 2, 3) for KOH
treatment. Obtained chitosan was further depolymerized by using cellulase or
lysozyme. The optimal treatment conditions for achieving high MM and DDA of
chitosan were identified as: using 40% NaOH at 90 °C for 6 h with 3 separate steps
(2h + 2h + 2h) or 50% NaOH at 90 °C for 6 h with 1 step, or using 50% KOH at
90 °C for 4 h with 3 steps (1h + 1h + 2h) or 6 h with 1 step. The most contributing
factor affecting DDA and MM was temperature and time, respectively. Cellulase
resulted in higher degradation ratio, lower relative viscosity, and larger amount of
reducing end formations than that of lysozyme due to its higher susceptibility. The
fast degradation was observed during the initial 1 ~ 2 h enzymatic treatment. This
study demonstrated that the jumbo squid pens are good sources of materials to
produce β-chitosan with high DDA and a wide range of MM for various applications.
46
Key words: jumbo squid pens, β-chitosan, deacetylation, depolymerization
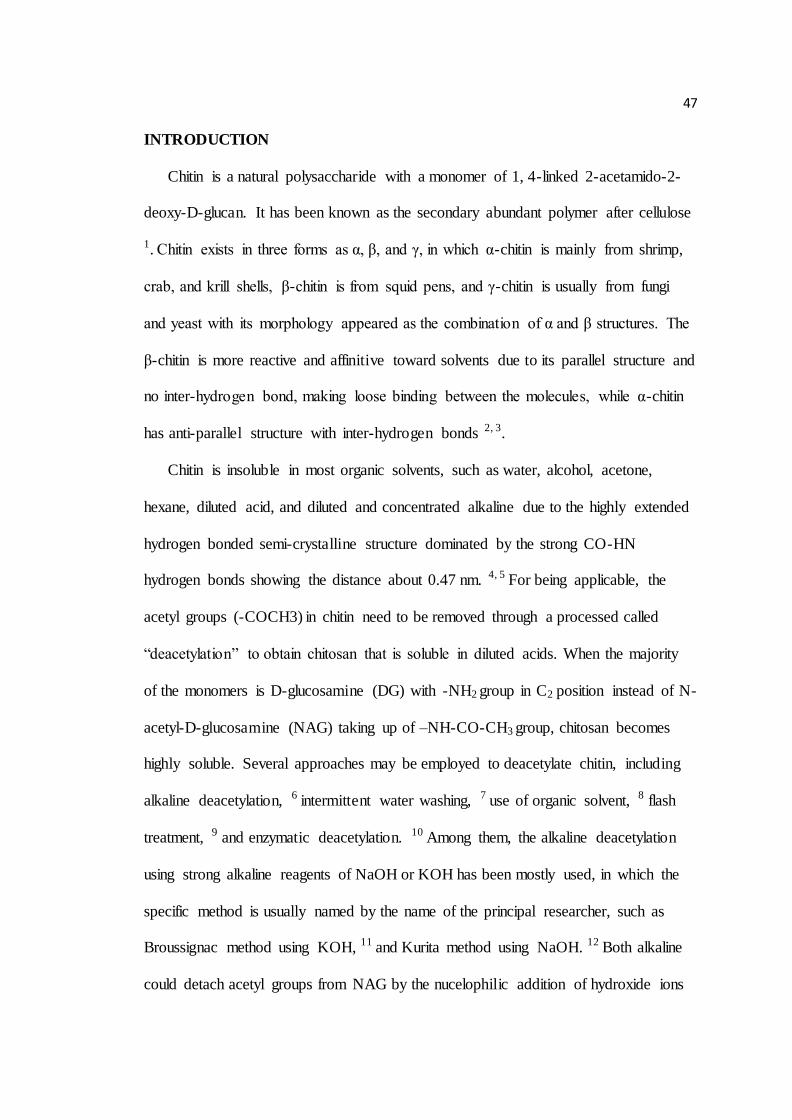
47
INTRODUCTION
Chitin is a natural polysaccharide with a monomer of 1, 4-linked 2-acetamido-2-
deoxy-D-glucan. It has been known as the secondary abundant polymer after cellulose
1. Chitin exists in three forms as α, β, and γ, in which α-chitin is mainly from shrimp,
crab, and krill shells, β-chitin is from squid pens, and γ-chitin is usually from fungi
and yeast with its morphology appeared as the combination of α and β structures. The
β-chitin is more reactive and affinitive toward solvents due to its parallel structure and
no inter-hydrogen bond, making loose binding between the molecules, while α-chitin
has anti-parallel structure with inter-hydrogen bonds 2, 3.
Chitin is insoluble in most organic solvents, such as water, alcohol, acetone,
hexane, diluted acid, and diluted and concentrated alkaline due to the highly extended
hydrogen bonded semi-crystalline structure dominated by the strong CO-HN
hydrogen bonds showing the distance about 0.47 nm. 4, 5 For being applicable, the
acetyl groups (-COCH3) in chitin need to be removed through a processed called
“deacetylation” to obtain chitosan that is soluble in diluted acids. When the majority
of the monomers is D-glucosamine (DG) with -NH2 group in C2 position instead of N-
acetyl-D-glucosamine (NAG) taking up of –NH-CO-CH3 group, chitosan becomes
highly soluble. Several approaches may be employed to deacetylate chitin, including
alkaline deacetylation, 6 intermittent water washing, 7 use of organic solvent, 8 flash
treatment, 9 and enzymatic deacetylation. 10 Among them, the alkaline deacetylation
using strong alkaline reagents of NaOH or KOH has been mostly used, in which the
specific method is usually named by the name of the principal researcher, such as
Broussignac method using KOH, 11 and Kurita method using NaOH. 12 Both alkaline
could detach acetyl groups from NAG by the nucelophilic addition of hydroxide ions
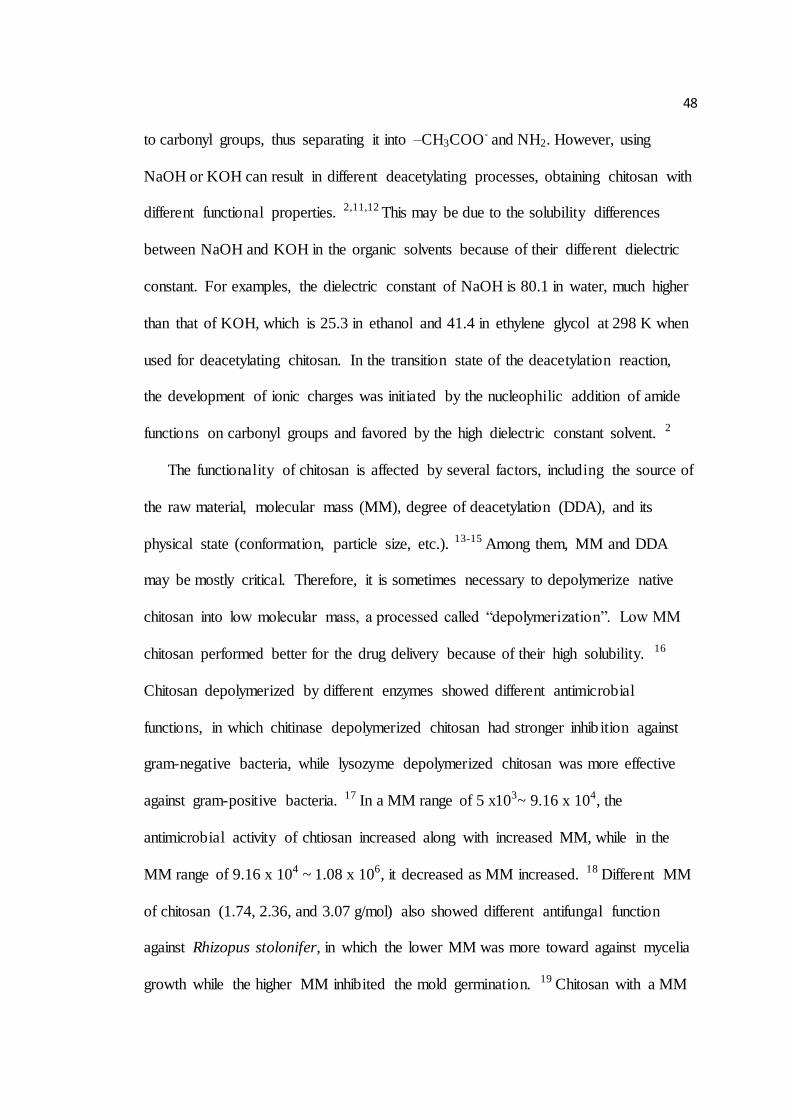
48
to carbonyl groups, thus separating it into –CH3COO- and NH2. However, using
NaOH or KOH can result in different deacetylating processes, obtaining chitosan with
different functional properties. 2,11,12 This may be due to the solubility differences
between NaOH and KOH in the organic solvents because of their different dielectric
constant. For examples, the dielectric constant of NaOH is 80.1 in water, much higher
than that of KOH, which is 25.3 in ethanol and 41.4 in ethylene glycol at 298 K when
used for deacetylating chitosan. In the transition state of the deacetylation reaction,
the development of ionic charges was initiated by the nucleophilic addition of amide
functions on carbonyl groups and favored by the high dielectric constant solvent. 2
The functionality of chitosan is affected by several factors, including the source of
the raw material, molecular mass (MM), degree of deacetylation (DDA), and its
physical state (conformation, particle size, etc.). 13-15 Among them, MM and DDA
may be mostly critical. Therefore, it is sometimes necessary to depolymerize native
chitosan into low molecular mass, a processed called “depolymerization”. Low MM
chitosan performed better for the drug delivery because of their high solubility. 16
Chitosan depolymerized by different enzymes showed different antimicrobial
functions, in which chitinase depolymerized chitosan had stronger inhib ition against
gram-negative bacteria, while lysozyme depolymerized chitosan was more effective
against gram-positive bacteria. 17 In a MM range of 5 x10³~ 9.16 x 10⁴, the
antimicrobial activity of chtiosan increased along with increased MM, while in the
MM range of 9.16 x 10⁴ ~ 1.08 x 10⁶, it decreased as MM increased. 18 Different MM
of chitosan (1.74, 2.36, and 3.07 g/mol) also showed different antifungal function
against Rhizopus stolonifer, in which the lower MM was more toward against mycelia
growth while the higher MM inhibited the mold germination. 19 Chitosan with a MM
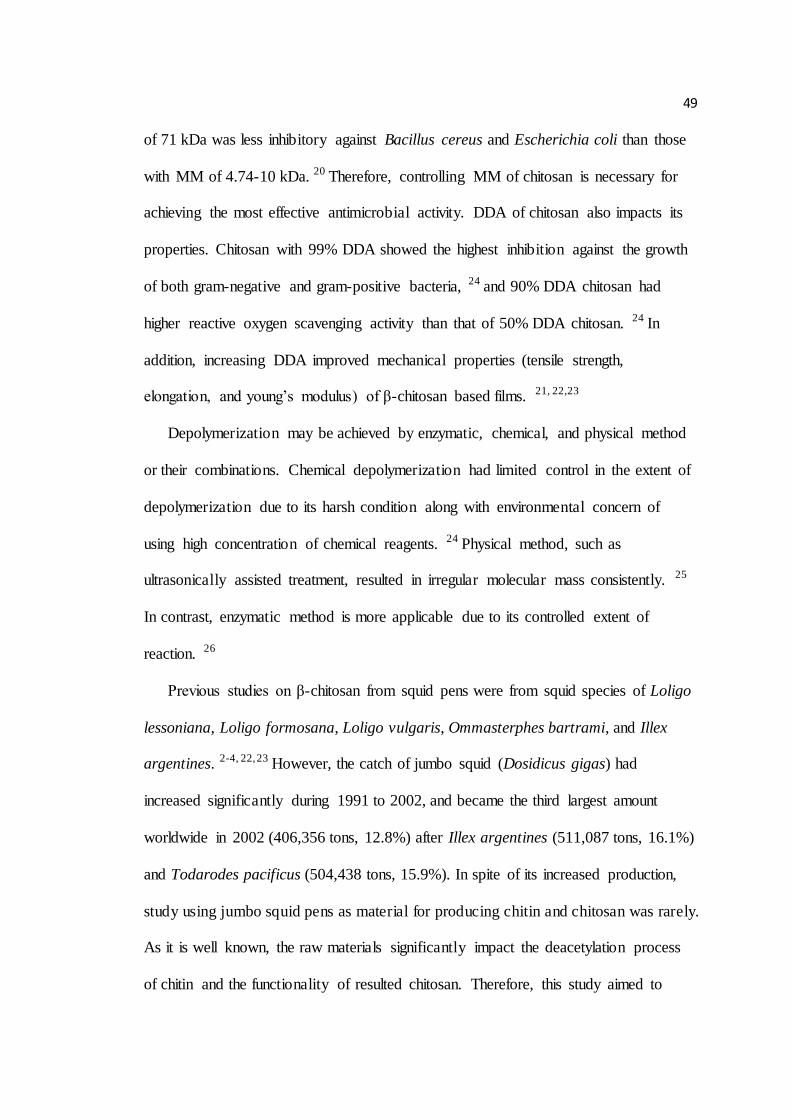
49
of 71 kDa was less inhibitory against Bacillus cereus and Escherichia coli than those
with MM of 4.74-10 kDa. 20 Therefore, controlling MM of chitosan is necessary for
achieving the most effective antimicrobial activity. DDA of chitosan also impacts its
properties. Chitosan with 99% DDA showed the highest inhibition against the growth
of both gram-negative and gram-positive bacteria, 24 and 90% DDA chitosan had
higher reactive oxygen scavenging activity than that of 50% DDA chitosan. 24 In
addition, increasing DDA improved mechanical properties (tensile strength,
elongation, and young’s modulus) of β-chitosan based films. 21, 22,23
Depolymerization may be achieved by enzymatic, chemical, and physical method
or their combinations. Chemical depolymerization had limited control in the extent of
depolymerization due to its harsh condition along with environmental concern of
using high concentration of chemical reagents. 24 Physical method, such as
ultrasonically assisted treatment, resulted in irregular molecular mass consistently. 25
In contrast, enzymatic method is more applicable due to its controlled extent of
reaction. 26
Previous studies on β-chitosan from squid pens were from squid species of Loligo
lessoniana, Loligo formosana, Loligo vulgaris, Ommasterphes bartrami, and Illex
argentines. 2-4, 22, 23 However, the catch of jumbo squid (Dosidicus gigas) had
increased significantly during 1991 to 2002, and became the third largest amount
worldwide in 2002 (406,356 tons, 12.8%) after Illex argentines (511,087 tons, 16.1%)
and Todarodes pacificus (504,438 tons, 15.9%). In spite of its increased production,
study using jumbo squid pens as material for producing chitin and chitosan was rarely.
As it is well known, the raw materials significantly impact the deacetylation process
of chitin and the functionality of resulted chitosan. Therefore, this study aimed to
50
investigate the optimal deacetylation procedure of β-chitin from jumbo squid pens and
the enzymatic depolymerization of obtained β-chitosan to produce a series of low
MM chitosan material. Different factors potentially contributing to the deacetylation
process of chitosan, including the type and concentration of alkaline, reaction
temperature, time, and treatment step were considered statistically. Based on our best
knowledge, no study has reported the deacetylaiton and deploymerization
characteristics of β-chitin from jumbo squid pens, neither considering all these major
contributing factors statistically.
MATERIALS AND METHODS
Materials
The β-chitin from jumbo squid (Dosidicus gigas) pens was provided by Dosidicus
LLC, USA. Samples were ground into about 18 mesh size by a grinder (Glenmills
Inc., USA) and stored inside a desiccator till deacetylation treatment. Sodium
hydroxide (NaOH) and potassium hydroxide (KOH) were purchased with pellet type
from the Mallinckndt Chemicals Co. (USA). N-acetyl-D-glucosamine and
monoethylene glycol were from Sigma Chemical Co. (USA). Toluidine blue indicator
and 1/400 potassium polyvinyl sulfate (PVS) were from Wako Chemicals (USA). Hen
egg white lysozyme and cellulase from Aspergillus niger were obtained from Fordras
S.A. (SWISS) and TCI America (USA), respectively. All chemicals were of reagent
grade.
Deacetylation of Chitin
51
In this study, two different alkaline deacetylation processes were carried out:
Kurita method using NaOH as reagent and Broussignac method using KOH, named
by the names of the primary researchers. Depending on the type of chitin and alkaline
reagents employed, the deacetylation process may respond differently. Using NaOH
might result in β-chitosan with higher DDA and MM in the moderate treatment
condition (40% NaOH at 80 °C) as compared with the use of KOH. 2,11 However, the
opposite behavior might be observed on α-chitin at the same treatment condition. 2
Hence, it is necessary to investigate which alkaline solvent performs more
appropriately on β-chitin from jumbo squid pens.
While using Kurita method, 27 NaOH was first diluted to targeted concentrations
by dissolving in distilled water. Chitin was then added into NaOH solution at a ratio
of 1:20. Four treatment factors, including NaOH concentration (40, 50%), temperature
(60, 90 °C), time (2, 4, 6 h), and treatment step (1, 2, 3 times) were investigated. The
typical deacetylation condition for α-chitin from shrimp or squilla shells were using
40-50% NaOH at 80-100 °C for 6-12 h. 2 Since the squid pens from the species of
Dosidicus gigas are much smaller and thinner than other frequently used ones (Loligo
or Illex pens), the mild treatment condition could be applied. The multiple treatment
steps at same treatment time were evaluated for the possible prevention of chitosan
degradation during deacetylation. 2 After NaOH treatment under given conditions,
samples were washed with distilled water to reach neutral pH and the remained
residue was washed out with methanol and acetone. Samples were then dried at 50 °C
in a dry oven (Precision Scientific Inc., USA) for 24 h.
In Broussignac method, 11 KOH (50% w/w) was dissolved in a mixture of 96%
ethanol (25% w/w) and monoethylene glycol (25% w/w) solution. Chitin was then

52
added into the solution mixture at a ratio of 1:20. According to the previous study,
Broussignac process required a minimal treatment condition of 90 °C for 2 h to obtain
soluble chitosan in 1% acetic acid. 2 Therefore, three treatment factors including
temperature (90, 120 °C), time (2, 4, 6 h), and treatment step (1, 2, 3 times) were
considered. After the treatment, same washing and drying procedures as those in the
Kurita method were applied.
DDA, intrinsic viscosity, and MM obtained at each treatment condition were
determined using the methods described below. Taguchi experimental design with
orthogonal arrays was applied for each method (Table 3.1). By using orthogonal
arrays, it was expected that the optimal treatment conditions for obtaining chitosan
with high DDA and desirable MM values can be identified with minimal treatment
combinations (9 in this study) in each method. The most contributed factors and their
levels could be identified through the Taguchi design.
Depolymerization of chitosan
High molecular mass (HMM) and low molecular mass (LMM) chitosan prepared
from the deacetylation study were depolymerized by using cellulase or lysozyme,
known to have different susceptibilities based on the properties of chitosan. Chitosan
samples were dissolved in 5% acetic acid solution at a ratio of 2:100 (chitosan:
solvent). Cellulase or lysozyme was added into the solution at 1% (w/w) and reacted
for up to 7 h. A 20 ml of solution was taken out hourly and then boiled for 10 min to
stop the enzymatic reaction. Sodium hydroxide was then added into the solution to
reach a final pH 11 for precipitation. Precipitated samples were washed with distilled
53
water to remove other residues and dried in a 42 ºC oven for 24 h. MM and DDA of
the depolymerized chitosan were measured at each sampling time.
Measurement of Degree of Deacetylation
DDA was measured by using the colloidal titration method. 6 A 50 mg of
deacetylated chitosan (0.5%, w/w) was dissolved in 10 ml of 5% (v/v) acetic acid
solution, and then transferred into a flask and diluted up to 30 ml with distilled water.
After adding 100 µl of toluidine blue indicator, the solution was titrated by the 1/400
potassium polyvinyl sulfate (PPVS) till the solution color changed from blue to violet.
DDA was calculated as:
DDA (%) = (X/161) / (X/161) + (Y/203) (1)
X = 1/400*1/1000*F*161*V (2)
Y = 0.5 * 1/100 – X (3)
where X was the weight of D-glucosamine residue, g; F was the factor of 1/400 PVS;
V was the volume of consumed PPVS, ml; Y was the weight of N-acetyl-D-
glucosamine residue, g; and 161 and 203 in Equ. (1) was the molecular weight of D-
glucosamine and N-acetyl-D-glucosamine (2-acetamido-2-deoxy-D-glucose),
respectively.
Determination of Intrinsic Viscosity and Viscosity-Average Mw
Intrinsic viscosity of chitosan was determined by using the Ubbelohde Dilution
Viscometer (Cannon instrument Co., USA) that has the capillary size of 0.58 mm in a
water bath at 25 °C. Viscosity-average molecular mass (MM) was then calculated
from measured intrinsic viscosity. Solutions used for measuring MM of chitosan

54
samples from deacetylation and depolymerization treatments were different. This is
mainly because chitosan samples obtained from the deacetylation and
depolymerization experiments had different DDA, thus required different strengths of
acid to completely dissolve for ensuring accurate MM measurement. Our preliminary
studies (data not shown) evaluated three types of acid solution that are commonly
used for measuring MM in chitosan: 0.1M CH3COOH, 0.1M CH3COOH /0.2M NaCl,
and 0.3M CH3COOH /0.2M CH3COONa, and found that 0.1M acetic acid is able to
dissolve all chitosan samples, thus was chosen for measuring MM of chitosan samples
in the deacetylation study. The same test was carried out for identifying the solution
in measuring MM of depolymerized chitosan by focusing on finding more precise
measurement of MM using a commercial chitosan with known MM as an indicator.
The 0.1M CH3COOH/0.2M NaCl solution provided the closest MM value as that
reported on the commercial chitosan.
Four different concentrations of chitosan in a range of 0.05% ~ 0.1% were used
for measuring the viscosity of the samples. The intrinsic viscosity was measured by
the intercept between the Huggins (reduced viscosity, Ƞ sp/C~C) and Kraemer
(relative viscosity, Ƞ rel/C ~C) plots when the concentration was 0 16. Relative
viscosity, reduced viscosity, and intrinsic viscosity were determined as:
Ƞ rel = t/t0 (4)
Ƞ sp = Ƞ rel – 1, Ƞ red = Ƞ sp/C (5)
[Ƞ] = (Ƞ sp/C) c=0 = (ln (Ƞ rel)/C) c=0 (6)
where t was the flow time measured for the sample solution at a given time t; t0 was
the flow time of the solution (0.1M acetic acid and 0.1M acetic acid/0.2M sodium
chloride) at t=0; and C was the concentration of chitosan samples in diluted solution.
55
The viscosity-average molecular mass (MM) of chitosan was calculated by Mark-
Houwink-Sakurada (MHS) equation (7):
[Ƞ] = K (MM) a (7)
where K and a were the constants, K=1.81 x 10⁻³, a = 0.93 11; and [Ƞ] was the intrinsic
viscosity obtained from the Huggins and Kraemer plots.
Chitosan Hydrolyzing Activity Assay 26
The extent of hydrolyzing activity in chitosan was measured by investigating the
relative viscosity and reducing ends. One percent (w/w) of chitosan solution was
prepared in 100 mM sodium acetate buffer with a pH 4.5. Cellulase or lysozyme was
added into the solution in a ratio of 1:100 (w/w), respectively, and the reactions
continued for 210 min at a 40 °C water bath to compare hydrolyzing activity between
the two enzymes.
Viscosity of chitosan solutions at different reaction times with the enzymes were
measured by using a Brookfield DV-ш + viscometer (Brookfield Inc., USA). Changes
of the viscosity were expressed as the relative viscosity with respect to the control,
enzyme-free chitosan solution 26.
Relative viscosity (%) = [(Initial viscosity (cp) – Reduced viscosity (cp))/Initial
viscosity (cp)] *100
The absorbance of the reducing ends of chitosan was measured using the method
of Shales 28 with some modifications 26. Samples (3 ml) were extracted from the
solution at different reaction times, boiled for 10 min to inactivate enzymes, and
reacted with 4 ml solution of 0.5 g/l potassium ferricyanide dissolved in 0.5M sodium
carbonate. Mixtures were then boiled for 15 min for inducing color changed by the
56
amount of reducing ends. After cooled down, samples were centrifuged to remove the
precipitated chitosan. One ml of distilled water was added into 2 ml of supernatant,
and the absorbance of the solution was measured at 420 nm in a UV spectrophotomter
(Shimadzu UV 160U, JAPAN).
Experimental Design and Data Analysis
Taguchi design was used in the deacetylation study to identify optimal
deacetylation conditions. The orthogonal arrays used in the Taguchi design had nine
treatment trials (combinations) for both Kurtia and Broussignac methods as shown in
Table 3.1. Each experimental run represented one trial. This array was designed for
determining 1) the contribution of individual treatment factor, and 2) the level of each
factor. The Taguchi design offered a simple and systematic approach to optimize the
experiments, and could significantly reduce numbers of treatment combinations when
multiple factors were considered. 29
In the Taguchi design, two parameters were applied to optimize the treatment
conditions. The first parameter (Kij) was the average value of each measured
functional parameter in level j (j=1, 2, 3) of each factor i (i=A, B, C, D) and expressed
as
iN
u
ji
i
ij yN
K1
,
1
where i represented the factor A, B, C, and D; j represented the level 1, 2, and 3; Ni is
the number of trials for each factor, and yi,j is the measured values of factor i at level j.
This parameter could explain how targeted parameters were changed in different
levels of each treatment factor.
57
The second parameter, Ri, was the difference between the highest and lowest
values of Kij, and determined the most contributed factor among all factors. Ri was
calculated as
iR=
minmax ijij KK
where (Kij) max and (Kij) min indicated the highest and lowest values of the measured
parameter in each factor, respectively. As Ri values increased among different factors,
the factor which showed the highest value was the most contributed factor in
determining the characteristics of the samples. Hence, by using Taguchi design, the
levels in each factor and the most contributed factor could be identified by using only
9 treatment combinations.
Deacetylation study was conducted in triplicates and each was considered as a
block. A one-way ANOVA was carried out to determine the significant differences
among different factors and their levels, and the Tukey test was done for multiple
comparisons in Taguchi design (SAS 9.2, SAS Institute, Inc., USA).
A completely randomized 2 x 2 x 8 factorial design was applied in the
depolymerization study with two replications. Three independent factors were the
type of enzymes (cellulase and lysozyme), the initial MM of chitosan (HMM and
LMM), and depolymerized time (0 ~ 7 h). Interactions among the 3 factors were
determined. PROC GLM was applied to determine significant difference (P<0.05)
among treatment factors using the SAS program (SAS 9.2, SAS Institute, Inc., USA).
RESULTS AND DISCUSSIOS
Deacetylation of Chitin Using Kurita Method 27
Characteristics of Deacetylation
58
DDA ranged from 45% to 99% and MM from 5362 kDa to 11684 kDa (Table 3.2).
High DDA (>90%) of chitosan were all obtained at 90 °C treated with either 40 or 50%
NaOH for at least 4 h, in which relatively low MM was observed, indicated that the
severe treatment conditions removed more acetyl group from chitin, resulting in
higher DDA values and further degradation of chitosan molecules. The MM range
obtained in this study was similar to that by Chandumpai et al. (9110 ~ 10240 kDa) in
which 1% acetic acid solution was used to measure MM,3 but highly different from
the results by Tolaimate et al. (450 ~ 595 kDa) in which 0.3M acetic acid/0.2M
sodium acetate solution was used for measuring MM.30 As stated in the experimental
section, the molecular mass measured in this study was “viscosity-average molecular
mass” and highly related to the solubility of chitosan in the solvents, in turn, the type
of solvent used for dissolving chitosan samples. Previous studies indicated that MM
values measured by dissolving chitosan in acetic acid/sodium chloride and acetic
acid/sodium acetate were much lower than that by dissolving in diluted acid solution,
2, 3, 30 probably due to the electrostatic repulsion of chitosan as the polycationic
polymer in acidic solvent. The resolving process of chitosan is initiated by the
bindings between the hydrogen ions and free amine group to form a cation ion (NH3+)
when pH is below its pKa. Therefore, the amount of cation ions is important in
determining the solubility and viscosity due to their electrostatic repulsions. Viscosity
of a solution is increased along with increased amount of NH3+ since it made larger
spaces between the polymers for water trap, thus longer linear polymer stretching
out.31 However, anion ions, such as Cl- or CH3COO-, in sodium chloride or sodium
acetate could block the electrostatic repulsion between cation ions in chitosan, thus
decreasing its intrinsic viscosity. 32 The relatively low MM observed in low DDA
59
samples might also be owing to the rigid crystal structure of chitosan samples,
resulting in the lower solubility. 33, 34
Though there was no statistical difference on MM among nine treatment
conditions except the 1st and 9th runs (Table 3.2), MM generally decreased in the
severe treatment conditions of using higher NaOH concentration (50%) or longer
reaction time at 90 ºC (Table 3.2). Similarly, Chandumpai reported that MM of
chitosan gradually decreased along with increased treatment time from 2 to 8 h in 50%
NaOH at 100 ºC. 3 Tolaimate found that β-chitin deacetylated by 40% NaOH at 80 ºC
for 6 h has larger MM than that treated at the same condition for 9 h. 30 Hasegawa
also indicated that MM decreases along with increased concentrations of reagents and
temperatures. 33 Therefore, the higher concentration of deacetylation reagent and
longer reaction time further degraded the polymer. By contrast, Ottey did not show
the further polymer degradation by extended reaction time. 354
Optimal Deacetylation Conditions
Through Taguchi design the average values of three measured parameters (DDA,
intrinsic viscosity, and MM) and the rank of each contribution factor on these
parameters were obtained (Table 3.2). Since the intrinsic viscosity directly related to
MM, it was not discussed separately here. Ri value of NaOH concentration was the
lowest among all tested contributing factors on MM and DDA, Ri values of
temperature and time on DDA were ranked the first and second, and were the second
and first on MM, respectively. ANOVA results indicated that NaOH concentration
had no significant effect on all measured parameters, but both temperature and time
significantly affected DDA, but not MM (P<0.05). Therefore, regardless of the
60
treatment factors and their levels applied in this study while using Kurita method, no
polymer degradation (change of MM) occurred in the deacetylation process. Based on
this study, it may be concluded that the optimal deacetylation condition to obtain
chitosan with DDA values over 95% and without significant polymer degradation is
to use 40% NaOH at 90 ºC for 6 h with three divided steps (2 h +2 h +2 h) or using 50%
NaOH at 90 ºC for a straight 6 h.
Deacetylation of Chitosan using Broussignac Method 11
Characteristics of Deacetylation
Our preliminary study found that when using Broussignac method samples treated
at 60 ºC were visibly insoluble in 0.1M acetic acid (data not shown), thus increasing
reaction temperature to 90 and 120 ºC was necessary. DDA and MM ranged between
57 - 99% DDA and 34 - 11934 kDa, respectively (Table 3.3). The higher MM
chitosan were obtained at 90 °C for at least 4 h with 1 or 3 steps (5th, 6th and 8th runs),
while MM from treatment at 120 °C was significantly (P<0.05) lower than those at
90 °C except the one for 2 h (P>0.05). MM (1797 kDa) obtained at 90 ºC for 2 h with
2 divided steps was significantly lower than other samples treated at the same
temperature (P>0.05), probably owning to the lower solubility of chitosan as shown
by the low DDA of 57%. Similar to what was observed in Kurita method, the rigid
structure with hydrogen bonds in low DDA chitosan might induce lower solubility of
chitosan, thus affecting the measurement of MM. MM at 90 °C for 4 h with 3 divided
steps (1h + 1h + 2h) was significantly (P<0.05) higher than that from the same
condition with 1 straight step. Similarly, the MM of chitosan deacetylated for 6 h with
three divided steps (2h + 2h + 2h) was higher than that with two divided steps. This
61
might be explained as the multiple-step treatment help prevent the polymer
degradation. In the Kurita method, the highest MM was also obtained at 90 °C for 4 h.
Hence, the treatment condition to obtain the highest MM was at 90 °C for 4 h in both
methods. Compared with Kurita method, the MM range obtained from the
Broussignac method was wider, in which the higher treatment temperature may
attribute to the significant degradation of chitosan (decrease in MM).
In respect to DDA, 90 ºC for 4 h was a minimal condition required to obtain
chitosan with DDA over 90%, and the multiple-step helped increase DDA as shown
that 4 h with 3 divided steps (1h +1h +2h) gave a 93% DDA verse 87% DDA
obtained through a straight 4 h. DDA was over 90% when samples were treated at 120
ºC, and there was no significant difference in DDA in all 120 oC treated samples
regardless of time or multiple-step (P>0.05). The lowest DDA (57%) was observed on
samples treated at 90 °C for 2 h with 2 divided steps. Similar to our results, Tolaimate
found that 2 h treatment at 120 ºC results in DDA over 96%, confirming the important
role of temperature, and multi-step resulted in higher DDA compared to the single
step at the same treatment time. 2 In this study, sample treated at 120 ºC for 6 h with 3
divided steps had a 99% DDA, which was close to fully deacetylated chitosan.
Optimal Deacetylation Condition
Ri value of temperature was the highest among all contributing factors (Table 3.3),
and temperature significantly affected MM and DDA (P<0.05). This result indicated
that while the high temperature treatment increases DDA over 95%, chitosan
depolymerization occurred simultaneously. Time was the second contribution factor
on DDA, but did not show significant effect on MM. Hence, controlling treatment
62
time in Broussignac method may provide better control on MM and DDA of chitosan
than temperature as it could satisfy our goal to obtain chitosan with high DDA, but
less polymer degradation. Multiple-step was the least contributing factor on DDA,
and the second on MM. It did not affect DDA (P>0.05), but MM, which was different
from the result in Kurita method. This result was also inconsistent with the findings
by Tolaimate, in which multi-step treatment prevented depolymerization of MM when
temperature was at 80 ºC. 2 The difference might be due to the low solubility of some
chitosan samples, affecting the accuracy in MM measurement as stated previously. In
the future work, solubility of deacetylated chitosan should be considered as a
contributing factor in Taguchi design to obtain more accurate result.
Based on the results from this study, it may be concluded that the Broussignac
method was more applicable when lower MM and higher DDA chitosan were targeted,
while the Kurita method was more suitable for obtaining chitosan with higher MM
and higher DDA. This conclusion was similar to that by Tolaimate who compared
Kurita and Broussignac methods in the deacetylation of β-chitin from Loligo vulgaris
squid pens.2
Depolymerization of Chitosan by Commercial Enzymes
Enzyme type (ET), initial MM (IM), and depolymerization time (DT) were all
significant (P<0.05) factors affecting depolymerization of chitosan, and there were
significant (P<0.05) interactions between ET and DT, and IM and DT (P<0.05)
(Table 3.4). HMM (2100 KDa) and LMM (594 KDa) chitosan showed about 89% and
56% degradations, respectively by cellulase (EC3.2.1.4) in the first hour, had another
15-20% degradation in the following hour, but no further degradation after 2 h (Fig.

63
3.1). Lysozyme (EC 3.2.1.17) resulted in about 56% and 68% degradation in HMM
chitosan during the first and second hour treatment, but didn’t induce further
degradation after that, while the reaction on LMM chitosan was significantly slow, no
degradation occurred until after 5 h (15% and 47% degradation at 5 h and 6 h,
respectively). Therefore, chitosan depolymerization by enzymes was significantly
induced during the first 1-2 h of reaction except for lysozyme treatment on LMM
chitosan. The initial fast degradation was probably due to the predominant endo-
action of cellulase and lysozyme that broke internal bonds (1, 4-glycosidic linkage of
polysaccharides) of chitosan. 17 Previous study reported that chitosan depolymerized
by cellulase had 83.5% degradation in only 5 min, and 95.3% degradation in 4 h with
a final MM of 24 kDa. 36
The types of enzyme had significantly different impacts on the depolymerization
of HMM and LMM chitosan (P<0.05). MM values of lysozyme treated samples were
significantly (P<0.05) higher than that of cellulase treated ones regardless of the
difference in the initial MM. According to Lin, lysozyme had less susceptibility than
cellulase in terms of chitosan degradation since it only recognizes the site existed 3~5
of N-acetyl-D-glucosamine (NAG), while cellulase can randomly cleave 1, 4-
glycosidic linkages of chitosan regardless of the type of monomers. 17 Kurita found
that lysozyme had higher susceptibility in 57% DDA chitosan than in higher DDA
chitosan. 37 The initial DDA values of HMM and LMM chitosan were about 85% and
95%, respectively, and may explained the less degradation in LMM chitosan when
depolymerized by lysozyme.
DDA values were measured during the polymerization process to investigate the
potential impacts of the treatment factors (Table 3.6). The initial MM was the only
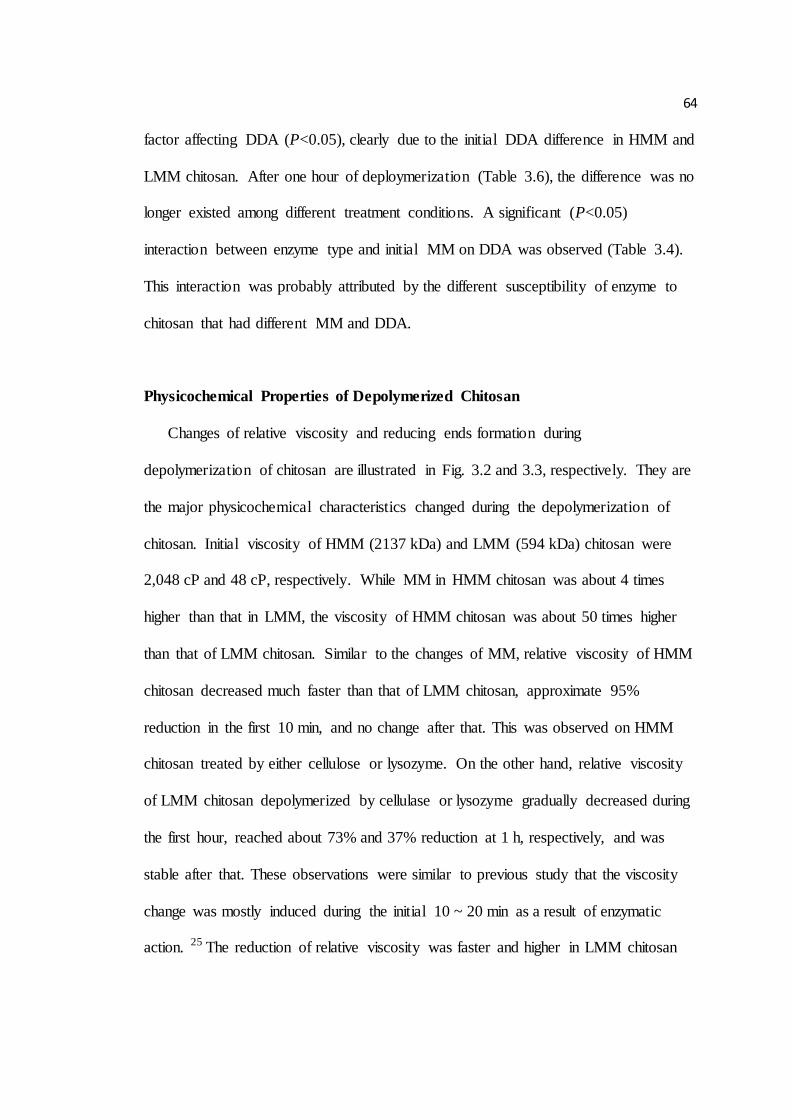
64
factor affecting DDA (P<0.05), clearly due to the initial DDA difference in HMM and
LMM chitosan. After one hour of deploymerization (Table 3.6), the difference was no
longer existed among different treatment conditions. A significant (P<0.05)
interaction between enzyme type and initial MM on DDA was observed (Table 3.4).
This interaction was probably attributed by the different susceptibility of enzyme to
chitosan that had different MM and DDA.
Physicochemical Properties of Depolymerized Chitosan
Changes of relative viscosity and reducing ends formation during
depolymerization of chitosan are illustrated in Fig. 3.2 and 3.3, respectively. They are
the major physicochemical characteristics changed during the depolymerization of
chitosan. Initial viscosity of HMM (2137 kDa) and LMM (594 kDa) chitosan were
2,048 cP and 48 cP, respectively. While MM in HMM chitosan was about 4 times
higher than that in LMM, the viscosity of HMM chitosan was about 50 times higher
than that of LMM chitosan. Similar to the changes of MM, relative viscosity of HMM
chitosan decreased much faster than that of LMM chitosan, approximate 95%
reduction in the first 10 min, and no change after that. This was observed on HMM
chitosan treated by either cellulose or lysozyme. On the other hand, relative viscosity
of LMM chitosan depolymerized by cellulase or lysozyme gradually decreased during
the first hour, reached about 73% and 37% reduction at 1 h, respectively, and was
stable after that. These observations were similar to previous study that the viscosity
change was mostly induced during the initial 10 ~ 20 min as a result of enzymatic
action. 25 The reduction of relative viscosity was faster and higher in LMM chitosan
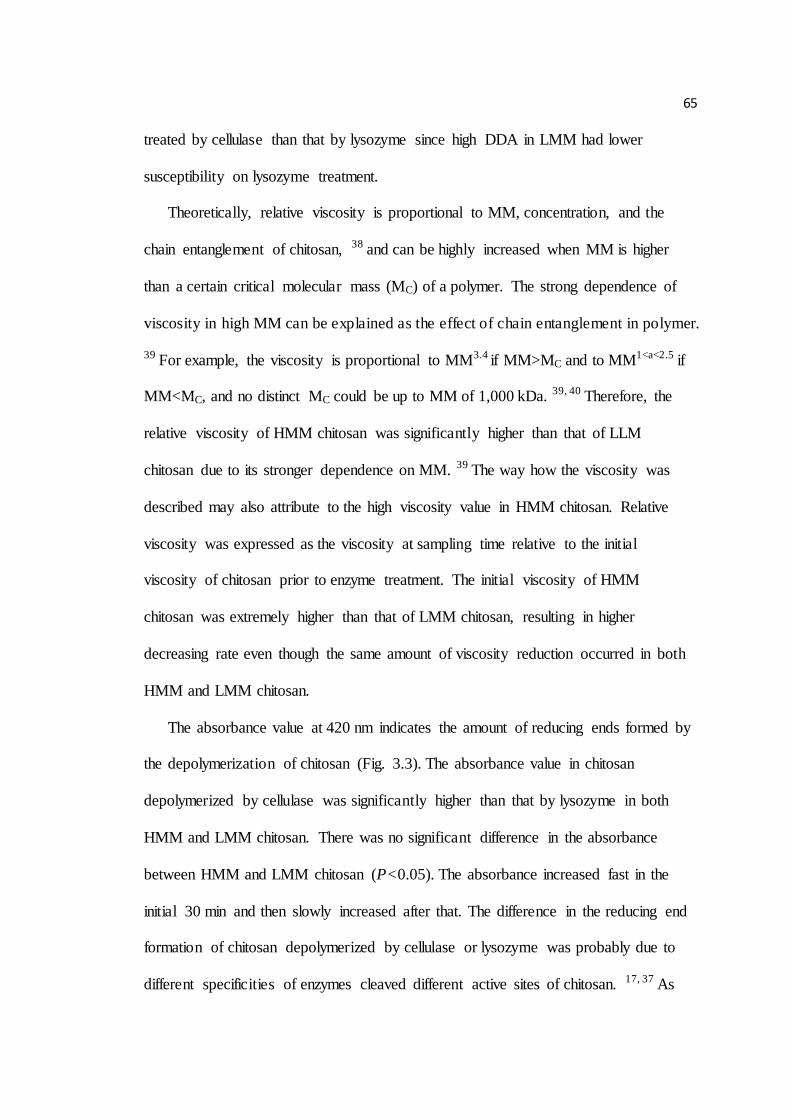
65
treated by cellulase than that by lysozyme since high DDA in LMM had lower
susceptibility on lysozyme treatment.
Theoretically, relative viscosity is proportional to MM, concentration, and the
chain entanglement of chitosan, 38 and can be highly increased when MM is higher
than a certain critical molecular mass (MC) of a polymer. The strong dependence of
viscosity in high MM can be explained as the effect of chain entanglement in polymer.
39 For example, the viscosity is proportional to MM3.4 if MM>MC and to MM1<a<2.5 if
MM<MC, and no distinct MC could be up to MM of 1,000 kDa. 39, 40 Therefore, the
relative viscosity of HMM chitosan was significantly higher than that of LLM
chitosan due to its stronger dependence on MM. 39 The way how the viscosity was
described may also attribute to the high viscosity value in HMM chitosan. Relative
viscosity was expressed as the viscosity at sampling time relative to the initial
viscosity of chitosan prior to enzyme treatment. The initial viscosity of HMM
chitosan was extremely higher than that of LMM chitosan, resulting in higher
decreasing rate even though the same amount of viscosity reduction occurred in both
HMM and LMM chitosan.
The absorbance value at 420 nm indicates the amount of reducing ends formed by
the depolymerization of chitosan (Fig. 3.3). The absorbance value in chitosan
depolymerized by cellulase was significantly higher than that by lysozyme in both
HMM and LMM chitosan. There was no significant difference in the absorbance
between HMM and LMM chitosan (P<0.05). The absorbance increased fast in the
initial 30 min and then slowly increased after that. The difference in the reducing end
formation of chitosan depolymerized by cellulase or lysozyme was probably due to
different specificities of enzymes cleaved different active sites of chitosan. 17, 37 As
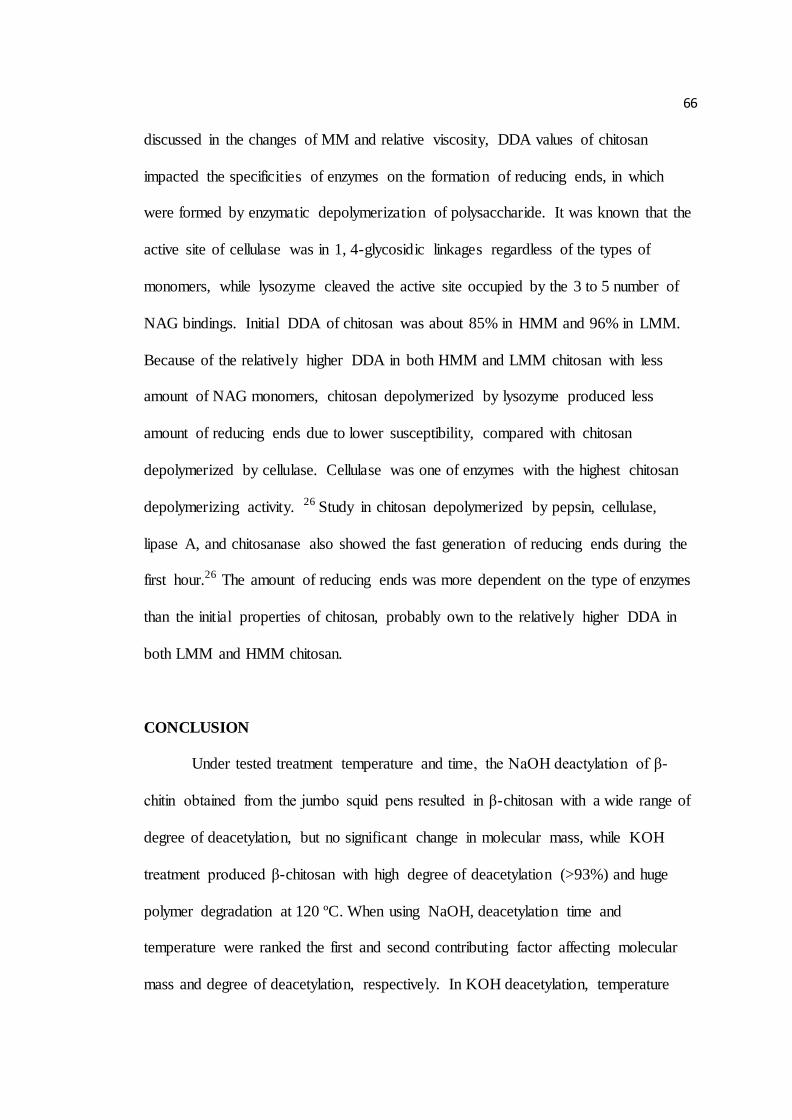
66
discussed in the changes of MM and relative viscosity, DDA values of chitosan
impacted the specificities of enzymes on the formation of reducing ends, in which
were formed by enzymatic depolymerization of polysaccharide. It was known that the
active site of cellulase was in 1, 4-glycosidic linkages regardless of the types of
monomers, while lysozyme cleaved the active site occupied by the 3 to 5 number of
NAG bindings. Initial DDA of chitosan was about 85% in HMM and 96% in LMM.
Because of the relatively higher DDA in both HMM and LMM chitosan with less
amount of NAG monomers, chitosan depolymerized by lysozyme produced less
amount of reducing ends due to lower susceptibility, compared with chitosan
depolymerized by cellulase. Cellulase was one of enzymes with the highest chitosan
depolymerizing activity. 26 Study in chitosan depolymerized by pepsin, cellulase,
lipase A, and chitosanase also showed the fast generation of reducing ends during the
first hour.26 The amount of reducing ends was more dependent on the type of enzymes
than the initial properties of chitosan, probably own to the relatively higher DDA in
both LMM and HMM chitosan.
CONCLUSION
Under tested treatment temperature and time, the NaOH deactylation of β-
chitin obtained from the jumbo squid pens resulted in β-chitosan with a wide range of
degree of deacetylation, but no significant change in molecular mass, while KOH
treatment produced β-chitosan with high degree of deacetylation (>93%) and huge
polymer degradation at 120 ºC. When using NaOH, deacetylation time and
temperature were ranked the first and second contributing factor affecting molecular
mass and degree of deacetylation, respectively. In KOH deacetylation, temperature
67
was the most contributing factor impacting both molecular mass and degree of
deacetylation of chitosan. Chitosan could be depolymerized by cellulase and
lysozyme, in which cellulase had higher susceptibility on chitosan, resulted in higher
and faster chitosan degradation than that of lysozyme. Further studies to investigate
the antimicrobial and antioxidant functions of β-chitosan from jumbo squid pens are
under the way.
ACKNOWLEDGEMENT
Authors would like to thank Mr. Mark Ludlow at Dosidicus LLC, USA for the
donation of β-chitin from jumbo squid pens.
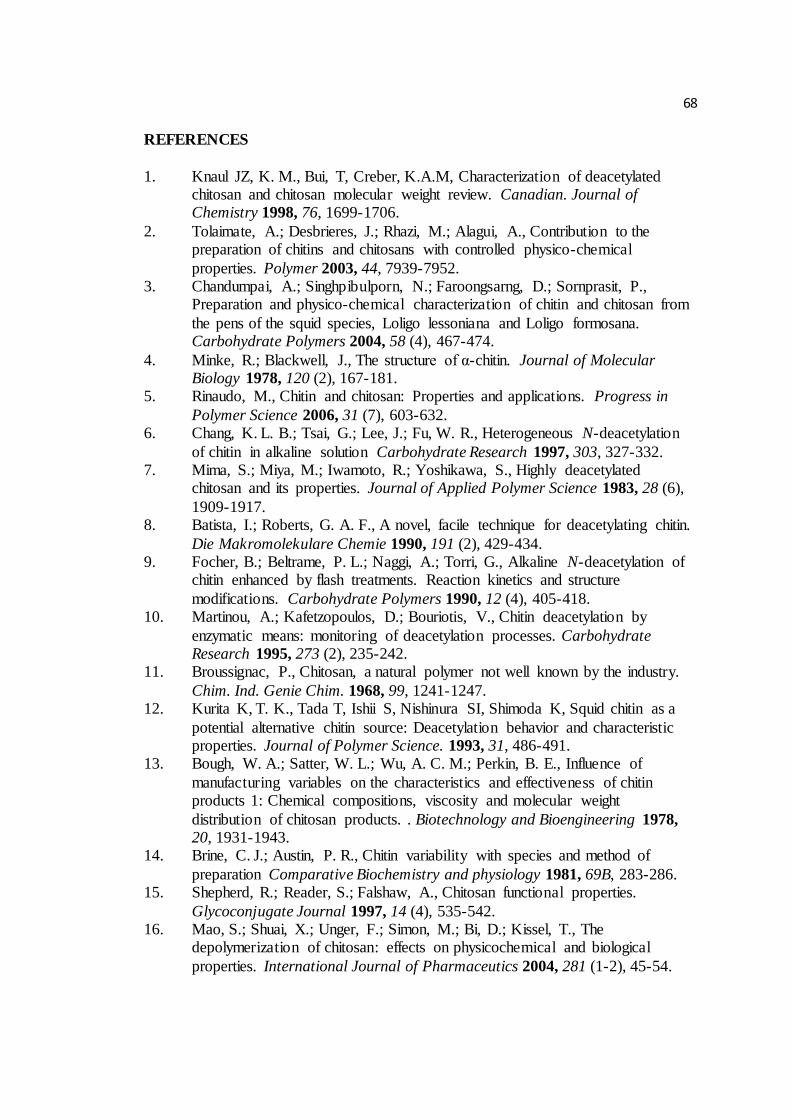
68
REFERENCES
1. Knaul JZ, K. M., Bui, T, Creber, K.A.M, Characterization of deacetylated chitosan and chitosan molecular weight review. Canadian. Journal of Chemistry 1998, 76, 1699-1706.
2. Tolaimate, A.; Desbrieres, J.; Rhazi, M.; Alagui, A., Contribution to the preparation of chitins and chitosans with controlled physico-chemical
properties. Polymer 2003, 44, 7939-7952. 3. Chandumpai, A.; Singhpibulporn, N.; Faroongsarng, D.; Sornprasit, P.,
Preparation and physico-chemical characterization of chitin and chitosan from
the pens of the squid species, Loligo lessoniana and Loligo formosana. Carbohydrate Polymers 2004, 58 (4), 467-474.
4. Minke, R.; Blackwell, J., The structure of α-chitin. Journal of Molecular Biology 1978, 120 (2), 167-181.
5. Rinaudo, M., Chitin and chitosan: Properties and applications. Progress in
Polymer Science 2006, 31 (7), 603-632. 6. Chang, K. L. B.; Tsai, G.; Lee, J.; Fu, W. R., Heterogeneous N-deacetylation
of chitin in alkaline solution Carbohydrate Research 1997, 303, 327-332. 7. Mima, S.; Miya, M.; Iwamoto, R.; Yoshikawa, S., Highly deacetylated
chitosan and its properties. Journal of Applied Polymer Science 1983, 28 (6),
1909-1917. 8. Batista, I.; Roberts, G. A. F., A novel, facile technique for deacetylating chitin.
Die Makromolekulare Chemie 1990, 191 (2), 429-434. 9. Focher, B.; Beltrame, P. L.; Naggi, A.; Torri, G., Alkaline N-deacetylation of
chitin enhanced by flash treatments. Reaction kinetics and structure
modifications. Carbohydrate Polymers 1990, 12 (4), 405-418. 10. Martinou, A.; Kafetzopoulos, D.; Bouriotis, V., Chitin deacetylation by
enzymatic means: monitoring of deacetylation processes. Carbohydrate Research 1995, 273 (2), 235-242.
11. Broussignac, P., Chitosan, a natural polymer not well known by the industry.
Chim. Ind. Genie Chim. 1968, 99, 1241-1247. 12. Kurita K, T. K., Tada T, Ishii S, Nishinura SI, Shimoda K, Squid chitin as a
potential alternative chitin source: Deacetylation behavior and characteristic properties. Journal of Polymer Science. 1993, 31, 486-491.
13. Bough, W. A.; Satter, W. L.; Wu, A. C. M.; Perkin, B. E., Influence of
manufacturing variables on the characteristics and effectiveness of chitin products 1: Chemical compositions, viscosity and molecular weight
distribution of chitosan products. . Biotechnology and Bioengineering 1978, 20, 1931-1943.
14. Brine, C. J.; Austin, P. R., Chitin variability with species and method of
preparation Comparative Biochemistry and physiology 1981, 69B, 283-286. 15. Shepherd, R.; Reader, S.; Falshaw, A., Chitosan functional properties.
Glycoconjugate Journal 1997, 14 (4), 535-542. 16. Mao, S.; Shuai, X.; Unger, F.; Simon, M.; Bi, D.; Kissel, T., The
depolymerization of chitosan: effects on physicochemical and biological
properties. International Journal of Pharmaceutics 2004, 281 (1-2), 45-54.
69
17. Lin, S.B.; Lin, Y.C.; Chen, H.H., Low molecular weight chitosan prepared with the aid of cellulase, lysozyme and chitinase: Characterisation and
antibacterial activity. Food Chemistry 2009, 116 (1), 47-53. 18. Fei Liu, X.; Lin Guan, Y.; Zhi Yang, D.; Li, Z.; De Yao, K., Antibacterial
action of chitosan and carboxymethylated chitosan. Journal of Applied
Polymer Science 2001, 79 (7), 1324-1335. 19. Herndez-Lauzardo, A. N.; Bautista-Bas, S.; Velquez-del Valle, M. G.; Mdez-
Montealvo, M. G.; S?chez-Rivera, M. M.; Bello-Pez, L. A., Antifungal effects of chitosan with different molecular weights on in vitro development of Rhizopus stolonifer (Ehrenb.:Fr.) Vuill. Carbohydrate Polymers 2008, 73 (4),
541-547. 20. Vishu Kumar, B. A.; Varadaraj, M. C.; Tharanathan, R. N., Low molecular
weight chitosan preparation with the aid of pepsin, characterization, and its bactericidal activity. Biomacromolecules 2007, 8 (2), 566-572.
21. Santos, C.; Seabra, P.; Veleirinho, B.; Delgadillo, I.; Lopes da Silva, J. A.,
Acetylation and molecular mass effects on barrier and mechanical properties of shortfin squid chitosan membranes. European Polymer Journal 2006, 42
(12), 3277-3285. 22. Nunthanid J, P. S., Yamaoto K, Peck G.E, Physical properties and molecular
behavior of chitosan films. Drug development and industrial pharmacy 2001,
27 (2), 143-157. 23. Minagawa, T.; Okamura, Y.; Shigemasa, Y.; Minami, S.; Okamoto, Y.,
Effects of molecular weight and deacetylation degree of chitin/chitosan on wound healing. Carbohydrate Polymers 2007, 67 (4), 640-644.
24. Kim, S.K.; Rajapakse, N., Enzymatic production and biological activities of
chitosan oligosaccharides (COS): A review. Carbohydrate Polymers 2005, 62 (4), 357-368.
25. Tsao, C. T.; Chang, C. H.; Lin, Y. Y.; Wu, M. F.; Han, J. L.; Hsieh, K. H., Kinetic study of acid depolymerization of chitosan and effects of low molecular weight chitosan on erythrocyte rouleaux formation. Carbohydrate
Research 2011, 346 (1), 94-102. 26. Roncal, T.; Oviedo, A.; de Armentia, I. L.; Fernández, L.; Villarán, M. C.,
High yield production of monomer-free chitosan oligosaccharides by pepsin catalyzed hydrolysis of a high deacetylation degree chitosan. Carbohydrate Research 2007, 342 (18), 2750-2756.
27. Kurita, K.; Tomita, K.; Tada, T.; Ishi, S.; Nichimura, S.; Shimada, K., Squid chitin as a potential alternative chitin source: Deacetylation behavior and
characteristics properties. Journal Polymer Science: Polymer Chemistry Ed. 1993, 31, 485-491.
28. Schales, O.; Schales, S. S., A simple method for the determination of glucose
in blood. Archives of Biochemistry 1945, 8 (2), 285-292. 29. Park, S. H., Robust design and analysis for quality engineering. Champman
and hall 1996. 30. Tolaimate, A.; Desbries, J.; Rhazi, M.; Alagui, A.; Vincendon, M.; Vottero, P.,
On the influence of deacetylation process on the physicochemical
characteristics of chitosan from squid chitin. Polymer 2000, 41 (7), 2463-2469. 31. Lu, S.; Song, X.; Cao, D.; Chen, Y.; Yao, K., Preparation of water-soluble
chitosan. Journal of Applied Polymer Science 2004, 91, 3497-3503.
70
32. Li, L.; Hsieh, Y.L., Chitosan bicomponent nanofibers and nanoporous fibers. Carbohydrate Research 2006, 341 (3), 374-381.
33. Ilium, L., Chitosan and its use as a pharmaceutical excipient. Pharmaceutical Research 1998, 15 (9), 1326-1331.
34. Sannan, T.; Kurita, K.; Iwakura, Y., Studies on chitin, 2. Effect of
deacetylation on solubility. Die Makromolekulare Chemie 1976, 177 (12), 3589-3600.
35. Ottey, M. H.; Vårum, K. M.; Smidsrød, O., Compositional heterogeneity of heterogeneously deacetylated chitosans. Carbohydrate Polymers 1996, 29 (1), 17-24.
36. Xie, Y.; Wei, Y.; Hu, J., Depolymerization of Chitosan with a Crude Cellulase Preparation from Aspergillus Niger. Applied Biochemistry and Biotechnology
2010, 160 (4), 1074-1083. 37. Kurita, K.; Kaji, Y.; Mori, T.; Nishiyama, Y., Enzymatic degradation of β-
chitin: susceptibility and the influence of deacetylation. Carbohydrate
Polymers 2000, 42 (1), 19-21. 38. Ferry, J. D., Viscoelastic properties of polymers. 3 ed.; Wiley New York, 1980.
39. Sato, N.; Ito, S.; Yamamoto, M., Molecular weight dependence of shear viscosity of a polymer monolayer: Evidence for the lack of chain entanglement in the two-dimensional plane. Macromolecules 1998, 31 (8),
2673-2675. 40. Izuka, A.; Winter, H. H.; Hashimoto, T., Molecular weight dependence of
viscoelasticity of polycaprolactone critical gels. Macromolecules 1992, 25 (9), 2422-2428.
71
Table 3.1 L9 standard orthogonal array of different contributing factors with different
levels applied in Kurita [A] and Broussignac [B] methods 11, 27
[A] – Kurita method using NaOH as reagent
Experimental
Run
Contributing factors (i)
Concentration (%)
A
Temperature (ºC)
B
Time (h)
C
Multiple-steps
D
1 1 (40) 1 (60) 1 (2) 1
2 1 (40) 2 (90) 2 (4) 2
3 1 (40) 2 (90) 3 (6) 3
4 2 (50) 1 (60) 2 (4) 3
5 2 (50) 2 (90) 3 (6) 1
6 2 (50) 1 (60) 1 (2) 2
7 1 (40) 1 (60) 3 (6) 2
8 2 (50) 2 (90) 1 (2) 3
9 1 (40) 2 (90) 2 (4) 1
[B] – Broussignac method using KOH as reagent
Experimental
Run
Contributing factors (i)
Temperature (ºC)
A
Time (h)
B
Multiple-steps
C
1 1 (120) 1 (2) 1
2 1 (120) 2 (4) 2
3 1 (120) 3 (6) 3
4 2 (90) 1 (2) 2
5 2 (90) 2 (4) 3
6 2 (90) 3 (6) 1
7 1 (120) 1 (2) 3
8 2 (90) 2 (4) 1
9 1 (120) 3 (6) 2
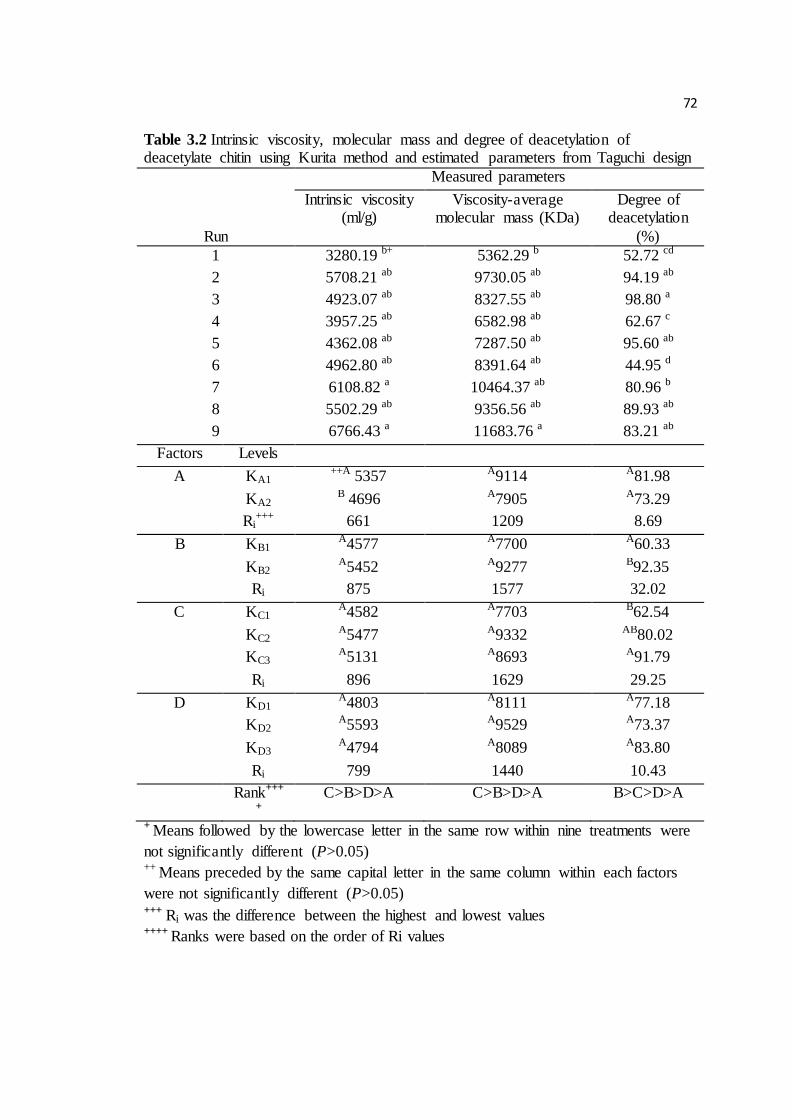
72
Table 3.2 Intrinsic viscosity, molecular mass and degree of deacetylation of deacetylate chitin using Kurita method and estimated parameters from Taguchi design
Run
Measured parameters
Intrinsic viscosity (ml/g)
Viscosity-average molecular mass (KDa)
Degree of deacetylation
(%)
1 3280.19 b+ 5362.29 b 52.72 cd
2 5708.21 ab 9730.05 ab 94.19 ab
3 4923.07 ab 8327.55 ab 98.80 a
4 3957.25 ab 6582.98 ab 62.67 c
5 4362.08 ab 7287.50 ab 95.60 ab
6 4962.80 ab 8391.64 ab 44.95 d
7 6108.82 a 10464.37 ab 80.96 b
8 5502.29 ab 9356.56 ab 89.93 ab
9 6766.43 a 11683.76 a 83.21 ab
Factors Levels
A KA1 ++A 5357 A9114 A81.98
KA2 B 4696 A7905 A73.29
Ri+++ 661 1209 8.69
B KB1 A4577 A7700 A60.33
KB2 A5452 A9277 B92.35
Ri 875 1577 32.02
C KC1 A4582 A7703 B62.54
KC2 A5477 A9332 AB80.02
KC3 A5131 A8693 A91.79
Ri 896 1629 29.25
D KD1 A4803 A8111 A77.18
KD2 A5593 A9529 A73.37
KD3 A4794 A8089 A83.80
Ri 799 1440 10.43
Rank+++
+
C>B>D>A C>B>D>A B>C>D>A
+ Means followed by the lowercase letter in the same row within nine treatments were
not significantly different (P>0.05) ++ Means preceded by the same capital letter in the same column within each factors
were not significantly different (P>0.05) +++ Ri was the difference between the highest and lowest values ++++ Ranks were based on the order of Ri values
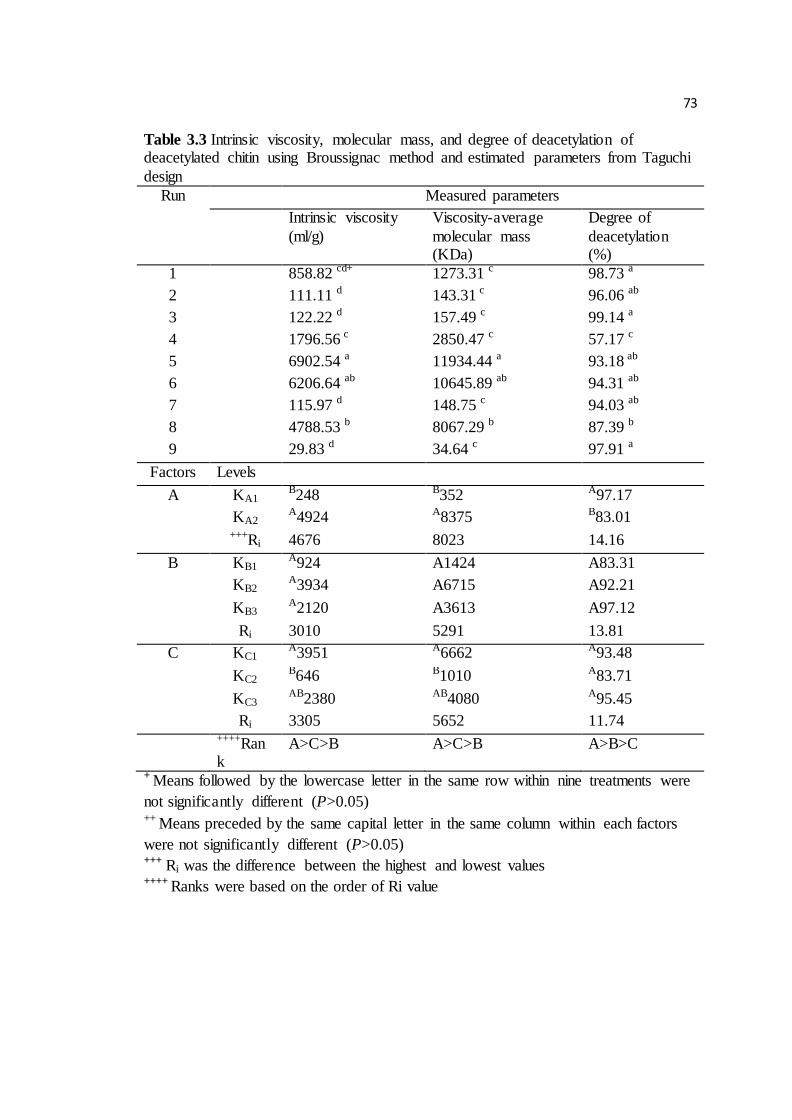
73
Table 3.3 Intrinsic viscosity, molecular mass, and degree of deacetylation of deacetylated chitin using Broussignac method and estimated parameters from Taguchi
design
Run Measured parameters
Intrinsic viscosity
(ml/g)
Viscosity-average
molecular mass (KDa)
Degree of
deacetylation (%)
1 858.82 cd+ 1273.31 c 98.73 a
2 111.11 d 143.31 c 96.06 ab
3 122.22 d 157.49 c 99.14 a
4 1796.56 c 2850.47 c 57.17 c
5 6902.54 a 11934.44 a 93.18 ab
6 6206.64 ab 10645.89 ab 94.31 ab
7 115.97 d 148.75 c 94.03 ab
8 4788.53 b 8067.29 b 87.39 b
9 29.83 d 34.64 c 97.91 a
Factors Levels
A KA1 B248 B352 A97.17
KA2 A4924 A8375 B83.01 +++Ri 4676 8023 14.16
B KB1 A924 A1424 A83.31
KB2 A3934 A6715 A92.21
KB3 A2120 A3613 A97.12
Ri 3010 5291 13.81
C KC1 A3951 A6662 A93.48
KC2 B646 B1010 A83.71
KC3 AB2380 AB4080 A95.45
Ri 3305 5652 11.74
++++Rank
A>C>B A>C>B A>B>C
+ Means followed by the lowercase letter in the same row within nine treatments were
not significantly different (P>0.05) ++ Means preceded by the same capital letter in the same column within each factors
were not significantly different (P>0.05) +++ Ri was the difference between the highest and lowest values ++++ Ranks were based on the order of Ri value
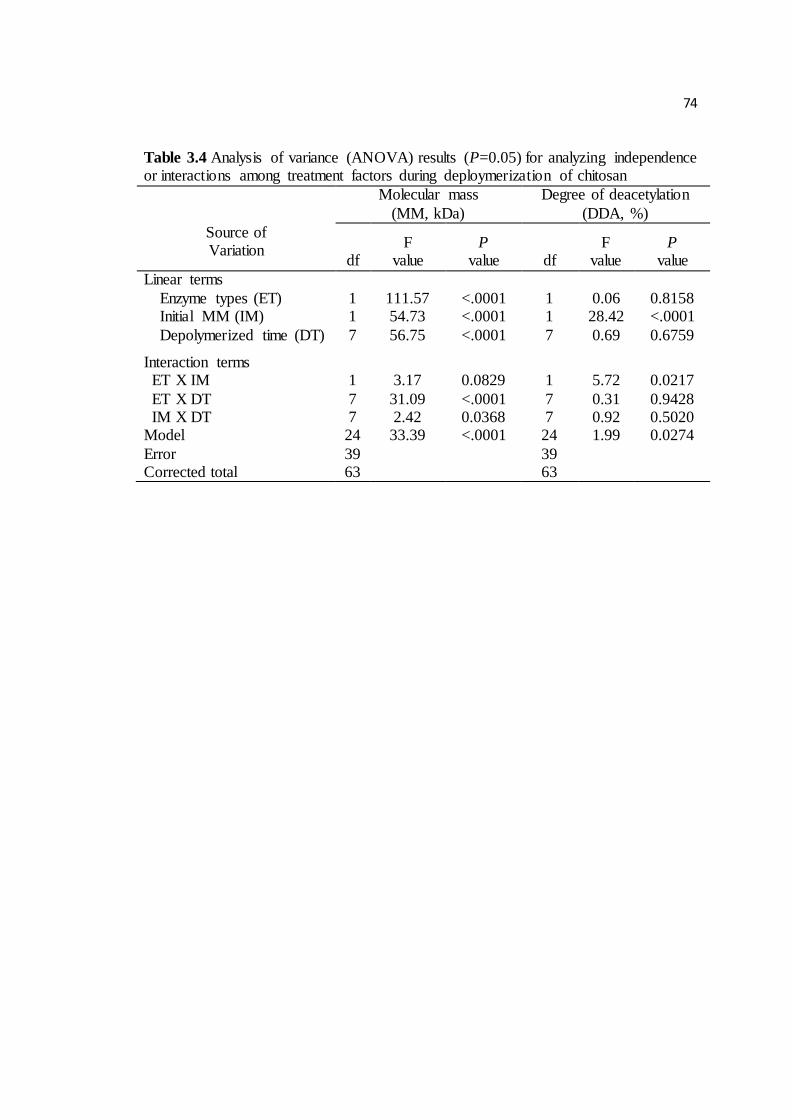
74
Table 3.4 Analysis of variance (ANOVA) results (P=0.05) for analyzing independence or interactions among treatment factors during deploymerization of chitosan
Molecular mass
(MM, kDa)
Degree of deacetylation
(DDA, %)
Source of Variation
df F
value P
value df F
value P
value
Linear terms
Enzyme types (ET) 1 111.57 <.0001 1 0.06 0.8158 Initial MM (IM) 1 54.73 <.0001 1 28.42 <.0001
Depolymerized time (DT) 7 56.75 <.0001 7 0.69 0.6759
Interaction terms ET X IM 1 3.17 0.0829 1 5.72 0.0217
ET X DT 7 31.09 <.0001 7 0.31 0.9428 IM X DT 7 2.42 0.0368 7 0.92 0.5020 Model 24 33.39 <.0001 24 1.99 0.0274
Error 39 39 Corrected total 63 63
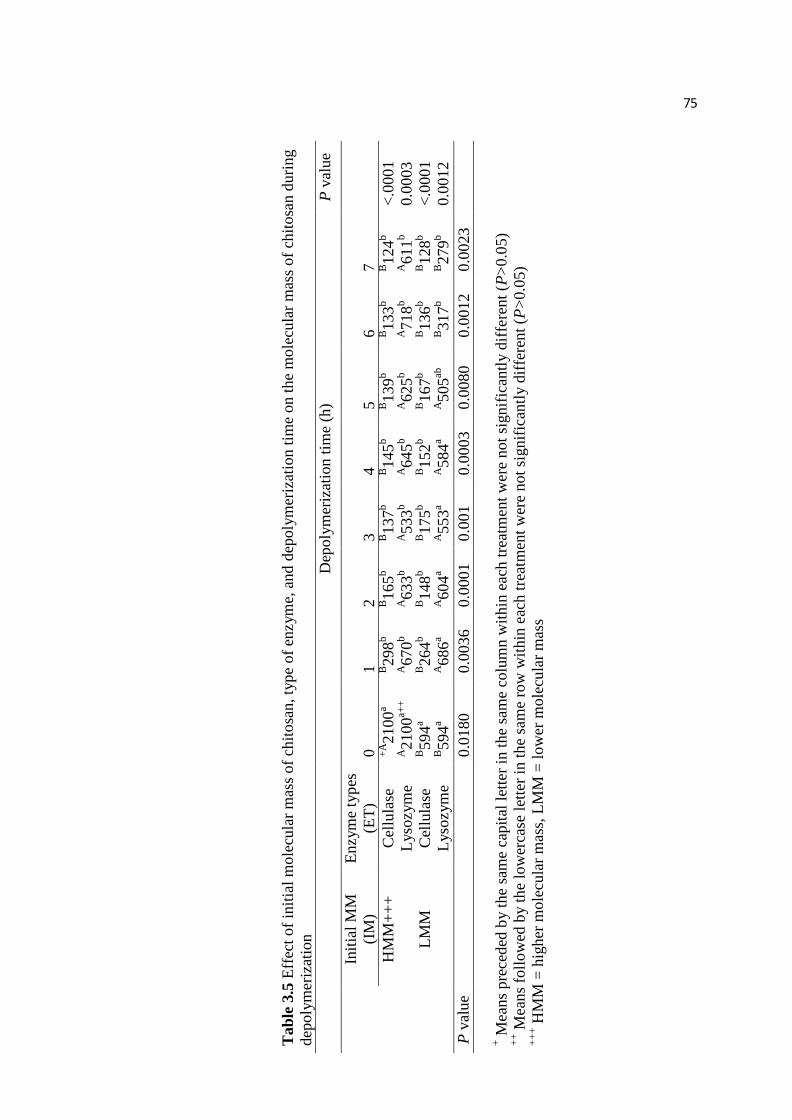
75
Ta
ble
3.5
Eff
ect
of
init
ial
mo
lecu
lar
mas
s o
f ch
ito
san
, ty
pe
of
enzym
e, a
nd
dep
oly
mer
izat
ion
tim
e o
n t
he
mo
lecu
lar
mas
s o
f ch
ito
san
du
rin
g
dep
oly
mer
izat
ion
Dep
oly
mer
izat
ion
tim
e (h
) P
val
ue
Init
ial
MM
(IM
)
En
zym
e ty
pes
(ET
) 0
1
2
3
4
5
6
7
HM
M+
++
C
ellu
lase
+
A2
10
0a
B2
98
b
B1
65
b
B1
37
b
B1
45
b
B1
39
b
B1
33
b
B1
24
b
<.0
00
1
L
yso
zym
e
A2
10
0a+
+
A6
70
b
A6
33
b
A5
33
b
A6
45
b
A6
25
b
A7
18
b
A6
11
b
0.0
00
3
LM
M
Cel
lula
se
B5
94
a B2
64
b
B1
48
b
B1
75
b
B1
52
b
B1
67
b
B1
36
b
B1
28
b
<.0
00
1
Lyso
zym
e
B5
94
a A6
86
a
A6
04
a
A5
53
a
A5
84
a
A5
05
ab
B3
17
b
B2
79
b
0.0
01
2
P v
alu
e
0
.01
80
0
.00
36
0
.00
01
0
.00
1
0.0
00
3
0.0
08
0
0.0
01
2
0.0
02
3
+ M
ean
s p
rece
ded
by t
he
sam
e ca
pit
al l
ette
r in
th
e sa
me
colu
mn
wit
hin
eac
h t
reat
men
t w
ere
no
t si
gn
ific
antl
y d
iffe
ren
t (P
>0
.05
) +
+ M
ean
s fo
llo
wed
by t
he
low
erca
se l
ette
r in
th
e sa
me
row
wit
hin
eac
h t
reat
men
t w
ere
no
t si
gn
ific
antl
y d
iffe
ren
t (P
>0
.05
) +
++ H
MM
= h
igh
er m
ole
cula
r m
ass,
LM
M =
lo
wer
mo
lecu
lar
mas
s
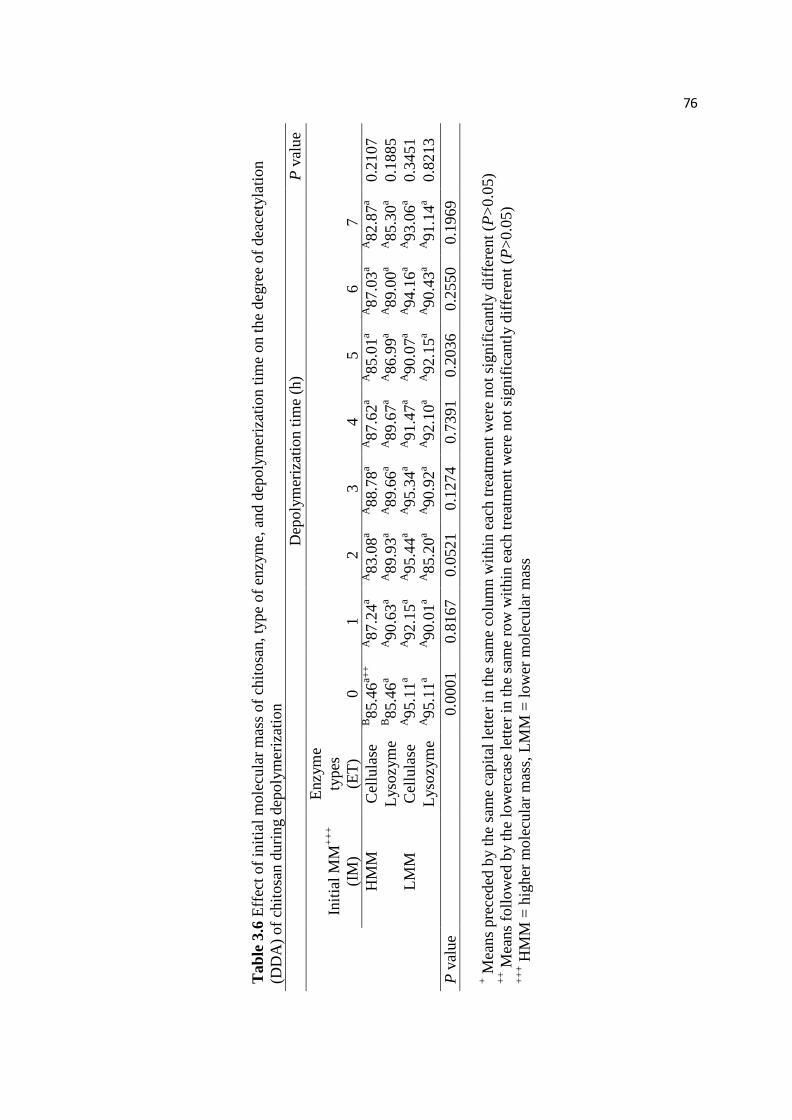
76
Ta
ble
3.6
Eff
ect
of
init
ial
mo
lecu
lar
mas
s o
f ch
ito
san
, ty
pe
of
enzym
e, a
nd
dep
oly
mer
izat
ion
tim
e o
n t
he
deg
ree
of
dea
cety
lati
on
(DD
A)
of
chit
osa
n d
uri
ng d
epo
lym
eriz
atio
n
D
epo
lym
eriz
atio
n t
ime
(h)
P v
alu
e
Init
ial
MM
++
+
(IM
)
En
zym
e
typ
es
(ET
) 0
1
2
3
4
5
6
7
HM
M
Cel
lula
se
B8
5.4
6a+
+
A8
7.2
4a
A8
3.0
8a
A8
8.7
8a
A8
7.6
2a
A8
5.0
1a
A8
7.0
3a
A8
2.8
7a
0.2
10
7
L
yso
zym
e B8
5.4
6a
A9
0.6
3a
A8
9.9
3a
A8
9.6
6a
A8
9.6
7a
A8
6.9
9a
A8
9.0
0a
A8
5.3
0a
0.1
88
5
LM
M
Cel
lula
se
A9
5.1
1a
A9
2.1
5a
A9
5.4
4a
A9
5.3
4a
A9
1.4
7a
A9
0.0
7a
A9
4.1
6a
A9
3.0
6a
0.3
45
1
L
yso
zym
e A9
5.1
1a
A9
0.0
1a
A8
5.2
0a
A9
0.9
2a
A9
2.1
0a
A9
2.1
5a
A9
0.4
3a
A9
1.1
4a
0.8
21
3
P v
alu
e
0
.00
01
0
.81
67
0
.05
21
0
.12
74
0
.73
91
0
.20
36
0
.25
50
0
.19
69
+ M
ean
s p
rece
ded
by t
he
sam
e ca
pit
al l
ette
r in
th
e sa
me
colu
mn
wit
hin
eac
h t
reat
men
t w
ere
no
t si
gn
ific
antl
y d
iffe
ren
t (P
>0
.05
) +
+ M
ean
s fo
llo
wed
by t
he
low
erca
se l
ette
r in
th
e sa
me
row
wit
hin
eac
h t
reat
men
t w
ere
no
t si
gn
ific
antl
y d
iffe
ren
t (P
>0
.05
) +
++ H
MM
= h
igh
er m
ole
cula
r m
ass,
LM
M =
lo
wer
mo
lecu
lar
mas
s
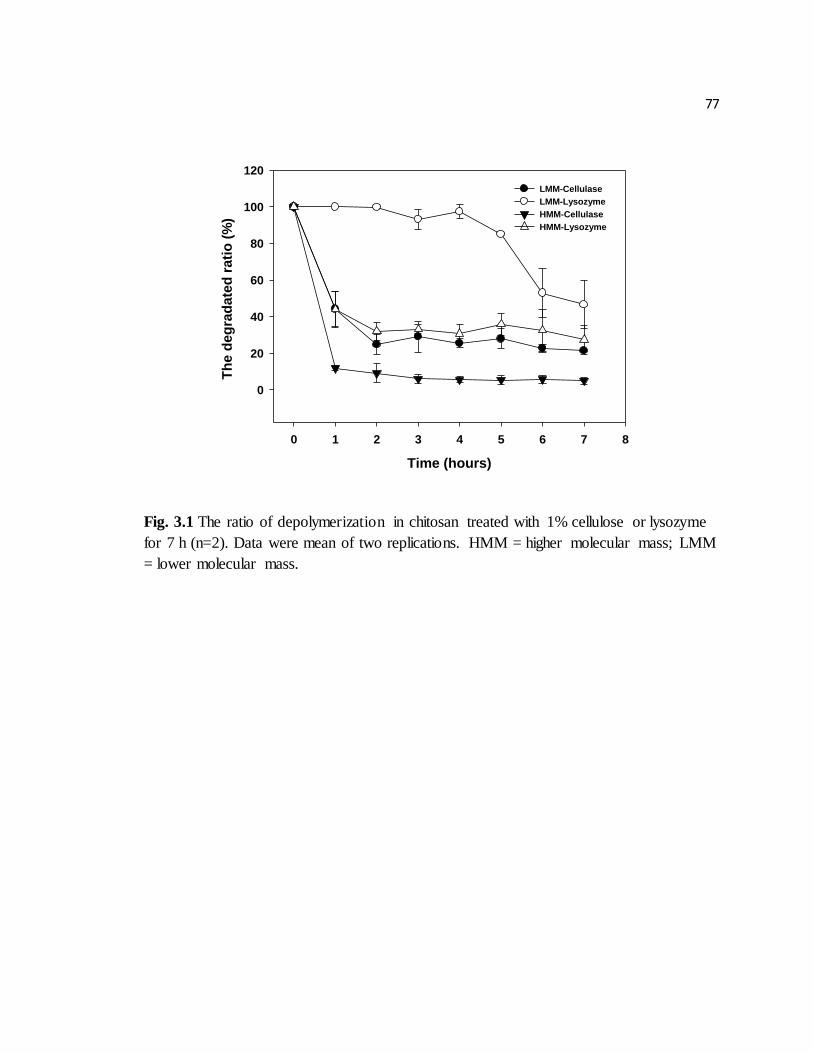
77
Time (hours)
0 1 2 3 4 5 6 7 8
Th
e d
eg
rad
ate
d r
ati
o (
%)
0
20
40
60
80
100
120
LMM-Cellulase
LMM-Lysozyme
HMM-Cellulase
HMM-Lysozyme
Fig. 3.1 The ratio of depolymerization in chitosan treated with 1% cellulose or lysozyme
for 7 h (n=2). Data were mean of two replications. HMM = higher molecular mass; LMM
= lower molecular mass.
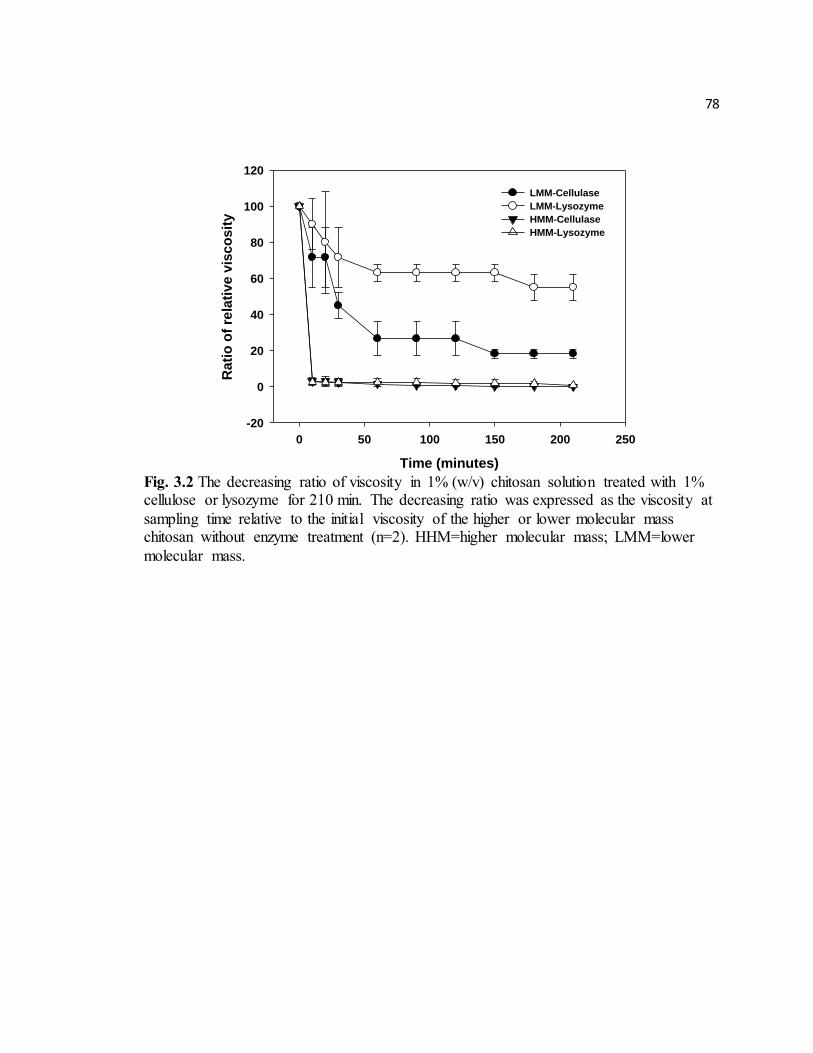
78
Time (minutes)
0 50 100 150 200 250
Rati
o o
f re
lati
ve v
isco
sit
y
-20
0
20
40
60
80
100
120
LMM-Cellulase
LMM-Lysozyme
HMM-Cellulase
HMM-Lysozyme
Fig. 3.2 The decreasing ratio of viscosity in 1% (w/v) chitosan solution treated with 1% cellulose or lysozyme for 210 min. The decreasing ratio was expressed as the viscosity at
sampling time relative to the initial viscosity of the higher or lower molecular mass chitosan without enzyme treatment (n=2). HHM=higher molecular mass; LMM=lower
molecular mass.
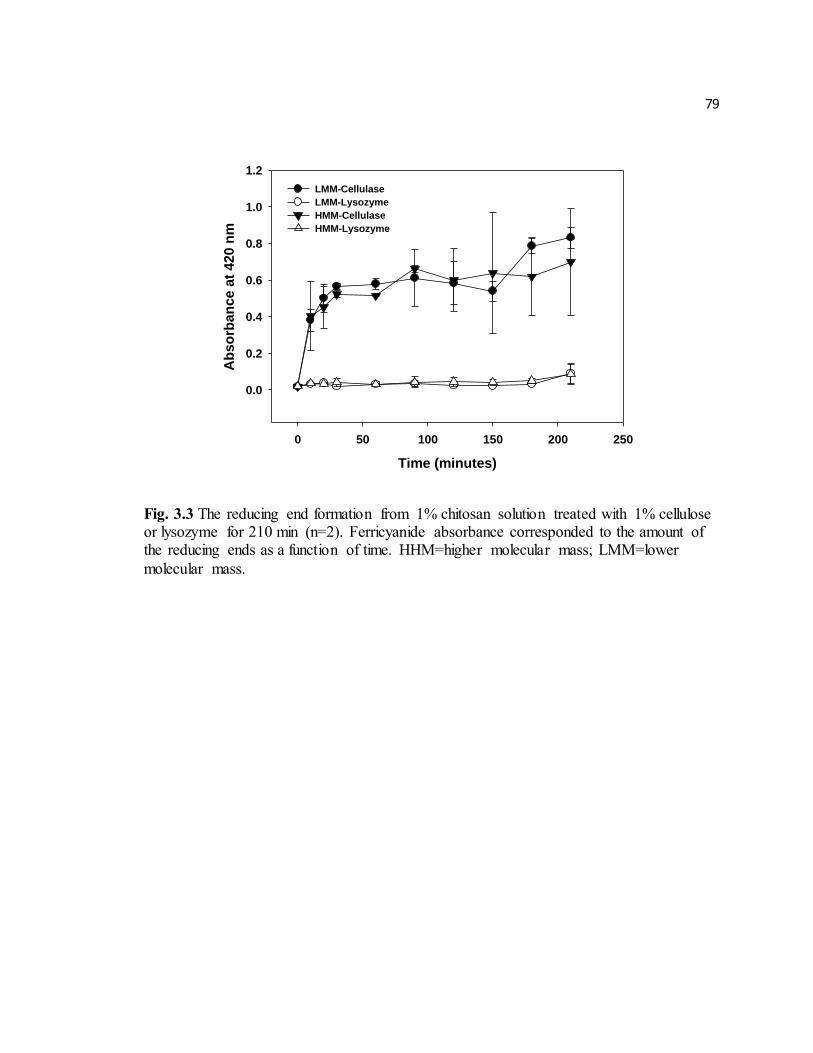
79
Time (minutes)
0 50 100 150 200 250
Ab
so
rban
ce a
t 420 n
m
0.0
0.2
0.4
0.6
0.8
1.0
1.2
LMM-Cellulase
LMM-Lysozyme
HMM-Cellulase
HMM-Lysozyme
Fig. 3.3 The reducing end formation from 1% chitosan solution treated with 1% cellulose or lysozyme for 210 min (n=2). Ferricyanide absorbance corresponded to the amount of the reducing ends as a function of time. HHM=higher molecular mass; LMM=lower
molecular mass.
80
CHAPTER 4
ALKALI OR ACID INDUCED CHANGES IN THE STRUCTURE, MOISTURE
ABSORPTION ABILITY AND DEACETYLATION REACTION OF β-CHITIN
EXTRACTED FROM JUMBO SQUID (DOSIDICUS GIGAS) PENS IN
COMPARISON WITH α-CHITIN FROM SHRIMP SHELLS
Jung, J., Zhao, Y. Submitted to Food Chemistry
81
ABSTRACT
Alkali or acid-induced structural modifications in β-chitin extracted from jumbo squid
(Dosidicus gigas) pens and its moisture absorption ability and deacetylating reaction
were investigated and compared with those of native α-chitin from shrimp shells. The β-
chitin was converted into α-chitin after 3 h soaking in 40% NaOH or 1-3 h in 40% HCl
solution, and the obtained α-chitin had higher moisture absorption ability than that of the
native α-chitin from shrimp shells due to the polymorphic destructions by alkali-
treatment. In contrast, acid-treated β-chitin had little polymorphic modifications, showing
no significant change in its moisture absorption ability. β-chitin was more susceptible to
the deacetylating reactions than α-chitin, in which lower concentration of NaOH and
shorter time were required to extract β-chitosan. These results demonstrated that alkali or
acid-treated β-chitin remained high susceptibility of the native β-chitin toward the
solvents in comparison with the native or acid treated α-chitin.
Keywords: α-chitin, β-chitin, jumbo squid pens, crystallinity, moisture absorption ability,
deacetylating reaction
82
INTRODUCTION
The two forms of chitin, α- and β-form, are distinguished in respect to their different
structural characteristics 1-3. Crystallites of α-chitin is tight-packed with inter-sheet
hydrogen bonds formed between the antiparallel sheets, whereas that of β-chitin has loose
arrangements due to much weaker intermolecular hydrogen bonds by the parallel manner
of the polymeric sheets. Moreover, the crystal region (crystallinity) of the semi-
crystalline α-chitin is larger than that of β-chitin 4. These structural differences directly
impact their physicochemical properties, in which β-chitin presents much higher
solubility and reactivity in alkali solutions during the deacetylation process than that of α-
chitin 2, 3. In addition, extraction of β-chitin from squid pens has shown advantages of
unnecessary demineralization and decoloration processes in comparison with extracting
α-chitin from shrimp and crab shells due to the negligible amount of mineral and
carotenoid in the squid pens 5-7.
Chemical treatments using acid and alkali have been most commonly employed to
produce chitin and chitosan. It was generally believed that the demineralization and/or
deproteinization processes using lower concentrations of acid and alkali and lower
temperatures than those applied in the deacetylation process do not cause significant
changes in the molecular weight (Mw) and degree of deacetylation (DDA) of chitin 8.
However, several studies have found that the chemical treatments alter the structural
properties of chitin due to swelling, dissociation of hydrogen bonds, and rearrangements
of polymeric chains, and different forms of chitin responded differently 9-13. Feng et al.
(2004) and Liu et al. (2008) reported that alkali treatment of α-chitin weakens inter-sheet
hydrogen bonds and decreases crystallinity index (CI) along with the polymorphic
83
modifications as alkali concentration increased. The conversion phenomenon between β-
and α-chitin during alkali treatment was also observed by Saito et al. (1997), Li et al.
(1999), and Noishiki et al. (2003), in which β-chitin was converted into α-chitin forming
inter-sheet hydrogen bonds between C=O and O-H in C6, similar to the mercerization
induced from cellulose I to cellulose II. According to Li et al. 9, alkali or acid caused
swelling of crystallites and destruction of the original lateral order, resulted in the
rearrangement of those polymeric chains, thus conversion of chitin from one form to
another. Hence, alkali or acid-induced conversion of β-chitin to α-chitin with the
presence of strong inter-sheet hydrogen bonds might be a concern for preparing chitosan
since it may cause the loss of the original functional properties of β-chitin, especially the
high reactivity and susceptibility toward solvents. Moreover, it is unclear how the alkali
or acid-induced conversion exactly impact their polymorphic structures, in turn the
physicochemical properties of resulted chitin, and how the converted form of chitin
similar or different from its native form. Such information is critical to fully understand
the demineralization, deproteinization, and deacetylation processes in α- and β-chitin, the
essential steps in preparing α- and β-chitosan, as well as the functional differences
between α- and β- chitosan. Based on our best knowledge, no previous study has
systematically reported these conversion phenomena in respect to the polymorphic
modifications.
Several previous studies have demonstrated that the functional properties of chitin
and chitosan depend on their originated marine sources and species 8, 14. The jumbo squid
(Dosidicus gigas) pens are a newly employed source of β-chitin (Jung and Zhao, 2011
and 2012), and have shown some unique properties different from those mostly used β-
84
chitin extracted from Loligo species 5-7, 15. Therefore, the objectives of this study were to
investigate the alkali and acid-induced polymorphic modifications of β-chitin extracted
from jumbo squid pens and α-chitin from shrimp shells, and to study the changes in the
moisture absorption ability of resulted α- and β-chitin in comparison with their native
form. Moreover, the deacetylating reactions of α- and β-chitin under various alkali
treatments were also investigated to investigate the impact of structural modifications on
the deacetylating process.
MATERIALS AND METHODS
Preparation of Chitin
Dried jumbo squid (Dosidicus gigas) pens was donated by Dosidicus LLC (USA) and
α-chitin from shrimp shells were purchased from Sigma-Aldrich (USA). Samples were
ground into about 18 meshes (Glenmills Inc., USA). Squid pens were deprotenized by 5%
NaOH for 3 d at room temperature, washed with distilled water to reach the neutral pH,
and then dried at 40 °C in an oven (Precision Scientific Inc., USA) for 24 h. Each form of
the chitin was treated in 40% HCl or NaOH for 1-4 h under a given condition for
studying not only the conversation phenomena from β-chitin to α-chitin, but also the
polymorphic properties including crystal characteristics and CI as described below. For
deacetylation process, different concentrations of NaOH (40 or 50%), temperatures (60 or
90 ºC), and reaction times (2, 4, or 6 h) were applied.
Viscosity-Average Mw
85
The viscosity-average Mw of α- and β-chitin were determined by using the
Ubbelohde Dilution Viscometer (Cannon instrument Co., USA) with a capillary size of
0.58 nm. Approximate 100 mg of chitin was dissolved in 10 mL of the mixture solution
of N, N-dimethylacetamide (DMAc) containing 5% lithium chloride. The intrinsic
viscosity was measured by the intercept between the Huggins (reduced viscosity, Ƞ
sp/C~C) and Kraemer (relative viscosity, Ƞ rel/C ~C) plots when the concentration was 0
16. The viscosity-average Mw of chitosan was calculated by Mark-Houwink-Sakurada
(MHS) equation: [Ƞ] = K (MW) a, where K and a were the constants, K=2.1 x 10⁻⁴ and a =
0.88 17; and [Ƞ] was the intrinsic viscosity obtained from the two plots, Huggins and
Kraemer.
Proximate Composition Analysis
Moisture contents of chitin samples were determined by the percentage weight
loss of the samples after drying in a forced-air oven at 100 ºC for 24 h. Ash contents
were analyzed following AOAC method 18. Protein contents were measured by
Lowry method using bovine serum albumin standards 19. The Lowry method is
sensitive to low protein concentrations (5 – 100 μg/mL). DDA was determined by the
colloidal titration method 20.
Moisture Absorption Ability
Functional groups including NH2 of C2 or OH of C3 and C5 in N-acetyl-D-
glucosamine or D-glucosamine monomers can trap water penetrating into crystallites of
chitin by forming hydrogen bonds. Moreover, these functional groups can be closely
86
related to the crystal properties or crystallinity index (CI) in the polymorphic structure of
chitin as water can access easily to the loose-packed crystallites of β-chitin, compared
with the rigid crystallites of α-chitin 21.
Powdered chitin was conditioned in a P2O5 added desiccator for 24 h to remove
residual moisture 22, and then placed in a self-assembled chamber at 25 ºC and 80% RH
for 40 h. The moisture absorption ability was calculated as the percentage of weight gain
of dried samples after 40 h using equation (1):
( )
( ) ( )
( ) (1)
A Fourier-Transform Infrared (FT-IR) Spectroscopic Analysis
A single bound attenuated total reflection (ATR)-FTIR spectrometer (PerkinElmer,
USA) was operated by Omnic 7.4 software (Thermo Fisher Inc. USA) under the
operating conditions of 32 scans at a 4 cm-1 resolution and referenced against air. All
spectra were recorded as the absorption mode.
DDA was determined using the method by Sabnis et al. 23 as expressed in equation
(2):
( ) (
) (2)
Where A1655 and A3450 were the absorbance at 1655 cm-1 indicating the amide I band (a
measure of N-acetyl group contents) and the absorbance at 3450 cm-1 indicating the
hydroxyl groups as the reference, respectively.
87
The partial FT-IR spectra (1300-1800 cm-1) were reported to distinguish the two
forms of chitin and the inter-sheet hydrogen bonds. The band around ~1700 cm-1
attributed to the stretching vibration of C=O in amide 12, which could be split by the
inter-sheet hydrogen bond with neighboring O-H of C6 in α-chitin, whereas β-chitin was
shifted to a single peak indicating no inter-sheet hydrogen bonds and much weaker
intermolecular hydrogen bonds 24.
X-Ray Diffraction (XRD)
X-ray diffraction patterns were recorded using a XRG 3100 x-ray diffractometer
(Philips, U.S.) with a Cu Kα (1.54 Å ) at a voltage of 40 kV and a current of 30 mA. A
typical scan range was from 5º to 40º (2θ) at scanning speed of 0.025º/sec.
The CI was determined by equation (3):
( )
(3)
Where I110 was the maximum intensity of the (110) plane at 2θ = ~19º and Iam was the
intensity of the amorphous regions at 2θ = ~12.6º 25, 26.
Among various types of crystal lattices found in the polymeric structure of chitin
including 020, 110, 120, 101, or 130 planes, the d-spacing and apparent crystal size (Dap)
of (020) and (110) planes were reported as both were appeared in the native and the
processed α- and β-chitin. The d-spacing was computed using Bragg’s law (4) 13:
( )
(4)
Where d was plane spacing; λ was 1.54 Å, wavelength of Cu Kα radiation; and θ was
one-half angle of reflections.
88
The apparent crystal size (Dap) was calculated with the aid of Scherrer equation (5) 25,
27:
( )
(5)
Where β0 (in radians) was the half-width of the reflection; k was a constant indicating the
crystallite perfection with a value of 0.9; λ was 1.54 Å , the wavelength of Cu Kα
radiation; and θ was one-half angle of reflections.
Experimental Design and Statistical Analysis
The native and processed α- and β-chitin samples were tested using a completely
randomized design (CRD). Moisture, protein, and ash contents, and the moisture
absorption ability were all determined in duplicate, and data were analyzed for statistical
significance via least significant difference (LSD) post hoc testing as appropriate using
statistical software (SAS v9.2, The SAS Institute, USA). Results were considered to be
significantly different if P<0.05.
RESULTS AND DISCUSSION
Proximate Composition and Polymeric Structure of β-Chitin Extracted from Jumbo
Squid Pens
The proximate compositions of α- and β-chitin are reported in Table 4.1. Moisture
content of β-chitin extracted from jumbo squid pens was significantly higher than that of
the commercial α-chitin from shrimp shells. This might be because the crystallites of β-
89
chitin are less tight due to much weaker intermolecular hydrogen bonds than that of α-
chitin, thus moisture accessed easily to crystallites of β-chitin and was more able to form
hydrogen bonds with NH2 or OH. Similarly, Kurita et al. (1993) reported higher retention
of absorbed water in β-chitin than that in α-chitin. Mw of β-chitin was almost as twice
higher as that of α-chitin at similar DDA (Table 4.1). According to Tolaimate et al.
(2003), Mw of β-chitin was 2-3 times higher than that of α-chitin at the same DDA,
which was consistent with our result. Protein and ash contents in both α- and β-chitin
were negligible, thus no further deprotenization and demineralization procedures were
applied on samples used in this study. The ash (mineral) content of β-chitin was below 1%
prior to acid treatment (so-called demineralization), lower than that reported in the
previous study on Loligo vulgaris (1.7%) 15.
Crystal property of β-chitin was distinguished from that of α-chitin based upon partial
FT-IR spectra (Fig. 4.1). The C=O band in amide (~1700 cm-1 indicated by dash lines)
was split by inter-sheet hydrogen bonds in α-chitin due to antiparallel manner between
the polymeric sheets, whereas β-chitin was shifted to a single peak without inter-sheet
hydrogen bonds and much weaker intermolecular hydrogen bonds due to the parallel
manner, similar to the previous finding by Cardenas et al. 24. XRD patterns of α- and β-
chitin were in the range of 5-40 º (2θ) (Figs. 4.2 and 4.3). Five crystalline planes (020,
110, 120, 101, and 130) at reflections of 9.4, 12.9, 19.4, 21.0, 23.8, and 26.5 were
observed in α-chitin, whereas only two crystalline planes (020 and 110) at reflections of
8.9 and 19.7 were appeared in β-chitin (Figs. 4.2 and 4.3). Moreover, the peaks in α-
chitin were sharper than those in β-chitin, indicating that crystal structure of α-chitin was
more rigid and stable than that of β-chitin (Figs. 4.2 and 4.3). Table 4.2 shows CI,
90
relative intensities (RI, %), d-spacing, and Dap of each crystal plane (020 and 110)
commonly appeared in both α- and β-chitin. CI of β-chitin was ~8% lower than that of α-
chitin similar to XRD patterns showing lower intensities and broader shapes of the peaks
in β-chitin. The d-spacing of (020) plane was relatively larger in β-chitin, indicating that
space distances between aligned polymeric chains were wider than those of α-chitin.
Furthermore, Dap of (020) and (110) planes in β-chitin were smaller than those of α-chitin.
Hence, β-chitin extracted from jumbo squid pens had loose crystallites and lower CI, thus
higher reactivity toward solvents, more swelling, and higher solubility than α-chitin.
These results were similar to the previous findings on β-chitin extracted from
Ommastrephes bartramii and Loligo species 2, 5, 7, 28.
Alkali or Acid Induced Conversion between α- and β-Chitin
Alkali or acid induced conversion of chitin from β-form to α-form was compared with
the mercerization of cellulose where the parallel chains of cellulose I were converted into
the antiparallel manner of cellulose II 29, 30. The different forms of chitin showing
antiparallel or parallel manner could be distinguished by FT-IR spectra in C=O band
depending on the presence of inter-sheet hydrogen bonds between C=O and O-H in C6.
Figs. 4.1 and 4.4 represent the partial FT-IR spectra (~1300-1800 cm-1) of alkali or
acid treated α- and β-chitin for 1-4 h, respectively. In alkali treated α-chitin, the split peak
in C=O band shifted to a single peak after 2 h treatment due to the dissociation of inter-
sheet hydrogen bonds. Similarly, Feng et al. (2004) observed the dissociation of
hydrogen bonds along with the polymorphic changes in α-chitin after alkali-freezing
treatment. Liu et al. (2008) reported similar FT-IR spectra of α-chitin after 40% alkali
91
treatment for 4 h, shown β-chitin with a single peak in C=O band. According to Li et al.
(1999), however, α-chitin processed in 40% NaOH at 3 ºC for 3 h remained its native
form with strong hydrogen bonds due to the favorable packing nature of the crystallites.
In alkali processed β-chitin, C=O band was slightly split at 1 and 2 h, and clear split was
appeared at 3 h indicating the conversion β-chitin into α-chitin, but shifted to a single
peak at 4 h. Therefore, the conversion phenomenon in β-chitin depended on the reaction
time (1-4 h). According to Noishiki et al. (2003), the conversion was occurred in 30%
NaOH after 1 h. In acid processed chitin, C=O band in α-chitin was all split at 1-4 h
indicating that α-form remained with the presence of inter-sheet hydrogen bonds unlike
alkali treatments, whereas the conversion from β-form into α-form was appeared at 1-3 h.
A single peak of C=O band in β-chitin was observed at 4 h similar to the alkali treatment.
According to Saito et al. (1994), the conversion from β-form to α-form was appeared by
7-8 N HCl treatment for 30 min. Hence, acid was able to induce the conversion of β-
chitin to α-chitin after 1-3 h treatment, whereas α-chitin still presented the antiparallel
polymeric sheets with inter-sheet hydrogen bonds after 1-4 h acid treatment.
Alkali or Acid Induced Structural Changes in α- and β-Chitin
Alkali or acid induced conversion in α- and β-chitin may impact their structural
properties, such as crystal properties and CI of the polymorphic chitin. Hence, the
structural properties in alkali or acid treated α- and β-chitin after various reaction times
were analyzed for interpreting how the conversion phenomenon may impact the
structural changes.
92
XRD patterns of the alkali or acid treated α- and β-chitin are illustrated in Figs. 4.2
and 4.3, respectively. For alkali treatment, the intensities of the peaks were significantly
decreased in both α- and β-chitin and the peaks of (020) and (110) planes of β-chitin were
shifted, meaning the destruction of crystallite by alkali treatment. After 2-3 h alkali
treatment, α-chitin displayed sharp peaks with high intensities at ~32º and the peaks of
(130) plane at ~26º was also observed in alkali treated β-chitin (Fig. 4.2), assuming that
alkali induced the formation of some crystallites. However, alkali treated β-chitin
showing the conversion into α-form exerted much less rigid crystallites and lower CI,
presenting broader peaks and lower intensities in comparison with native α-chitin or β-
chitin. For acid treated samples, the intensities of the peaks were not significantly
decreased in α-chitin, showing higher intensities and sharper peaks in (020), (110), and
(130) planes, whereas β-chitin had shifted peaks to lower angles in (020) and (110)
planes at 3-4 h, interpreting that crystallites of acid treated β-chitin were destroyed and
the space distance in each crystal plane became larger. Hence, the α-chitin converted
from β-chitin by acid treatment had less rigid crystallites than that of the native α-chitin
from shrimp shells.
Table 4.2 reports CI (%), RI (%), d-spacing (Å ), and Dap (Å ) of (020) and (110)
planes in alkali or acid treated α- and β-chitin, respectively. In alkali treatment, CI of α-
chitin was more decreased than that of β-chitin. RI of (020) and (110) planes in α-chitin
was lower than those in β-chitin after 1-2 h treatment. Moreover, Dap of (110) plane was
also decreased at 3-4 h in α-chitin. These results were consistent with the XRD patterns
showing lower intensities in alkali treated α-chitin due to the destruction of crystallites
and the FT-IR spectra presenting that inter-sheet hydrogen bonds of α-chitin were
93
dissociated by alkali treatments for 1-4 h. In contrast, Dap of (020) and (110) planes
increased in β-chitin, compared with native β-chitin, but RI of (110) plane decreased at 3-
4 h where the conversion into α-form was appeared. Hence, alkali processed β-chitin
remained loose crystal structure with lower CI similar to the XRD patterns representing
decreased intensities and shifting of the peaks. In acid treatment, CI of α-chitin slightly
decreased but no significant changes in d-spacing and Dap, indicating that there was no
significant destruction of crystallites, whereas d-spacing and Dap of β-chitin were similar
to those of native β-chitin along with higher d-spacing of (020) plane indicating larger
space distances between the polymeric chains. Hence, crystallites of acid treated β-chitin
were less rigid than the native or acid treated α-chitin.
In summary, alkali treated α- and β-chitin exerted significant destruction of
crystallites and lower CI than their native chitin, and α-chitin converted from β-chitin as a
result of alkali treatment had loose-packed crystallites and lower CI than native α-chitin.
In contrast, acid had relatively less impact on the structural properties of α- and β-chitin.
Moisture Absorption Ability of Alkali or Acid Treated Chitin in Relation to their
Structural Properties
Moisture absorption ability (MAA, %) of the native and alkali or acid treated α- and
β-chitin is reported in Table 4.3. The native β-chitin had significantly higher MAA
(~7.0%) than that of the native α-chitin (~-0.8%). This result was consistent with the
previous studies reporting higher reactivity, swelling, and retention ability of absorbed
water in β-chitin in comparison with α-chitin 1-3.
94
In alkali treatment, MAA of α-chitin significantly increased after 1 h, and that of β-
chitin was increased after 1-2 h and had the highest MAA at 3-4 h with MAA of ~23-
27%, which was significantly higher than those of α-chitin at 3-4 h. Similarly, Kurita et al.
(1993) found that the crystal structure of β-chitin is destroyed easily by high
concentration of alkali treatment than that of α-chitin, showing much higher
hygroscopicity and the retention of the absorbed water in β-chitosan than that in α-
chitosan. Likewise, Wada and Saito 31 reported that β-chitin readily expanded along the
b-axis direction (no inter-sheet hydrogen bonds between stacked sheets) by heat and
water was easily swollen along the b-axis direction. Based upon the XRD patterns in this
study, the intensities of the peaks were significantly decreased in alkali treated α- and β-
chitin, but the peak of (110) plane was shifted to lower angles in alkali treated β-chitin at
2-4 h, indicating the destruction of crystallites. Moreover, RI of alkali treated β-chitin at
3-4 h was lower than that of native α-and β-chitin. In spite of the conversion of β-chitin
into α-chitin at 3 h, MAA was significantly higher probably due to the destruction of
crystallites and the lower CI than those of the native α- and β-chitin. Hence, moisture
absorption ability in alkali treated α- and β-chitin was significantly higher than that of
native α- and β- chitin due to the destruction of crystallites. The α-chitin converted from
β-chitin exerted significantly higher moisture absorption ability than that of the native α-
chitin, assuming that its reactivity and swelling ability were higher than native α-chitin
even with the presence of inter-sheet hydrogen bonds within the crystallites.
In acid treatment, moisture absorption ability of α-chitin was significantly increased
at 1 h, whereas that of β-chitin remained similar to that of the native chitin. Increase of
the moisture absorption ability of acid treated α-chitin at 1 h was probably due to the
95
decreased CI in comparison with native α-chitin. In contrast, there was no significant
decrease of CI in acid treated β-chitin in comparison with native β-chitin and the
conversion into α-form was appeared at 1-3 h, but the peaks of (020) and (110) planes
were shifted to lower angles indicating the destruction of crystallites. Hence, moisture
absorption ability of acid treated β-chitin was not significantly changed by the complex
structural modification. Compared with alkali treatment, acid induced less polymorphic
changes in α- and β-chitin.
In summary, α-chitin converted from β-chitin showed enhanced moisture absorption
ability in comparison with the native α- and β-chitin due to the polymorphic destruction
by alkali treatments, remaining higher swelling susceptibility of native β-chitin toward
solutions. This finding demonstrated that α-chitin originated from β-chitin is more
susceptible toward deacetylation and depolymerization in comparison with the native α-
and β-chitin,
Comparison in Deacetylation in α- and β-Chitin under the Various Alkali
Treatments
DDA of α- and β-chitin subjected to various alkali treatments are shown in Table 4.4.
DDA of α-chitosan was ~40-89% and that of β-chitosan was ~63-92% under the same
deacetylating treatment conditions, exhibiting relatively higher DDA in β-chitosan.
Different deacetylating treatments were required for obtaining same DDA of α- and β-
chitosan, in which for obtaining ~60% DDA, 40% NaOH at 90 ºC for 6 h and 40% NaOH
at 60ºC for 2 h were applied for α- and β-chitosan, respectively, while for obtaining ~75%
DDA, α- and β-chitin were deacetylated by 50% NaOH at 60 ºC for 6 h and 50% NaOH
96
at 60 ºC for 2 h, respectively. Hence, relatively milder deacetylation treatments with
lower temperature or shorter reaction time were required to extract 60 and 75% DDA of
β-chitosan than those required for obtaining α-chitosan. This result may be interpreted by
the different polymorphic structure between α- and β-chitin, in which α-chitin with strong
inter-sheet hydrogen bonds in tight-packed crystal structures with higher CI was less
reactive toward alkali treatment during the deacetylation process than β-chitin did,
consistent with previous finding showing higher reactivity and swelling ability of β-chitin
in alkali solutions than that of α-chitin 1, 3, 5, 15. Hence, producing β-chitosan from squid
pens resulted in low production cost by using lower concentrations of reagents and
shorter reactions times than that for α-chitin.
CONCLUSION
In comparison with α-chitin from shrimp shells, β-chitin from jumbo squid pens had
loose arrangements of polymeric chains, thus lower CI, which led to the higher moisture
absorption ability than that of α-chitin. β-chitin could be converted into α-form after 3 h
or 1-3 h treatment in alkali or acid solution, respectively. Alkali treatment resulted in
polymorphic destructions in both α- and β-chitin, exhibiting higher moisture absorption
ability than their native form. Moreover, moisture absorption ability of the α-chitin
converted from β-chitin was significantly higher than that of the native α-chitin due to the
destruction of crystallites and decrease of CI as a result of alkali treatment. Acid treated
α-chitin retained its inter-sheet hydrogen bonds, but its moisture absorption ability was
also significantly increased after 1 h treatment in comparison with the native α-chitin due
to reduced CI. Acid induced less destruction of crystallites in β-chitin than alkali showing
97
no significant change in its moisture absorption ability. Therefore, the exact impact of
alkali and acid treatment on the structural property and moisture absorption ability of
chitin depended on the form of chitin and the reaction time, and alkali treated β-chitin
was able to retain higher reactivity even after converted into α-form. In addition, the mild
deacetylating treatment was required for β-chitin than that for α-chitin when preparing
similar DDA of β- and α-chitosan. These results implicated that producing β-chitosan
from squid pens can be more cost effective owning to β-chitin’s loose crystallites and
high reactivity toward solvent.
AKNOWLEDGMENT
The authors would like to thank Mr. Mark Ludlow at Dosidicus LLC, USA for
donating squid pens and to Dr. John Simonsen at the Department of Wood Science,
Oregon State University for his assistance with the FT-IR analysis.
98
REFERENCES
1. Lamarque, G.; Viton, C.; Domard, A., Comparative study of the first heterogeneous deacetylation of α- and β-chitins in a multistep process.
Biomacromolecules 2004, 5 (3), 992-1001. 2. Kurita, K.; Ishii, S.; Tomita, K.; Nishimura, S.I.; Shimoda, K., Reactivity
characteristics of squid β-chitin as compared with those of shrimp chitin: High
potentials of squid chitin as a starting material for facile chemical modifications. Journal of Polymer Science Part A: Polymer Chemistry 1994, 32 (6), 1027-1032.
3. Kurita, K.; Tomita, K.; Tada, T.; Ishii, S.; Nishimura, S.I.; Shimoda, K., Squid chitin as a potential alternative chitin source: Deacetylation behavior and characteristic properties. Journal of Polymer Science Part A: Polymer Chemistry
1993, 31 (2), 485-491. 4. Lima, I. S.; Airoldi, C., A thermodynamic investigation on chitosan-divalent
cation interactions. Thermochimica Acta 2004, 421 (1-2), 133-139. 5. Chandumpai, A.; Singhpibulporn, N.; Faroongsarng, D.; Sornprasit, P.,
Preparation and physico-chemical characterization of chitin and chitosan from the
pens of the squid species, Loligo lessoniana and Loligo formosana. Carbohydrate Polymers 2004, 58 (4), 467-474.
6. Tolaimate, A.; Desbrires, J.; Rhazi, M.; Alagui, A.; Vincendon, M.; Vottero, P., On the influence of deacetylation process on the physicochemical characteristics of chitosan from squid chitin. Polymer 2000, 41 (7), 2463-2469.
7. Lavall, R. L.; Assis, O. B. G.; Campana-Filho, S. P., β-chitin from the pens of Loligo sp.: Extraction and characterization. Bioresource Technology 2007, 98
(13), 2465-2472. 8. Rhazi, M.; Desbrières, J.; Tolaimate, A.; Alagui, A.; Vottero, P., Investigation of
different natural sources of chitin: influence of the source and deacetylation
process on the physicochemical characteristics of chitosan. Polymer International 2000, 49 (4), 337-344.
9. Li, J.; Revol, J. F.; Marchessault, R. H., Alkali Induced Polymorphic Changes of Chitin. In Biopolymers, American Chemical Society: 1999; Vol. 723, pp 88-96.
10. Saito, Y.; Putaux, J. L.; Okano, T.; Gaill, F.; Chanzy, H., Structural aspects of the
swelling of β-chitin in HCl and its conversion into α-chitin. Macromolecules 1997, 30 (13), 3867-3873.
11. Noishiki, Y.; Takami, H.; Nishiyama, Y.; Wada, M.; Okada, S.; Kuga, S., Alkali-induced conversion of β-chitin to α-chitin. Biomacromolecules 2003, 4 (4), 896-899.
12. Liu, Y.; Liu, Z.; Pan, W.; Wu, Q., Absorption behaviors and structure changes of chitin in alkali solution. Carbohydrate Polymers 2008, 72 (2), 235-239.
13. Feng, F.; Liu, Y.; Hu, K., Influence of alkali-freezing treatment on the solid state structure of chitin. Carbohydrate Research 2004, 339 (13), 2321-2324.
14. Jang, M.K.; Kong, B.G.; Jeong, Y.I.; Lee, C. H.; Nah, J.W., Physicochemical
characterization of α-chitin, β-chitin, and γ-chitin separated from natural resources. Journal of Polymer Science Part A: Polymer Chemistry 2004, 42 (14), 3423-3432.
99
15. Tolaimate, A.; Desbrieres, J.; Rhazi, M.; Alagui, A., Contribution to the preparation of chitins and chitosans with controlled physico-chemical properties.
Polymer 2003, 44 (26), 7939-7952. 16. Mao, S.; Shuai, X.; Unger, F.; Simon, M.; Bi, D.; Kissel, T., The
depolymerization of chitosan: effects on physicochemical and biological properties. International Journal of Pharmaceutics 2004, 281 (1-2), 45-54.
17. Terbojevich, M.; Cosani, A.; Muzzarelli, R. A. A., Molecular parameters of
chitosans depolymerized with the aid of papain. Carbohydrate Polymers 1996, 29 (1), 63-68.
18. AOAC, Offical methods of analysis of the association of official analytical chemistry, The association of official analytical chemistry, Inc.: Washington, DC, 1884.
19. Walker, J.; Waterborg, J.; Matthews, H., The Lowry method for protein quantitation. In the protein protocols handbook, Humana Press: 1996; 7-9.
20. Chang, K. L. B.; Tsai, G.; Lee, J.; Fu, W.R., Heterogeneous N-deacetylation of chitin in alkaline solution. Carbohydrate Research 1997, 303 (3), 327-332.
21. Oh, H.; Nam, K., Invited paper: Application of chitin and chitosan toward
electrochemical hybrid device. Electronic Materials Letters 2011, 7 (1), 13-16. 22. Chen, L.; Du, Y.; Wu, H.; Xiao, L., Relationship between molecular structure and
moisture-retention ability of carboxymethyl chitin and chitosan. Journal of Applied Polymer Science 2002, 83 (6), 1233-1241.
23. Sabnis, S.; Block, L., Improved infrared spectroscopic method for the analysis of
degree of N-deacetylation of chitosan. Polymer Bulletin 1997, 39 (1), 67-71. 24. Cárdenas, G.; Cabrera, G.; Taboada, E.; Miranda, S. P., Chitin characterization by
SEM, FTIR, XRD, and 13C cross polarization/mass angle spinning NMR. Journal of Applied Polymer Science 2004, 93 (4), 1876-1885.
25. Focher, B.; Beltrame, P. L.; Naggi, A.; Torri, G., Alkaline N-deacetylation of
chitin enhanced by flash treatments: Reaction kinetics and structure modifications. Carbohydrate Polymers 1990, 12 (4), 405-418.
26. Focher, B.; Naggi, A.; Torri, G.; Cosani, A.; Terbojevich, M., Structural differences between chitin polymorphs and their precipitates from solutions-evidence from CP-MAS 13C-NMR, FT-IR and FT-Raman spectroscopy.
Carbohydrate Polymers 1992, 17 (2), 97-102. 27. Klug, H. P.; Alexander, L. E., X-ray diffraction procedures for poly-crystalline
and amorphous materials. J. Wley and Sons Inc.: New York, 1969. 28. Lamarque, G.; Chaussard, G.; Domard, A., Thermodynamic aspects of the
heterogeneous deacetylation of β-chitin: Reaction mechanisms.
Biomacromolecules 2007, 8 (6), 1942-1950. 29. Okano, T.; Sarko, A., Mercerization of cellulose. I. X-ray diffraction evidence for
intermediate structures. Journal of Applied Polymer Science 1984, 29 (12), 4175-4182.
30. Nishimura, H.; Sarko, A., Mercerization of cellulose. III. Changes in crystallite
sizes. Journal of Applied Polymer Science 1987, 33 (3), 855-866. 31. Wada, M.; Saito, Y., Lateral thermal expansion of chitin crystals. Journal of
Polymer Science Part B: Polymer Physics 2001, 39 (1), 168-174.
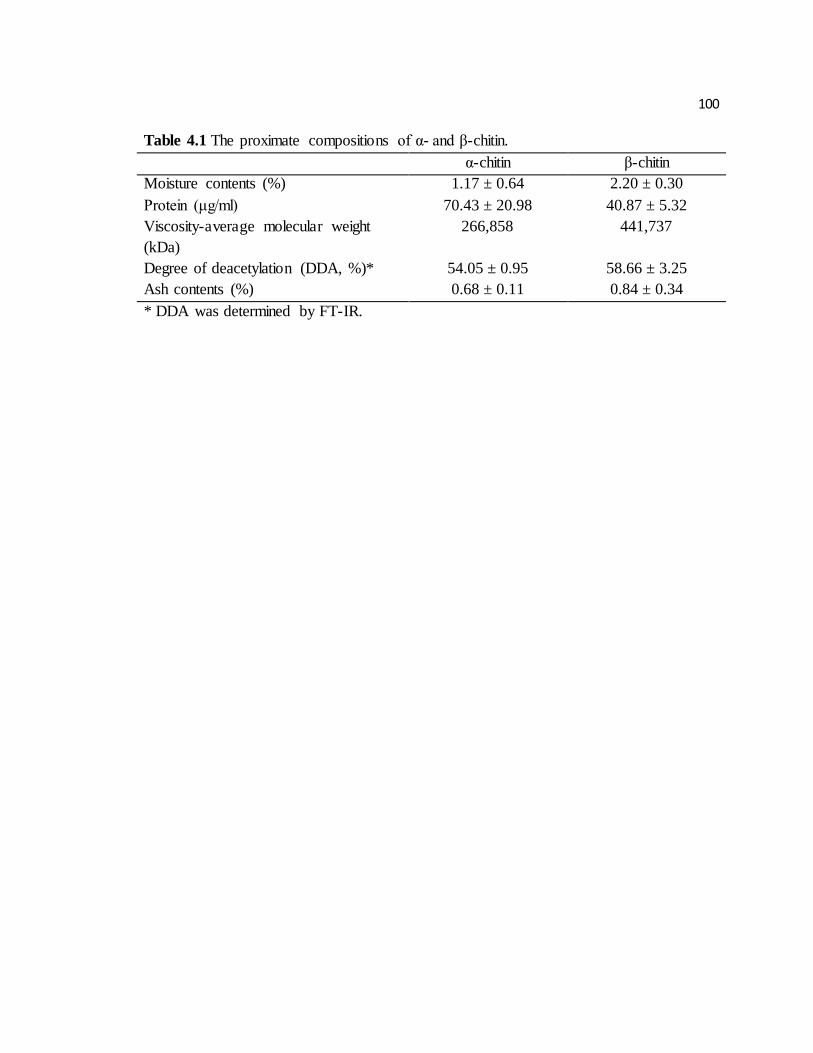
100
Table 4.1 The proximate compositions of α- and β-chitin.
α-chitin β-chitin
Moisture contents (%) 1.17 ± 0.64 2.20 ± 0.30
Protein (μg/ml) 70.43 ± 20.98 40.87 ± 5.32
Viscosity-average molecular weight
(kDa)
266,858 441,737
Degree of deacetylation (DDA, %)* 54.05 ± 0.95 58.66 ± 3.25
Ash contents (%) 0.68 ± 0.11 0.84 ± 0.34
* DDA was determined by FT-IR.
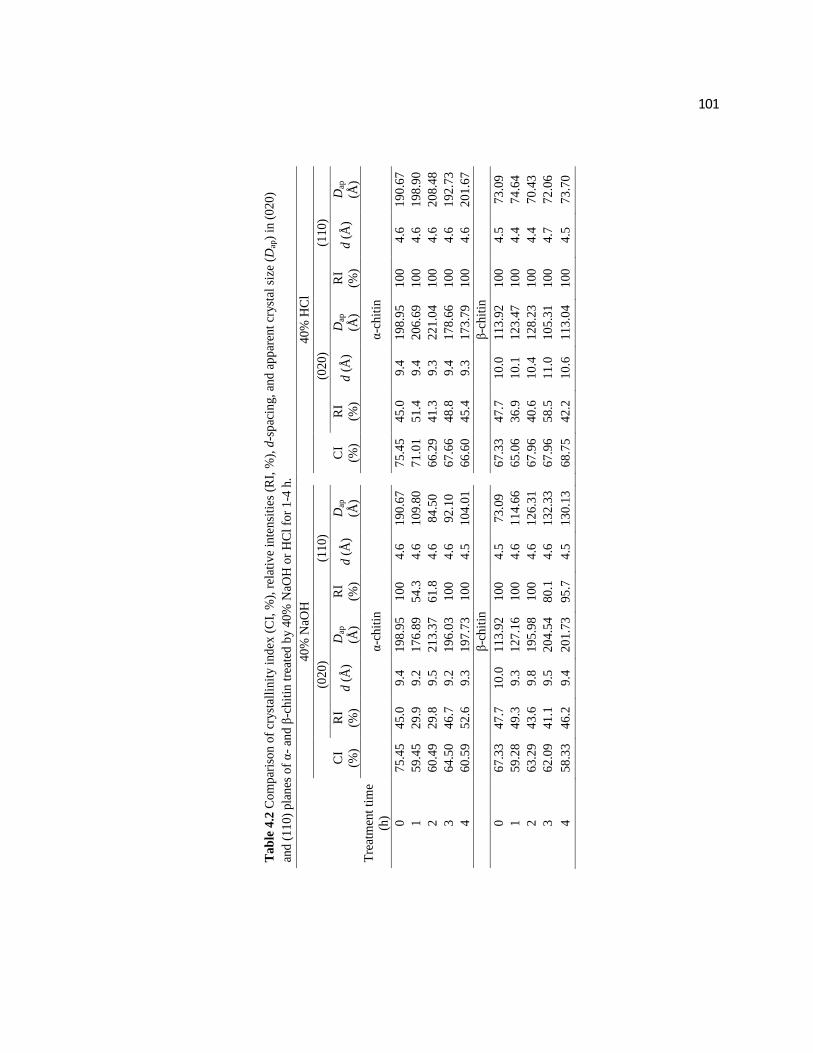
101
Tab
le 4
.2 C
om
par
ison
of
cryst
alli
nit
y i
ndex
(C
I, %
), r
elat
ive
inte
nsi
ties
(R
I, %
), d
-sp
acin
g, an
d a
pp
aren
t cr
yst
al s
ize
(Dap
) in
(020)
and (
110)
pla
nes
of
α-
and β
-chit
in t
reat
ed b
y 4
0%
NaO
H o
r H
Cl
for
1-4
h.
40%
NaO
H
40%
HC
l
C
I
(%)
(020)
(110)
(020)
(110)
RI
(%)
d (
Å)
Dap
(Å)
RI
(%)
d (
Å)
Dap
(Å)
C
I
(%)
RI
(%)
d (
Å)
Dap
(Å)
RI
(%)
d (
Å)
Dap
(Å)
Tre
atm
ent
tim
e
(h)
α-c
hit
in
α
-chit
in
0
75.4
5
45.0
9.4
198.9
5
100
4.6
190.6
7
75.4
5
45.0
9.4
198.9
5
100
4.6
190.6
7
1
59.4
5
29.9
9.2
176.8
9
54.3
4.6
109.8
0
71.0
1
51.4
9.4
206.6
9
100
4.6
198.9
0
2
60.4
9
29.8
9.5
213.3
7
61.8
4.6
84.5
0
66.2
9
41.3
9.3
221.0
4
100
4.6
208.4
8
3
64.5
0
46.7
9.2
196.0
3
100
4.6
92.1
0
67.6
6
48.8
9.4
178.6
6
100
4.6
192.7
3
4
60.5
9
52.6
9.3
197.7
3
100
4.5
104.0
1
66.6
0
45.4
9.3
173.7
9
100
4.6
201.6
7
β
-chit
in
β
-chit
in
0
67.3
3
47.7
10.0
113.9
2
100
4.5
73.0
9
67.3
3
47.7
10.0
113.9
2
100
4.5
73.0
9
1
59.2
8
49.3
9.3
127.1
6
100
4.6
114.6
6
65.0
6
36.9
10.1
123.4
7
100
4.4
74.6
4
2
63.2
9
43.6
9.8
195.9
8
100
4.6
126.3
1
67.9
6
40.6
10.4
128.2
3
100
4.4
70.4
3
3
62.0
9
41.1
9.5
204.5
4
80.1
4.6
132.3
3
67.9
6
58.5
11.0
105.3
1
100
4.7
72.0
6
4
58.3
3
46.2
9.4
201.7
3
95.7
4.5
130.1
3
68.7
5
42.2
10.6
113.0
4
100
4.5
73.7
0
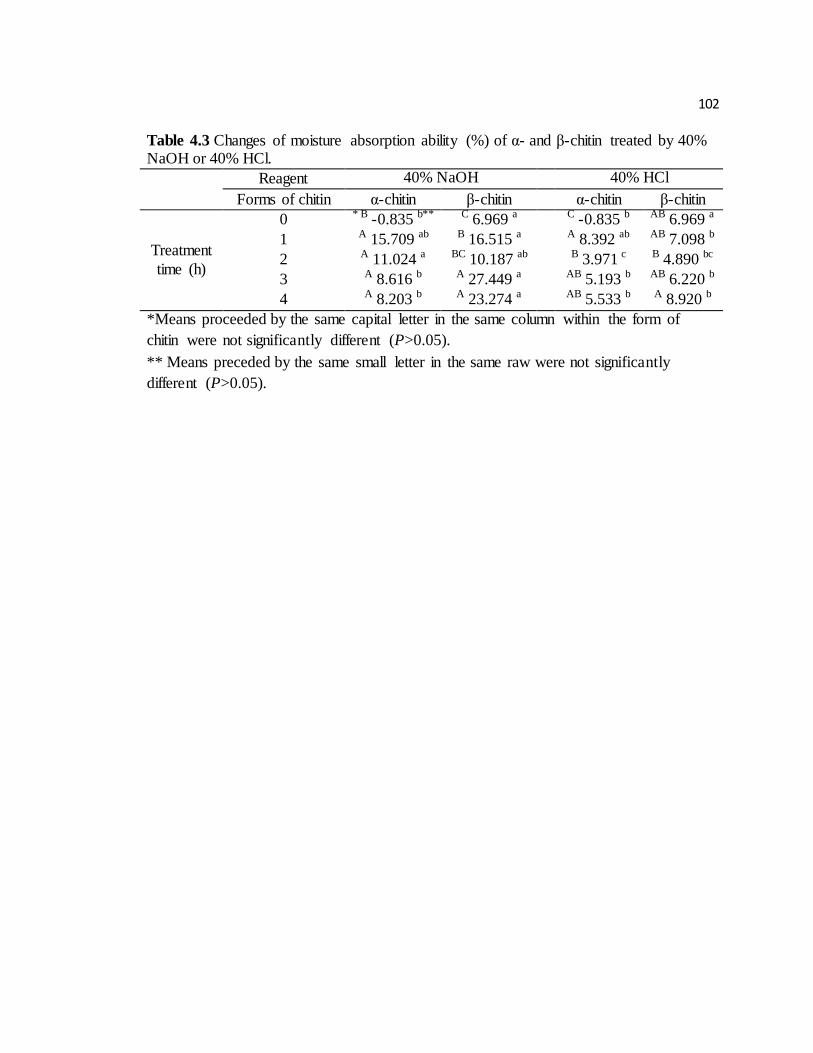
102
Table 4.3 Changes of moisture absorption ability (%) of α- and β-chitin treated by 40% NaOH or 40% HCl.
Reagent 40% NaOH 40% HCl
Forms of chitin α-chitin β-chitin α-chitin β-chitin
Treatment
time (h)
0 * B -0.835 b** C 6.969 a C -0.835 b AB 6.969 a
1 A 15.709 ab B 16.515 a A 8.392 ab AB 7.098 b
2 A 11.024 a BC 10.187 ab B 3.971 c B 4.890 bc
3 A 8.616 b A 27.449 a AB 5.193 b AB 6.220 b
4 A 8.203 b A 23.274 a AB 5.533 b A 8.920 b
*Means proceeded by the same capital letter in the same column within the form of
chitin were not significantly different (P>0.05).
** Means preceded by the same small letter in the same raw were not significantly
different (P>0.05).
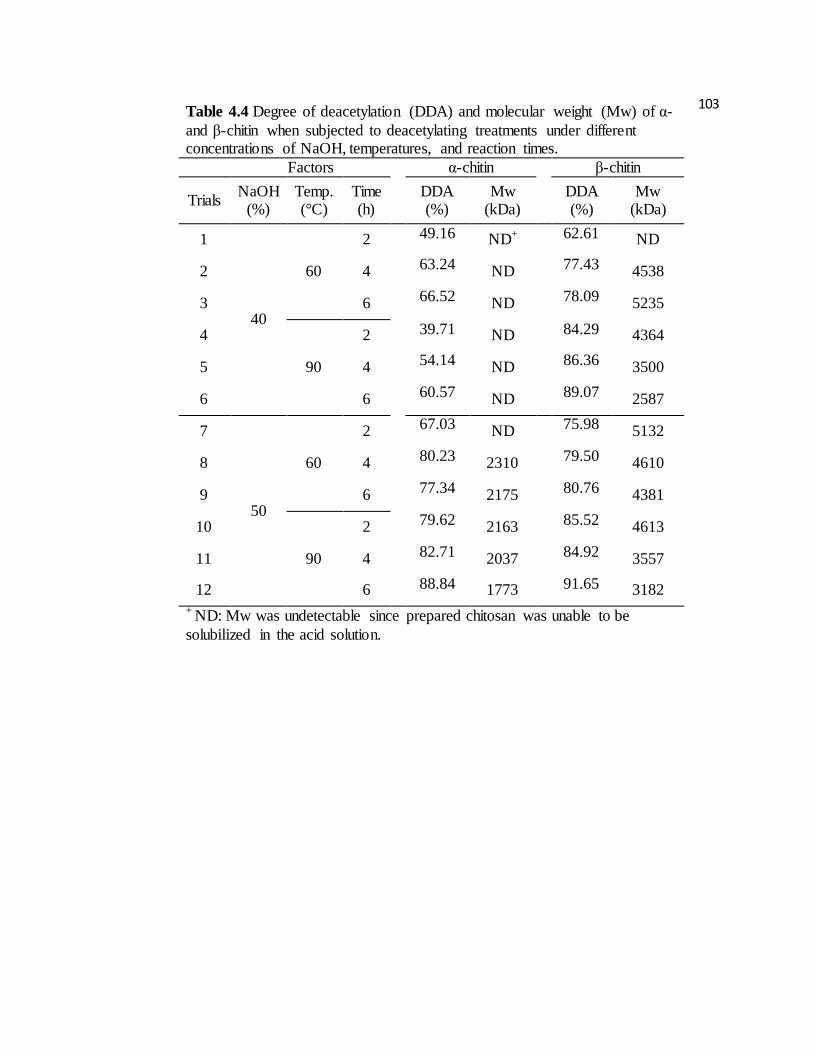
103
Table 4.4 Degree of deacetylation (DDA) and molecular weight (Mw) of α-
and β-chitin when subjected to deacetylating treatments under different concentrations of NaOH, temperatures, and reaction times.
Factors α-chitin β-chitin
Trials NaOH
(%) Temp. (°C)
Time (h)
DDA (%)
Mw (kDa)
DDA (%)
Mw (kDa)
1
40
60
2 49.16 ND+ 62.61 ND
2 4 63.24 ND 77.43 4538
3 6 66.52 ND 78.09 5235
4
90
2 39.71 ND 84.29 4364
5 4 54.14 ND 86.36 3500
6 6 60.57 ND 89.07 2587
7
50
60
2 67.03 ND 75.98 5132
8 4 80.23 2310 79.50 4610
9 6 77.34 2175 80.76 4381
10
90
2 79.62 2163 85.52 4613
11 4 82.71 2037 84.92 3557
12 6 88.84 1773 91.65 3182
+ ND: Mw was undetectable since prepared chitosan was unable to be
solubilized in the acid solution.
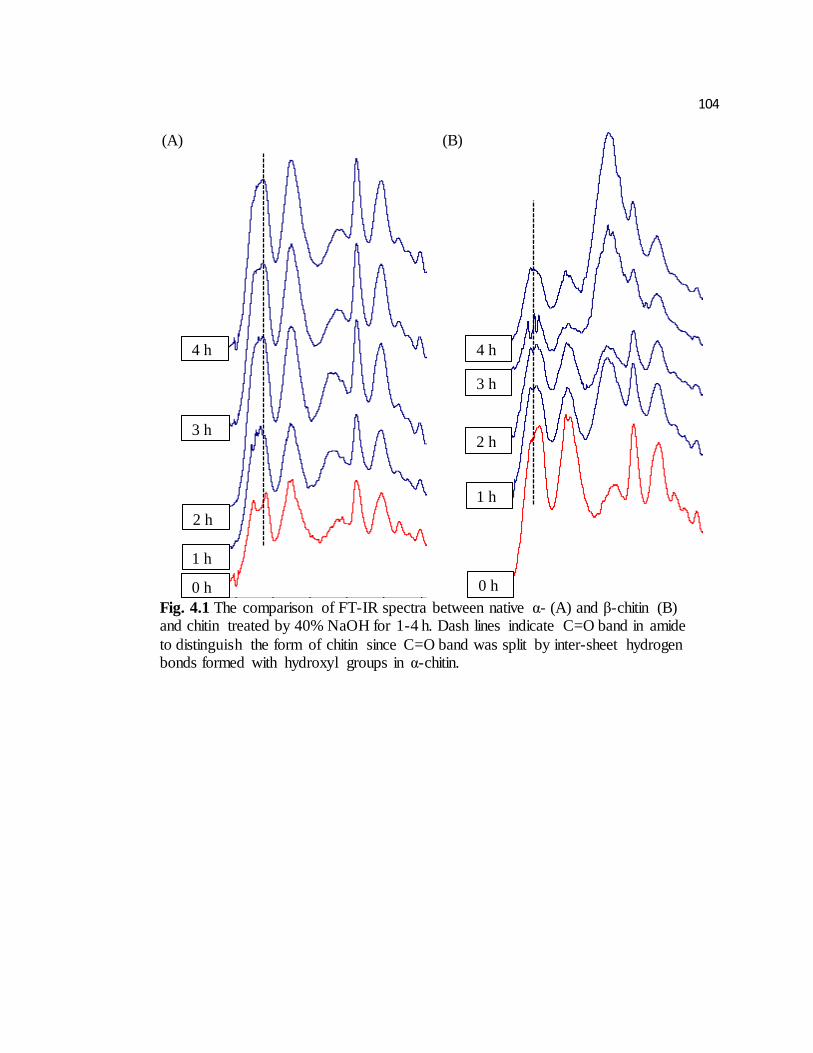
104
(A)
(B)
Fig. 4.1 The comparison of FT-IR spectra between native α- (A) and β-chitin (B) and chitin treated by 40% NaOH for 1-4 h. Dash lines indicate C=O band in amide
to distinguish the form of chitin since C=O band was split by inter-sheet hydrogen bonds formed with hydroxyl groups in α-chitin.
1 h
0 h
2 h
3 h
4 h
1 h
2 h
3 h
4 h
0 h
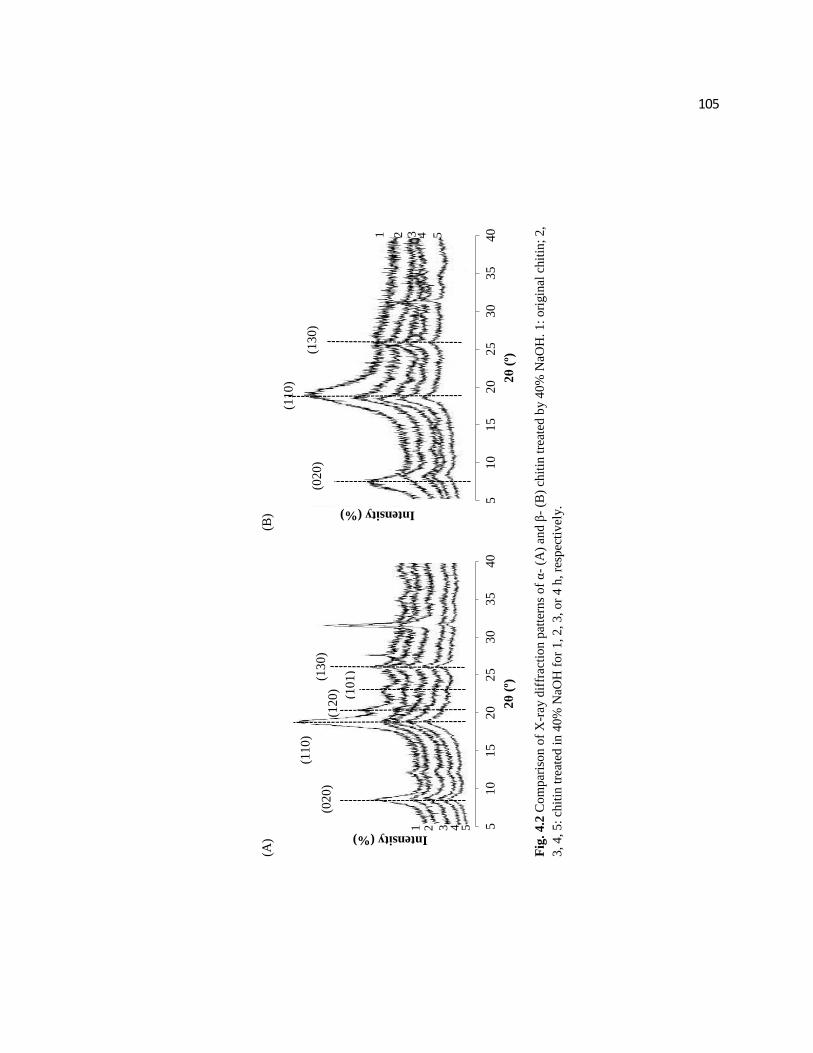
105
(A)
(B)
F
ig.
4.2
Co
mp
aris
on
of
X-r
ay d
iffr
acti
on
pat
tern
s o
f α
- (A
) an
d β
- (B
) ch
itin
tre
ated
by 4
0%
NaO
H.
1:
ori
gin
al c
hit
in;
2,
3,
4,
5:
chit
in t
reat
ed i
n 4
0%
NaO
H f
or
1,
2,
3,
or
4 h
, re
spec
tiv
ely.
51
01
52
02
53
03
54
0
Intensity (%)
2θ
(º)
(02
0)
(11
0)
(12
0) (10
1)(130)
51
01
52
02
53
03
54
0
Intensity (%)
2θ
(º)
(02
0)
(11
0)
(13
0)
1
2
3
4
5
1
2
3
4
5
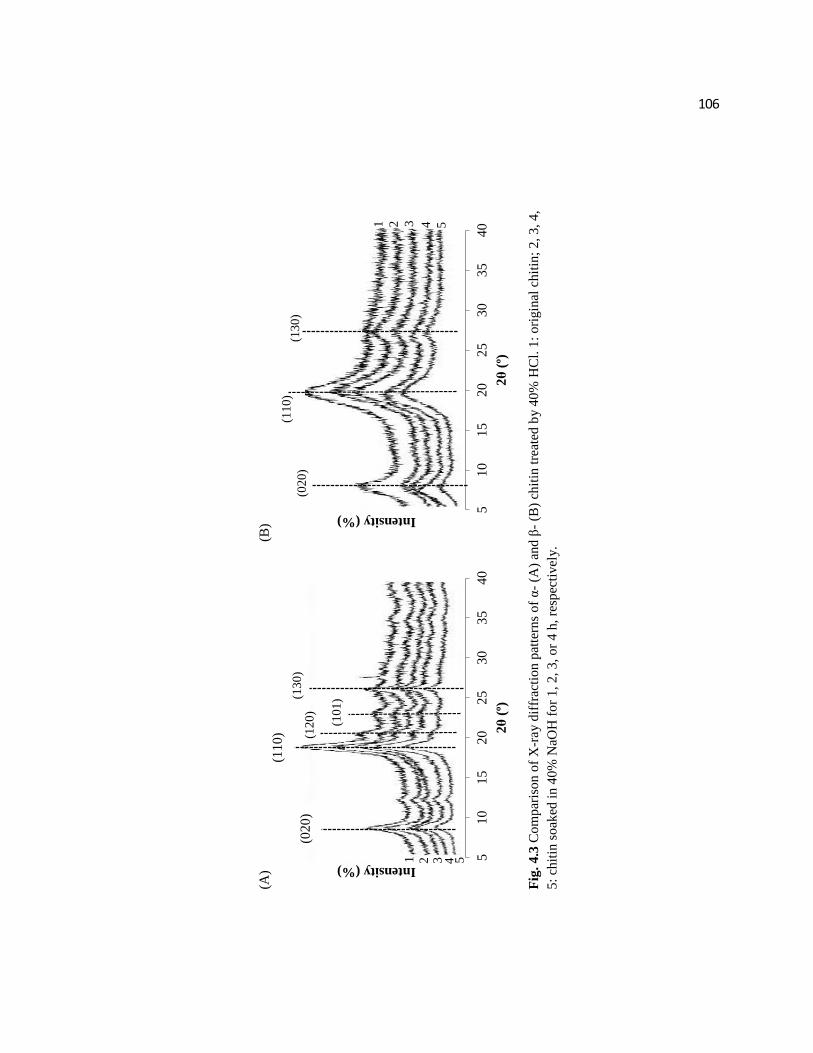
106
(A)
(B)
F
ig.
4.3
Com
par
ison o
f X
-ray d
iffr
acti
on p
atte
rns
of
α-
(A)
and β
- (B
) ch
itin
tre
ated
by 4
0%
HC
l. 1
: ori
gin
al c
hit
in;
2, 3, 4,
5:
chit
in s
oak
ed i
n 4
0%
NaO
H f
or
1, 2, 3, or
4 h
, re
spec
tivel
y.
510
15
20
25
30
35
40
Intensity (%)
2θ
(º)
(02
0)
(12
0)
(10
1)(1
30
)
510
15
20
25
30
35
40
Intensity (%)
2θ
(º)
(02
0)
(110)
(130)
1
2
3
4 5
1
2
3
4
5
(110)
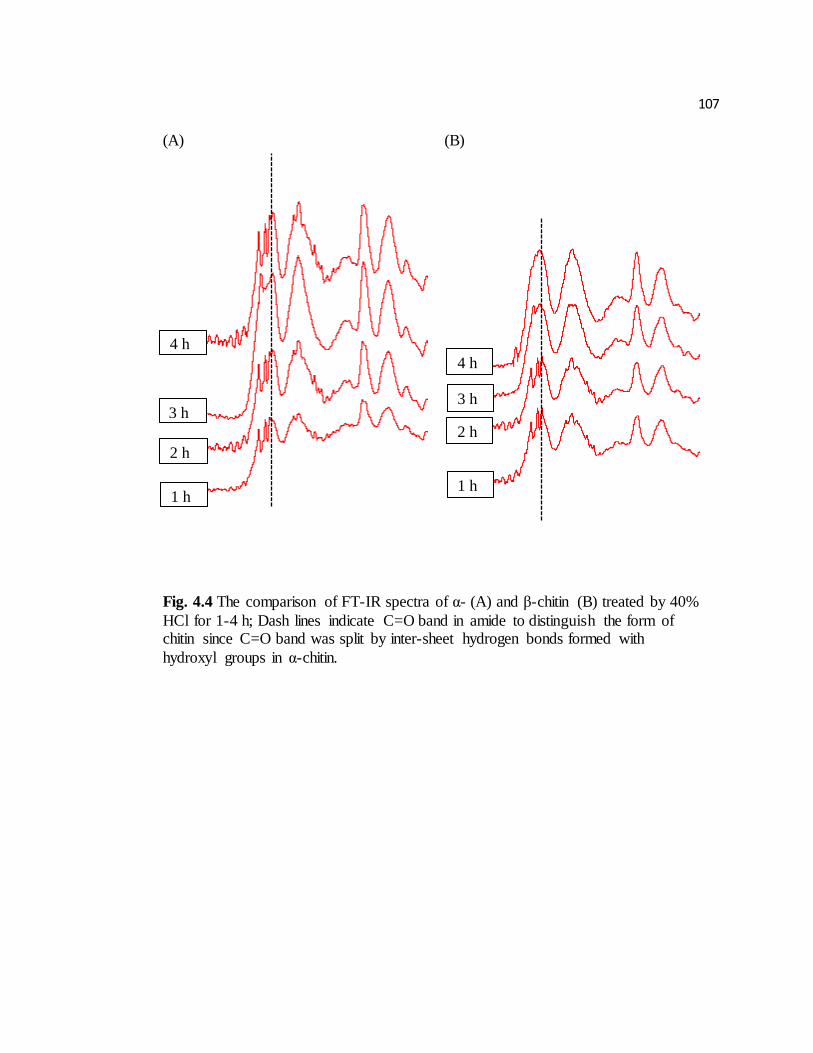
107
(A)
(B)
Fig. 4.4 The comparison of FT-IR spectra of α- (A) and β-chitin (B) treated by 40%
HCl for 1-4 h; Dash lines indicate C=O band in amide to distinguish the form of chitin since C=O band was split by inter-sheet hydrogen bonds formed with
hydroxyl groups in α-chitin.
1 h
2 h
3 h
4 h
1 h
2 h
3 h
4 h
108
CHAPTER 5
COMPARISON IN ANTIOXIDANT ACTION BETWEEN α-CHITOSAN and β-
CHITOSAN AT A WIDE RANGE OF MOLECULAR WEIGHT AND CHITOSAN
CONCENTRATION
Jung, J. Zhao, Y. Published in Bioorganic & Medicinal Chemistry 2012, 20 (9), 2905-
2911.
109
ABSTRACT
Antioxidant activity in α- and β-chitosan at a wide range of molecular weight (Mw) and
chitosan concentration (CS) was determined by 1, 1-diphenyl-2-picrylhydrazyl (DPPH)
radical scavenging activity, reducing ability, chelating ability, and hydroxyl radical
scavenging activity. The form of chitosan (FC) had significant (P<0.05) effect on all
measurements except DPPH radical scavenging activity, and antioxidant activity was
dependent on Mw and CS. High Mw (280-300 kDa) of β-chitosan had extremely lower
half maximal effective concentrations (EC50) than α-chitosan in DPPH radical scavenging
activity and reducing ability. The 22-30 kDa of α- and β-chitosan showed significantly
(P<0.05) higher activities in DPPH radical scavenging, reducing ability, and hydroxyl
radical scavenging than samples at other Mw, while chelating ability was the highest in
4-5 kDa chitosan. CS had significant effect on all measurements and the effect was
related to Mw. The antioxidant activity of 280-300 kDa chitosan was affected by coil-
overlap concentrations (C*) in the CS range of 4-10 mg/mL, forming entanglements.
Reducing ability and hydroxyl radical scavenging activity were more predominant action
in antioxidant activity of chitosan as shown by the lower EC50 values than those in other
antioxidant measurements.
Keywords: β-chitosan, jumbo squid pens, α-chitosan, antioxidant activity, molecular
weight
110
INTRODUCTION
Antioxidant activity is one of the well-known functionalities of chitosan. Many
studies have shown that chitosan inhibit the reactive oxygen species (ROS) and prevent
the lipid oxidation in food and biological systems. Several mechanisms about the
antioxidant action of chitosan have been proposed. 1 Chitosan can scavenge free radicals
or chelate metal ions from the donation of a hydrogen or the lone pairs of electrons. 2, 3
The interaction of chitosan with metal ions could involve several complex actions
including adsorption, ion-exchange, and chelation. 4 The hydroxyl groups (OH) and
amino groups (NH2) in chitosan are the key functional groups for its antioxidant activity,
but can be difficult to be dissociated due to the semi-crystalline structure of chitosan with
strong hydrogen bonds. 2 Chitin has two forms, named α- and β-chitin, in which α-chitin
is stable with intra-chain, intra-sheet, and inter-sheet hydrogen bonds from the
antiparallel sheets along with c axis in orthorhombic cell, while β-chitin has no hydrogen
bonds between two inter-sheets owing to their parallel directions. 5-7 Also, the initial
crystallinity index (CI) of α- and β-chitin are different, 28.3% for α-chitin and 20.8% for
β-chitin. Through deacetylation, CI of α-chitosan was slightly decreased, while CI of β-
chitosan exhibited large reduction. 7-9 Similarly, Kurita et al. (1993) reported that α-chitin
is rigid and can be less susceptible to deacetylation compared to β-chitin. 10 Therefore,
the polymeric structures (e.g. CI) of chitosan deacetylated from different forms of chitin
may not be identical and β-chitosan can have higher solubility with less crystallinity, thus
providing better functionalities than α-chitosan in similar Mw and DDA. For this reason,
we hypothesized that the form of chitosan (FC) may be a significant factor determining
111
the antioxidant activity of chitosan. However, little study has compared the difference
and/or similarity between α- and β-chitosan in their antioxidant activity.
Molecular weight (Mw) of chitosan is one of the most important factors affecting
its antioxidant activity. Je et al. (2004) indicated that 1–5 kDa chitosan with 90%
degree of deacetylation (DDA) has the highest radical scavenging activity. 11 Sun et al.
(2007) reported that chitosan oligomers with low Mw (2.30, 3.27, and 6.12 kDa) have
better antioxidant activity than that of higher Mw oligosaccharides (15.25 kDa). 12
Tomida et al. (2009) also showed that low Mw chitosan (2.8, 17.0, and 33.5 kDa)
inhibits the oxidation of serum albumin, resulting in reduction of oxidative stress in
uremia in comparison with higher Mw chitosan (62.6 – 931 kDa). 13 In the study of
antioxidant effect of chitosan on salmon at Mw of 30, 90 and 120 kDa, 1 the lowest
Mw of chitosan (30 kDa) showed the strongest antioxidant activity, resulting in
approximately 85% scavenging activity for free radicals. Chien et al. (2007) also
found that lower Mw (12 kDa) chitosan increases antioxidant activity in apple juice,
compared to higher Mw chitosan (95 and 318 kDa). 14Also, some studies reported
that Mw is dependent on its crystallinity. Kumar et al. (2004) reported decreased CI
in lower Mw, 15 whereas Ogawa found increased CI in lower Mw. 16 Liu et al. (2006)
reported increased crystallinity in high DDA and low Mw. 17 In respect to the effect
of DDA, most studies reported that antioxidant property is enhanced with higher
DDA. 11, 18, 19
This study was aimed to investigate the antioxidant action of α- and β-chitosan
obtained from shrimp shells and jumbo squid pens, respectively, at a wide range of
Mw and chitosan concentration (CS). DDA effect was also considered. Different
112
antioxidant measurements including DPPH radical scavenging activity, reducing ability,
chelating ability, and hydroxyl radical scavenging were conducted to verify predominant
antioxidant action in chitosan.
MATERIALS AND METHODS
Materials
Dried jumbo squid (Dosidicus gigas) pens were provided by Dosidicus LLC (USA).
Commercial α-chitosan from shrimp shells was purchased from Primax (Iceland) with
Mw of 300 kDa and DDA of 88%, determined in this study. NaOH, NaCl, ascorbic acid,
and trichloroacetic acid were purchased from Mallinckrodt Chemicals Co. (USA). 2-
thiobarbituric acid and ferric chloride were from Sigma Chemical Co. (USA) and
ammonium thiocyanate and deoxyribose from Alfa Aesar (USA). 1,1-Dephenyl-2-
picrylhydrzyl (DPPH), free radical, and cellulase from Aspergillus niger were from TCI
America (USA). Ferrous chloride and hydrogen peroxide were from J.T. Baker (USA)
and VWR (USA), respectively. Potassium ferricyanide and Ethylenediaminetetraacetic
acid (EDTA) were from EM Science (USA). All the chemicals were of reagent grade.
Chitosan Preparation
Three steps were applied for β-chitosan preparation, including deproteinization,
deacetylation, and depolymerization. Dried squid pens were ground into about 18 mesh
(ASTM) size by a grinder (Glenmilles Inc., USA), and then deproteinized in 5% NaOH
for 3 d at room temperature. After washing with distilled water till neutral pH, chitin
powder was dried at 40 ºC oven (Thermo Fisher Scientific Inc., USA) for 24 h. β-chitin
113
was deacetylated by two treatment conditions: 1) 50% NaOH at 90 ºC for 6 h to
obtain 97% DDA; and 2) 40% NaOH at 90 ºC for 4 h to obtain 86% DDA. 20 Samples
were washed with distilled water till reaching neutral pH, and the filtrate was dried at
40 ºC for 24 h. Both α- and β-chitosan were then depolymerized by enzymatic
hydrolysis using cellulase. Briefly, chitosan was dissolved in 2% acetic acid solution
at a ratio of 1:100 (chitosan: solvent) for α-chitosan and 1:200 for β-chitosan due to
its higher viscosity. Solutions were adjusted to pH 5 by 10% NaOH. Cellulase was
added in the same weight of chitosan in the solutions and reacted at 50 ºC water bath
for a given time determined from our preliminary studies to receive desired Mw. The
hydrolyzates were boiled for 10 min to inactivate enzyme reaction, centrifuged at
8,000 g for 30 min, and filtered through a 0.45 μm membrane filter to remove
denatured enzyme. A 10% NaOH was then added into the solution till about pH 7 for
precipitation. Hydrolyzates of low and oligosaccharide chitosan were concentrated to
about one-tenth of the original volume by a rotary evaporator with reduced pressure.
After solution was adjusted to pH 7 by using 10% NaOH, ethanol was added for
precipitation. Precipitated samples were washed again with distilled water and
ethanol to remove other residues and dried at 40 ºC oven for 24 h. Note that when
preparing α- and β-chitosan samples with a wide range of Mw using enzyme
hydrolysis, it was difficult to obtain exact same Mw in both forms of chitosan.
Therefore, similar Mw of α- and β-chitosan samples was arranged into four groups:
oligosaccharides (4-5 kDa), low Mw (22-30 kDa), med Mw (61-79 kDa), and high
Mw (280-300 kDa) to compare their antioxidant activity. In addition, low DDA (86%)
β-chitosan sample was prepared to compare its antioxidant activity with high DDA
114
(97%) of β-chitosan and low DDA (88%) of α-chitosan at same sample Mw of 12-15 kDa.
Measurement of Solubility
The pH-dependent solubility of chitosan solutions was measured by monitoring the
changes of the solution turbidity (T, %) corresponding to different pH (3–11) adjusted by
NaOH. 21 A 100 mg of chitosan sample was dissolved in 100 mL of 1% acetic acid, and
10% NaOH was added to increase pH gradually. The T (%) of the solutions was
measured at 600 nm using UV160US Shimadzu spectrophotometer (Shimadzu, Japan).
Determination of Viscosity-Average Mw
The molecular weight of hydrolyzed chitosan was determined by using the
Ubbelohde Dilution Viscometer (Cannon instrument Co., USA) with the capillary size of
0.58 nm. Approximate 100 mg of chitosan was dissolved in 10 mL of the mixture
solution of 0.1M CH3COOH and 0.2M NaCl. The intrinsic viscosity was measured by the
intercept between the Huggins (reduced viscosity, Ƞ sp/C~C) and Kraemer (relative
viscosity, Ƞ rel/C ~C) plots when the concentration was 0. 22 The viscosity-average
molecular weight of chitosan was calculated by Mark-Houwink-Sakurada (MHS)
equation:
[Ƞ] = K (MW) a
where K and a were the constants, K=1.81 x 10⁻³ and a = 0.93; and [Ƞ] is the intrinsic
viscosity obtained from two plots, Huggins and Kraemer. Coil-overlap concentrations
(C*) was calculated as 1/[ƞ] in each group of Mw.
115
DPPH Radical Scavenging Activity
Chitosan has been known to have different antioxidant mechanisms, such as free
radical scavenging ability, chelating ability, and reducing ability, 2, 23 thus four
different antioxidant measurements including DPPH radical scavenging activity,
reducing ability, chelating ability, and hydroxyl radical scavenging activity were
conducted. DPPH free radical scavenging activity and hydroxyl radical scavenging
activity were selected to evaluate free radical scavenging properties. Hydroxyl
radicals are the most reactive among reactive oxygen species. Chitosan can donate
electrons and hydrogen to prevent free radical chains from oxidation as it is oxidized,
and its ability was determined by the measurement of reducing ability. Chelating
ability also related to the lone pair of electron in amino groups as ligands forming
chitosan-metal complex.
DPPH radical scavenging activity was measured by following the method of
Shimada et al.24 Each chitosan solution (2–10 mg/mL, 1.5 mL) in 0.2% acetic acid
was added into 3 mL of DPPH in methanolic solution (0.09 mg/mL). The mixture
was shaken by vortex mixer (Scientific Industries Inc., U.S.) and stored for 30 min in
the dark and measured at 517 nm, spectrophotometrically (Shimadzu, Japan). The
scavenging ability was calculated as: 19 Scavenging activity (%)= [(ΔA517 of control –
ΔA517 of sample)/ΔA517 of control] x 100. DPPH methanolic solution with 0.2%
acetic acid solution was used as control. EC50 value (mg/mL) indicated the
concentration showing 50% scavenging activity.
Reducing Power
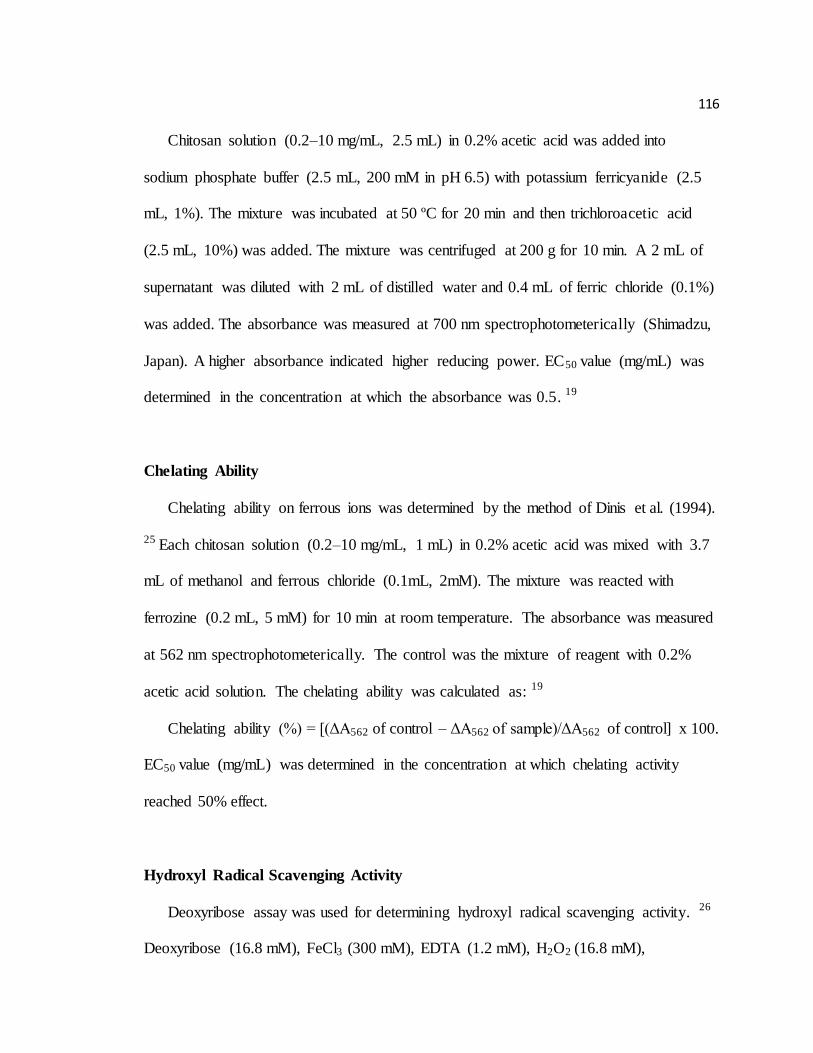
116
Chitosan solution (0.2–10 mg/mL, 2.5 mL) in 0.2% acetic acid was added into
sodium phosphate buffer (2.5 mL, 200 mM in pH 6.5) with potassium ferricyanide (2.5
mL, 1%). The mixture was incubated at 50 ºC for 20 min and then trichloroacetic acid
(2.5 mL, 10%) was added. The mixture was centrifuged at 200 g for 10 min. A 2 mL of
supernatant was diluted with 2 mL of distilled water and 0.4 mL of ferric chloride (0.1%)
was added. The absorbance was measured at 700 nm spectrophotometerically (Shimadzu,
Japan). A higher absorbance indicated higher reducing power. EC50 value (mg/mL) was
determined in the concentration at which the absorbance was 0.5. 19
Chelating Ability
Chelating ability on ferrous ions was determined by the method of Dinis et al. (1994).
25 Each chitosan solution (0.2–10 mg/mL, 1 mL) in 0.2% acetic acid was mixed with 3.7
mL of methanol and ferrous chloride (0.1mL, 2mM). The mixture was reacted with
ferrozine (0.2 mL, 5 mM) for 10 min at room temperature. The absorbance was measured
at 562 nm spectrophotometerically. The control was the mixture of reagent with 0.2%
acetic acid solution. The chelating ability was calculated as: 19
Chelating ability (%) = [(ΔA562 of control – ΔA562 of sample)/ΔA562 of control] x 100.
EC50 value (mg/mL) was determined in the concentration at which chelating activity
reached 50% effect.
Hydroxyl Radical Scavenging Activity
Deoxyribose assay was used for determining hydroxyl radical scavenging activity. 26
Deoxyribose (16.8 mM), FeCl3 (300 mM), EDTA (1.2 mM), H2O2 (16.8 mM),
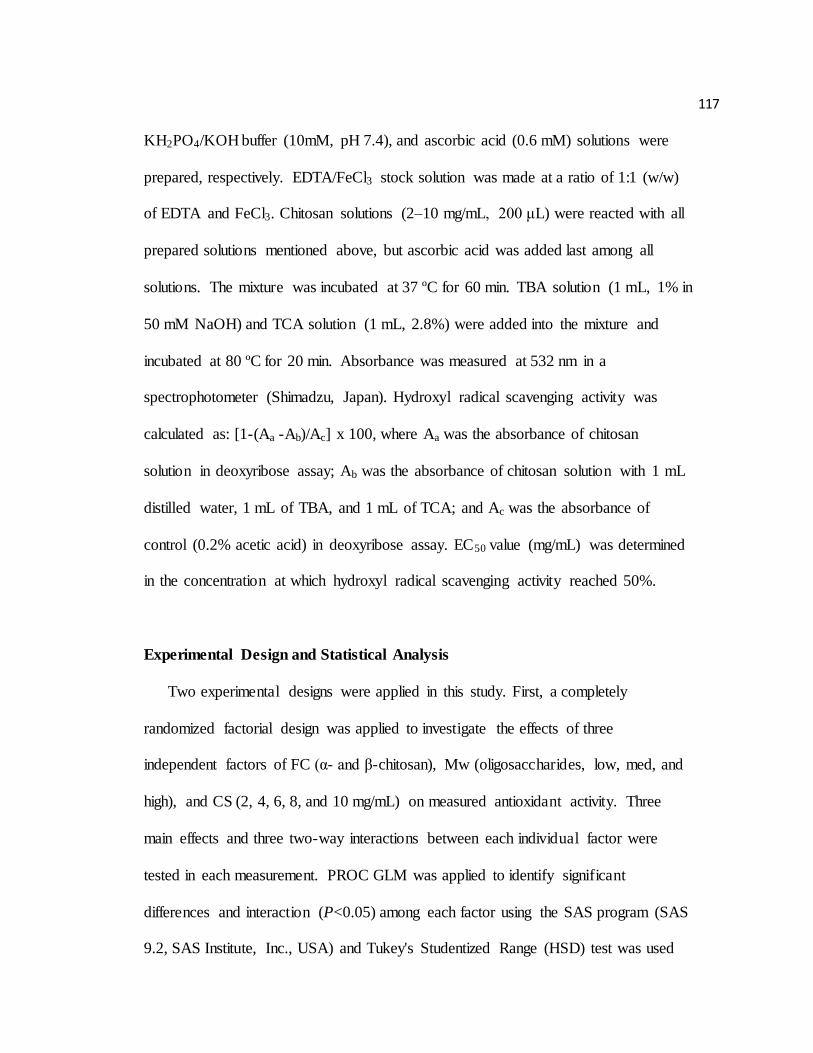
117
KH2PO4/KOH buffer (10mM, pH 7.4), and ascorbic acid (0.6 mM) solutions were
prepared, respectively. EDTA/FeCl3 stock solution was made at a ratio of 1:1 (w/w)
of EDTA and FeCl3. Chitosan solutions (2–10 mg/mL, 200 μL) were reacted with all
prepared solutions mentioned above, but ascorbic acid was added last among all
solutions. The mixture was incubated at 37 ºC for 60 min. TBA solution (1 mL, 1% in
50 mM NaOH) and TCA solution (1 mL, 2.8%) were added into the mixture and
incubated at 80 ºC for 20 min. Absorbance was measured at 532 nm in a
spectrophotometer (Shimadzu, Japan). Hydroxyl radical scavenging activity was
calculated as: [1-(Aa -Ab)/Ac] x 100, where Aa was the absorbance of chitosan
solution in deoxyribose assay; Ab was the absorbance of chitosan solution with 1 mL
distilled water, 1 mL of TBA, and 1 mL of TCA; and Ac was the absorbance of
control (0.2% acetic acid) in deoxyribose assay. EC50 value (mg/mL) was determined
in the concentration at which hydroxyl radical scavenging activity reached 50%.
Experimental Design and Statistical Analysis
Two experimental designs were applied in this study. First, a completely
randomized factorial design was applied to investigate the effects of three
independent factors of FC (α- and β-chitosan), Mw (oligosaccharides, low, med, and
high), and CS (2, 4, 6, 8, and 10 mg/mL) on measured antioxidant activity. Three
main effects and three two-way interactions between each individual factor were
tested in each measurement. PROC GLM was applied to identify significant
differences and interaction (P<0.05) among each factor using the SAS program (SAS
9.2, SAS Institute, Inc., USA) and Tukey's Studentized Range (HSD) test was used
118
for the multiple comparisons among treatments within each factor. Secondly, a
completely randomized design was employed to investigate the effect of DDA in a range
of 86-97% at given Mw of 12-15 kDa. All experiments were repeated.
RESULTS
Solubility
Changes of transmittance (T, %) in different Mw of α- and β-chitosan solutions at the
pH range of 3 to 11 are reported in Fig. 5.1, including a β-chitosan sample with Mw of 15
kDa and 86% DDA for evaluating the possible effect of different DDAs between α-
chitosan (88%) and β-chitosan (97%) samples on the measured antioxidant activity. T (%)
was not changed at pH 3 to 11 in both α- and β-chitosan samples with Mw of 4-5 kDa
and 22-30 kDa except 22-30 kDa α-chitosan where T (%) decreased when pH was over 9.
T (%) of both α- and β-chitosan at Mw of 61-79 kDa and 280-300 kDa was significantly
decreased in the alkaline region. The solubility of chitosan decreased with increased Mw
in the alkaline region. At 280-300 kDa, T (%) of α-chitosan showed faster decreasing
trend than β-chitosan along with increased pH. In comparison of two β-chitosan samples
with similar Mw, but different DDA (86% DDA and 15 kDa vs. 97% DDA and 22-30
kDa), the one with low DDA exhibited reduced T (%) when pH reached about 9 despite
of the lower Mw. This result demonstrated that the solubility of chitosan is decreased by
reduced DDA.
Antioxidant Activity
119
Mw and coli-overlap concentration of α- and β-chitosan samples are shown in
Table 5.1. Mw of four groups of α- and β-chitosan samples were significantly
different (P<0.05), while no difference (P>0.05) in Mw among high DDA (97%) of
β-chitosan and low DDA of α- (88%) and β (86%)-chitosan samples. At Mw of 4-5,
22-30, 61-79, and 280-300 kDa, C* value was 179.86-271.00, 38.40-55.77, 14.72-20-
55, and 4.27-6.11 mg/mL, respectively. The long chain of 280-300 kDa chitosan
samples could be entangled in CS range of 4-10 mg/mL since C* of 4.27-6.11 mg/mL
was overlapped within the tested CS in this study.
ANOVA results of all antioxidant activity measurements are reported in Table 5.2.
FC, Mw, and CS had significant (P<0.05) effect on the change of reducing power,
chelating ability, and hydroxyl radical scavenging activity, but DPPH radical
scavenging activity was significantly (P<0.05) affected by only Mw and CS. There
was significant two-way interaction between FC and Mw on all measured antioxidant
activity except chelating ability, and the interactions between Mw and CS on DPPH
radical scavenging activity and chelating ability (P<0.05).
The multiple comparison results among different treatments within each main
factor are shown in Table 5.3. In comparison of FC, reducing ability and hydroxyl
radical scavenging activity were significantly higher in β-chitosan samples than that
in α-chitosan, whereas α-chitosan showed higher chelating ability. In respect to the
effect of Mw, the 22-30 kDa samples were significantly higher in DPPH radical
scavenging activity, reducing ability, and hydroxyl radical scavenging activity,
whereas 4-5 kDa sample showed the highest chelating ability. For CS, all measured
antioxidant activities were increased with increased CS. DPPH radical scavenging
120
activity and chelating ability were significantly increased when CS was >8 mg/mL, while
reducing ability and hydroxyl radical scavenging activity was significantly increased
when CS was > 6 mg/mL (P<0.05).
Half maximal effective concentrations (EC50) are shown in Table 5.4 along with R2
values, the coordination between EC50 and CS. In DPPH measurement, EC50 was
consistently lower in 22-30 kDa samples in both α- and β-chitosan, but extremely higher
(46.09 mg/mL) in 280-300 kDa of α-chitosan. R2 of α-chitosan was relatively lower than
that of β-chitosan, demonstrated less dependence on CS. EC50 of reducing ability was less
than 5 mg/mL at tested Mw range in both α- and β-chitosan except 280-300 kDa of α-
chitosan, and R2 was relatively lower in 22-30 kDa samples in which EC50 was less than 2
mg/mL, exhibited higher reducing ability at Mw of 22-30 kDa regardless of CS. In
chelating ability, EC50 showed negative values in 280-300 kDa samples and 4-5 kDa
chitosan had lower EC50 which was consistent with ANOVA result. EC50 of hydroxyl
radical scavenging activity was relatively lower at tested Mw range in both α- and β-
chitosan except 4-5 kDa of α-chitosan. Hydroxyl radical scavenging activity and reducing
ability was more predominant than chelating ability in comparison of EC50 values, but
DPPH radical scavenging activity was more dependent on FC and Mw.
The potential DDA effect between the two forms of chitosan was studied at 12-15
kDa chitosan samples (Fig. 5.2). DPPH radical scavenging activity and reducing ability
were not significantly affected by DDA in low Mw chitosan. Hydroxyl radical
scavenging activity was increased significantly at higher DDA, whereas chelating ability
was decreased along with increased DDA. The 9% difference in DDA between α- and β-
121
chitosan samples showed no effect on DPPH radical scavenging activity and reducing
ability.
DISCUSSION
The key compounds contributing to the antioxidant activity in chitosan is oxygen
and hydrogen from hydroxyl groups, and nitrogen and hydrogen from positively
charged amino groups. Hydrogen or the lone pair of electrons can scavenge free
radicals, and the lone pair of electron in oxygen and nitrogen chelates metal ions,
forming chitosan-metal ion complex since those functional groups act as ligands. 14,
27-29 FC, Mw, and CS were considered as main factors affecting antioxidant activity
and the effect of DDA was studied in low Mw (12-15 kDa). Also, each antioxidant
property had shown different results depending on the measurements related to the
antioxidant mechanisms.
Solubility
Mw of chitosan was a significant factor affecting solubility. Kubota et al. (2000)
reported that intermolecular attraction force was lowered with decrease of Mw. 30
Similarly, lower Mw chitosan remained high T (%) over a wide pH range. 31 The
altered solubility between two different forms of chitosan can be related to their
different crystal structures, crystallinity, and crystal imperfection, as Cho et al. (2000)
reported that the solubility has a close relationship to polymeric structure. 32 However,
the exact reasons why different form of chitosan showed different solubility can be
more complicated since the solubility is highly related to Mw and DDA as well.
122
The Effect of Different Forms of Chitosan
Different polymeric structures between α and β-chitin might alter the antioxidant
activity of the two different forms (α and β) of chitosan. Lima et al. (2004) reported that
crystallinity index (CI) of α-chitin is higher than β-chitin. In the process of deacetylation,
CI of chitosan derived from α-chitin was slightly changed, whereas CI of chitosan from
β-chitin was significantly decreased. 33 Therefore, altered crystallinity of chitosan after
deacetylation between the two forms of chitosan might be one of the reasons why β-
chitosan had significantly higher reducing ability and hydroxyl radical scavenging
activity at high Mw. At Mw of 280-300 kDa, α-chitosan could have more rigid and stiff
structure due to the covalent bonds or interactive force (Van der waals) 1 with higher
crystallinity than β-chitosan, thus resulting in highest EC50 in DPPH radical scavenging
activity and reducing ability. The dissociation energy of O-H and N-H can be increased
along with higher crystallinity and Mw, thus α-chitosan can be more difficult to be
dissociated than β-chitosan. Also, β-chitosan could have more available functional groups
free from crystalline polymeric structure with hydrogen bonds at high Mw. Chelating
ability was not exhibited at 280-300 kDa chitosan, showing no EC50 detected.
The Effect of Mw
Increased DPPH radical scavenging activity and reducing ability in 22-30 kDa
samples may be due to the collapse of crystalline region by decrease in Mw, resulting in
increase of solubility and reactivity in solution. It was reported that depolymerization is
associated to decrease in CI. 15 With decrease of intermolecular interaction (Van der
123
Waals) and hydrogen bonds in low Mw, the lone pair of electrons or hydrogen
compounds from C-O and N-H may be more available. Feng et al. (2007) found that
low Mw chitosan has higher solubility due to the low van der Waals forces. 31
Similarly, Kim & Thomas (2007) reported the highest DPPH radical scavenging
activity in 30 kDa chitosan due to the increase in polymer mobility with lower Mw.
According to Chen et al. (2003), the number of amino groups in chitooligosaccharides
should be more than two for providing antioxidant activity in hydrolyzed chitosan. 34
Low Mw chitosan showed higher antioxidant activity than that of oligosaccharides in
this study, which might be related to the number of available amino groups.
Oligosaccharide chitosan might not provide enough amino groups to exert similar
antioxidant activity as lower Mw chitosan. Also, hydroxyl or amino groups could be
destroyed from further depolymerization from lower Mw samples. Therefore,
antioxidant activity was overall increased as Mw decreased, but should be higher than
about 20 kDa to provide enough amino groups existed in depolymerized chitosan.
Chelating ability was shown higher activity in lower Mw than other measurements.
Similarly, low Mw chitosan could easily form chitosan-Fe2 complexes and low Mw
polysaccharide radicals from more lone pairs of electrons. 23, 35 Significant interaction
effect between Mw and CS can be explained by different C* depending on Mw. C*
was increased with reduced Mw. As CS is higher than C* in 280-300 kDa samples,
chitosan polymer can be entangled in solutions, thus decreasing antioxidant activity
due to the less susceptibility from intermolecular interactions. CS had no relationship
with Mw in hydroxyl radical scavenging activity since R2 showing CS dependence
was relatively lower than other measurements.
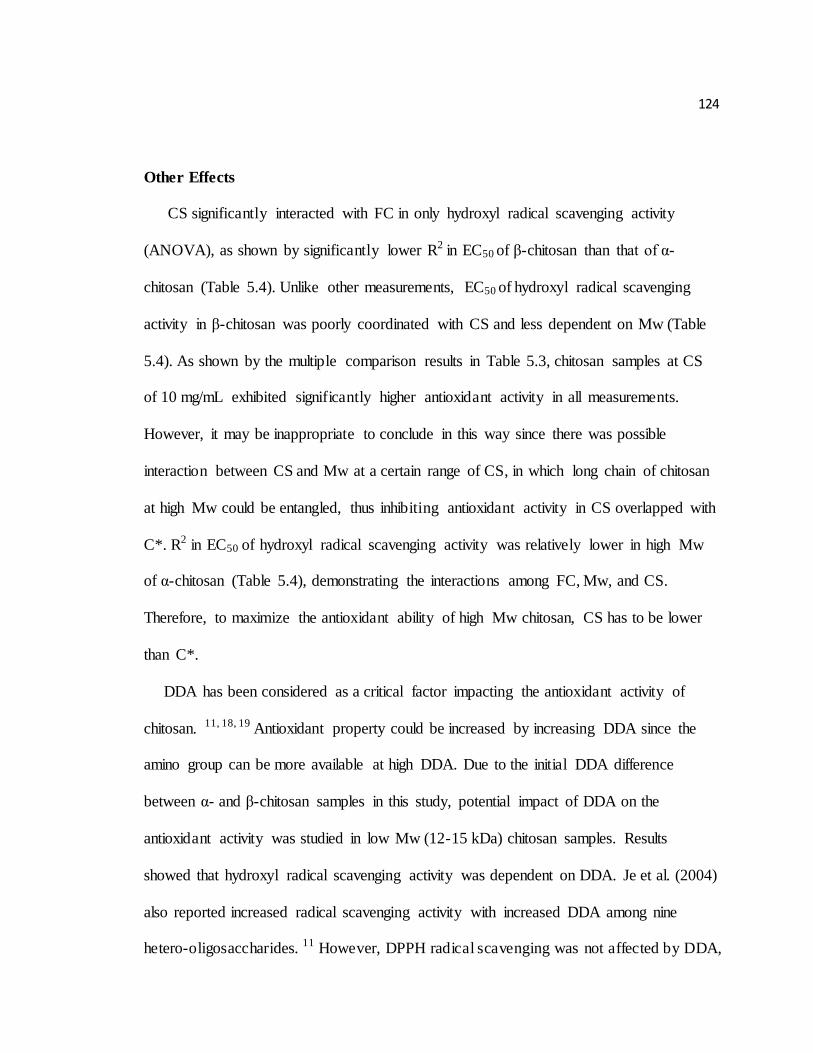
124
Other Effects
CS significantly interacted with FC in only hydroxyl radical scavenging activity
(ANOVA), as shown by significantly lower R2 in EC50 of β-chitosan than that of α-
chitosan (Table 5.4). Unlike other measurements, EC50 of hydroxyl radical scavenging
activity in β-chitosan was poorly coordinated with CS and less dependent on Mw (Table
5.4). As shown by the multiple comparison results in Table 5.3, chitosan samples at CS
of 10 mg/mL exhibited significantly higher antioxidant activity in all measurements.
However, it may be inappropriate to conclude in this way since there was possible
interaction between CS and Mw at a certain range of CS, in which long chain of chitosan
at high Mw could be entangled, thus inhibiting antioxidant activity in CS overlapped with
C*. R2 in EC50 of hydroxyl radical scavenging activity was relatively lower in high Mw
of α-chitosan (Table 5.4), demonstrating the interactions among FC, Mw, and CS.
Therefore, to maximize the antioxidant ability of high Mw chitosan, CS has to be lower
than C*.
DDA has been considered as a critical factor impacting the antioxidant activity of
chitosan. 11, 18, 19 Antioxidant property could be increased by increasing DDA since the
amino group can be more available at high DDA. Due to the initial DDA difference
between α- and β-chitosan samples in this study, potential impact of DDA on the
antioxidant activity was studied in low Mw (12-15 kDa) chitosan samples. Results
showed that hydroxyl radical scavenging activity was dependent on DDA. Je et al. (2004)
also reported increased radical scavenging activity with increased DDA among nine
hetero-oligosaccharides. 11 However, DPPH radical scavenging was not affected by DDA,
125
and it can be assumed that hydroxyl radical scavenging activity of chitosan is more
closely related to the amount of amino groups than DPPH radical scavenging. On the
other hand, chelating ability was decreased with increased DDA. Chitosan metal
interacting characteristics could be related to the distribution of acetyl groups as well as
DDA and Mw. 4 At reduced DDA, the distribution characteristics of acetyl groups could
become a significant factor impacting the metal chelating of chitosan. In the future
studies, the effect of DDA in high Mw of chitosan samples should be studied since DDA
may have different effect on antioxidant activity at high Mw with high crystallinity in
terms of polymeric structure. Related to this hypothesis, Trung et al. (2006) found that
the crystallinity of chitosan at high Mw (810 kDa) can be increased with increased DDA.
EC50 was relatively lower in reducing ability and hydroxyl radical scavenging
activity, meaning more predominant than DPPH radical scavenging activity and
chelating ability in the action of antioxidant activity of chitosan. Though overall EC50
of chelating ability was relatively higher than other measurements, EC50 of 4-5 kDa
chitosan was lower than DPPH radical scavenging activity, similarl to the result by
Feng et al. (2007) that the highest chelating ability was observed at the lowest Mw of
1.7 kDa among samples tested at Mw of 1.7 to 281 kDa. 31 This result indicated
antioxidant mechanisms can be exerted differently in chitosan depending on Mw.
CONCLUSION
This study demonstrated the higher reducing ability and hydroxyl radical
scavenging activity in β-chitosan than those in α-chitosan at high Mw. DPPH radical
scavenging activity, reducing ability, and hydroxyl radical scavenging activity were
126
higher in 22-30 kDa α- and β-chitosan samples, but chelating ability was the highest in 4-
5 kDa chitosan. There was no significant difference between α- and β-chitosan in DPPH
radical scavenging, but EC50 of β-chitosan was extremely lower than that of α-chitosan at
Mw of 280-300 kDa. Increasing CS generally enhanced the antioxidant activity, but has
to be interpreted by the interaction effect with Mw and FC. Mw of 280-300 kDa chitosan
samples at CS of 4-10 mg/mL can be entangled in solutions, thus lowering antioxidant
activities from intermolecular interactions. Increase of DDA enhanced hydroxyl radical
scavenging activity, but decreased chelating ability in low Mw (12-15 kDa) chitosan.
Hydroxyl radical scavenging activity might have a close relationship with the amount of
amino groups (DDA) than DPPH radical scavenging in low Mw based on DDA
dependence in hydroxyl radical scavenging activity. Reducing ability and hydroxyl
radical scavenging activity were more predominant as shown by the lower EC50 than
others. In the future study, the difference of the polymeric structures in the two forms of
chitosan prepared with a wide range of Mw and DDA should be investigated by using
FTIR or X-ray diffraction. Also, DDA effect on the antioxidant activity will be studied in
high Mw chitosan since DDA can affect crystallinity at high Mw.
127
REFERENCES
1. Kim, K. W.; Thomas, R. L., Antioxidative activity of chitosans with varying
molecular weights. Food Chemistry 2007, 101 (1), 308-313. 2. Xie, W.; Xu, P.; Liu, Q., Antioxidant activity of water-soluble chitosan
derivatives. Bioorganic & Medicinal Chemistry Letters 2001, 11 (13), 1699-1701.
3. Lin, S.B.; Chen, S.-H.; Peng, K.C., Preparation of antibacterial chito-oligosaccharide by altering the degree of deacetylation of β-chitosan in a
Trichoderma harzianum chitinase-hydrolysing process. Journal of the Science of Food and Agriculture 2009, 89 (2), 238-244.
4. Onsosyen, E.; Skaugrud, O., Metal recovery using chitosan. Journal of Chemical
Technology & Biotechnology 1990, 49 (4), 395-404. 5. Lamarque, G.; Cretenet, M.; Viton, C.; Domard, A., New route of deacetylation
of α- and β-chitins by means of freeze-pump out-thaw cycles. Biomacromolecules 2005, 6 (3), 1380-1388.
6. Dweltz, N. E., The structure of β-chitin. Biochimica et Biophysica Acta 1961, 51
(2), 283-294. 7. Minke, R.; Blackwell, J., The structure of α-chitin. Journal of Molecular Biology
1978, 120 (2), 167-181.
8. Abdou, E. S.; Nagy, K. S. A.; Elsabee, M. Z., Extraction and characterization of chitin and chitosan from local sources. Bioresource Technology 2008, 99 (5),
1359-1367. 9. Lima, I. S.; Airoldi, C., A thermodynamic investigation on chitosan-divalent
cation interactions. Thermochimica Acta 2004, 421 (1-2), 133-139.
10. Kurita, K.; Tomita, K.; Tada, T.; Ishii, S.; Nishimura, S.I.; Shimoda, K., Squid chitin as a potential alternative chitin source: Deacetylation behavior and
characteristic properties. Journal of Polymer Science Part A: Polymer Chemistry 1993, 31 (2), 485-491.
11. Je, J.Y.; Park, P.J.; Kim, S.K., Free radical scavenging properties of hetero-
chitooligosaccharides using an ESR spectroscopy. Food and Chemical Toxicology 2004, 42 (3), 381-387.
12. Sun, T.; Zhou, D.; Xie, J.; Mao, F., Preparation of chitosan oligomers and their antioxidant activity. European Food Research and Technology 2007, 225 (3), 451-456.
13. Tomida, H.; Fujii, T.; Furutani, N.; Michihara, A.; Yasufuku, T.; Akasaki, K.; Maruyama, T.; Otagiri, M.; Gebicki, J. M.; Anraku, M., Antioxidant properties of
some different molecular weight chitosans. Carbohydrate Research 2009, 344 (13), 1690-1696.
14. Chien, P.J.; Sheu, F.; Huang, W.T.; Su, M.S., Effect of molecular weight of
chitosans on their antioxidative activities in apple juice. Food Chemistry 2007, 102 (4), 1192-1198.
15. Vishu Kumar, A. B.; Varadaraj, M. C.; Lalitha, R. G.; Tharanathan, R. N., Low molecular weight chitosans: preparation with the aid of papain and
128
characterization. Biochimica et Biophysica Acta (BBA) - General Subjects 2004, 1670 (2), 137-146.
16. Ogawa, K., Effect of heating an aqueous suspension of chitosan on the crystallinity and polymorphs. Agricultural and biological chemistry 1991, 55 (9), 2375-2379.
17. Liu, H.; Bao, J.; Du, Y.; Zhou, X.; Kennedy, J. F., Effect of ultrasonic treatment on the biochemphysical properties of chitosan. Carbohydrate Polymers 2006, 64
(4), 553-559. 18. Je, J.-Y.; Kim, S.-K., Reactive oxygen species scavenging activity of
aminoderivatized chitosan with different degree of deacetylation. Bioorganic &
Medicinal Chemistry 2006, 14 (17), 5989-5994. 19. Yen, M.T.; Yang, J.H.; Mau, J.L., Antioxidant properties of chitosan from crab
shells. Carbohydrate Polymers 2008, 74 (4), 840-844. 20. Jung, J.; Zhao, Y., Characteristics of deacetylation and depolymerization of β-
chitin from jumbo squid (Dosidicus gigas) pens. Carbohydrate Research 2011,
346 (13), 1876-1884. 21. Qin, C.; Zhou, B.; Zeng, L.; Zhang, Z.; Liu, Y.; Du, Y.; Xiao, L., The
physicochemical properties and antitumor activity of cellulase-treated chitosan. Food Chemistry 2004, 84 (1), 107-115.
22. Mao, S.; Shuai, X.; Unger, F.; Simon, M.; Bi, D.; Kissel, T., The
depolymerization of chitosan: effects on physicochemical and biological properties. International Journal of Pharmaceutics 2004, 281 (1-2), 45-54.
23. Chen, D.; Hu, B.; Huang, C., Chitosan modified ordered mesoporous silica as micro-column packing materials for on-line flow injection- inductively coupled plasma optical emission spectrometry determination of trace heavy metals in
environmental water samples. Talanta 2009, 78 (2), 491-497. 24. Shimada, K.; Fujikawa, K.; Yahara, K.; Nakamura, T., Antioxidative properties of
xanthan on the autoxidation of soybean oil in cyclodextrin emulsion. Journal of Agricultural and Food Chemistry 1992, 40 (6), 945-948.
25. Dinis, T. C. P.; Madeira, V. M. C.; Almeida, L. M., Action of phenolic derivatives
(Acetaminophen, Salicylate, and 5-Aminosalicylate) as inhibitors of membrane lipid peroxidation and as peroxyl radical scavengers. Archives of Biochemistry
and Biophysics 1994, 315 (1), 161-169. 26. Aruoma, O. I.; Lester, P., [5] Deoxyribose assay for detecting hydroxyl radicals.
In Methods in Enzymology, Academic Press: 1994; 233, 57-66.
27. Peng, C.; Wang, Y.; Tang, Y., Synthesis of crosslinked chitosan-crown ethers and evaluation of these products as adsorbents for metal ions. Journal of Applied
Polymer Science 1998, 70 (3), 501-506. 28. Kamil, J. Y. V. A.; Jeon, Y.-J.; Shahidi, F., Antioxidative activity of chitosans of
different viscosity in cooked comminuted flesh of herring (Clupea harengus).
Food Chemistry 2002, 79 (1), 69-77. 29. Tual, C.; Espuche, E.; Escoubes, M.; Domard, A., Transport properties of
chitosan membranes: Influence of crosslinking. Journal of Polymer Science Part B: Polymer Physics 2000, 38 (11), 1521-1529.
129
30. Kubota, N.; Tatsumoto, N.; Sano, T.; Toya, K., A simple preparation of half N-acetylated chitosan highly soluble in water and aqueous organic solvents.
Carbohydrate Research 2000, 324 (4), 268-274. 31. Feng, T.; Du, Y.; Li, J.; Wei, Y.; Yao, P., Antioxidant activity of half-N-
acetylated water-soluble chitosan in vitro. European Food Research and
Technology 2007, 225 (1), 133-138. 32. Cho, Y.-W.; Jang, J.; Park, C. R.; Ko, S.-W., Preparation and Solubility in Acid
and Water of Partially Deacetylated Chitins. Biomacromolecules 2000, 1 (4), 609-614.
33. Kumirska, J.; Czerwicka, M.; Kaczynski, Z.; Bychowska, A.; Brzozowski, K.;
Thoming, J.; Stepnowski, P., Application of spectroscopic methods for structural analysis of chitin and chitosan. Marine Drugs 2010, 8 (5), 1567-1636.
34. Chen, A. S.; Taguchi, T.; Sakai, K.; Kikuchi, K.; Wang, M. W.; Miwa, I., Antioxidant activities of chtobiose and chitotriose. Biological and Pharmaceutical Bulletin 2003, 26 (9), 1326-1330.
35. Guzman, J.; Saucedo, I.; Revilla, J.; Navarro, R.; Guibal, E., Copper sorption by chitosan in the presence of citrate ions: influence of metal speciation on sorption
mechanism and uptake capacities. International Journal of Biological Macromolecules 2003, 33 (1-3), 57-65.
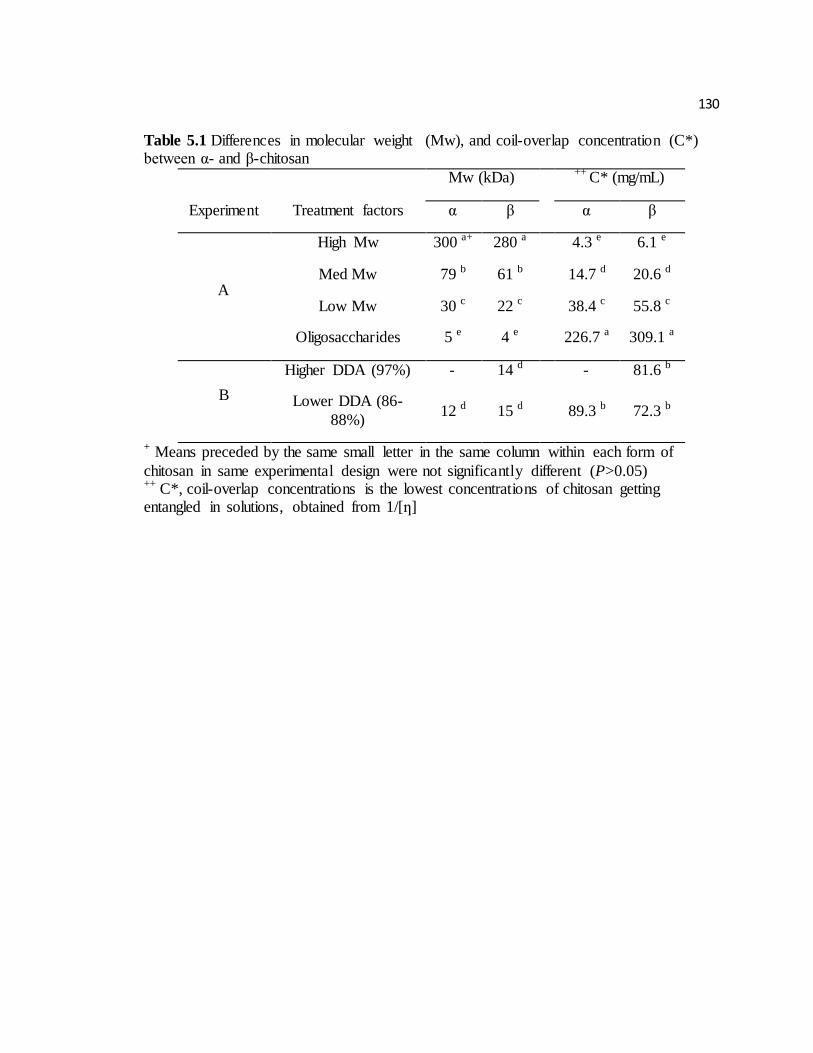
130
Table 5.1 Differences in molecular weight (Mw), and coil-overlap concentration (C*) between α- and β-chitosan
Mw (kDa) ++ C* (mg/mL)
Experiment Treatment factors α β α β
A
High Mw 300 a+ 280 a 4.3 e 6.1 e
Med Mw 79 b 61 b 14.7 d 20.6 d
Low Mw 30 c 22 c 38.4 c 55.8 c
Oligosaccharides 5 e 4 e 226.7 a 309.1 a
B
Higher DDA (97%) - 14 d - 81.6 b
Lower DDA (86-
88%) 12 d 15 d
89.3 b 72.3 b
+ Means preceded by the same small letter in the same column within each form of
chitosan in same experimental design were not significantly different (P>0.05) ++ C*, coil-overlap concentrations is the lowest concentrations of chitosan getting entangled in solutions, obtained from 1/[ƞ]
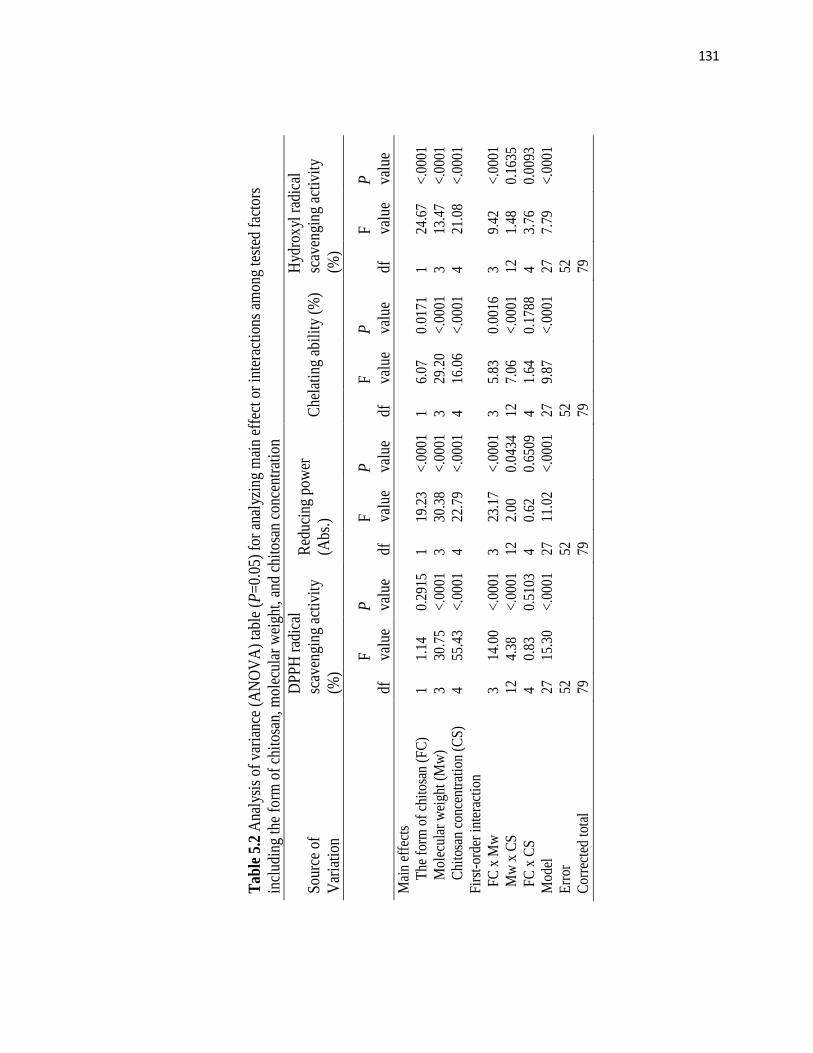
131
Tab
le 5
.2 A
naly
sis
of v
aria
nce
(AN
OV
A)
tabl
e (P
=0.
05)
for
anal
yzin
g m
ain
effe
ct o
r in
tera
ctio
ns a
mon
g te
sted
fac
tors
incl
udin
g th
e fo
rm o
f ch
itos
an, m
olec
ular
wei
ght,
and
chi
tosa
n co
ncen
trat
ion
Sou
rce
of
Var
iati
on
DP
PH
rad
ical
scav
engi
ng a
ctiv
ity
(%)
Red
ucin
g po
wer
(Abs
.)
Che
lati
ng a
bili
ty (
%)
Hyd
roxy
l ra
dica
l
scav
engi
ng a
ctiv
ity
(%)
df
F
valu
e
P
valu
e df
F
valu
e
P
valu
e df
F
valu
e
P
valu
e df
F
valu
e
P
valu
e M
ain
effe
cts
The
for
m o
f ch
itos
an (
FC
)
1 1.
14
0.29
15
1 19
.23
<.0
001
1 6.
07
0.01
71
1 24
.67
<.0
001
Mol
ecul
ar w
eigh
t (M
w)
3 30
.75
<.0
001
3 30
.38
<.0
001
3 29
.20
<.0
001
3 13
.47
<.0
001
Chi
tosa
n co
ncen
trat
ion
(CS
) 4
55.4
3 <
.000
1 4
22.7
9 <
.000
1 4
16.0
6 <
.000
1 4
21.0
8 <
.000
1
Fir
st-o
rder
inte
ract
ion
FC
x M
w
3 14
.00
<.0
001
3 23
.17
<.0
001
3 5.
83
0.00
16
3 9.
42
<.0
001
Mw
x C
S
12
4.38
<
.000
1 12
2.
00
0.04
34
12
7.06
<
.000
1 12
1.
48
0.16
35
FC
x C
S
4 0.
83
0.51
03
4 0.
62
0.65
09
4 1.
64
0.17
88
4 3.
76
0.00
93
Mod
el
27
15.3
0 <
.000
1 27
11
.02
<.0
001
27
9.87
<
.000
1 27
7.
79
<.0
001
Err
or
52
52
52
52
Cor
rect
ed t
otal
79
79
79
79
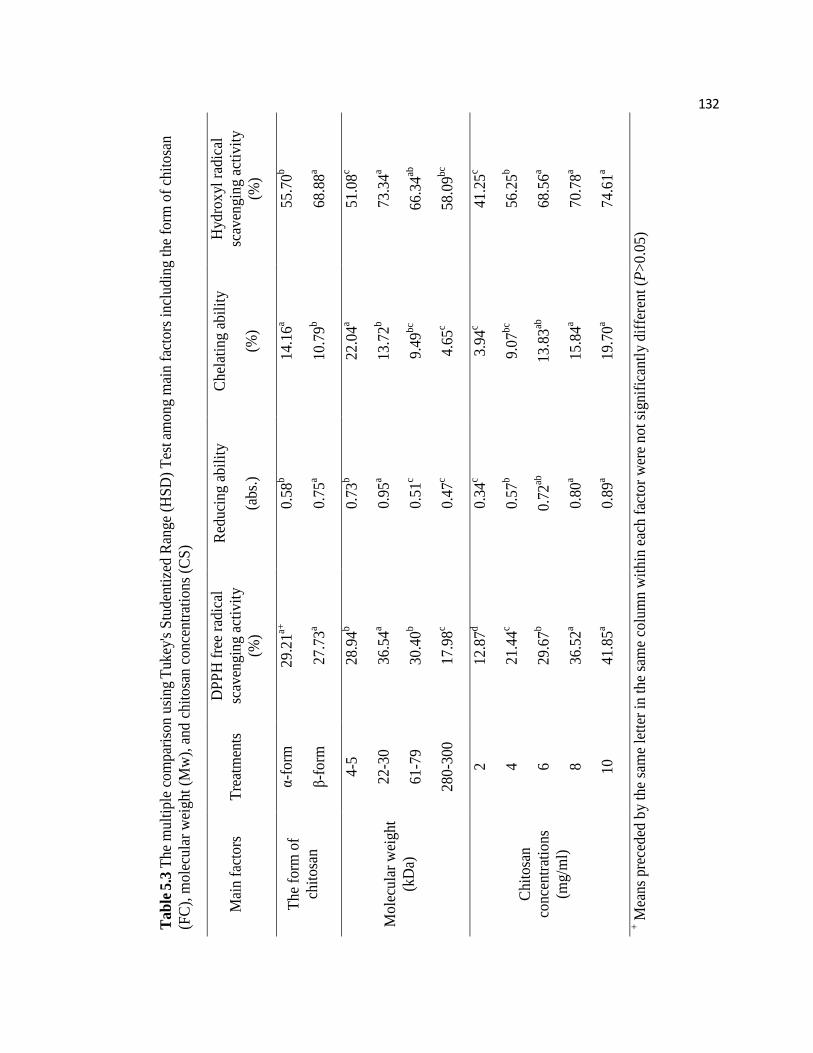
132
Ta
ble
5.3
Th
e m
ult
iple
co
mp
aris
on
usi
ng
Tu
key
's S
tud
enti
zed
Ran
ge
(HS
D)
Tes
t am
on
g m
ain
fac
tors
in
clu
din
g t
he
form
of
chit
osa
n
(FC
), m
ole
cula
r w
eigh
t (M
w),
an
d c
hit
osa
n c
on
cen
trat
ion
s (C
S)
Mai
n f
acto
rs
Tre
atm
ents
DP
PH
fre
e ra
dic
al
scav
engin
g a
ctiv
ity
(%)
Red
uci
ng a
bil
ity
(ab
s.)
Ch
elat
ing a
bil
ity
(%)
Hyd
rox
yl r
adic
al
scav
engin
g a
ctiv
ity
(%)
Th
e fo
rm o
f
chit
osa
n
α-f
orm
2
9.2
1a+
0
.58
b
14
.16
a 5
5.7
0b
β-f
orm
2
7.7
3a
0.7
5a
10
.79
b
68
.88
a
Mo
lecu
lar
wei
gh
t
(kD
a)
4-5
2
8.9
4b
0.7
3b
22
.04
a 5
1.0
8c
22
-30
3
6.5
4a
0.9
5a
13
.72
b
73
.34
a
61
-79
3
0.4
0b
0.5
1c
9.4
9b
c 6
6.3
4ab
28
0-3
00
1
7.9
8c
0.4
7c
4.6
5c
58
.09
bc
Ch
ito
san
con
cen
trat
ion
s
(mg/m
l)
2
12
.87
d
0.3
4c
3.9
4c
41
.25
c
4
21
.44
c 0
.57
b
9.0
7b
c 5
6.2
5b
6
29
.67
b
0.7
2ab
1
3.8
3ab
6
8.5
6a
8
36
.52
a 0
.80
a 1
5.8
4a
70
.78
a
10
4
1.8
5a
0.8
9a
19
.70
a 7
4.6
1a
+ M
ean
s p
rece
ded
by
the
sam
e le
tter
in
th
e sa
me
colu
mn
wit
hin
eac
h f
acto
r w
ere
no
t si
gn
ific
antl
y d
iffe
ren
t (P
>0
.05
)
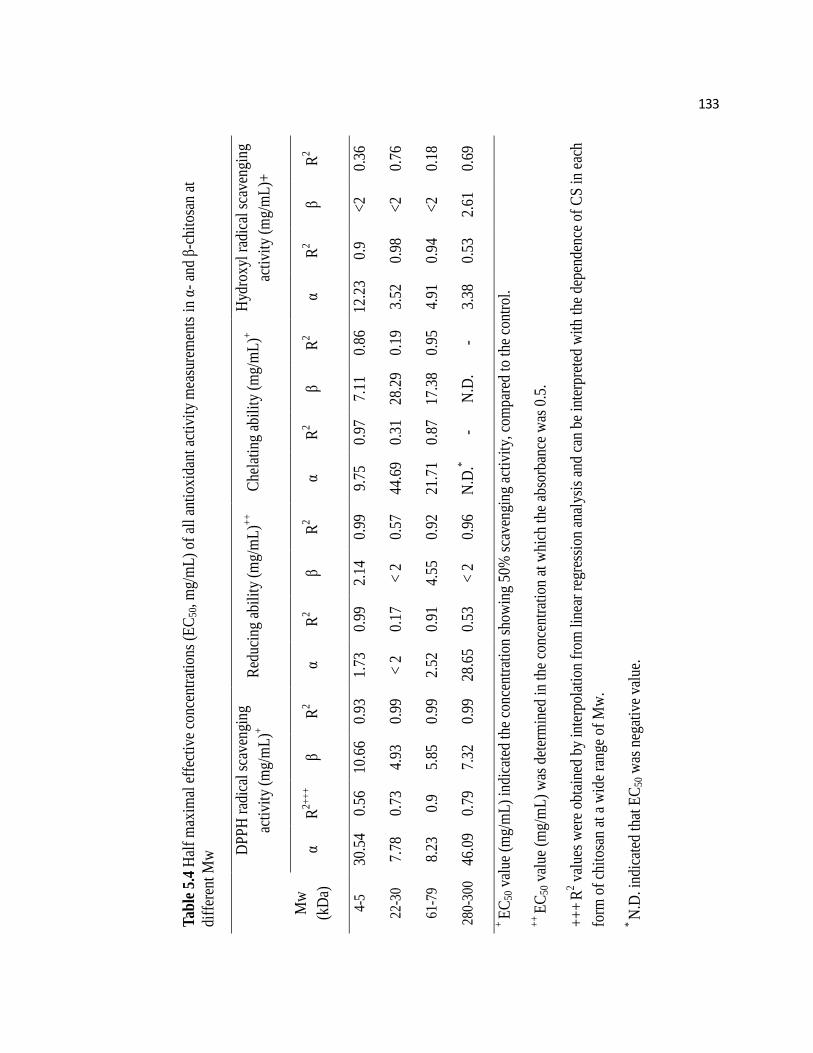
133
Tab
le 5
.4 H
alf
max
imal
eff
ecti
ve c
once
ntra
tion
s (E
C50
, mg/
mL
) of
all
ant
ioxi
dant
act
ivit
y m
easu
rem
ents
in
α- a
nd β
-chi
tosa
n at
diff
eren
t M
w
DP
PH
rad
ical
sca
veng
ing
acti
vity
(m
g/m
L)+
R
educ
ing
abil
ity
(mg/
mL
)++
Che
lati
ng a
bili
ty (
mg/
mL
)+
Hyd
roxy
l ra
dica
l sc
aven
ging
acti
vity
(m
g/m
L)+
Mw
(kD
a)
α R
2++
+
β R
2 α
R2
β R
2 α
R
2 β
R2
α R
2 β
R2
4-5
30.5
4 0.
56
10.6
6 0.
93
1.73
0.
99
2.14
0.
99
9.75
0.
97
7.11
0.
86
12.2
3 0.
9 <
2 0.
36
22-3
0 7.
78
0.73
4.
93
0.99
<
2
0.17
<
2
0.57
44
.69
0.31
28
.29
0.19
3.
52
0.98
<
2 0.
76
61-7
9 8.
23
0.9
5.85
0.
99
2.52
0.
91
4.55
0.
92
21.7
1 0.
87
17.3
8 0.
95
4.91
0.
94
<2
0.18
280-
300
46.0
9 0.
79
7.32
0.
99
28.6
5 0.
53
< 2
0.
96
N.D
.* -
N.D
. -
3.38
0.
53
2.61
0.
69
+ E
C50
val
ue (
mg/
mL
) in
dica
ted
the
conc
entr
atio
n sh
owin
g 50
% s
cave
ngin
g ac
tivi
ty, c
ompa
red
to t
he c
ontr
ol.
++
EC
50 v
alue
(m
g/m
L)
was
det
erm
ined
in
the
conc
entr
atio
n at
whi
ch t
he a
bsor
banc
e w
as 0
.5.
++
+ R
2 val
ues
wer
e ob
tain
ed b
y in
terp
olat
ion
from
lin
ear
regr
essi
on a
naly
sis
and
can
be i
nter
pret
ed w
ith
the
depe
nden
ce o
f C
S i
n ea
ch
form
of
chit
osan
at
a w
ide
rang
e of
Mw
.
* N
.D. i
ndic
ated
tha
t E
C50
was
neg
ativ
e va
lue.
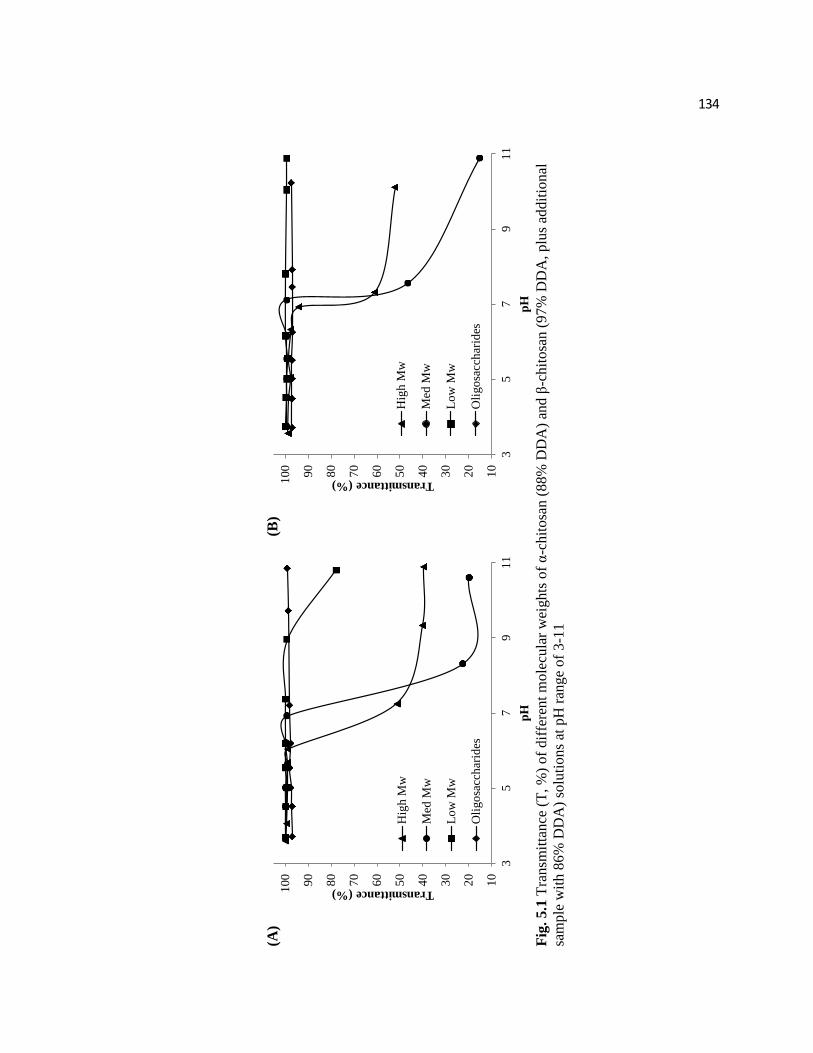
134
(A)
(B)
F
ig.
5.1
Tra
nsm
itta
nce
(T
, %
) o
f d
iffe
ren
t m
ole
cula
r w
eigh
ts o
f α
-ch
ito
san
(8
8%
DD
A)
and
β-c
hit
osa
n (
97
% D
DA
, p
lus
add
itio
nal
sam
ple
wit
h 8
6%
DD
A)
solu
tio
ns
at p
H r
ang
e o
f 3
-11
10
20
30
40
50
60
70
80
90
100
35
79
11
Transmittance (%)
pH
Hig
h M
w
Med
Mw
Lo
w M
w
Oli
go
sacc
har
ides
10
20
30
40
50
60
70
80
90
100
35
79
11
Transmittance (%)
pH
Hig
h M
w
Med
Mw
Lo
w M
w
Oli
go
sacc
har
ides
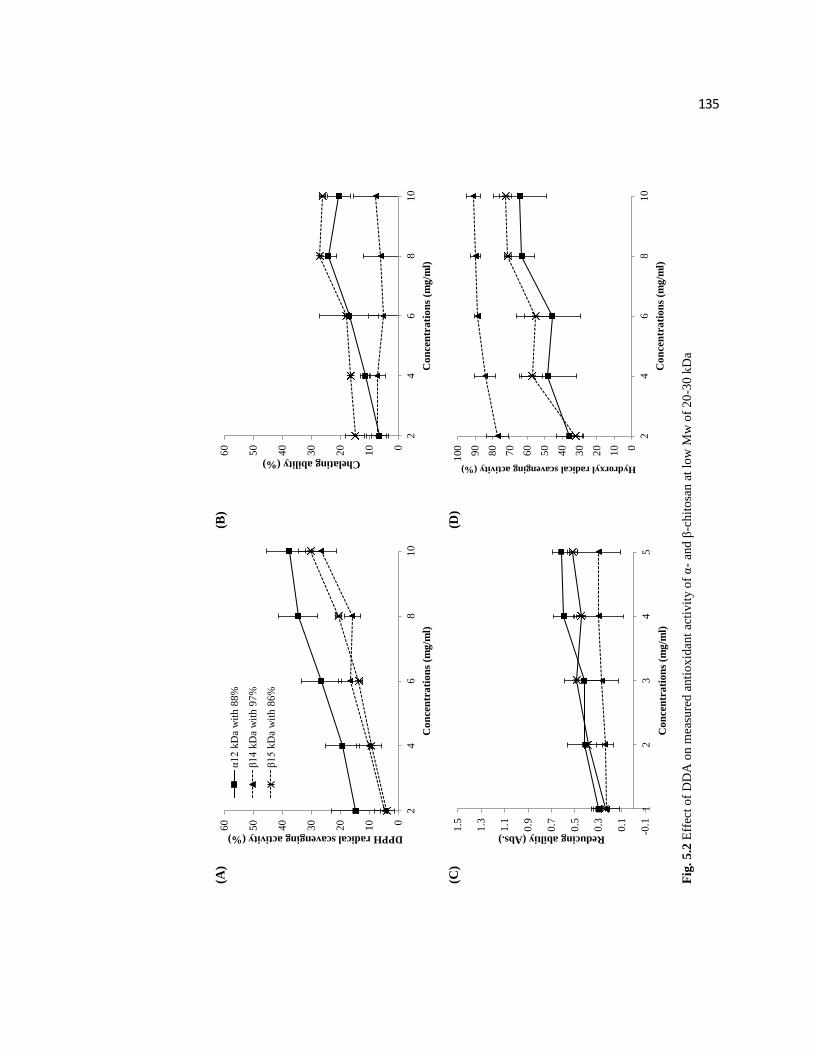
135
(A)
(B)
(C
)
(D)
F
ig.
5.2
Eff
ect
of
DD
A o
n m
easu
red a
nti
ox
idan
t ac
tivit
y o
f α
- an
d β
-chit
osa
n a
t lo
w M
w o
f 20
-30 k
Da
0
10
20
30
40
50
60
24
68
10
DPPH radical scavenging activity (%)
Co
nce
ntr
ati
on
s (m
g/m
l)
α1
2 k
Da
wit
h 8
8%
β1
4 k
Da
wit
h 9
7%
β1
5 k
Da
wit
h 8
6%
0
10
20
30
40
50
60
24
68
10
Chelating ability (%)
Co
nce
ntr
ati
on
s (m
g/m
l)
-0.1
0.1
0.3
0.5
0.7
0.9
1.1
1.3
1.5
12
34
5
Reducing abiltiy (Abs.)
Co
nce
ntr
ati
on
s (m
g/m
l)
0
10
20
30
40
50
60
70
80
90
100
24
68
10
Hydrorxyl radical scavenging activity (%)
Co
nce
ntr
ati
on
s (m
g/m
l)
136
CHAPTER 6
IMPACT OF THE STRUCTURAL DIFFERENCES BETWEEN α- AND β-CHITOSAN
ON THEIR DEPOLYMERIZING REACTION AND ANTIBACTERIAL ACTIVITY
Jung, J., Zhao, Y. Submitted to Journal of Agricultural and Food Chemistry
137
ABSTRACT
The polymeric structure characteristics of β-chitosan from jumbo squid (Dosidicus gigas)
pens and α-chitosan from shrimp shells during deploymerization by cellulase hydrolysis
at different degrees of deacetylation (DDA) (60, 75 and 90%) were investigated by using
Fourier Transform Infrared spectroscopy and X-ray Diffraction. Antibacterial activity of
β-chitosan against E. coli and L. innocua was compared with that of α-chitosan at similar
Mw and DDA by studying inhibition ratio and minimal inhibition concentration (MIC)
and was coordinated with the structural characteristics of the two forms of chitosan. β-
chitosan is more affirmative to cellulase hydrolysis than α-chitosan due to its relatively
lower crystallinity (CI) and loose crystal property, and the 75% DDA chitosan was more
susceptible to cellulase than the 90% DDA ones with the 75% DDA of β-chitosan mostly
reactive. Both forms of chitosan showed more inhibition against E. coli than against L.
innocua, no difference against L. innocua between the two forms of chitosan was
observed, but the two forms of chitosan exhibited different antibacterial activity against E.
coli, in which 75% DDA/31 kDa β-chitosan showed significantly higher inhibition
(lower MIC) than that of 75% DDA/31 kDa α-chitosan, whereas 90% DDA/74-76 kDa α-
chitosan had higher inhibition ratio than that of 90% DDA/74-76 kDa of β-chitosan. This
result may be explained by the impact of the different structural properties between α-
and β-chitosan on chitosan conformations in the solution. This study provided new
information about the biological activities of β-chitosan, a bioactive compound with
unique functionalities and great potential for food and other applications.
138
Keywords: α- and β-chitosan, jumbo squid pens, depolymerization, antibacterial activity,
structural properties
139
INTRODUCTION
Antibacterial activity of β-chitosan might be different from that of α-chitosan due
to several reasons. First, they are obtained from different marine sources, in which β-
chitin is mainly obtained from squid pens, while α-chitin is mostly extracted from
shrimp or crab shells 1, 2. Several studies have demonstrated that the functional
properties of chitin or chitosan depend on the originated marine sources and species 3-
6. Secondly, different intra- and inter-molecular structures of α- and β-chitosan
influences the conformations of the chitosan solutions, thus altering their antibacterial
mechanisms, such as the interactions between the protonated amino groups (NH3+) of
chitosan solubilized in acids and the negatively charged bacterial cell membranes 7.
Since the surface phenomenon between chitosan and bacterial cells plays critical role
in the antibacterial action of chitosan, the chitosan conformation in the solution needs
to be flexible to increase the contact with bacterial cells in the suspension along with
enhanced electrostatic interaction. However, polymorphic chitosan with strong intra-
or inter-molecular hydrogen bonds can induce the rigid conformation with lower
flexibility in the soluble status. Based on the previous findings, the structural
properties of β-chitosan were different from those of α-chitosan after the
deacetylation process as β-chitin exhibits higher solubility, reactivity, and swelling
ability toward solvents, led to more structural modifications of β-chitin than that of α-
chitin after alkali treatments 3, 6, 8-10. Hence, the different intra- or inter-molecular
behaviors between α- and β-chitosan could alter the chitosan conformations in the
solution, which in turn impacts their antibacterial activity. Moreover, the degree of
deacetylation (DDA) and molecular weight (Mw) of chitosan strongly impact its

140
structural properties as well. Kumar et al. (2004) reported the reduced crystallinity index
(CI) in lower Mw of α-chitosan 11, whereas opposite result was observed by Ogawa et al.
(1991) 12. Liu et al. (2006) also found increased CI in low Mw and high DDA of α-
chitosan 13.
So far, the antibacterial studies on chitosan have been focused on readily accessible
α-chitosan extracted from crustacean shells 14-17, but little was reported on β-chitosan
from squid pens 18, 19. No previous study has compared the antibacterial activity between
α- and β-chitosan based on their polymeric structural differences. In addition, it is unclear
how α- and β-chitosan respond differently to the enzymatic depolymerization in
association with their polymorphic structures.
Our previous studies have demonstrated that β-chitin obtained from jumbo squid
(Dosidicus gigas) pens, a newly employed source of β-chitin, has unique deacetylation
and depolymerization characteristics along with significantly different antioxidant
activity from α-chitosan 20, 21. Therefore, the objectives of this study were to investigate
the depolymerizing reaction of β-chitosan prepared with ~60%, 75%, and 90% DDA in
comparison with α-chitosan, and to compare the antibacterial activity against L. innocua
(Gram-positive) and E. coli (Gram-negative) between the two forms of chitosan at a wide
range of DDA and Mw in association with their structure properties. Inhibition ratio
(IR, %) and minimum inhibitory concentrations (MIC, %) of chitosan, as well as the
hydrophilicity and power of negative charge of each bacterium, were studied to represent
and interpret the antibacterial activity of chitosan. Meanwhile, the polymorphic
characteristics of both forms of chitosan at different DDA and Mw were investigated by
using the Fourier-transform infrared (FT-IR) spectroscopy and X-ray diffraction (XRD).
141
MATERIALS AND METHODS
Chitosan Preparation
Dried jumbo squid (Dosidicus gigas) pens were provided by Dosidicus LLC
(USA), and α-chitin from shrimp shells was purchased from Sigma-Aldrich (USA).
After grinding into about 18 meshes (Glenmills Inc., USA), squid pens were
deproteinized by treating in 5% NaOH for 3 d at room temperature, washed with
distilled water, and then dried at 40 °C oven (Precision Scientific Inc., USA) for 24 h.
For preparing chitosan with different DDAs (~60, 75, and 90%), chitin was
deacetylated by using the following conditions as described in our previous study:
NaOH concentrations (40 or 50%), temperatures (60 or 90 ºC), and reaction times (2,
4, or 6 h) 20.
Depolymerization of Chitosan
α-chitosan at ~75% DDA/2175 kDa and ~90% DDA/1773 kDa, and β-chitosan at
~60% DDA (Mw was undetectable), ~75% DDA/4610 kDa, and ~90% DDA/3182
kDa were depolymerized by using cellulase to investigate their depolymerizing
reactions 20. Briefly, chitosan solutions were prepared at a ratio of 1:100 (chitosan: 2%
acetic acid), and adjusted to pH 5 by 10% NaOH. Cellulase was added at the same
weight of chitosan in the solutions and reacted for 1-4 h. The hydrolyzates were
boiled for 10 min to inactivate enzyme and centrifuged at 8,000 g for 30 min to
remove denatured enzyme. A 10% NaOH was added into the solution until about pH
9 for precipitation. Precipitated samples were washed with distilled water and dried at
40 ºC oven for 24 h. The Mw of depolymerized β-chitosan were analyzed and
142
compared with that of α-chitosan at similar DDA of ~60, 75, and 90%. Since it’s
impossible to get exact same Mw between the two forms of chitosan at same DDA, they
were classified as High, Med, and Low. Specifically, High/Med/Low Mw were
133/45/31 kDa in 75% DDA α-chitosan, 111/74/27 kDa in 90% DDA α-chitosan,
72/31/20 kDa in 75% DDA β-chitosan, and 76/40/17 kDa 90% DDA β-chitosan.
Viscosity-average Mw and DDA
The viscosity-average Mw of α- and β-chitosan was determined by using the
Ubbelohde Dilution Viscometer (Cannon instrument Co., USA) with a capillary size of
0.58 nm. Approximate 100 mg of chitosan was dissolved in 10 mL of the mixture
solution of 0.1M CH3COOH and 0.2M NaCl 20. The intrinsic viscosity was measured by
the intercept between the Huggins (reduced viscosity) and Kraemer (relative viscosity)
plots when the concentration was 0 22. The viscosity-average Mw of chitosan was
calculated by using Mark-Houwink-Sakurada (MHS) equation (1) 23:
[Ƞ] = K (MW) a (1)
where K and a were constants, K=1.81 x 10⁻³ and a = 0.93; and [Ƞ] was the intrinsic
viscosity. DDA was determined by the colloidal titration method 24.
Antibacterial Activity
Cultures of Escherichia coli ATCC 25922 and Listeria innocua ATCC 51742
(American Type Culture Collection) were stored in appropriate solid media (E. coli on
tryptic soy agar (TSA) (Becton, Dickinson and Co., USA) and L. innocua on brain heart
infusion (BHA) agar (Becton, Dickinson and Co., USA)) under refrigeration (4 °C)
143
during the course of the study. Prior to a given microbiological assay, a single typical
colony of each bacterium was inoculated in appropriate broth (E. coli in tryptic soy
broth (TSB) (EMD Chemicals, Inc., USA) and L. innocua in brain heart infusion
(BHI) broth (Becton, Dickenson and Co., USA)) and enriched at 37 °C for 24 h.
For determining the minimum inhibitory concentration (MIC, %) of chitosan, 1%
chitosan solubilized in 1% of acetic acid solution or 1% acetic acid solution alone was
used to produce a series of serially diluted tubes ranging from 0.5% to 0.02%. The
aliquot (0.5 mL) of enriched E. coli and L. innocua was inoculated into prepared test
tubes under the aseptic condition. After incubating for 24 h at 37 °C, the optical
density (OD) of each test tube was determined at 620 nm using the spectrophotometer
(Shimadzu, Japan). MIC was the lowest concentration among the tested ranges of
concentrations, in where OD of the cultured tubes treated by chitosan solution
(treatment) was lower than the OD of the cultured tubes treated by acetic acid alone
(control) 25. Inhibition ratio (IR, %) was further investigated to compare the relative
antibacterial activity of different chitosan samples. IR was calculated as Eq. (2):
( )
(2)
Hydrophillicity of Bacterial Cell
Hydrophilicity of the bacteria was determined by adding each bacterium into the
mixture of n-hexane (hydrophobic) and water (hydrophilic) prepared with different
144
ratios of n-hexane and water (v/v, 0:5, 1:4, 2:3, 3:2, and 4:1), and then measuring the OD
of cell suspension in water phase. Enriched bacteria (~1 x 10⁶ CFU/mL for E. coli and ~1
x 105 CFU/mL for L. innocua) were prepared after incubation for 1 d. A 5 mL of cell
suspension was added into 5 mL of the two-phase mixture of n-hexane and water at
different ratios. The mixtures were stirred for 3 min and allowed to settle for 5 min. OD
of the lower part (water phase) was determined at 600 nm using UV spectrophotometer
(Shimadzu, Japan). Hydrophillicity (%) of each bacterium was calculated as Eq. (3) 26:
( )
(3)
Power of Negative Charge in Bacterial Cell Wall
The power of negative charge was determined by using anion exchange resin, Dowex
1x8 26. Dowex 1x8 was washed five times with distilled water and balanced with 0.1 M
HCl in the test tube for 6 h. After adding 5 mL of enriched bacteria (~1x10⁶ for E. coli
and ~1x10⁵ for L. innocua) in Dowex 1x8, the OD of the water phase was determined at
660 nm using UV spectrophotometer (Shimadzu, Japan). The control was OD of enriched
bacteria without Dowex 1x8 treatment. Relative cell density (RCD) was calculated as Eq.
(4):
( )
(4)
The power of the negative charge for each bacterium was defined as subtracted RCD (%)
from 100%.
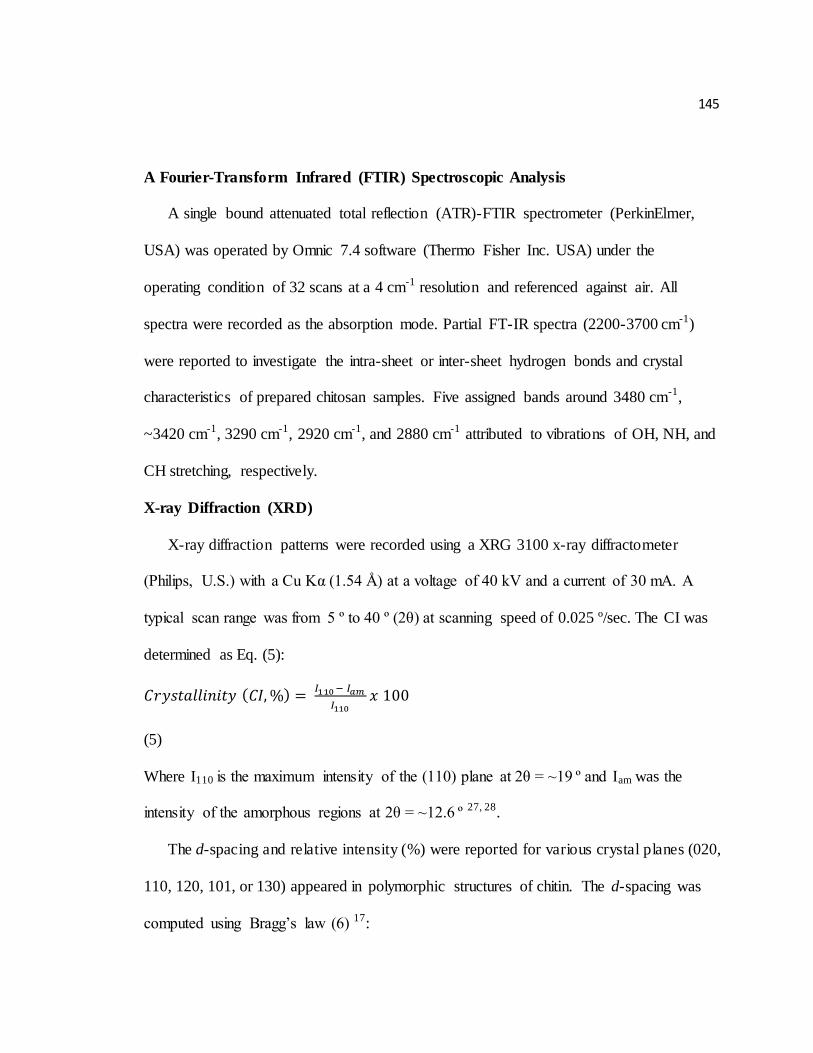
145
A Fourier-Transform Infrared (FTIR) Spectroscopic Analysis
A single bound attenuated total reflection (ATR)-FTIR spectrometer (PerkinElmer,
USA) was operated by Omnic 7.4 software (Thermo Fisher Inc. USA) under the
operating condition of 32 scans at a 4 cm-1 resolution and referenced against air. All
spectra were recorded as the absorption mode. Partial FT-IR spectra (2200-3700 cm-1)
were reported to investigate the intra-sheet or inter-sheet hydrogen bonds and crystal
characteristics of prepared chitosan samples. Five assigned bands around 3480 cm-1,
~3420 cm-1, 3290 cm-1, 2920 cm-1, and 2880 cm-1 attributed to vibrations of OH, NH, and
CH stretching, respectively.
X-ray Diffraction (XRD)
X-ray diffraction patterns were recorded using a XRG 3100 x-ray diffractometer
(Philips, U.S.) with a Cu Kα (1.54 Å) at a voltage of 40 kV and a current of 30 mA. A
typical scan range was from 5 º to 40 º (2θ) at scanning speed of 0.025 º/sec. The CI was
determined as Eq. (5):
( )
(5)
Where I110 is the maximum intensity of the (110) plane at 2θ = ~19 º and Iam was the
intensity of the amorphous regions at 2θ = ~12.6 º 27, 28.
The d-spacing and relative intensity (%) were reported for various crystal planes (020,
110, 120, 101, or 130) appeared in polymorphic structures of chitin. The d-spacing was
computed using Bragg’s law (6) 17:
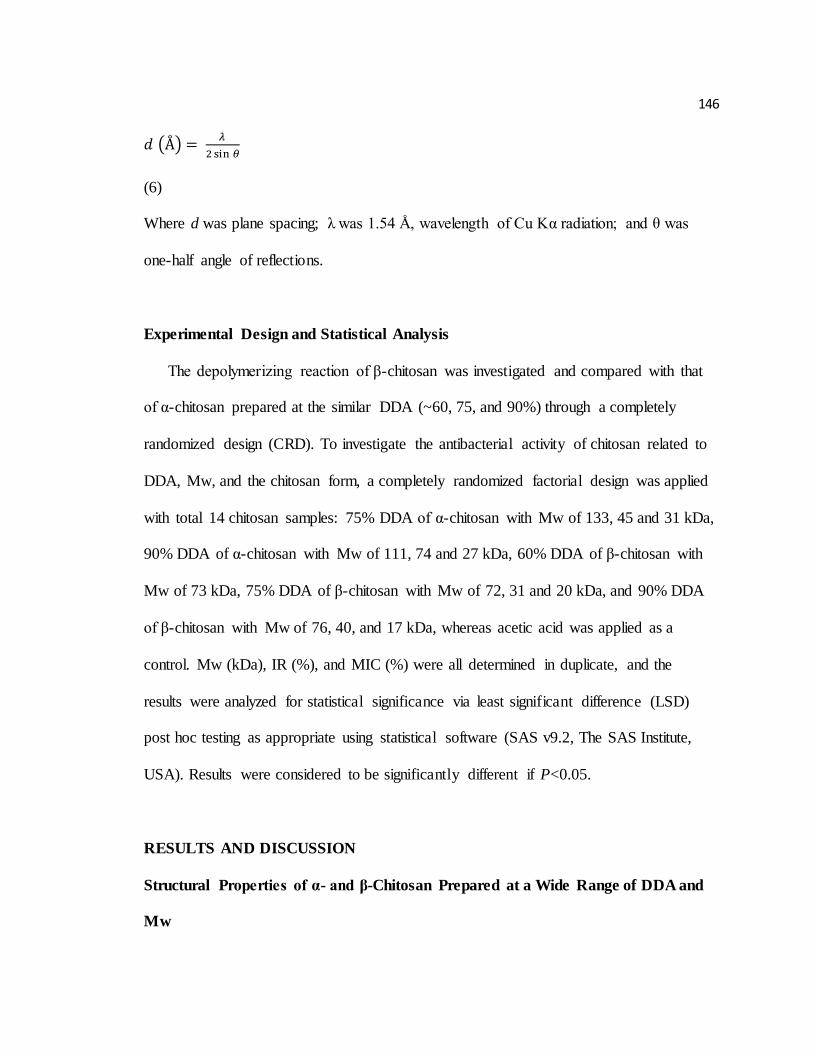
146
( )
(6)
Where d was plane spacing; λ was 1.54 Å, wavelength of Cu Kα radiation; and θ was
one-half angle of reflections.
Experimental Design and Statistical Analysis
The depolymerizing reaction of β-chitosan was investigated and compared with that
of α-chitosan prepared at the similar DDA (~60, 75, and 90%) through a completely
randomized design (CRD). To investigate the antibacterial activity of chitosan related to
DDA, Mw, and the chitosan form, a completely randomized factorial design was applied
with total 14 chitosan samples: 75% DDA of α-chitosan with Mw of 133, 45 and 31 kDa,
90% DDA of α-chitosan with Mw of 111, 74 and 27 kDa, 60% DDA of β-chitosan with
Mw of 73 kDa, 75% DDA of β-chitosan with Mw of 72, 31 and 20 kDa, and 90% DDA
of β-chitosan with Mw of 76, 40, and 17 kDa, whereas acetic acid was applied as a
control. Mw (kDa), IR (%), and MIC (%) were all determined in duplicate, and the
results were analyzed for statistical significance via least significant difference (LSD)
post hoc testing as appropriate using statistical software (SAS v9.2, The SAS Institute,
USA). Results were considered to be significantly different if P<0.05.
RESULTS AND DISCUSSION
Structural Properties of α- and β-Chitosan Prepared at a Wide Range of DDA and
Mw
147
Figs. 6.1 and 6.2 present partial FT-IR spectra (2200-3700 cm-1) that illustrate the
intra- or inter-molecular hydrogen bonds and CH stretching in α- and β-chitosan at a
wide range of DDA and Mw, respectively. The spectrum region between 3000 and
3600 cm-1 attributed to the vibration of either OH or NH, indicating the hydrogen
bonds appeared in C(6)OH···O=C, C(3)OH···O, C(6)OH···OHC(3), C(2)NH···O=C,
and C(6)HO···HNC(2). The corresponding region between 2800 and 2900 cm-1
attributed to the vibration of CH stretching, assuming the free hydroxymethyl
(CH2OH) groups dissociated from hydrogen bonds. These structural properties of
chitosan in the solid status can be associated with the antibacterial mechanisms of
chitosan as they could impact chitosan conformations in the soluble status.
Additionally, d-spacing and the relative intensities (%) of each crystal plane are
presented to interpret the crystal properties of polymorphic chitosan (Table 6.2).
In 75% DDA of α-chitosan, the peak intensities of OH and NH2 strengthened as
Mw decreased, indicating that OH and NH2 were more readily to form hydrogen
bonds in lower Mw (≤ 31 kDa). The peak intensity of CH stretching was the highest
in 45 kDa chitosan, and decreased in other Mw samples (Fig. 6.1A), assuming that
the hydrogen bonds might be weaker in 75% DDA/45 kDa α-chitosan. Crystallites of
(120), (101), and (130) planes appeared as Mw decreased (≤ 31 kDa) along with
increasing CI (Table 6.2). In 90% DDA of α-chitosan, no NH bands distinguished and
the OH bands had no significant difference among 20-111 kDa chitosan (Fig. 6.1B).
However, the peak intensities of CH stretching in higher Mw (74 and 111 kDa) were
relatively intense than those in lower Mw (27 kDa) (Fig. 6.1B). Crystallites of (120)
planes were observed in lower Mw (≤ 27 kDa) and CI increased as Mw decreased
148
(Table 6.2). Hence, the hydrogen bonds in 90% DDA/74 and 111 kDa α-chitosan were
weaker than those in 27 kDa sample.
For 60% and 75% DDA of β-chitosan, the peak of OH bands were more intense in 60%
DDA/73 kDa and 75% DDA/72 kDa β-chitosan than in 75% DDA/20 and 31 kDa β-
chitosan, whereas no significant difference in CH stretching bands was observed among
samples with different DDA or Mw (Fig. 6.2A). Similar to 75% or 90% DDA of α-
chitosan, crystallites of (020), (120), and (101) planes were formed and CI was relatively
higher in lower DDA and Mw samples (Table 6.2). Hence, the hydrogen bonds
associated with OH could be weaker in 75% DDA/20-31 kDa of β-chitosan. In 90% DDA
of β-chitosan, no NH bands were distinguished and the peak intensities of OH bands had
no significant difference among 17-76 kDa, similar to the 90% DDA of α-chitosan (Fig.
6.2B). However, the bands of CH stretching strengthened in lower Mw sample (≤ 40 kDa)
(Fig. 6.2B), which had no significant difference in CI and crystal formation in
comparison with 76 kDa sample (Table 6.2). Hence, the hydrogen bonds associated with
OH or NH2 could be weaker in 90% DDA/17-40 kDa β-chitosan.
In summary, α- and β-chitosan had different structural properties in association with
DDA and Mw. The intra- and inter-molecular behaviors and crystal properties could alter
the flexibility of chitosan conformation along with the degree of solubility, the major
factors impacting the antibacterial activity of chitosan, thus the different structural
characteristics of α- and β-chitosan may lead to their different antibacterial action based
on the surface phenomenon with the negatively charged bacterial cells, which were
reported and discussed below.
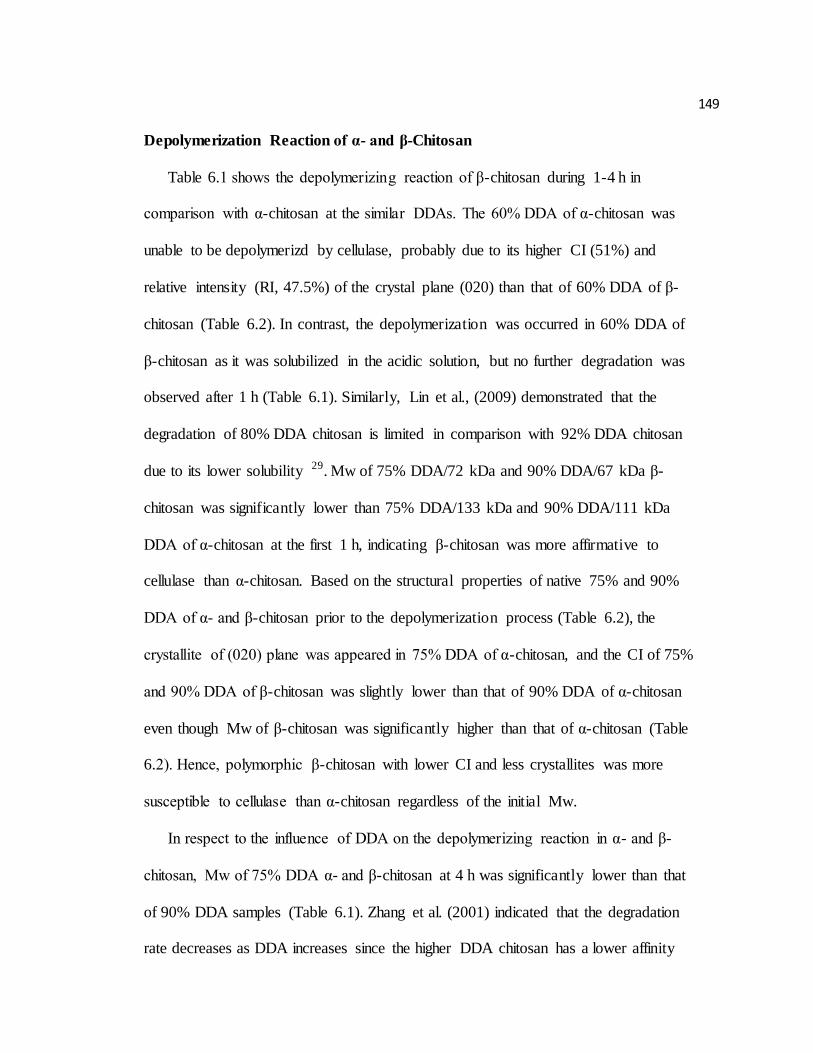
149
Depolymerization Reaction of α- and β-Chitosan
Table 6.1 shows the depolymerizing reaction of β-chitosan during 1-4 h in
comparison with α-chitosan at the similar DDAs. The 60% DDA of α-chitosan was
unable to be depolymerizd by cellulase, probably due to its higher CI (51%) and
relative intensity (RI, 47.5%) of the crystal plane (020) than that of 60% DDA of β-
chitosan (Table 6.2). In contrast, the depolymerization was occurred in 60% DDA of
β-chitosan as it was solubilized in the acidic solution, but no further degradation was
observed after 1 h (Table 6.1). Similarly, Lin et al., (2009) demonstrated that the
degradation of 80% DDA chitosan is limited in comparison with 92% DDA chitosan
due to its lower solubility 29. Mw of 75% DDA/72 kDa and 90% DDA/67 kDa β-
chitosan was significantly lower than 75% DDA/133 kDa and 90% DDA/111 kDa
DDA of α-chitosan at the first 1 h, indicating β-chitosan was more affirmative to
cellulase than α-chitosan. Based on the structural properties of native 75% and 90%
DDA of α- and β-chitosan prior to the depolymerization process (Table 6.2), the
crystallite of (020) plane was appeared in 75% DDA of α-chitosan, and the CI of 75%
and 90% DDA of β-chitosan was slightly lower than that of 90% DDA of α-chitosan
even though Mw of β-chitosan was significantly higher than that of α-chitosan (Table
6.2). Hence, polymorphic β-chitosan with lower CI and less crystallites was more
susceptible to cellulase than α-chitosan regardless of the initial Mw.
In respect to the influence of DDA on the depolymerizing reaction in α- and β-
chitosan, Mw of 75% DDA α- and β-chitosan at 4 h was significantly lower than that
of 90% DDA samples (Table 6.1). Zhang et al. (2001) indicated that the degradation
rate decreases as DDA increases since the higher DDA chitosan has a lower affinity
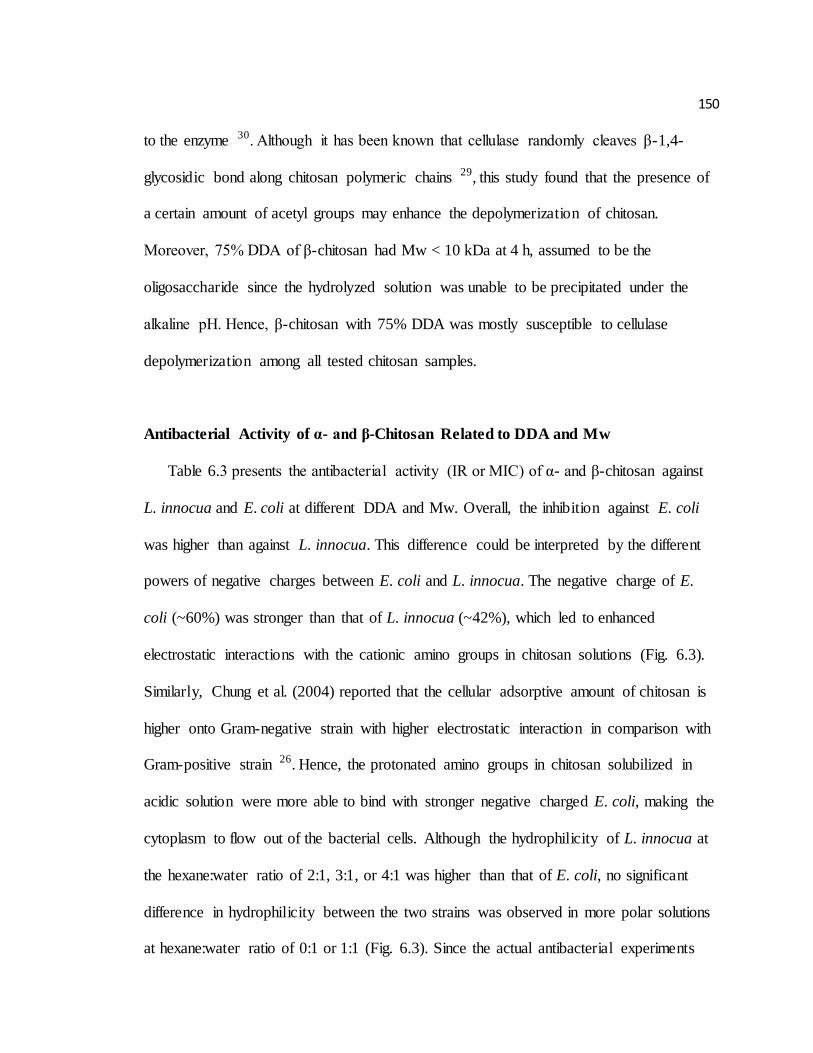
150
to the enzyme 30. Although it has been known that cellulase randomly cleaves β-1,4-
glycosidic bond along chitosan polymeric chains 29, this study found that the presence of
a certain amount of acetyl groups may enhance the depolymerization of chitosan.
Moreover, 75% DDA of β-chitosan had Mw < 10 kDa at 4 h, assumed to be the
oligosaccharide since the hydrolyzed solution was unable to be precipitated under the
alkaline pH. Hence, β-chitosan with 75% DDA was mostly susceptible to cellulase
depolymerization among all tested chitosan samples.
Antibacterial Activity of α- and β-Chitosan Related to DDA and Mw
Table 6.3 presents the antibacterial activity (IR or MIC) of α- and β-chitosan against
L. innocua and E. coli at different DDA and Mw. Overall, the inhibition against E. coli
was higher than against L. innocua. This difference could be interpreted by the different
powers of negative charges between E. coli and L. innocua. The negative charge of E.
coli (~60%) was stronger than that of L. innocua (~42%), which led to enhanced
electrostatic interactions with the cationic amino groups in chitosan solutions (Fig. 6.3).
Similarly, Chung et al. (2004) reported that the cellular adsorptive amount of chitosan is
higher onto Gram-negative strain with higher electrostatic interaction in comparison with
Gram-positive strain 26. Hence, the protonated amino groups in chitosan solubilized in
acidic solution were more able to bind with stronger negative charged E. coli, making the
cytoplasm to flow out of the bacterial cells. Although the hydrophilicity of L. innocua at
the hexane:water ratio of 2:1, 3:1, or 4:1 was higher than that of E. coli, no significant
difference in hydrophilicity between the two strains was observed in more polar solutions
at hexane:water ratio of 0:1 or 1:1 (Fig. 6.3). Since the actual antibacterial experiments
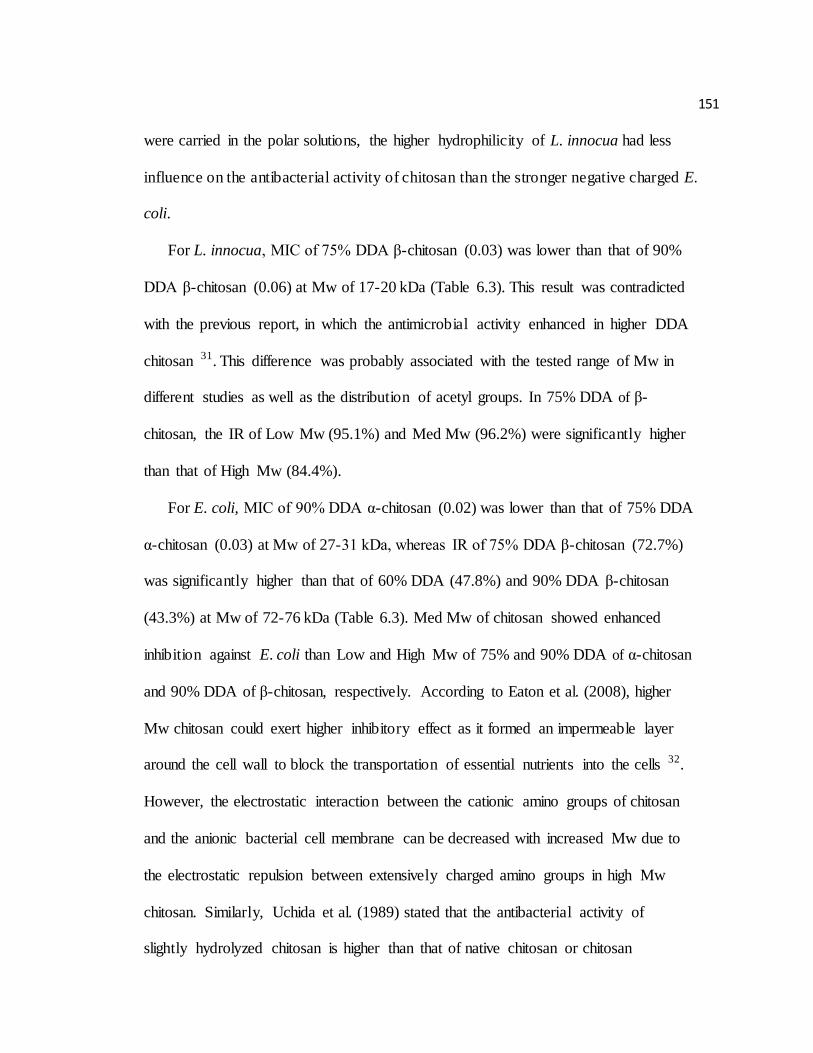
151
were carried in the polar solutions, the higher hydrophilicity of L. innocua had less
influence on the antibacterial activity of chitosan than the stronger negative charged E.
coli.
For L. innocua, MIC of 75% DDA β-chitosan (0.03) was lower than that of 90%
DDA β-chitosan (0.06) at Mw of 17-20 kDa (Table 6.3). This result was contradicted
with the previous report, in which the antimicrobial activity enhanced in higher DDA
chitosan 31. This difference was probably associated with the tested range of Mw in
different studies as well as the distribution of acetyl groups. In 75% DDA of β-
chitosan, the IR of Low Mw (95.1%) and Med Mw (96.2%) were significantly higher
than that of High Mw (84.4%).
For E. coli, MIC of 90% DDA α-chitosan (0.02) was lower than that of 75% DDA
α-chitosan (0.03) at Mw of 27-31 kDa, whereas IR of 75% DDA β-chitosan (72.7%)
was significantly higher than that of 60% DDA (47.8%) and 90% DDA β-chitosan
(43.3%) at Mw of 72-76 kDa (Table 6.3). Med Mw of chitosan showed enhanced
inhibition against E. coli than Low and High Mw of 75% and 90% DDA of α-chitosan
and 90% DDA of β-chitosan, respectively. According to Eaton et al. (2008), higher
Mw chitosan could exert higher inhibitory effect as it formed an impermeable layer
around the cell wall to block the transportation of essential nutrients into the cells 32.
However, the electrostatic interaction between the cationic amino groups of chitosan
and the anionic bacterial cell membrane can be decreased with increased Mw due to
the electrostatic repulsion between extensively charged amino groups in high Mw
chitosan. Similarly, Uchida et al. (1989) stated that the antibacterial activity of
slightly hydrolyzed chitosan is higher than that of native chitosan or chitosan
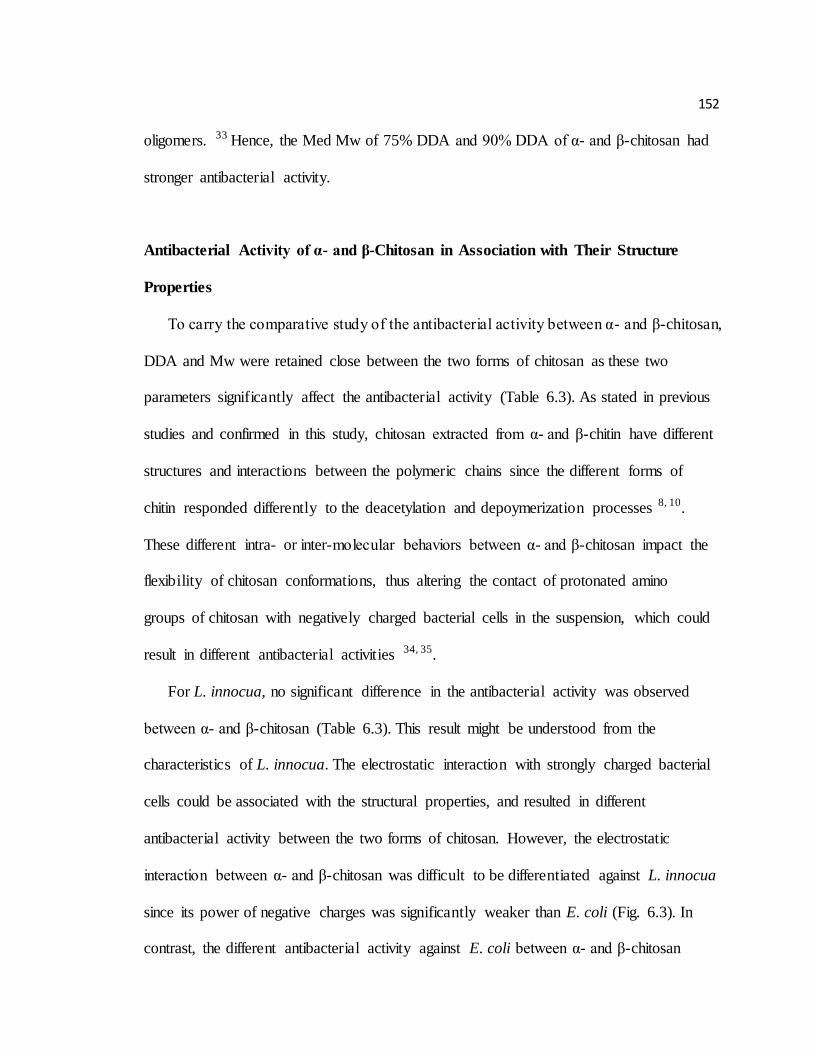
152
oligomers. 33 Hence, the Med Mw of 75% DDA and 90% DDA of α- and β-chitosan had
stronger antibacterial activity.
Antibacterial Activity of α- and β-Chitosan in Association with Their Structure
Properties
To carry the comparative study of the antibacterial activity between α- and β-chitosan,
DDA and Mw were retained close between the two forms of chitosan as these two
parameters significantly affect the antibacterial activity (Table 6.3). As stated in previous
studies and confirmed in this study, chitosan extracted from α- and β-chitin have different
structures and interactions between the polymeric chains since the different forms of
chitin responded differently to the deacetylation and depoymerization processes 8, 10.
These different intra- or inter-molecular behaviors between α- and β-chitosan impact the
flexibility of chitosan conformations, thus altering the contact of protonated amino
groups of chitosan with negatively charged bacterial cells in the suspension, which could
result in different antibacterial activities 34, 35.
For L. innocua, no significant difference in the antibacterial activity was observed
between α- and β-chitosan (Table 6.3). This result might be understood from the
characteristics of L. innocua. The electrostatic interaction with strongly charged bacterial
cells could be associated with the structural properties, and resulted in different
antibacterial activity between the two forms of chitosan. However, the electrostatic
interaction between α- and β-chitosan was difficult to be differentiated against L. innocua
since its power of negative charges was significantly weaker than E. coli (Fig. 6.3). In
contrast, the different antibacterial activity against E. coli between α- and β-chitosan
153
could be due to its negative charge strongly associated with the structural properties
of α- and β-chitosan (Fig. 6.3).
MIC of 75% DDA/31 kDa β-chitosan (0.02) against E. coli was lower than that of
α-chitosan (0.03) (Table 6.3). In 75% DDA/31 kDa, α-chitosan had higher CI with
the presence of the crystal formation in (120), (101), and (130) planes in comparison
with β-chitosan (Table 6.2). In addition, the band of CH stretching in β-chitosan was
slightly intense than that in α-chitosan (Figs. 6.1 and 6.2). Hence, α-chitosan
conformations in the solution could be more rigid due to strong intra- or inter-
molecular hydrogen bonds, thus decreasing the contacts to the bacterial cells in the
suspension than β-chitosan conformations. Reversely, 90% DDA/74-76 kDa α-
chitosan exerted significantly higher IR (58.4%) than β-chitosan (43.3%) against E.
coli (Table 6.3). Although CI of α-chitosan was relatively higher than that of β-
chitosan (Table 6.2), the band of CH stretching in α-chitosan was intense in
comparison with that in β-chitosan, it thus could be assumed that hydrogen bonds was
weaker in α-chitosan. Hence, the flexible conformation of α-chitosan could enhance
the electrostatic interaction between cationic chitosan and anionic bacterial cells,
increasing antibacterial activity. Therefore, α- and β-chitosan showed different
antibacterial activity against E. coli due to their structural difference at similar DDA
and Mw.
ACKNOWLEDGEMENT
154
The authors would like to thank Mr. Mark Ludlow at Dosidicus LLC, USA for
donating squid pens and to Dr. John Simonsen at the Department of Wood Science,
Oregon State University for his assistance with the FT-IR analysis
155
REFERENCES
1. Campana-Fillho, S. P.; De Britto, D.; Curti, E.; Abreu, F. R.; Cardoso, M. B.;
Battisti, M. V.; Sim, P. C.; Lvall, R. L., Extraction, structures, and properties of alpha and beta-chitin. Quim. Nova 2007, 30, 644-650.
2. Kumirska, J.; Czerwicka, M.; Kaczynski, Z.; Bychowska, A.; Brzozowski, K.;
Thoming, J.; Stepnowski, P., Application of spectroscopic methods for structural analysis of chitin and chitosan. Mar. Drugs 2010, 8 (5), 1567-1636.
3. Jang, M.K.; Kong, B.G.; Jeong, Y.I.; Lee, C. H.; Nah, J.W., Physicochemical characterization of α-chitin, β-chitin, and γ-chitin separated from natural resources. J. Polym. Sci. Part A: Polym. Chem. 2004, 42 (14), 3423-3432.
4. Chandumpai, A.; Singhpibulporn, N.; Faroongsarng, D.; Sornprasit, P., Preparation and physico-chemical characterization of chitin and chitosan from the
pens of the squid species, Loligo lessoniana and Loligo formosana. Carbohydr. Polym. 2004, 58 (4), 467-474.
5. Lavall, R. L.; Assis, O. B. G.; Campana-Filho, S. P., β-chitin from the pens of
Loligo sp.: Extraction and characterization. Bioresour. Technol. 2007, 98 (13), 2465-2472.
6. Abdou, E. S.; Nagy, K. S. A.; Elsabee, M. Z., Extraction and characterization of chitin and chitosan from local sources. Bioresour. Technol. 2008, 99 (5), 1359-1367.
7. Tsai, G.J.; Su, W.-H., Antibacterial activity of shrimp chitosan against Escherichia coli. J. Food Prot. 1999, 62 (3), 239-243.
8. Lamarque, G.; Viton, C.; Domard, A., Comparative study of the first heterogeneous deacetylation of α- and β-chitins in a multistep process. Biomacromolecules 2004, 5 (3), 992-1001.
9. Kurita, K.; Tomita, K.; Tada, T.; Ishii, S.; Nishimura, S.I.; Shimoda, K., Squid chitin as a potential alternative chitin source: Deacetylation behavior and
characteristic properties. Journal of Polymer Science Part A: Polymer Chemistry 1993, 31 (2), 485-491.
10. Kurita, K.; Ishii, S.; Tomita, K.; Nishimura, S.I.; Shimoda, K., Reactivity
characteristics of squid β-chitin as compared with those of shrimp chitin: High potentials of squid chitin as a starting material for facile chemical modifications. J.
Polym. Sci. Part A: Polym. Chem. 1994, 32 (6), 1027-1032. 11. Kumar, A. B. V.; Gowda, L. R.; Tharanathan, R. N., Non-specific
depolymerization of chitosan by pronase and characterization of the resultant
products. Eur. J. Biochem. 2004, 271 (4), 713-723. 12. Ogawa, K., Effect of heating an aqueous suspension of chitosan on the
crystallinity and polymorphs Agric. Biol. Chem. 1991, 55 (9), 237502379. 13. Liu, N.; Chen, X.G.; Park, H.J.; Liu, C.G.; Liu, C.S.; Meng, X.H.; Yu, L.J., Effect
of Mw and concentration of chitosan on antibacterial activity of Escherichia coli.
Carbohydr. Polym. 2006, 64 (1), 60-65. 14. Gerasimenko, D. V.; Avdienko, I. D.; Bannikova, G. E.; Zueva, O. Y.; Varlamov,
V. P., Antibacterial effects of water-soluble low-molecular-weight chitosans on different microorganisms. Appl. Biochem. Microbiol. 2004, 40 (3), 253-257.
156
15. Tikhonov, V. E.; Stepnova, E. A.; Babak, V. G.; Yamskov, I. A.; Palma-Guerrero, J.; Jansson, H.-B.; Lopez-Llorca, L. V.; Salinas, J.; Gerasimenko, D. V.;
Avdienko, I. D.; Varlamov, V. P., Bactericidal and antifungal activities of a low molecular weight chitosan and its N-/2(3)-(dodec-2-enyl)succinoyl/-derivatives. Carbohydr. Polym. 2006, 64 (1), 66-72.
16. Helander, I. M.; Nurmiaho-Lassila, E. L.; Ahvenainen, R.; Rhoades, J.; Roller, S., Chitosan disrupts the barrier properties of the outer membrane of Gram-negative
bacteria. Int. J. Food Microbiol. 2001, 71 (2-3), 235-244. 17. Feng, F.; Liu, Y.; Hu, K., Influence of alkali-freezing treatment on the solid state
structure of chitin. Carbohydr. Res. 2004, 339 (13), 2321-2324.
18. Huang, J.; Mao, J. W.; Hu, S.; Zhao, D. K.; Mei, L. H.; Liu, S. W.; Wu, Y. F.; Fang, S.; Shao, Q., Ultrasonic-assisted preparation, characterization and
antibacterial activity of β-chitosan from squid pens. Adv. Mater. Res. 2011, 236-238, 282-287.
19. Shimojoh, M.; Masai, K.; Kurita, K., Bactericidal effects of chitosan from squid
pens on oral Streptococci. Nippon Nogei kagaku Kaishi 1996, 70 (7), 787-792. 20. Jung, J.; Zhao, Y., Characteristics of deacetylation and depolymerization of β-
chitin from jumbo squid (Dosidicus gigas) pens. Carbohydr. Res. 2011, 346 (13), 1876-1884.
21. Jung, J.; Zhao, Y., Comparison in antioxidant action between α-chitosan and β-
chitosan at a wide range of molecular weight and chitosan concentration. Bioorg. Med. Chem. 2012, 20 (9), 2905-2911.
22. Mao, S.; Shuai, X.; Unger, F.; Simon, M.; Bi, D.; Kissel, T., The depolymerization of chitosan: Effects on physicochemical and biological properties. Int. J. Pharm. 2004, 281 (1??), 45-54.
23. No, H. K.; Lee, S. H.; Park, N. Y.; Meyers, S. P., Comparison of physicochemical, binding, and antibacterial properties of chitosans prepared without and with
deproteinization process. J. Agric. Food Chem. 2003, 51 (26), 7659-7663. 24. Chang, K. L. B.; Tsai, G.; Lee, J.; Fu, W.-R., Heterogeneous N-deacetylation of
chitin in alkaline solution. Carbohydr. Res. 1997, 303 (3), 327-332.
25. Huang, R.; Du, Y.; Zheng, L.; Liu, H.; Fan, L., A new approach to chemically modified chitosan sulfates and study of their influences on the inhibition of
Escherichia coli and Staphylococcus aureus growth. React. Funct. Polym. 2004, 59 (1), 41-51.
26. Chung, Y. C.; Su, Y. P.; Chen, C. C.; Jia, G.; Wang, H. L.; Wu, J. C.; Lin, J. G.,
Relationship between antibacterial activity of chitosan and surface characteristics of cell wall. Acta Pharmacol. Sin. 2004, 25 (7), 932-936.
27. Focher, B.; Beltrame, P. L.; Naggi, A.; Torri, G., Alkaline N-deacetylation of chitin enhanced by flash treatments. Reaction kinetics and structure modifications. Carbohydr. Polym. 1990, 12 (4), 405-418.
28. Focher, B.; Naggi, A.; Torri, G.; Cosani, A.; Terbojevich, M., Structural differences between chitin polymorphs and their precipitates from solutions-
evidence from CP-MAS 13C-NMR, FT-IR and FT-Raman spectroscopy. Carbohydr. Polym. 1992, 17 (2), 97-102.
157
29. Lin, S.B.; Lin, Y.C.; Chen, H.H., Low molecular weight chitosan prepared with the aid of cellulase, lysozyme and chitinase: Characterisation and antibacterial
activity. Food Chem. 2009, 116 (1), 47-53. 30. Zhang, H.; Neau, S. H., In vitro degradation of chitosan by a commercial enzyme
preparation: effect of molecular weight and degree of deacetylation. Biomaterials
2001, 22 (12), 1653-1658. 31. Andres, Y.; Giraud, L.; Gerente, C.; Le Cloirec, P., Antibacterial effects of
chitosan powder: Mechanisms of action. Environ. Technol. 2007, 28 (12), 1357-1363.
32. Eaton, P.; Fernandes, J. C.; Pereira, E.; Pintado, M. E.; Xavier Malcata, F.,
Atomic force microscopy study of the antibacterial effects of chitosans on Escherichia coli and Staphylococcus aureus. Ultramicroscopy 2008, 108 (10),
1128-1134. 33. Uchida, Y.; Izume, M.; Ohtakara, A., Preparation of chitosan oligomers with
purified chitosanase and its application. Elsevier: London, 1989.
34. Domard, A., A perspective on 30 years research on chitin and chitosan. Carbohydr. Polym. 2012, 84 (2), 696-703.
35. Du, J.; Hsieh, Y.L., PEGylation of chitosan for improved solubility and fiber
formation via electrospinning. Cellul. 2007, 14 (6), 543-552
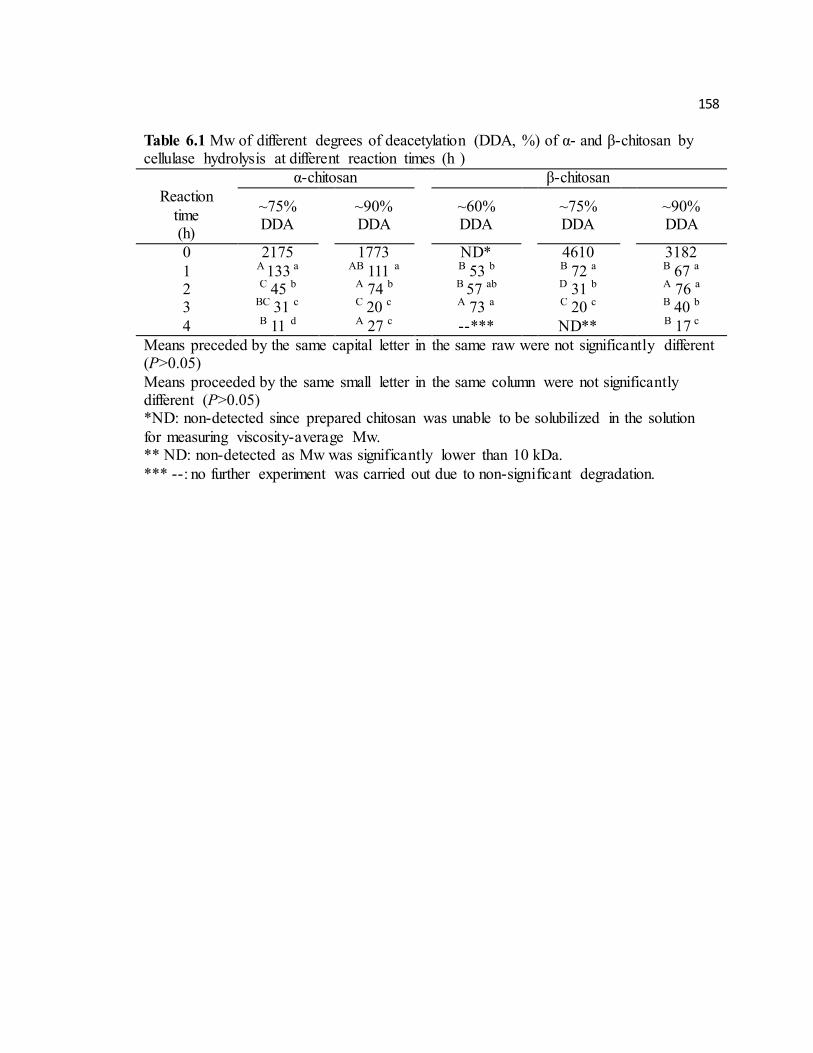
158
Table 6.1 Mw of different degrees of deacetylation (DDA, %) of α- and β-chitosan by cellulase hydrolysis at different reaction times (h )
α-chitosan β-chitosan
Reaction
time (h)
~75% DDA
~90% DDA
~60% DDA
~75% DDA
~90% DDA
0 2175 1773 ND* 4610 3182
1 A 133 a AB 111 a B 53 b B 72 a B 67 a 2 C 45 b A 74 b B 57 ab D 31 b A 76 a 3 BC 31 c C 20 c A 73 a C 20 c B 40 b
4 B 11 d A 27 c --*** ND** B 17 c
Means preceded by the same capital letter in the same raw were not significantly different (P>0.05)
Means proceeded by the same small letter in the same column were not significantly different (P>0.05) *ND: non-detected since prepared chitosan was unable to be solubilized in the solution
for measuring viscosity-average Mw. ** ND: non-detected as Mw was significantly lower than 10 kDa.
*** --: no further experiment was carried out due to non-significant degradation.
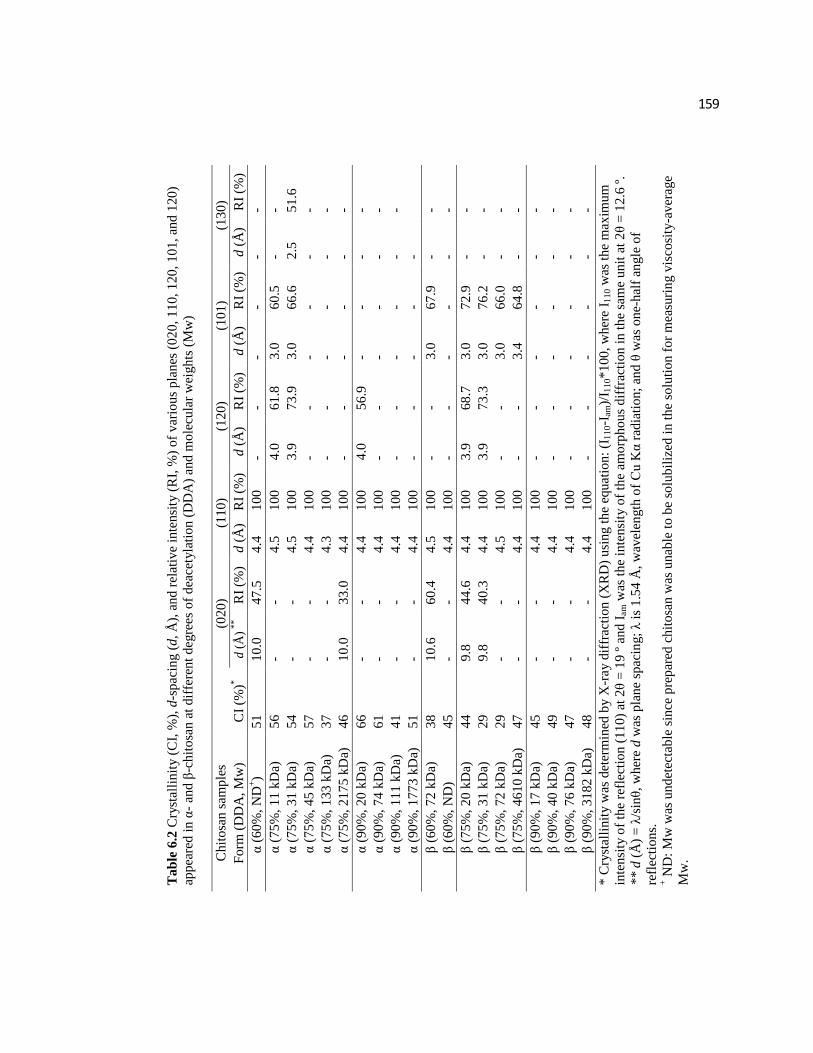
159
Ta
ble
6.2
Cry
stal
lin
ity (
CI,
%),
d-s
pac
ing (
d,
Å),
an
d r
elat
ive
inte
nsi
ty (
RI,
%)
of
var
iou
s p
lan
es (
02
0,
11
0,
12
0,
10
1,
and
12
0)
app
eare
d i
n α
- an
d β
-ch
ito
san
at
dif
fere
nt
deg
rees
of
dea
cety
lati
on
(D
DA
) an
d m
ole
cula
r w
eigh
ts (
Mw
)
Ch
ito
san
sam
ple
s
(02
0)
(11
0)
(12
0)
(10
1)
(13
0)
Fo
rm (
DD
A,
Mw
) C
I (%
)*
d (
Å) *
*
RI
(%)
d (
Å)
RI
(%)
d (
Å)
RI
(%)
d (
Å)
RI
(%)
d (
Å)
RI
(%)
α (
60
%,
ND
+)
51
1
0.0
4
7.5
4
.4
10
0
- -
- -
- -
α (
75
%,
11
kD
a)
56
-
- 4
.5
10
0
4.0
6
1.8
3
.0
60
.5
- -
α (
75
%,
31
kD
a)
54
-
- 4
.5
10
0
3.9
7
3.9
3
.0
66
.6
2.5
5
1.6
α (
75
%,
45
kD
a)
57
-
- 4
.4
10
0
- -
- -
- -
α (
75
%,
13
3 k
Da)
3
7
- -
4.3
1
00
-
- -
- -
-
α (
75
%,
21
75
kD
a)
46
1
0.0
3
3.0
4
.4
10
0
- -
- -
- -
α (
90
%,
20
kD
a)
66
-
- 4
.4
10
0
4.0
5
6.9
-
- -
-
α (
90
%,
74
kD
a)
61
-
- 4
.4
10
0
- -
- -
- -
α (
90
%,
11
1 k
Da)
4
1
- -
4.4
1
00
-
- -
- -
-
α (
90
%,
17
73
kD
a)
51
-
- 4
.4
10
0
- -
- -
-
β (
60
%,
72
kD
a)
38
1
0.6
6
0.4
4
.5
10
0
- -
3.0
6
7.9
-
-
β (
60
%,
ND
) 4
5
- -
4.4
1
00
-
- -
- -
-
β (
75
%,
20
kD
a)
44
9
.8
44
.6
4.4
1
00
3
.9
68
.7
3.0
7
2.9
-
-
β (
75
%,
31
kD
a)
29
9
.8
40
.3
4.4
1
00
3
.9
73
.3
3.0
7
6.2
-
-
β (
75
%,
72
kD
a)
29
-
- 4
.5
10
0
- -
3.0
6
6.0
-
-
β (
75
%,
46
10
kD
a)
47
-
- 4
.4
10
0
- -
3.4
6
4.8
-
-
β (
90
%,
17
kD
a)
45
-
- 4
.4
10
0
- -
- -
- -
β (
90
%,
40
kD
a)
49
-
- 4
.4
10
0
- -
- -
- -
β (
90
%,
76
kD
a)
47
-
- 4
.4
10
0
- -
- -
- -
β (
90
%,
31
82
kD
a)
48
-
- 4
.4
10
0
- -
- -
- -
* C
ryst
alli
nit
y w
as d
eter
min
ed b
y X
-ray d
iffr
acti
on
(X
RD
) u
sin
g t
he
equ
atio
n:
(I1
10-I
am)/
I 11
0*
10
0, w
her
e I 1
10 w
as t
he
max
imu
m
inte
nsi
ty o
f th
e re
flec
tio
n (
11
0)
at 2
θ =
19
º a
nd
Iam
was
th
e in
ten
sity
of
the
amo
rph
ou
s d
iffr
acti
on
in
th
e sa
me
un
it a
t 2
θ =
12
.6 º
.
**
d (
Å)
= λ
/sin
θ,
wh
ere
d w
as p
lan
e sp
acin
g;
λ i
s 1
.54
Å,
wav
elen
gth
of
Cu
Kα
rad
iati
on
; an
d θ
was
on
e-h
alf
angle
of
refl
ecti
on
s.
+ N
D:
Mw
was
un
det
ecta
ble
sin
ce p
rep
ared
ch
ito
san
was
un
able
to
be
solu
bil
ized
in
th
e so
luti
on
fo
r m
easu
rin
g v
isco
sity
-av
erag
e
Mw
.
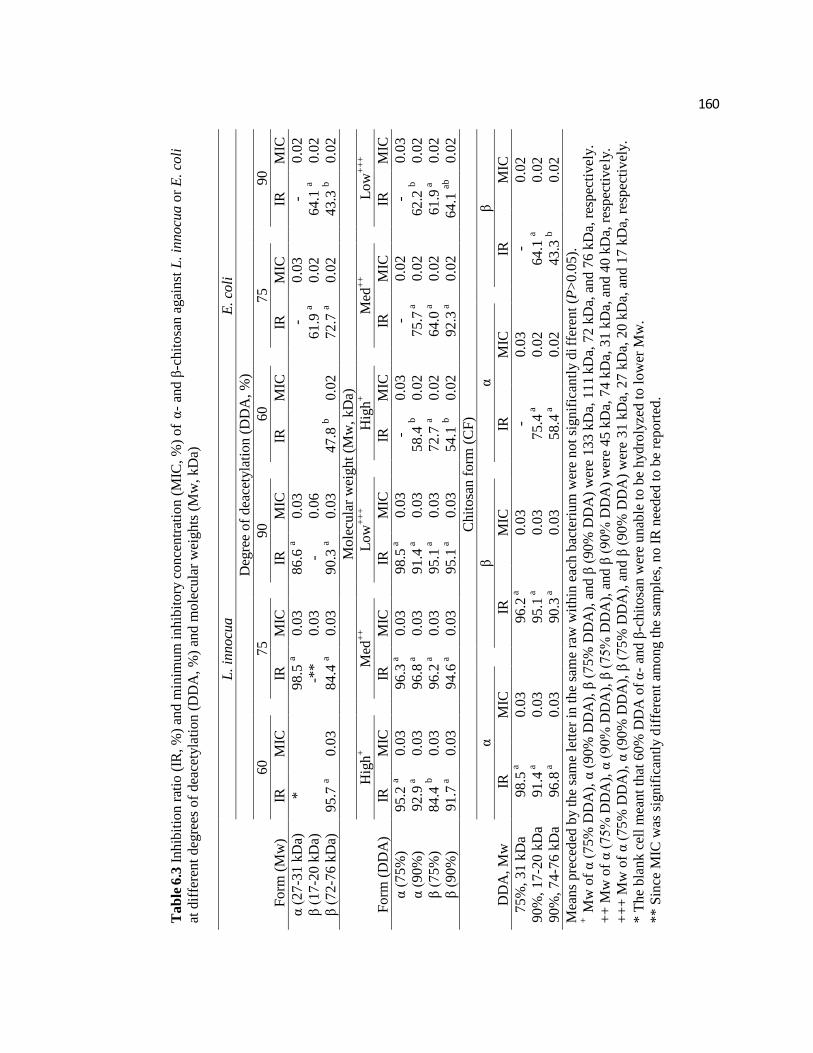
160
Ta
ble
6.3
In
hib
itio
n r
atio
(IR
, %
) an
d m
inim
um
in
hib
ito
ry c
on
cen
trat
ion
(M
IC,
%)
of
α-
and
β-c
hit
osa
n a
gai
nst
L.
inn
ocu
a o
r E
. co
li
at d
iffe
ren
t d
egre
es o
f d
eace
tyla
tio
n (
DD
A,
%)
and
mo
lecu
lar
wei
gh
ts (
Mw
, k
Da)
Fo
rm (
Mw
)
L.
inn
ocu
a
E
. co
li
Deg
ree
of
dea
cety
lati
on
(D
DA
, %
)
60
75
90
60
75
90
IR
MIC
IR
MIC
IR
MIC
IR
MIC
IR
MIC
IR
MIC
α (
27
-31
kD
a)
*
98
.5 a
0.0
3
8
6.6
a 0
.03
-
0.0
3
-
0.0
2
β (
17
-20
kD
a)
-*
*
0.0
3
-
0.0
6
61
.9 a
0.0
2
6
4.1
a 0
.02
β (
72
-76
kD
a)
95
.7 a
0.0
3
8
4.4
a 0
.03
90
.3 a
0.0
3
4
7.8
b
0.0
2
7
2.7
a 0
.02
43
.3 b
0
.02
Fo
rm (
DD
A)
Mo
lecu
lar
wei
gh
t (M
w,
kD
a)
Hig
h+
M
ed+
+
L
ow
++
+
H
igh
+
M
ed+
+
L
ow
++
+
IR
MIC
IR
MIC
IR
MIC
IR
MIC
IR
MIC
IR
MIC
α (
75
%)
95
.2 a
0.0
3
9
6.3
a
0.0
3
9
8.5
a
0.0
3
-
0.0
3
-
0.0
2
-
0.0
3
α (
90
%)
92
.9 a
0.0
3
9
6.8
a
0.0
3
9
1.4
a
0.0
3
5
8.4
b
0.0
2
7
5.7
a
0.0
2
6
2.2
b
0.0
2
β (
75
%)
84
.4 b
0
.03
96
.2 a
0.0
3
9
5.1
a
0.0
3
7
2.7
a 0
.02
64
.0 a
0.0
2
6
1.9
a
0.0
2
β (
90
%)
91
.7 a
0.0
3
9
4.6
a
0.0
3
9
5.1
a
0.0
3
5
4.1
b
0.0
2
9
2.3
a
0.0
2
6
4.1
ab
0.0
2
DD
A,
Mw
Ch
ito
san
fo
rm (
CF
)
α
β
α
β
IR
MIC
IR
MIC
IR
MIC
IR
MIC
75
%,
31
kD
a 9
8.5
a
0.0
3
9
6.2
a
0.0
3
-
0.0
3
-
0.0
2
90
%,
17
-20
kD
a 9
1.4
a
0.0
3
9
5.1
a
0.0
3
7
5.4
a
0.0
2
6
4.1
a 0
.02
90
%,
74
-76
kD
a 9
6.8
a
0.0
3
9
0.3
a
0.0
3
5
8.4
a
0.0
2
4
3.3
b
0.0
2
Mea
ns
pre
ced
ed b
y t
he
sam
e le
tter
in
th
e sa
me
raw
wit
hin
eac
h b
acte
riu
m w
ere
no
t si
gn
ific
antl
y d
iffe
ren
t (P
>0
.05
).
+ M
w o
f α
(7
5%
DD
A),
α (
90
% D
DA
), β
(7
5%
DD
A),
an
d β
(9
0%
DD
A)
wer
e 1
33
kD
a, 1
11
kD
a, 7
2 k
Da,
an
d 7
6 k
Da,
res
pec
tiv
ely.
++
Mw
of
α (
75
% D
DA
), α
(9
0%
DD
A),
β (
75
% D
DA
), a
nd
β (
90
% D
DA
) w
ere
45
kD
a, 7
4 k
Da,
31
kD
a, a
nd
40
kD
a, r
esp
ecti
ve
ly.
++
+ M
w o
f α
(7
5%
DD
A),
α (
90
% D
DA
), β
(7
5%
DD
A),
an
d β
(9
0%
DD
A)
wer
e 3
1 k
Da,
27
kD
a, 2
0 k
Da,
an
d 1
7 k
Da,
res
pec
tiv
ely.
* T
he
bla
nk
cel
l m
ean
t th
at 6
0%
DD
A o
f α
- an
d β
-ch
ito
san
wer
e u
nab
le t
o b
e h
yd
roly
zed
to
lo
wer
Mw
.
**
Sin
ce M
IC w
as s
ign
ific
antl
y d
iffe
ren
t am
on
g t
he
sam
ple
s, n
o I
R n
eed
ed t
o b
e re
po
rted
.
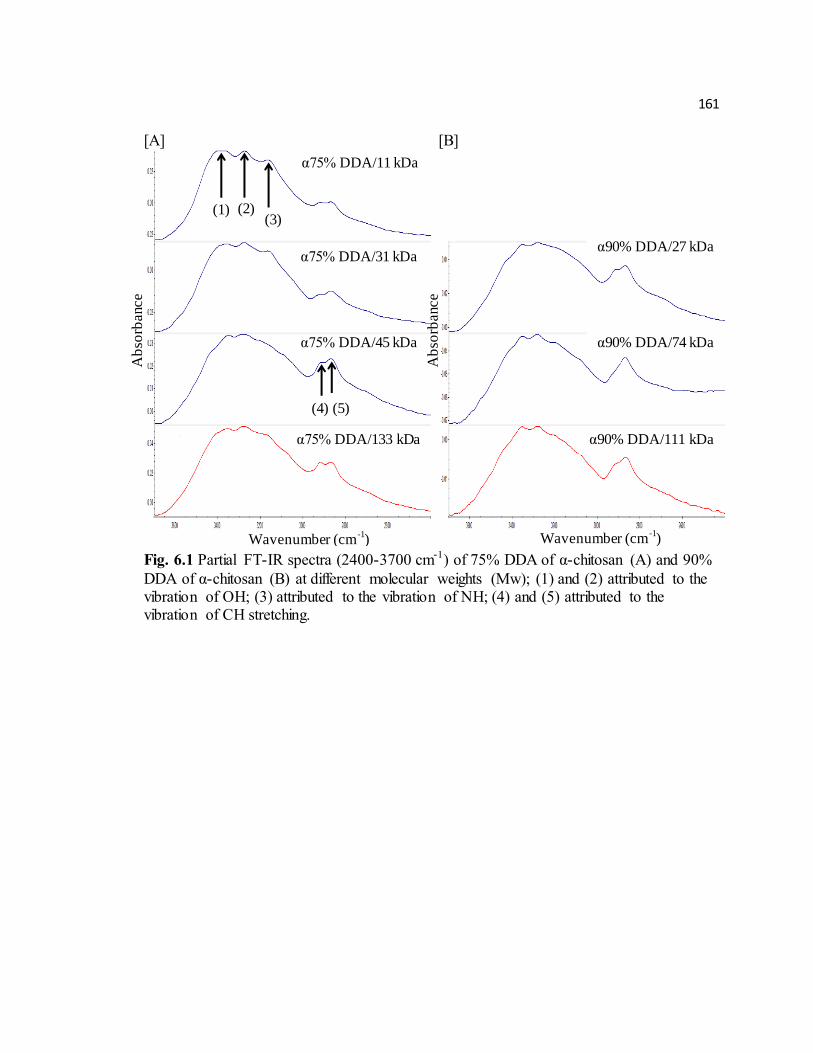
161
[A] [B]
Fig. 6.1 Partial FT-IR spectra (2400-3700 cm-1) of 75% DDA of α-chitosan (A) and 90%
DDA of α-chitosan (B) at different molecular weights (Mw); (1) and (2) attributed to the vibration of OH; (3) attributed to the vibration of NH; (4) and (5) attributed to the vibration of CH stretching.
α75% DDA/11 kDa
α75% DDA/31 kDa
α75% DDA/45 kDa
α75% DDA/133 kDa
α90% DDA/27 kDa
α90% DDA/74 kDa
α90% DDA/111 kDa
Ab
sorb
ance
Wavenumber (cm-1)
Ab
sorb
ance
Wavenumber (cm-1)
(1) (2) (3)
(5) (4)
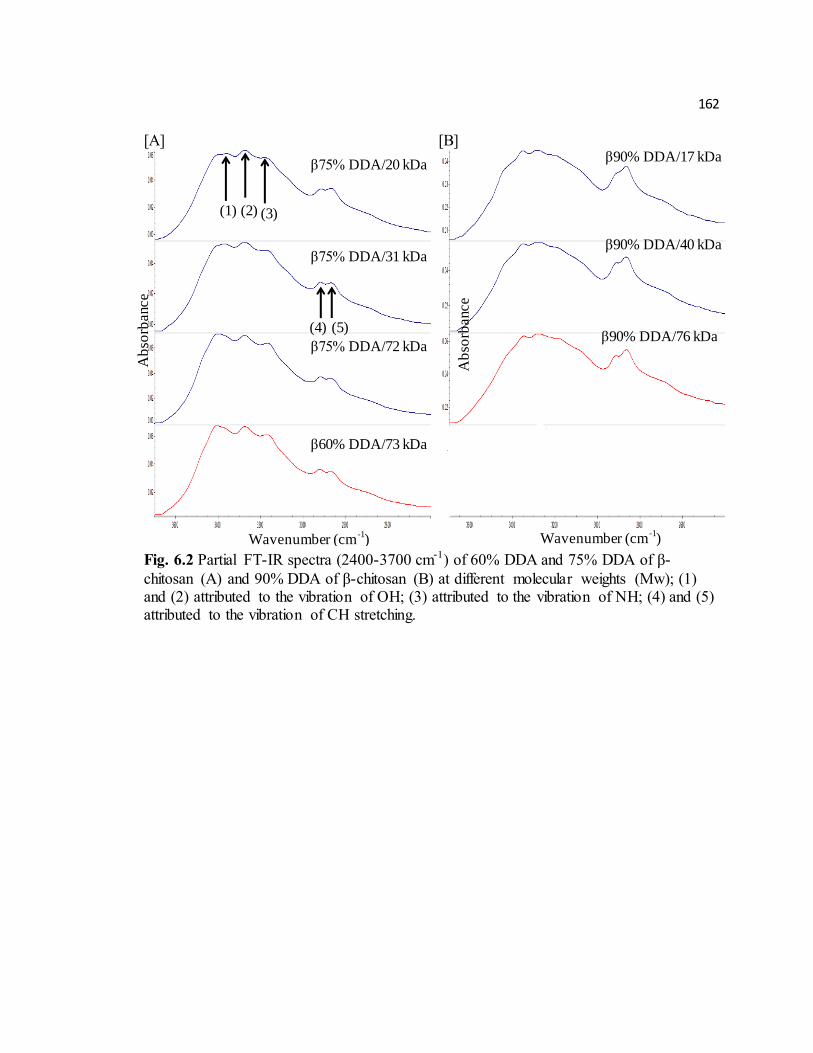
162
[A] [B]
Fig. 6.2 Partial FT-IR spectra (2400-3700 cm-1) of 60% DDA and 75% DDA of β-
chitosan (A) and 90% DDA of β-chitosan (B) at different molecular weights (Mw); (1) and (2) attributed to the vibration of OH; (3) attributed to the vibration of NH; (4) and (5) attributed to the vibration of CH stretching.
β75% DDA/20 kDa
β75% DDA/31 kDa
β75% DDA/72 kDa
β60% DDA/73 kDa
β90% DDA/17 kDa
β90% DDA/40 kDa
β90% DDA/76 kDa
Ab
sorb
ance
Wavenumber (cm-1)
Ab
sorb
ance
Wavenumber (cm-1)
(1) (2) (3)
(5) (4)
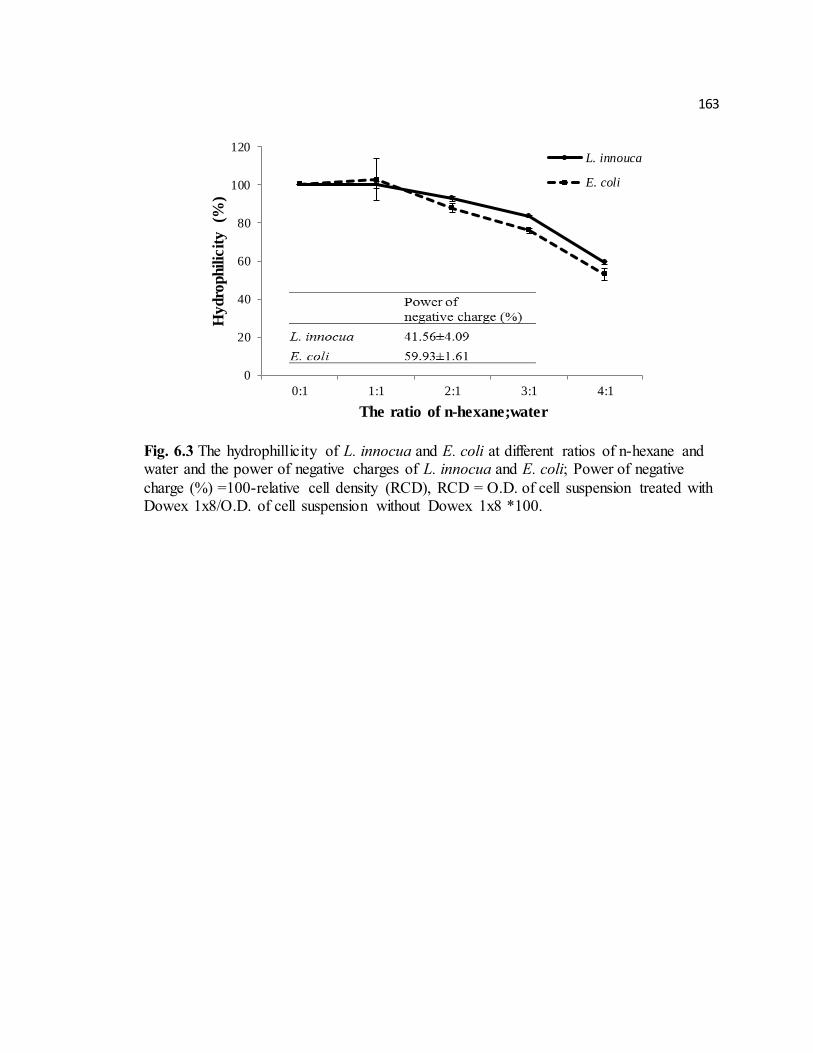
163
Fig. 6.3 The hydrophillicity of L. innocua and E. coli at different ratios of n-hexane and water and the power of negative charges of L. innocua and E. coli; Power of negative
charge (%) =100-relative cell density (RCD), RCD = O.D. of cell suspension treated with Dowex 1x8/O.D. of cell suspension without Dowex 1x8 *100.
0
20
40
60
80
100
120
0:1 1:1 2:1 3:1 4:1
Hydro
philic
ity
(%)
The ratio of n-hexane;water
L. innouca
E. coli
164
CHAPTER 7
OVERALL CONCLUSIONS
The feasibility of employing jumbo squid pens as the raw material for preparing β-
chitin and chitosan was evaluated by comparing its structures, physicochemcial
properties, and biological activities with commercially utilized α-chitin and chitosan
extracted from shrimp shells. When extracting β-chitin from jumbo squid pens, the
demineralization and depigmentation processes required for preparing α-chitin from
shrimp shells could be omitted since the mineral and pigment contents in jumbo squid
pens were negligible, and the resulted β-chitin had signficiantly higher moisture content
and molecular weight (Mw) in comparison with α-chitin. The optimal deacetylation and
depolymerization conditions using NaOH and cellulase were further developed to prepare
β-chitosan with a wide range of degree of deacetylation (DDA) and Mw.
β-chitin has unique polymorphic structure with less inter-molecular hydrogen bonds
and lower crystallinity (CI), thus exerting higher reactivity toward solvents than α-chitin.
β-chitin could convert to α-chitin when subjected to alklai or acid treatment at certain
reaction time, and the converted α-form showed higher moisture absorption ability than
that of the native α-chitin as the result of polymorphic destruction. Hence, β-chitin could
retain its high reactivity toward solvents even after forming rigid-packed α-form as
demonstrated in its deacetylating and depolymerizing reactions, where lower NaOH
concentration and shorter reaction time were needed for β-chitin than for α-chitin when
preparing similar DDA of chitosan and β-chitosan was more susceptible to cellulase than
α-chitosan. These differences might be explained by the unique structural property of β-
165
chitin and chitosan, in which lower CI and less crystallite in β-chitosan might increase its
solubility and affinity to cellulase.
Different antioxidant and antibacterial activities between α- and β-chitosan under
similar DDA and Mw were also observed. At high Mw of 300-320 kDa, β-chitosan
exhibited significantly higher DPPH radical scavenging activity and reducing ability than
those of α-chitosan. The 75% DDA/31 kDa of β-chitosan showed significantly higher
antibacterial activity against E. coli than the same DDA and Mw of α-chitosan, whereas
α-chitosan had higher inhibition ratio (%) against E. coli than β-chitosan at 90%
DDA/74-76 kDa. These differences might be attributed by the different intra- or inter-
molecular behaviors between α- and β-chitosan that impacted the flexibility of chitosan
conformations, thus altering the antioxidant and antibacterial mechanisms of chitosan in
solutions.
For fully understanding the differences between β- and α-chitosan, especially their
antioxidant and antibacterial activities, the conformational properties of β- and α-chitosan
solutions should be further investigated by using NMR spectroscopy and by coordinating
with their structural properties in the solid form. In addition, future studies to evaluate the
antifungal activity, develop β-chitosan deriatives and/or nano-β-chitosan with improved
functionality, and apply β-chitosan in various food and non-food systems are all
important to fully utilize the abundant source of squid pens and the unique properties of
β-chitosan.
166
APPENDIX I
THE CONTRIBUTION OF ACIDULANT TO THE ANTIBACTRERIAL ACTIVITY
OF ACID SOLUBLE α- AND β-CHITOSAN SOLUTIONS AND THEIR FILMS
Jung, J., Cavender, G., and Zhao, Y. Submitted to International Journal of Food
Microbiology
167
ABSTRACT
This study evaluated individual contributions of dissolving acids (acetic acid, lactic acid,
and hydrochloric acid) or acid solubilized chitosan (α- and β-forms) to the antibacterial
activity against L. innocua and E. coli as solutions and dried films. The presence of
chitosan significantly (P<0.05) altered percentage of inhibition (PI, %) of acid solubilized
chitosan solutions against L. innocua and E. coli, thus the additional inhibition (AI, %) of
chitosan in comparison with acid alone was further investigated to quantify the
antibacterial activity of chitosan alone. AI of 300-320 kDa α- and β-chitosan reported
positive values varying (~17-65%) in all types of acid against L. innocua and E. coli,
indicating that the chitosan itself had offered additional antibacterial activity compared
with the acid solution, and was higher than that of 4-5 kDa α- and β-chitosan. Higher Mw
showed significant higher adsorptive ratios (%) than lower Mw, suggesting that the
increased inhibition was the result of surface phenomena. AI, adsorptive ratio, and
cellular leakage depended on chitosan forms, acid types, Mw, and bacterial species. In
chitosan films, the contribution of acids to antibacterial activity of acid solubilized
chitosan was assumed by comparing PI between non-rinsed and rinsed films. PI against E.
coli was shown to be affected, not only by acid types and rinsing of films, but also by the
interaction between chitosan forms and rinsing of films. PI of rinsed β-chitosan acetate
and hydrochloride films was ~26% and ~28% lower than those of non-rinsed films. This
decrease after rinsing suggested that part of the antibacterial activity of chitosan films is
due to the presence of soluble acid compounds and/or other active fragments. The
structural characteristics of the films also impacted their antibacterial activity. Thus, the
168
contribution of acidulant to the antibacterial activity of acid solubilized α- and β-chitosan
could be numerically estimated by AI calculations for coating solutions and rinsing of
films for films.
Keywords: α- and β-chitosan, chitosan salt film, coating solution, antibacterial activity
169
INTRODUCTION
While chitin, a biopolymer found in the structural components of marine invertebrates
or crustacean shells, some fungi and certain bacteria, is widespread in nature, it has
limited industrial use. This lack of use is primarily due to its compact structure and lack
of appreciable solubility in aqueous solutions. By utilizing simple chemical and
enzymatic methods, chitin can be transformed into chitosan, a compound that not only
has greater solubility in acidic aqueous solutions, but also shows potent antibacterial
ability. While the underlying mechanisms behind this activity are unclear, several have
been suggested, from the alteration of cell permeability due to interaction between
protonated amino groups (NH3+) and negatively charged cell membranes 1, to the
destruction of the cell wall by chelation of the metals present therein 2, to the formation
of a physical barrier preventing the uptake of nutrients into the cell, resulting in cell death
3. Despite the lack of consensus on the reason behind the activity, it has been observed in
multiple studies 4-10 that the antibacterial activity of chitosan is influenced by various
factors, including molecular weight (Mw), degree of deacetylation (DDA), pH and
inhibition time, as well as bacterial species and Gram-stain group. Gerasimenko et al. 11
examined chitosan with molecular weights from 5-27 kDa, and reported that antibacterial
activity against E. coli increases as Mw decreased. Similarly, Kim et al. 12 found that
chitosan treated with lipase to reduce Mw provided higher antibacterial activity across
several bacterial species compared with unaltered chitosan. The relationship between Mw
and antibacterial is not cut and dry, as No et al. 5 found that chitosan with a Mw in excess
of 59 kDa exerts higher antibacterial activity against B. megaterium, B. cereus, and E.
sakazaki than that with a lower Mw (less than 22 kDa). DDA also plays a role in the
170
antibacterial effect of chitosan, with Lin et al. 13 finding that lower Mw chitosan (~ 26
kDa) with higher DDA exerted higher antibacterial effect than those with lower DDA.
The pH was also one of factors affecting antibacterial activity of chitosan, with Tsai et al.
1 reporting that acidic pH increased the bactericidal effects of chitosan, and No et al. 14
finding higher antibacterial activity in lower pH among the tested range of pH (4.5-5.9).
Finally, with respect to the effect of Gram-stain group, there seems to be little consensus.
Chung et al. 4 reported that antibacterial activity of chitosan was stronger against Gram-
negative bacteria than Gram-positive bacteria; however, Zhong et al. 6 observed the
opposite trend. The sometimes conflicting results of these studies, along with the
differing effects of the various factors highlight the need for additional research,
particularly as it related to potential interactions between the factors.
Chitosan is insoluble in water, but is acid-soluble and therefore may be dissolved in
acidic solutions for applications such as coating and dried films. Both organic acids and
inorganic acids can be used as a solvent, provided that the pH of the solution is below the
pKa of the amino groups (~6.3). That said, organic acids, such as acetic acid and lactic
acid, possess strong antibacterial activity by themselves and even the inorganic acids
show some activity 15, 16. Thus, while chitosan has its own antibacterial activity as
mentioned above, the contributions of chitosan to the antibacterial activity of applications
made with acid-soluble chitosan are difficult to isolate from the antibacterial effects of
the acid in the solutions. Further, as in all multi-factored systems, there exists the
possibility of interactive effect between one or more factors. Therefore, the aim of this
study was to evaluate the antibacterial activity of solutions and films made with acid-
171
soluble α- and β-chitosan, as well as to determine the contribution of different factors,
such as Mw, the chitosan forms (CF), and the acid type (AT).
MATERIALS AND METHODS
Preparation of Chitosan, Chitosan Solutions and Films
Dried jumbo squid (Dosidicus gigas) pens were obtained from Dosidicus LLC, USA
and used to prepare β-chitosan after Jung and Zhao (2011). Briefly, dried squid pens were
ground into about 18 mesh (ASTM) and then deproteinized and deacetylated by 5%
NaOH and 50% NaOH, respectively. Commercially available α-chitosan from shrimp
shells was purchased from Primax (Iceland). Both α- and β-chitosan were depolymerized
using cellulase in order to reach the desired molecular weight. After the inactivation and
removal of the enzyme, filtered samples were precipitated using 10% NaOH. These
precipitated samples were then washed with distilled water and ethanol to remove any
residues and dried at 40 ºC for 24 h. Mw and DDA of both types of chitosan were
determined using the methods described below.
Chitosan solutions were prepared by dissolving powdered chitosan (1% w/v) in a 1%
aqueous solution of acetic, lactic, or hydrochloric acid. Films were prepared by
transferring 20 mL of a given chitosan solution into a 60 mm diameter petri dish and
allowing it to dry at 40 ºC for 48 h. Due to the inability of low Mw chitosan to form films,
only the higher Mw samples (300-320 kDa) were used in the film production.
Determination of Mw and DDA
172
Mw of chitosan was determined by using the Ubbelohde Dilution Viscometer
(Cannon instrument Co., USA) with the capillary size of 0.58 nm. Approximate 100 mg
of chitosan was dissolved in 10 mL of the mixture solution of 0.1M CH3COOH and 0.2M
NaCl 17. The intrinsic viscosity was measured by the intercept between the Huggins
(reduced viscosity) and Kraemer (relative viscosity) plots when the concentration was 0
18. The viscosity-average molecular weight of chitosan was calculated by using Mark-
Houwink-Sakurada (MHS) equation (1) 19:
[Ƞ] = K (MW) a (1)
where K and a were the constants, K=1.81 x 10⁻³ and a = 0.93; and [Ƞ] was the intrinsic
viscosity obtained from the Huggins and Kraemer plots. DDA was determined by the
colloidal titration method 20. Mw and DDA of the commercial α-chitosan and β-chitosan
prepared in this study were 300 kDa with 88% DDA and 320 kDa with 86% DDA,
respectively, while the Mw and DDA of α- and β-chitosan oligosaccharides were 5 kDa
with 94% DDA and 4 kDa with 95% DDA, respectively.
Preparation of Microbial Cultures
Escherichia coli ATCC 25922 and Listeria innocua ATCC 51742 were obtained from
the American Type Culture Collection. Each organism was cultured on appropriate solid
media (E. coli on tryptic soy agar (TSA) (Becton, Dickinson and Co., USA) and L.
innocua on brain heart infusion agar (BHA) (Becton, Dickinson and Co., USA)) and
stored under refrigeration (4 °C) during the course of the study. Prior to a given
microbiological assay, samples of a single typical colony were inoculated in tubes of
appropriate broth (E. coli in tryptic soy broth (TSB) (EMD Chemicals, Inc., USA) and L.
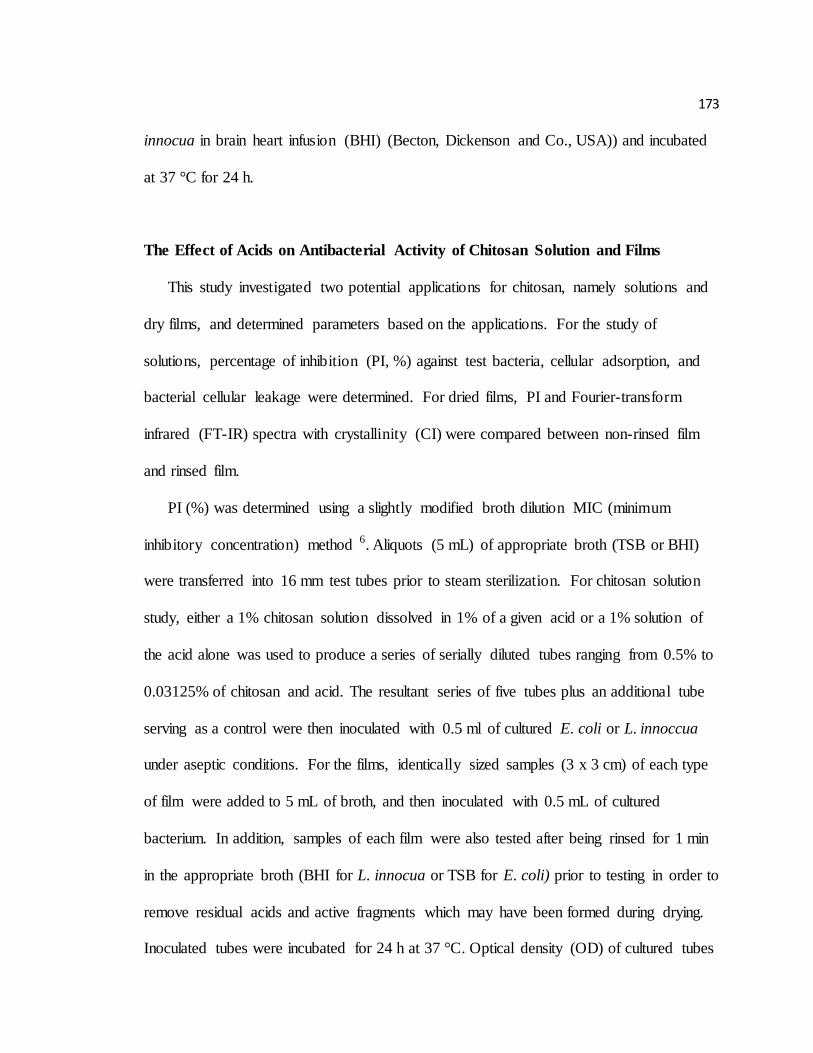
173
innocua in brain heart infusion (BHI) (Becton, Dickenson and Co., USA)) and incubated
at 37 °C for 24 h.
The Effect of Acids on Antibacterial Activity of Chitosan Solution and Films
This study investigated two potential applications for chitosan, namely solutions and
dry films, and determined parameters based on the applications. For the study of
solutions, percentage of inhibition (PI, %) against test bacteria, cellular adsorption, and
bacterial cellular leakage were determined. For dried films, PI and Fourier-transform
infrared (FT-IR) spectra with crystallinity (CI) were compared between non-rinsed film
and rinsed film.
PI (%) was determined using a slightly modified broth dilution MIC (minimum
inhibitory concentration) method 6. Aliquots (5 mL) of appropriate broth (TSB or BHI)
were transferred into 16 mm test tubes prior to steam sterilization. For chitosan solution
study, either a 1% chitosan solution dissolved in 1% of a given acid or a 1% solution of
the acid alone was used to produce a series of serially diluted tubes ranging from 0.5% to
0.03125% of chitosan and acid. The resultant series of five tubes plus an additional tube
serving as a control were then inoculated with 0.5 ml of cultured E. coli or L. innoccua
under aseptic conditions. For the films, identically sized samples (3 x 3 cm) of each type
of film were added to 5 mL of broth, and then inoculated with 0.5 mL of cultured
bacterium. In addition, samples of each film were also tested after being rinsed for 1 min
in the appropriate broth (BHI for L. innocua or TSB for E. coli) prior to testing in order to
remove residual acids and active fragments which may have been formed during drying.
Inoculated tubes were incubated for 24 h at 37 °C. Optical density (OD) of cultured tubes
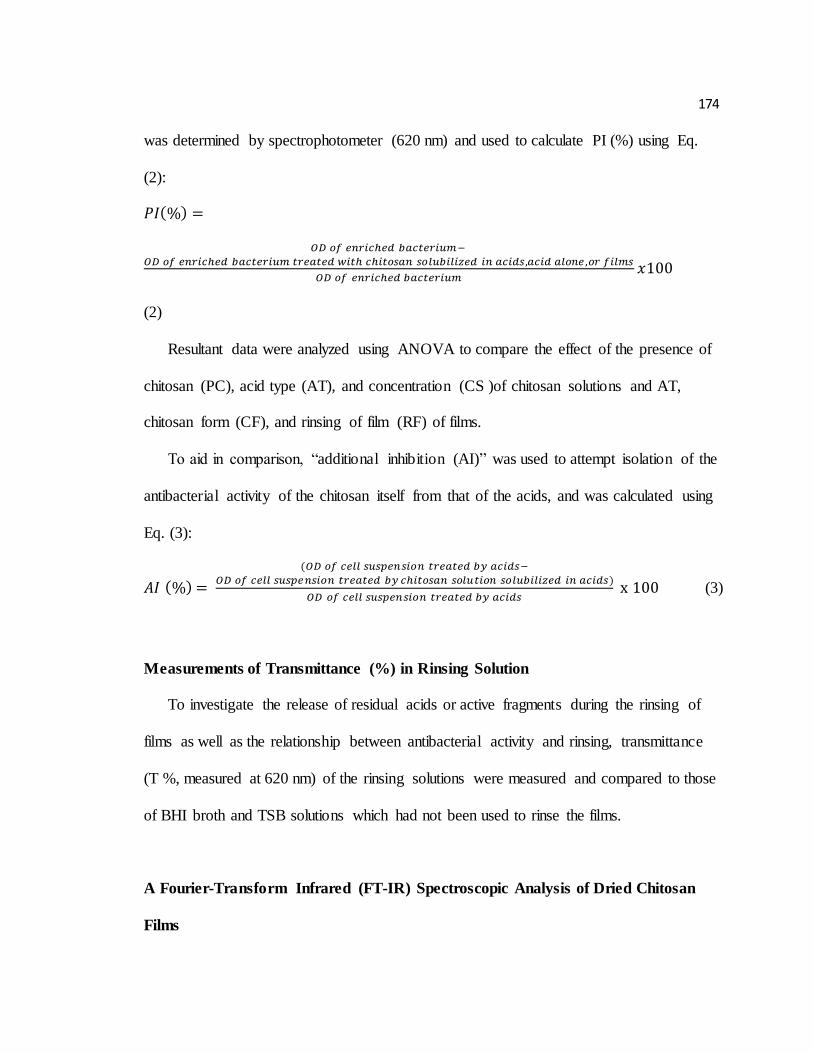
174
was determined by spectrophotometer (620 nm) and used to calculate PI (%) using Eq.
(2):
( )
(2)
Resultant data were analyzed using ANOVA to compare the effect of the presence of
chitosan (PC), acid type (AT), and concentration (CS )of chitosan solutions and AT,
chitosan form (CF), and rinsing of film (RF) of films.
To aid in comparison, “additional inhibition (AI)” was used to attempt isolation of the
antibacterial activity of the chitosan itself from that of the acids, and was calculated using
Eq. (3):
( )
(
)
(3)
Measurements of Transmittance (%) in Rinsing Solution
To investigate the release of residual acids or active fragments during the rinsing of
films as well as the relationship between antibacterial activity and rinsing, transmittance
(T %, measured at 620 nm) of the rinsing solutions were measured and compared to those
of BHI broth and TSB solutions which had not been used to rinse the films.
A Fourier-Transform Infrared (FT-IR) Spectroscopic Analysis of Dried Chitosan
Films
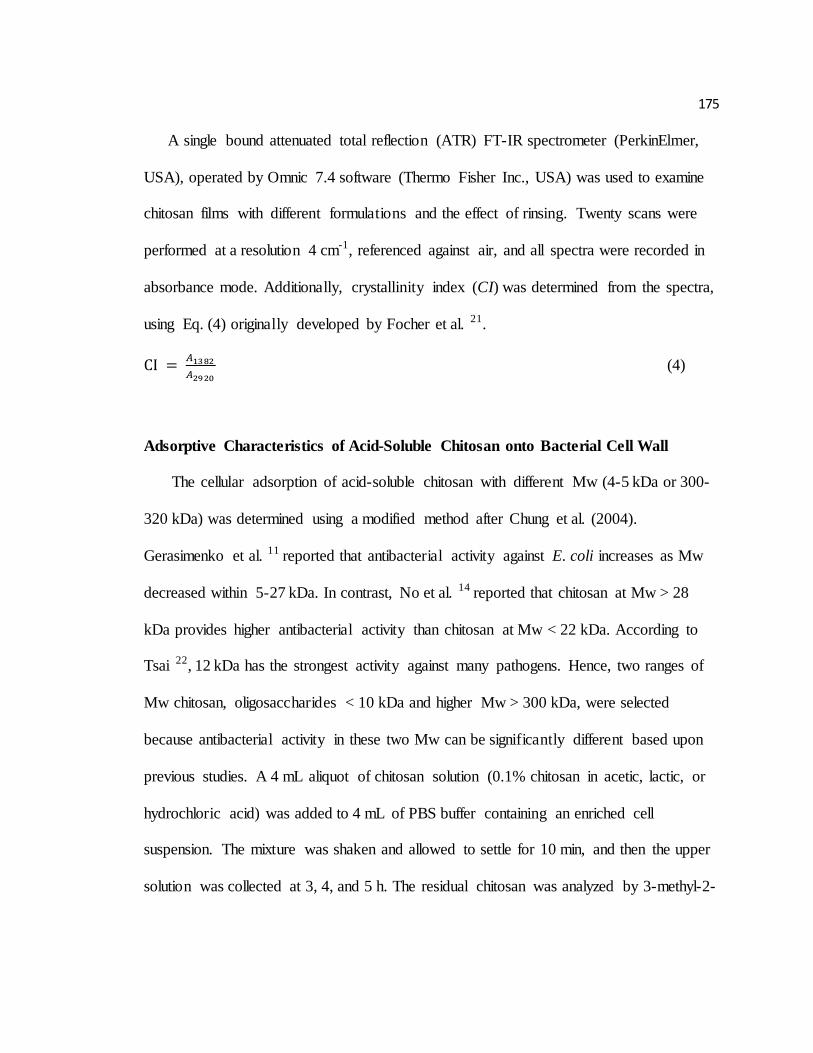
175
A single bound attenuated total reflection (ATR) FT-IR spectrometer (PerkinElmer,
USA), operated by Omnic 7.4 software (Thermo Fisher Inc., USA) was used to examine
chitosan films with different formulations and the effect of rinsing. Twenty scans were
performed at a resolution 4 cm-1, referenced against air, and all spectra were recorded in
absorbance mode. Additionally, crystallinity index (CI) was determined from the spectra,
using Eq. (4) originally developed by Focher et al. 21.
(4)
Adsorptive Characteristics of Acid-Soluble Chitosan onto Bacterial Cell Wall
The cellular adsorption of acid-soluble chitosan with different Mw (4-5 kDa or 300-
320 kDa) was determined using a modified method after Chung et al. (2004).
Gerasimenko et al. 11 reported that antibacterial activity against E. coli increases as Mw
decreased within 5-27 kDa. In contrast, No et al. 14 reported that chitosan at Mw > 28
kDa provides higher antibacterial activity than chitosan at Mw < 22 kDa. According to
Tsai 22, 12 kDa has the strongest activity against many pathogens. Hence, two ranges of
Mw chitosan, oligosaccharides < 10 kDa and higher Mw > 300 kDa, were selected
because antibacterial activity in these two Mw can be significantly different based upon
previous studies. A 4 mL aliquot of chitosan solution (0.1% chitosan in acetic, lactic, or
hydrochloric acid) was added to 4 mL of PBS buffer containing an enriched cell
suspension. The mixture was shaken and allowed to settle for 10 min, and then the upper
solution was collected at 3, 4, and 5 h. The residual chitosan was analyzed by 3-methyl-2-
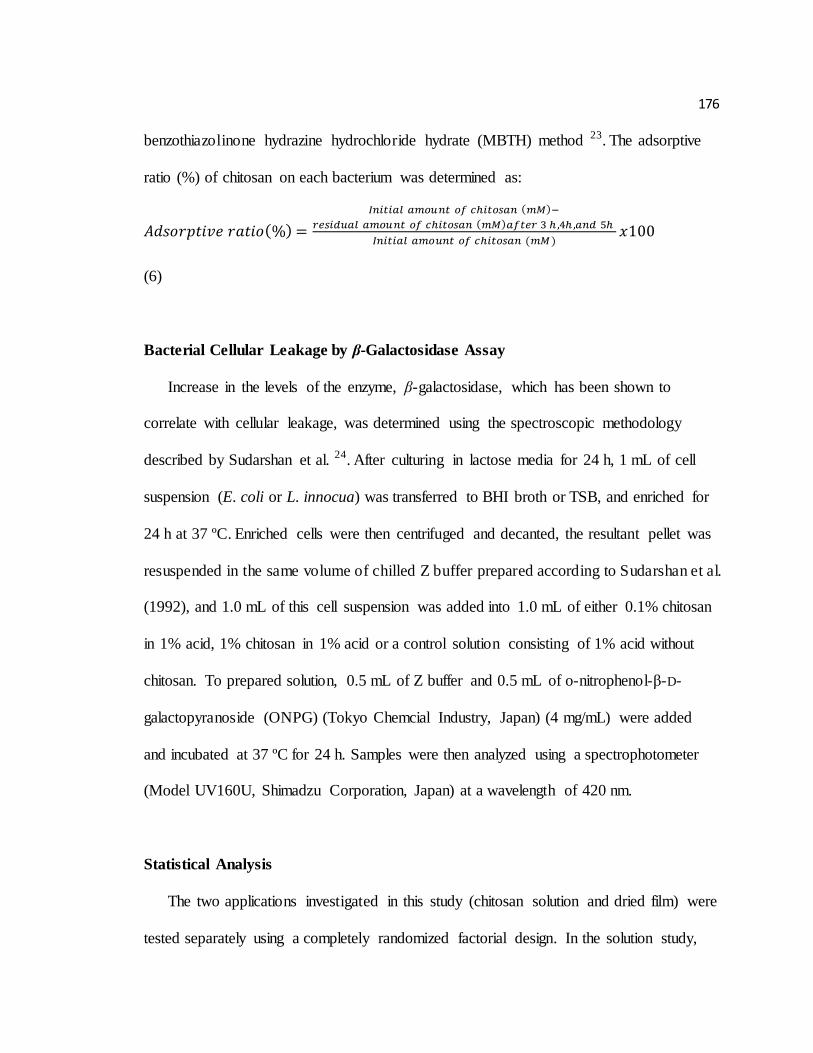
176
benzothiazolinone hydrazine hydrochloride hydrate (MBTH) method 23. The adsorptive
ratio (%) of chitosan on each bacterium was determined as:
( )
( )
( )
( )
(6)
Bacterial Cellular Leakage by β-Galactosidase Assay
Increase in the levels of the enzyme, β-galactosidase, which has been shown to
correlate with cellular leakage, was determined using the spectroscopic methodology
described by Sudarshan et al. 24. After culturing in lactose media for 24 h, 1 mL of cell
suspension (E. coli or L. innocua) was transferred to BHI broth or TSB, and enriched for
24 h at 37 ºC. Enriched cells were then centrifuged and decanted, the resultant pellet was
resuspended in the same volume of chilled Z buffer prepared according to Sudarshan et al.
(1992), and 1.0 mL of this cell suspension was added into 1.0 mL of either 0.1% chitosan
in 1% acid, 1% chitosan in 1% acid or a control solution consisting of 1% acid without
chitosan. To prepared solution, 0.5 mL of Z buffer and 0.5 mL of o-nitrophenol-β-D-
galactopyranoside (ONPG) (Tokyo Chemcial Industry, Japan) (4 mg/mL) were added
and incubated at 37 ºC for 24 h. Samples were then analyzed using a spectrophotometer
(Model UV160U, Shimadzu Corporation, Japan) at a wavelength of 420 nm.
Statistical Analysis
The two applications investigated in this study (chitosan solution and dried film) were
tested separately using a completely randomized factorial design. In the solution study,
177
three treatment factors were tested, including the presence of chitosan (PC; 5 levels: acid
alone, 4-5 kDa and 300-320 kDa of α-chitosan, and 4-5 kDa and 300-320 kDa of β-
chitosan), acid type (AT; 3 levels: acetic acid, lactic acid, and hydrochloric acid), and
concentrations of chitosan (CS; 5 levels: 0.031, 0.062, 0.125, 0.250, and 0.500%).
Treatment factors for dried films were chitosan forms (CF; 2 levels: α and β-form), acid
type (AT; 3 levels: acetic acid, lactic acid, and hydrochloric acid), and rinse of films (RF;
2 levels: non-rinsed or rinsed). All experiments were performed in duplicate, and the
resultant data were analyzed for statistical significance via multi-way analysis of variance
(ANOVA) and least significant difference (LSD) post hoc testing as appropriate using
statistical software (SAS v9.2, The SAS Institute, USA). Results were considered to be
different if α<0.05.
RESULTS AND DISCUSSIONS
Chitosan Salt Solution
Percentage of Inhibition and Additional Inhibition of Chitosan and Acid Solutions
PC significantly impacted PI against E. coli, and interacted with AT and CS against E.
coli (P<0.05). However, there was no main PC effect (P>0.05), but significantly
interactive with AT and CS for L. innocua (Table 7.1). AT significantly impacted L.
innocua and CS also had significant effect against both L. innocua and E. coli (P<0.05).
The observed differences in PI between chitosan solubilized in acids and acid alone
suggest that the chitosan itself contributes to the antibacterial activity of those solutions.
As previously mentioned, AI is intended to estimate the additional antibacterial
activity of chitosan compared with the effect of the acid alone. AI for L. innocua and E.
178
coli are presented in Figs. 7.1A and 7.1B, respectively. It should be noted that these
results include only the data from the lowest concentration (0.03125%) of chitosan
solution, due to the limitations of the methodology - briefly, chitosan has been shown to
have the tendency to self-aggregate in the aqueous solution in a concentration and
molecular weight- dependent manner 25. These aggregates greatly increase the OD of the
solutions, preventing meaningful measurement of cell density related OD in our higher
concentration and higher Mw chitosan solutions. Of course, this limitation is relatively
minor as previous research indicated that the antibacterial activity of chitosan solutions is
concentration dependent, with 0.01% solutions having a greater effect than those of 0.2 or
even 0.5% (Sudarshan et al. 24. Due to this inverse relationship between concentration
and antibacterial effect, AI of chitosan salt solution was calculated based upon
comparison of our most dilute samples, 0.03125% chitosan in 0.03125% of each type of
acids and 0.03125% acid alone. Positive AI indicated that the chitosan itself offers
additional antibacterial activity compared with the acid alone, thus allowing the
contribution of chitosan to the antibacterial to be estimated. For L. innocua, the AI of
300-320 kDa α- and β-chitosan were ~50-65% and ~19~26, respectively, whereas the AI
of 4-5 kDa β-chitosan varied greatly based upon the solubilizing acid, ranging from no AI
for acetic acid and AI of ~9-26% for lactic and hydrochloric acids. For E. coli, the AI of
300-320 kDa α- and β-chitosan ranged between ~17 and 54%, respectively, and among
the 4-5 kDa samples, positive AI (~21%) was only found for lactic acid. Overall, it was
found that AI was greater in the higher Mw samples (300-320 kDa) compared with the
lower ones (4-5 kDa) and varied based on AT, CF, and bacterial species.
179
Antibacterial Mechanisms and Their Relationship with Antibacterial Activity
While the exact nature of the antimicrobial activity of chitosan is still not fully
understood, two of the most common mechanisms suggested are the cellular adsorption
of chitosan and cellular leakage caused by the penetration or permeation of the bacterial
cell wall by chitosan. In this study, both phenomena were examined, and the results are
presented in Fig. 7.2 and Table 7.2, respectively. In general, 300-320 kDa chitosan
showed significantly higher adsorptive ratios compared with the 4-5 kDa chitosan. This
was true for all acid types against E. coli and both acetic and hydrochloric acids against L.
innocua. This activity difference based upon Mw can be explained due to simple
structural properties in different Mw chitosan. Chitosan molecules become polycationic
when solubilized (gaining hydrogen from solution) allowing it to better interact with the
negatively charged bacterial cell surface 26, 27. Since higher Mw chitosan molecules
contain more amino groups which can become cationic, they are better able to interact
with the bacterial cells. However, electrostatic interaction between chitosan and bacterial
cell wall can be decreased with increasing Mw higher than a certain range of Mw due to
electrostatic repulsions between extensively charged chitosan polymers. Similarly,
Uchida et al. 28 reported higher antibacterial activity in slightly hydrolyzed chitosan than
native chitosan or chitosan oligomers. Therefore, cellular adsorption is closely related to
antibacterial activity depending on Mw, possibly presenting the highest ability in a
certain range of Mw.
Cellular leakage data showed an interesting pattern, with the amount of leakage
generally being higher in 0.1% of chitosan solutions compared with those at 1.0%, and E.
coli showing greater leakage than L. innocua. This was not the first time such a
180
phenomena had been observed, as Sudarshan et al. 24 found similar trends regarding
concentrations of chitosan solutions, reported that the maximum reduction of bacteria
occurred at the lowest concentrations (0.1 mg/mL) in comparison with chitosan
concentrations of 2.0 or 5.0 mg/mL, and suggested that the large number of positive
charges in the solutions may impart a net positive charge, helping to keep the bacteria in
suspension. Another possibility for the observed relationship between concentrations and
cellular leakage is that the higher concentration of chitosan salt solutions could allow for
the formation of an impenetrable layer of chitosan outside cell membranes, thus lessening
the detection of cellular leakage. This was similar to the findings by Fernandes et al. 29
who reported that the high Mw chitosan polymer could form a mechanical barrier thereby
preventing the uptake of nutrients into the vegetative cell. However, regarding the effect
of Mw against L. innocua, 0.1% of 5 kDa α-chitosan lactic acid and HCl was
significantly higher than chitosan in acetic acid, while no difference in acid type for 4
kDa β-chitosan (Table 7.2). Unlikely for E. coli, there was no significant difference
among Mw. The differences between the two bacterial species could be explained either
by the differences in cell wall composition between Gram-positive and Gram-negative
cells or more simply due to the vast size differences between L. innocua and E. coli, with
the large size of the latter offering more potential sites for permeation and the small size
of the former making it easier to form an impenetrable layer around the bacterial cell wall.
Chitosan Salt Films
Structural Characteristics of Chitosan Salt Films

181
Crystallinity (CI) and FT-IR spectra are shown in Fig. 7.3 for α-chitosan and Fig. 7.4
for β-chitosan. CF altered CI among various types of films, with α- chitosan showing a
higher CI than β-chitosan in general. In particular, non-rinsed β-chitosan acetate and
hydrochloride films showed lower CI than those films made of α-chitosan. This result is
likely related to the structural difference between the two chitosan forms, as Lima and
Airoldi 30 had also reported that β-chitosan had lower CI compared to α-chitosan.
Similarly, other studies have shown that the CF impacts the ability of chitosan to form a
hydrogel, with β-chitosan having the ability as it easily accepts water into the lattice due
to lower CI and less hydrogen bonds 31. The rinsing of the films changed the CI of films
in a non-uniform manner. While the CI of rinsed α- and β-chitosan acetate films was
increased compared with non-rinsed samples, the CI of α- and β-chitosan lactate and
hydrochloride film was decreased. In the previous studies, Kawada et al. 32 reported that
crystallization degree of chitosan acetate is higher than that of chitosan lactate, and
chitosan lactate films also had lower strength due to the presence of the larger lactate
counter ion in the structural matrix 33. Therefore, rinsing away of these large ions could
have a more profound effect on the CI of lactate films, compared with those of chitosan
acetate films.
Rinsing of film (RF) and chitosan form (CF) also impacted FT-IR spectra,
particularly in the range of 3000-3500 cm-1, the region associated with the formation of
salts and/or hydrogen bonds by OH or NH functional groups in the chitosan film complex.
The intensity of these peaks was reduced in rinsed films compared with non-rinsed films
(Figs. 7.3 and 7.4). Further, in β-chitosan acetate and hydrochloride films, rinsing
resulted in much larger decreases in peak intensity compared with the decreases seen
182
from rinsing similar α-chitosan films (Figs. 7.3 and 7.4). Whether this effect is due to the
release of entrapped salts and any residual acids or the dissociation of hydrogen bonds
between chitosan molecules was unknown. In respect to the effect of CF, the structural
differences, particularly the increased number of chitosan-hydrogen bonds in α-chitosan,
are the likely cause of the differences between the FT-IR spectra among similar chitosan
salt films.
Antibacterial Activity of Chitosan Salt Films Depending on AT, CF, and RF
As shown in Table 7.1, for L. innocua, no difference in PI for any of the treatments,
either alone or in combination (P>0.05). In contrast, the PI against E. coli was affected
not only by AT and RF, but also by the interaction between CF and RF (P<0.05).
Individual means testing of the E. coli data using the LSD method showed an
interesting pattern of effect (Table 7.3). For non-rinsed films, β-chitosan hydrochloride
film showing the highest PI (92.85%) was significantly higher than all other films. For
rinsed films, PI of α- and β-chitosan hydrochloride film was significantly higher than β-
chitosan acetate film. Several previous studies had investigated the effect of acidulant
type on bacterial species. Buchanan and Edelson 34 looked at the effects of citric, malic,
lactic, hydrochloric and acetic acids on cell viability of E. coli O157:H7 at an acid
concentration of 0.5% (w/v). For nine strains evaluated, lactic acid was the most effective
for reducing the viable cell population, and HCl was the least effective, with the order of
acetic, citric, and malic acid sensitivity varying in a strain-dependent manner. Chung et al.
4 examined the effect of chitosan on two major waterborne pathogens, E. coli and S.
aureus, and showed that organic acids with low carbon number were better solvents for
183
chitosan than inorganic acids as it induced higher inhibition versus those bacteria. These
previous results, however, were inconsistent with our study, which might be due to
different types of applications applied in each study, as solubility of chitosan salt films
varied directly impacting their antibacterial activity in the aqueous solution. As
mentioned in the structural characteristics based upon CI and FT-IR, CF and RF altered
CI or FT-IR among various types of chitosan salt films, which can be related to the
antibacterial activity. CI of non-rinsed β-chitosan acetate and hydrochloride films were
relatively lower than that of non-rinsed α-chitosan acetate and hydrochloride films, which
was consistent with the result of PI showing higher PI in β-chitosan acetate and
hydrochloride films than other chitosan salt films since lower CI has been shown to
increase the solubility of chitosan films in aqueous solution 35, 36. This lead to the release
of active fragments (e.g. protonated glucosamine) from the chitosan salt films, which
were thought to interact with the cell membrane in the suspended cells, resulting in cell
death 3, 37.
Most forms of chitosan films showed no significant change in PI against E. coli after
rinsing (Table 7.3). However, β-chitosan acetate and hydrochloride films both showed
significant reductions in PI after rinsing. This result could be related to the structural
changes, as rinsed films also showed a lower intensity FT-IR peaks in the broad bands
associated with OH or NH groups compared with those of non-rinsed films (Fig. 7.4).
One explanation would be the hydrogen bonds formed with OH or NH functional groups
in chitosan film complex becoming dissociated during rinsing, which should in turn
release active fragments from the chitosan salt film complex into the rinsing solution.
Also, intensities of the peaks of β-chitosan salt films were significantly lower than those
184
of α-chitosan salt films after rinsing and drying (Fig. 7.3 and 7.4), indicating that
structural characteristics of films were altered depending on CF. Furthermore, as the
release of residual acid compounds and/or active fragments are one of the proposed
mechanisms suggested to explain the antibacterial activity of cast films, it follows that
films which have a less ordered structure would be more likely to release said
compounds/fragments. This seems to be the case, as the β-chitosan acetate and
hydrochloride films showed the greatest reduction in activity due to rinsing as well as the
lowest initial CI.
The transmittance (T, %) of rinse solutions provided further insights about the effect
of RF on antibacterial activity (Table 7.3). Decreases in transmittance were most likely
caused by increases in suspended compounds/fragments released from the film. Being
insoluble, these compounds would increase the turbidity of the rinse solution, thereby
lowering T(%), and as these compounds are thought to contribute to antibacterial activity,
a rinse solution which showed a significantly low T (%), should mean that the film which
was rinsed therein would have a much lower PI. This seems to be borne out, as the β-
chitosan hydrochloride film rinse solution showed lowest T (15.55%) and significant
decreases in PI in rinsed films in comparison with non-rinsed film. Hence, the
contribution of acid to antibacterial activity of films can be estimated by significantly
decrease of PI in rinsed acetate and hydrochloride films than non-rinsed films due to
significant loss of active compounds (i.e. protonated glucosamine) or any residual acids
after rinsing of films.
CONCLUSIONS
185
In this study, we attempted to isolate and estimate the contribution of chitosan from
the contribution of acidulant in acidic solutions of α- and β-chitosan and films formed
from the solutions. We also sought to gain further insight into the various factors that
influence the antibacterial activity of chitosan solutions and films. Comparing the
antibacterial activity of chitosan solutions with acid solutions by additional inhibition (AI)
calculations allowed us to quantify the contributions of both components, revealing a
complex interplay between chitosan form, acid type, Mw, and bacterial species. The
separation of the contribution of acid to the antibacterial activity of films was
accomplished by comparing PI between cast films and films which had been rinsed to
remove any residual acids in the film complex. The phenomena involved in the
antibacterial activity of both films and solutions were quite complex and depended not
only on a series of factors, but also upon the interactions between them. In chitosan
solutions, it was found that while the dissolving acid provided some antibacterial effect,
the chitosan itself also contributed. It was also found that the differing forms (α vs. β) and
molecular weights of chitosan had differing activities, with lower molecular weights
tending to have lower antibacterial effects, as has been shown in various earlier studies.
The actual mechanism involved in this inactivation appears to be quite complex, but
related to both the cellular adsorption of chitosan and the induction of cellular leakage,
and influenced by the properties of the bacteria, chitosan forms, and the acid types used
to solubilize it. In general, higher Mw corresponded with greater levels of adsorption and
E. coli was more prone to cellular leakage. The mechanisms involved in the antibacterial
activity of cast films proved even more complex. While the antibacterial activity against
L. innocua did not differ significantly across the various factors, the activity against E.
186
coli varied depending on acid types and whether or not the film had been rinsed. The
effects of rinsing also varied depending on whether α or β chitosan were used to prepare
the film. Investigation into the structural and physical changes imparted by rinsing
revealed notable changes in the structure of the film due to rinsing in general, with some
combinations of chitosan and acid being more pronounced than others.
ACKNOWLEDGEMENT
The authors would like to thank Mr. Mark Ludlow at Dosidicus LLC, USA for
providing squid pens and to Dr. John Simonsen at the Department of Wood Science,
Oregon State University for his assistance with the FT-IR analysis.
187
REFERENCES
1. Tsai, G.J.; Su, W.H., Antibacterial activity of shrimp chitosan against Escherichia coli. Journal of Food Protection 1999, 62 (3), 239-243.
2. Cuero, R. G.; Osuji, G.; Washington, A., N-carboxymethylchitosan inhibition of
aflatoxin production: Role of zinc. Biotechnology Letters 1991, 13 (6), 441-444. 3. Fernandez-Saiz, P.; Lagaron, J. M.; Ocio, M. J., Optimization of the biocide
properties of chitosan for its application in the design of active films of interest in the food area. Food Hydrocolloids 2009, 23 (3), 913-921.
4. Chung, Y. C.; Su, Y. P.; Chen, C. C.; Jia, G.; Wang, H. L.; Lin, J. G.,
Relationship between antibacterial ativity of chitosan and surface characteristics of cell wall. Acta Pharmacol Sin. 2004, 25 (7), 932-936.
5. No, H. K.; Park, N. Y.; Lee, S. H.; Hwang, H. J.; Meyers, S. P., Antibacterial activities of chitosans and chitosan oligomers with different molecular weights on spoilage bacteria isolated from Tofu. Journal of Food Science 2002, 67 (4), 1511-
1514. 6. Zhong, Z.; Xing, R.; Liu, S.; Wang, L.; Cai, S.; Li, P., Synthesis of acyl thiourea
derivatives of chitosan and their antimicrobial activities in vitro. Carbohydrate Research 2008, 343 (3), 566-570.
7. Kong, M.; Chen, X.G.; Xue, Y.P.; Liu, C.S.; Yu, L.J.; Ji, Q.X.; Cha, D.; Park, H.,
Preparation and antibacterial activity of chitosan microshperes in a solid dispersing system. Frontiers of Materials Science in China 2008, 2 (2), 214-220.
8. Tikhonov, V. E.; Stepnova, E. A.; Babak, V. G.; Yamskov, I. A.; Palma-Guerrero, J.; Jansson, H.-B.; Lopez-Llorca, L. V.; Salinas, J.; Gerasimenko, D. V.; Avdienko, I. D.; Varlamov, V. P., Bactericidal and antifungal activities of a low
molecular weight chitosan and its N-/2(3)-(dodec-2-enyl)succinoyl/-derivatives. Carbohydrate Polymers 2006, 64 (1), 66-72.
9. Yoshihiko, O.; Mayumi, S.; Takahiro, A.; Hiroyuki, S.; Yoshihiro, S.; Ichiro, N., Antimicrobial activity of chitosan with different degrees of acetylation and molecular weights. Biocontrol Science 2003, 8, 25-30.
10. Ignatova, M.; Starbova, K.; Markova, N.; Manolova, N.; Rashkov, I., Electrospun nano-fibre mats with antibacterial properties from quaternised chitosan and
poly(vinyl alcohol). Carbohydrate Research 2006, 341 (12), 2098-2107. 11. Gerasimenko, D. V.; Avdienko, I. D.; Bannikova, G. E.; Zueva, O. Y.; Varlamov,
V. P., Antibacterial effects of water-soluble lowmolecular-weight chitosans on
different microorganisms. Applied Biochemistry and Microbiology 2004, 40 (3), 253-257.
12. Kim, K. W.; Thomas, R. L.; Lee, C.; Park, H. J., Antimicrobial activity of native chitosan, degraded chitosan, and o-carboxymethylated chitosan. Journal of Food Protection 2003, 66 (8), 1495-1498.
13. Lin, S.B.; Chen, S.H.; Peng, K.C., Preparation of antibacterial chito-oligosaccharide by altering the degree of deacetylation of β-chitosan in a
Trichoderma harzianum chitinase-hydrolysing process. Journal of the Science of Food and Agriculture 2009, 89 (2), 238-244.
188
14. No, H. K.; Young Park, N.; Ho Lee, S.; Meyers, S. P., Antibacterial activity of chitosans and chitosan oligomers with different molecular weights. International
Journal of Food Microbiology 2002, 74 (1??), 65-72. 15. Han, J. H., Antimicrobial food packaging. CRC Press LLC: Boca Raton FL, 2003. 16. Liu, N.; Chen, X.G.; Park, H.J.; Liu, C.G.; Liu, C.S.; Meng, X.H.; Yu, L.J., Effect
of MW and concentration of chitosan on antibacterial activity of Escherichia coli. Carbohydrate Polymers 2006, 64 (1), 60-65.
17. Jung, J.; Zhao, Y., Characteristics of deacetylation and depolymerization of β-chitin from jumbo squid (Dosidicus gigas) pens. Carbohydrate Research 2011, 346 (13), 1876-1884.
18. Mao, S.; Shuai, X.; Unger, F.; Simon, M.; Bi, D.; Kissel, T., The depolymerization of chitosan: effects on physicochemical and biological
properties. International Journal of Pharmaceutics 2004, 281 (1??), 45-54. 19. No, H. K.; Lee, S. H.; Park, N. Y.; Meyers, S. P., Comparison of physicochemical,
binding, and antibacterial properties of chitosans prepared without and with
deproteinization process. Journal of Agricultural and Food Chemistry 2003, 51 (26), 7659-7663.
20. Chang, K. L. B.; Tsai, G.; Lee, J.; Fu, W.R., Heterogeneous N-deacetylation of chitin in alkaline solution. Carbohydrate Research 1997, 303 (3), 327-332.
21. Focher, B.; Beltrame, P. L.; Naggi, A.; Torri, G., Alkaline N-deacetylation of
chitin enhanced by flash treatments. Reaction kinetics and structure modifications. Carbohydrate Polymers 1990, 12 (4), 405-418.
22. Tsai, G. J. S., W.H., Antibacterial Activity of Shrimp Chitosan against Escherichia coli. Journal of Food Protection. 1999, 62 (3), 239-243.
23. Ramos-Ponce, L.; Vega, M.; Sandoval-Fabin, G.; Colunga-Urbina, E.;
Balagurusamy, N.; Rodriguez-Gonzalez, F.; Contreras-Esquivel, J., A simple colorimetric determination of the free amino groups in water soluble chitin
derivatives using genipin. Food Science and Biotechnology 2010, 19 (3), 683-689. 24. Sudarshan, N. R.; Hoover, D. G.; Knorr, D., Antibacterial action of chitosan.
Food Biotechnol. 1992, 6 (3), 257-272.
25. Schatz, C.; Viton, C.; Delair, T.; Pichot, C.; Domard, A., Typical physicochemical behaviors of chitosan in aqueous solution. Biomacromolecules 2003, 4 (3), 641-
648. 26. Jia, Z.; shen, D.; Xu, W., Synthesis and antibacterial activities of quaternary
ammonium salt of chitosan. Carbohydrate Research 2001, 333 (1), 1-6.
27. R Muzzarelli, R. T., O Filippini, E Giovanetti, G Biagini, and P E Varaldo, Antimicrobial properties of N-carboxybutyl chitosan. Antimicrob. Agents
Chemother 1990, 34, 2019-2023. 28. Uchida, Y.; Izume, M.; Ohtakara, A., Preparation of chitosan oligomers with
purified chitosanase and its application. Elsevier: London, 1989.
29. Fernandes, J. C.; Eaton, P.; Gomes, A. M.; Pintado, M. E.; Xavier Malcata, F., Study of the antibacterial effects of chitosans on Bacillus cereus (and its spores)
by atomic force microscopy imaging and nanoindentation. Ultramicroscopy 2009, 109 (8), 854-860.
189
30. Lima, I. S.; Airoldi, C., A thermodynamic investigation on chitosan-divalent cation interactions. Thermochimica Acta 2004, 421 (1??), 133-139.
31. Oh, H. S.; Nam, K. T., Invited Paper: Application of chitin and chitosan toward electrochemical hybrid device. Electronic Materials Letters, 2011, 7 (1), 13-16.
32. Kawada, J.; Yui, T.; Okuyama, K.; Ogawa, K., Crystalline behavior of chitosan
organic acid salts. Bioscience, Biotechnology, and Biochemistry 2001, 65 (11), 2542-2547.
33. Begin, A.; Van Calsteren, M.R., Antimicrobial films produced from chitosan. International Journal of Biological Macromolecules 1999, 26 (1), 63-67.
34. Buchanan, R. L.; Edelson, S. G., pH-dependent stationary-phase acid resistance
response of enterohemorrhagic Escherichia coli in the presence of various acidulants. Journal of Food Protection 1999, 62 (3), 211-218.
35. Du, J.; Hsieh, Y.L., PEGylation of chitosan for improved solubility and fiber formation via electrospinning. Cellulose 2007, 14 (6), 543-552.
36. Sogias, I. A.; Khutoryanskiy, V. V.; Williams, A. C., Exploring the factors
affecting the solubility of chitosan in water. Macromolecular Chemistry and Physics 2010, 211 (4), 426-433.
37. Chen, J. L.; Zhao, Y., Effect of molecular weight, acid, and plasticizer on the physicochemical and antibacterial properties of β-chitosan based films. Journal of Food Science 2012, 77 (5), E127-E136.
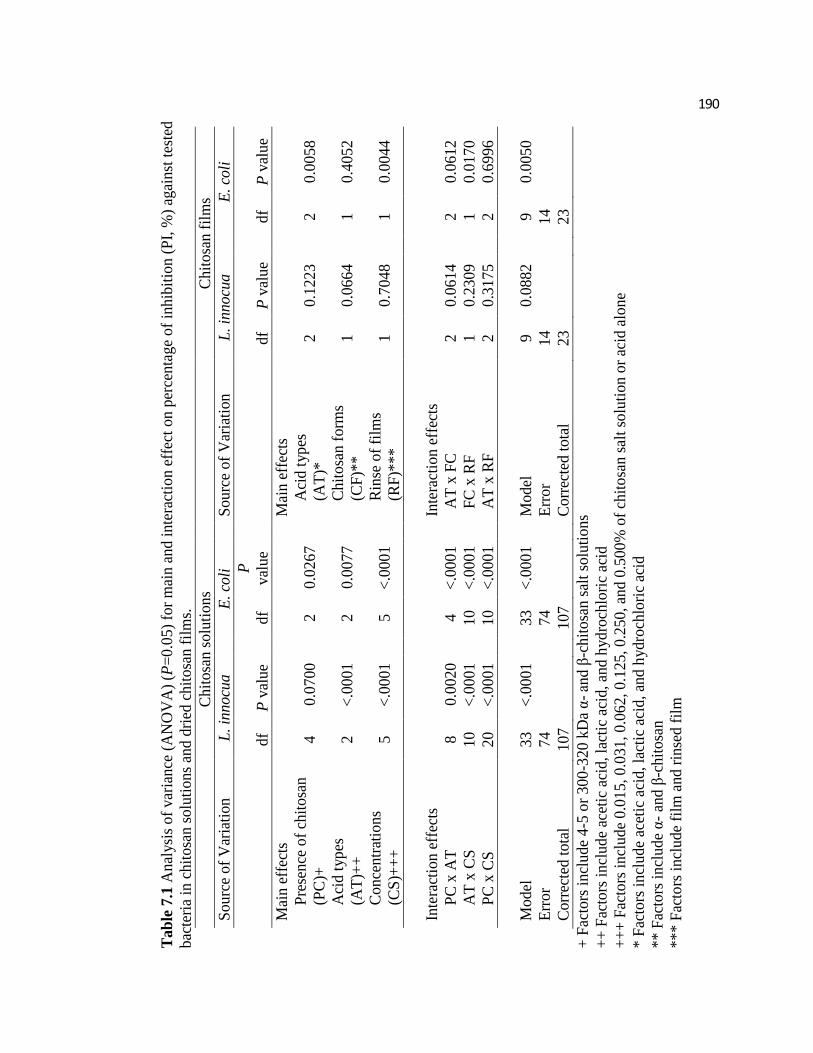
190
Tab
le 7
.1 A
nal
ysi
s of
var
iance
(A
NO
VA
) (P
=0.0
5)
for
mai
n a
nd i
nte
ract
ion e
ffec
t on p
erce
nta
ge
of
inhib
itio
n (
PI,
%)
agai
nst
tes
ted
bac
teri
a in
chit
osa
n s
olu
tions
and d
ried
chit
osa
n f
ilm
s.
C
hit
osa
n s
olu
tion
s
C
hit
osa
n f
ilm
s
Sourc
e of
Var
iati
on
L
. in
nocu
a
E
. co
li
S
ourc
e of
Var
iati
on
L
. in
nocu
a
E
. co
li
df
P v
alue
df
P
val
ue
df
P v
alue
df
P v
alue
Mai
n e
ffec
ts
Mai
n e
ffec
ts
Pre
sence
of
chit
osa
n
(PC
)+
4
0.0
700
2
0.0
267
A
cid t
yp
es
(AT
)*
2
0.1
223
2
0.0
058
Aci
d t
yp
es
(AT
)++
2
<.0
001
2
0.0
077
C
hit
osa
n f
orm
s
(CF
)**
1
0.0
664
1
0.4
052
Conce
ntr
atio
ns
(CS
)++
+
5
<.0
001
5
<.0
001
R
inse
of
film
s
(RF
)***
1
0.7
048
1
0.0
044
Inte
ract
ion
eff
ects
In
tera
ctio
n e
ffec
ts
P
C x
AT
8
0.0
020
4
<.0
001
A
T x
FC
2
0.0
614
2
0.0
612
A
T x
CS
10
<.0
001
10
<.0
001
F
C x
RF
1
0.2
309
1
0.0
170
P
C x
CS
20
<.0
001
10
<.0
001
A
T x
RF
2
0.3
175
2
0.6
996
Model
33
<.0
001
33
<.0
001
M
odel
9
0.0
882
9
0.0
050
Err
or
74
74
Err
or
14
14
Corr
ecte
d t
ota
l 107
107
C
orr
ecte
d t
ota
l 23
23
+
Fac
tors
incl
ude
4-5
or
300
-320 k
Da
α-
and β
-ch
itosa
n s
alt
solu
tions
++
Fac
tors
incl
ud
e ac
etic
aci
d, la
ctic
aci
d, an
d h
yd
roch
lori
c ac
id
++
+ F
acto
rs i
ncl
ude
0.0
15, 0.0
31,
0.0
62, 0.1
25, 0.2
50, an
d 0
.500%
of
chit
osa
n s
alt
solu
tion o
r ac
id a
lone
* F
acto
rs i
ncl
ude
acet
ic a
cid, la
ctic
aci
d,
and h
ydro
chlo
ric
acid
** F
acto
rs i
ncl
ude
α-
and
β-c
hit
osa
n
*** F
acto
rs i
ncl
ude
film
and r
inse
d f
ilm

191
Ta
ble
7.2
Ass
essm
ent
of
bac
teri
al c
ellu
lar
leak
age
by β
-gal
acto
sid
ase
assa
y i
n 0
.1 o
r 1
.0%
of
4-5
kD
a o
r 3
00
-32
0 k
Da
α-
and
β-
chit
osa
n a
ceta
te,
lact
ate,
an
d h
yd
roch
lori
de
solu
tio
ns
com
par
ed w
ith
aci
d a
lon
e.
L.
inn
ocu
a
E.
coli
Typ
e o
f ac
id
Typ
e o
f ac
id
Tre
atm
ents
Co
nce
ntr
atio
ns
of
acid
or
chit
osa
n (
%)
Ace
tic
acid
L
acti
c ac
id
HC
l A
ceti
c ac
id
Lac
tic
acid
H
Cl
Co
ntr
ol
*
0.1
*
*A
0.0
71
a*
**
C
0.0
61
a
B 0
.07
4 a
B
0.9
40
a
A 0
.88
1 a
A
0.8
80
a
α-3
00
kD
a 0
.1
A 0
.08
3 a
C
0.0
61
a
B 0
.08
2 a
C
0.8
31
a
A 0
.85
0 a
A
B 0
.80
2 a
β-3
20
kD
a 0
.1
A 0
.05
0 b
C
0.0
46
b
B 0
.08
7 a
A
1.2
02
a
A 0
.88
0 b
B
0.6
84
c
α-5
kD
a 0
.1
A 0
.19
0 c
A
1.6
36
a
A 1
.13
2 b
B
C 0
.89
8 a
A
0.9
37
a
A 0
.89
1 a
β-4
kD
a 0
.1
A 0
.27
1 a
B
0.1
48
a
B 0
.22
3 a
B
C 0
.85
1 a
A
0.8
24
a
A 0
.84
6 a
Co
ntr
ol
1
.0
A 0
.18
5 a
C
0.0
67
b
B 0
.08
0 a
b
B 0
.49
4 a
C
0.5
80
a
A 0
.53
9 a
α-3
00
kD
a 1
.0
B 0
.04
0 b
C
0.0
81
a
B 0
.05
1 a
b
B 0
.48
1 b
A
0.8
71
a
A 0
.51
2 b
β-3
20
kD
a 1
.0
B 0
.06
4 a
C
0.0
71
a
B 0
.04
7 a
A
B 0
.58
5 b
A
B 0
.76
0 a
A
0.6
39
ab
α-5
kD
a 1
.0
B 0
.08
9 b
B
0.6
98
a
B 0
.06
9 b
A
0.6
64
a
AB
0.7
49
a
A 0
.71
9 a
β-4
kD
a 1
.0
A 0
.19
3 c
A
0.9
87
a
A 0
.47
4 b
A
B 0
.55
5 a
B
C 0
.68
3 a
A
0.5
35
a
* C
on
tro
l in
dic
ates
aci
d a
lon
e.
**
Mea
ns
pro
ceed
ed b
y t
he
sam
e ca
pit
al l
ette
r in
th
e sa
me
colu
mn
wit
hin
th
e sa
me
con
cen
trat
ion
wer
e n
ot
sign
ific
antl
y d
iffe
ren
t
(P>
0.0
5).
**
* M
ean
s p
rece
ded
by t
he
sam
e sm
all
lett
er i
n t
he
sam
e ra
w w
ith
in b
acte
rial
sp
ecie
s w
ere
no
t si
gn
ific
antl
y d
iffe
ren
t (P
>0
.05
).
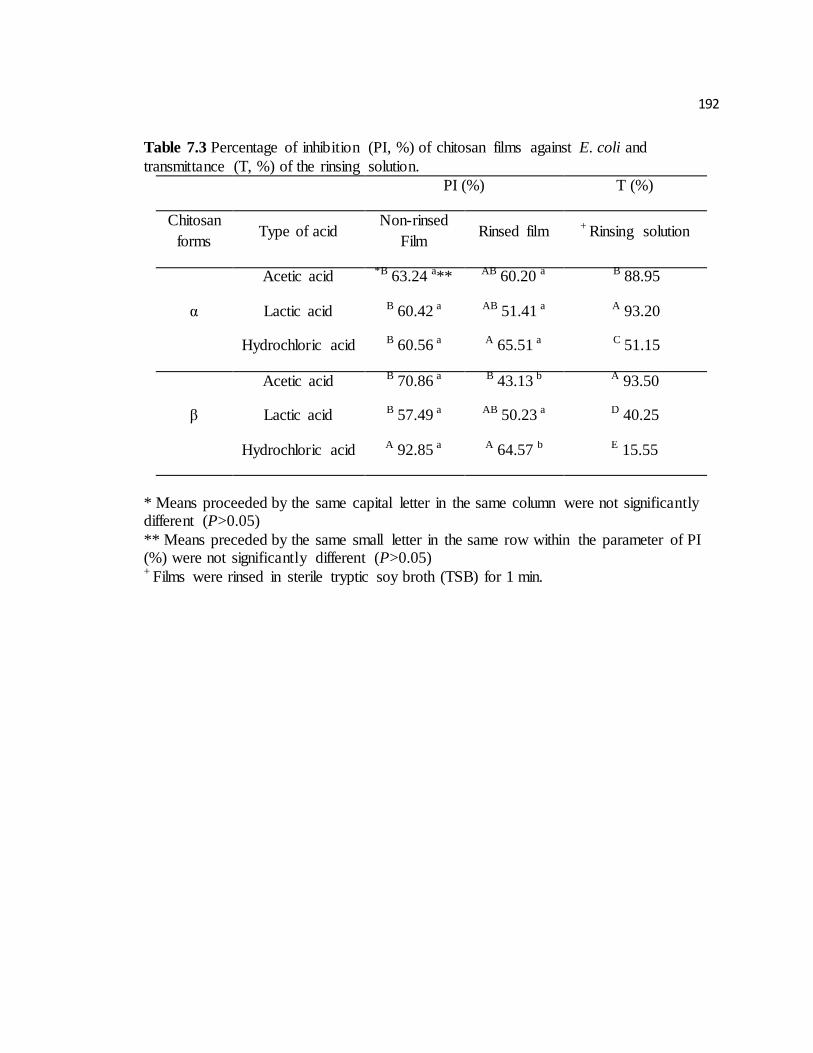
192
Table 7.3 Percentage of inhibition (PI, %) of chitosan films against E. coli and
transmittance (T, %) of the rinsing solution.
PI (%) T (%)
Chitosan
forms Type of acid
Non-rinsed
Film Rinsed film + Rinsing solution
α
Acetic acid *B 63.24 a** AB 60.20 a B 88.95
Lactic acid B 60.42 a AB 51.41 a A 93.20
Hydrochloric acid B 60.56 a A 65.51 a C 51.15
β
Acetic acid B 70.86 a B 43.13 b A 93.50
Lactic acid B 57.49 a AB 50.23 a D 40.25
Hydrochloric acid A 92.85 a A 64.57 b E 15.55
* Means proceeded by the same capital letter in the same column were not significantly different (P>0.05)
** Means preceded by the same small letter in the same row within the parameter of PI (%) were not significantly different (P>0.05) + Films were rinsed in sterile tryptic soy broth (TSB) for 1 min.
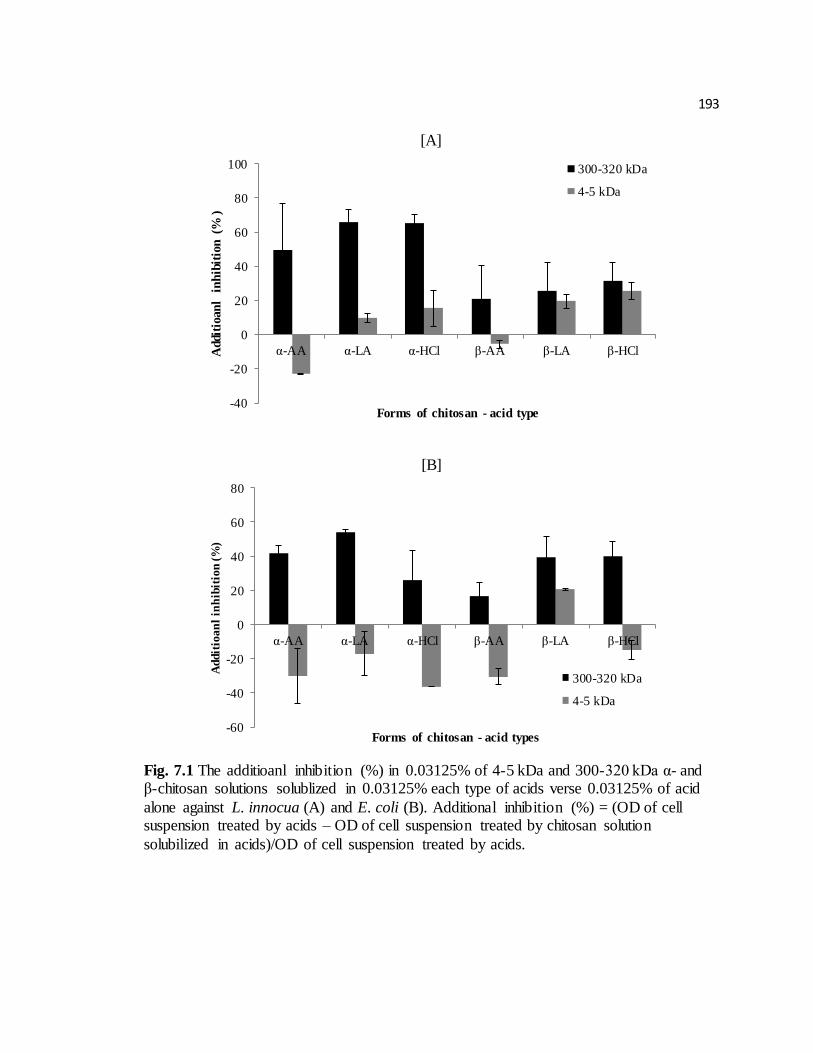
193
[A]
[B]
Fig. 7.1 The additioanl inhibition (%) in 0.03125% of 4-5 kDa and 300-320 kDa α- and β-chitosan solutions solublized in 0.03125% each type of acids verse 0.03125% of acid
alone against L. innocua (A) and E. coli (B). Additional inhibition (%) = (OD of cell suspension treated by acids – OD of cell suspension treated by chitosan solution
solubilized in acids)/OD of cell suspension treated by acids.
-40
-20
0
20
40
60
80
100
α-AA α-LA α-HCl β-AA β-LA β-HCl Addit
ioan
l in
hib
itio
n (
%)
Forms of chitosan - acid type
300-320 kDa
4-5 kDa
-60
-40
-20
0
20
40
60
80
α-AA α-LA α-HCl β-AA β-LA β-HCl
Ad
dit
ioa
nl
inh
ibit
ion
(%
)
Forms of chitosan - acid types
300-320 kDa
4-5 kDa
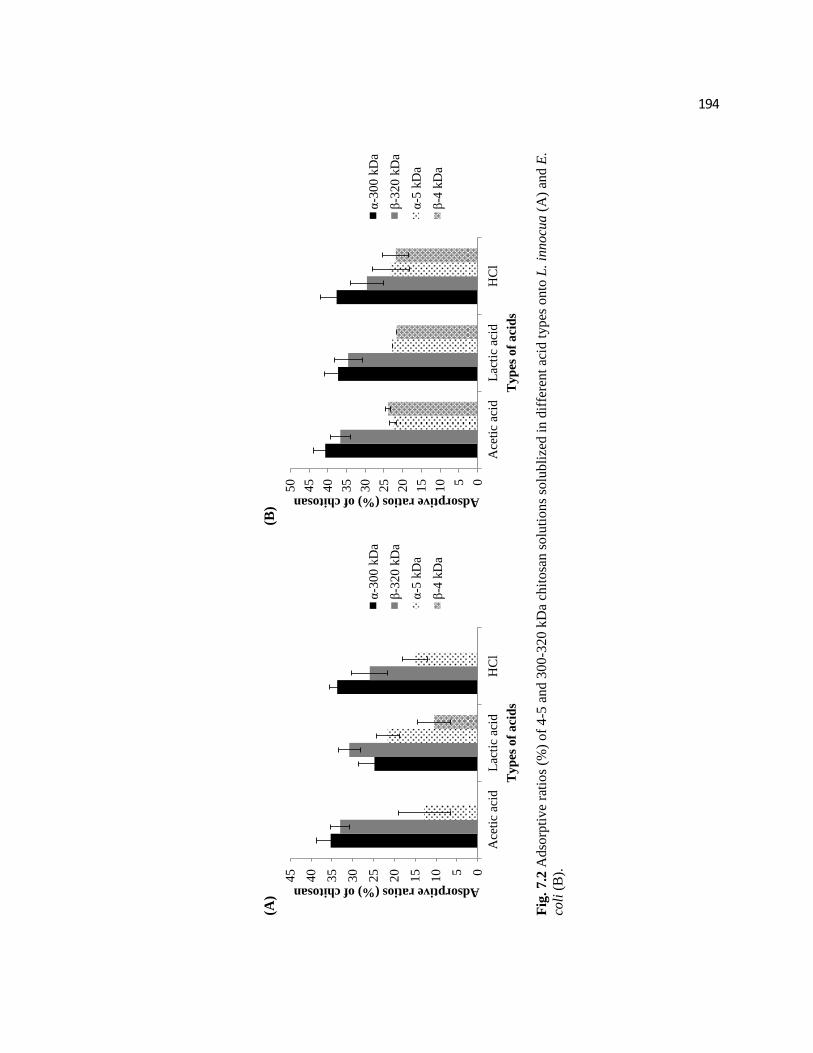
194
(A)
(B)
Fig
. 7
.2 A
dso
rpti
ve
rati
os
(%)
of
4-5
an
d 3
00
-32
0 k
Da
chit
osa
n s
olu
tio
ns
solu
bli
zed
in
dif
fere
nt
acid
typ
es o
nto
L.
inn
ocu
a (
A)
and
E.
coli
(B
).
05
10
15
20
25
30
35
40
45
Ace
tic
acid
Lac
tic
acid
HC
l
Adsorptive ratios (%) of chitosan
Typ
es o
f aci
ds
α-3
00 k
Da
β-3
20 k
Da
α-5
kD
a
β-4
kD
a
05
10
15
20
25
30
35
40
45
50
Ace
tic
acid
Lac
tic
acid
HC
l
Adsorptive ratios (%) of chitosan
Typ
es o
f aci
ds
α-3
00 k
Da
β-3
20 k
Da
α-5
kD
a
β-4
kD
a
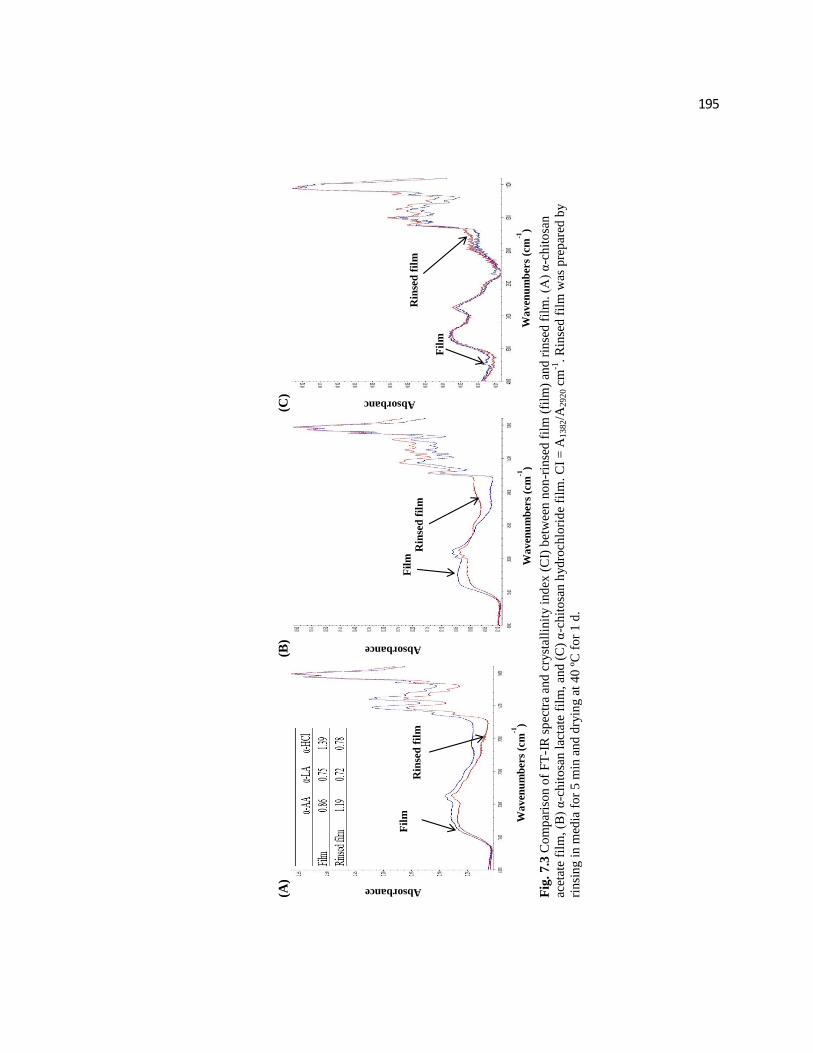
195
Fil
m
Rin
sed
fil
m
Absorbance
Wa
ven
um
ber
s (c
m-1
)
(A)
(B
)
(C)
F
ig.
7.3
Com
par
ison o
f F
T-I
R s
pec
tra
and c
ryst
alli
nit
y i
ndex
(C
I) b
etw
een n
on
-rin
sed f
ilm
(fi
lm)
and r
inse
d f
ilm
. (A
) α
-chit
osa
n
acet
ate
film
, (B
) α
-chit
osa
n l
acta
te f
ilm
, an
d (
C)
α-c
hit
osa
n h
ydro
chlo
rid
e fi
lm. C
I =
A1
382/A
292
0 c
m-1
. R
inse
d f
ilm
was
pre
par
ed b
y
rinsi
ng i
n m
edia
fo
r 5 m
in a
nd d
ryin
g a
t 40 º
C f
or
1 d
.
Fil
m R
inse
d f
ilm
Absorbance
Wa
ven
um
ber
s (c
m-1
)
Fil
m
Rin
sed
fil
m
Absorbanc
e
Wa
ven
um
ber
s (c
m-1
)
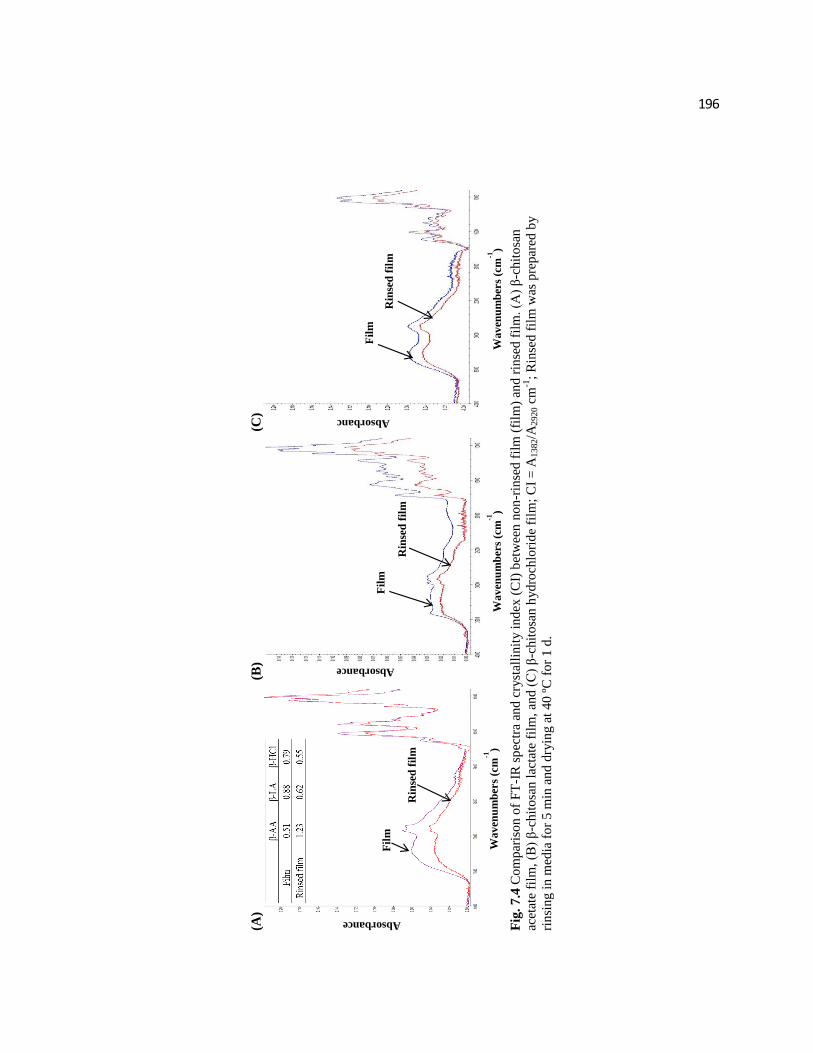
196
Fil
m
Rin
sed
fil
m
Absorbance
Wa
ven
um
ber
s (c
m-1
)
(A)
(B
)
(C)
F
ig.
7.4
Com
par
ison o
f F
T-I
R s
pec
tra
and c
ryst
alli
nit
y i
ndex
(C
I) b
etw
een n
on
-rin
sed f
ilm
(fi
lm)
and r
inse
d f
ilm
. (A
) β
-chit
osa
n
acet
ate
film
, (B
) β
-chit
osa
n l
acta
te f
ilm
, an
d (
C)
β-c
hit
osa
n h
ydro
chlo
rid
e fi
lm;
CI
= A
13
82/A
2920 c
m-1
; R
inse
d f
ilm
was
pre
par
ed b
y
rinsi
ng i
n m
edia
fo
r 5 m
in a
nd d
ryin
g a
t 40 º
C f
or
1 d
.
Fil
m
Rin
sed
fil
m
Absorbance
Wa
ven
um
ber
s (c
m-1
)
Fil
m
Rin
sed
fil
m
Absorbanc
e
Wa
ven
um
ber
s (c
m-1
)

197
![ΧΡΗΜΑΤΟΟΙΚΟΝΟΜΙΚΗ ΑΝΑΛΥΣΗ ΤΗΣ ΕΤΑΙΡΙΑΣ JUMBO …nefeli.lib.teicrete.gr/browse/sdo/acfi/2014/MakriChristianna,PogkaZoi/attached... · [7] ΠΡΟΛΟΓΟΣ](https://static.fdocument.org/doc/165x107/5e22e07f005f823b102d568b/oeoe-jumbo.jpg)