Demonstration of Negative Group Delays in a Simple Electronic Circuit

Negative Refractive Index andMetamaterials
Jean Diehl
Institut für Theoretische PhysikGoethe-Universität, Frankfurt
July 6th, 2011
1 / 12

Contents
1 Negative Refractive IndexMaxwell’s Equations in MatterRefractive IndexPhenomena and Resulting Applications
2 MetamaterialsOverview of Materials
3 Outlook
2 / 12
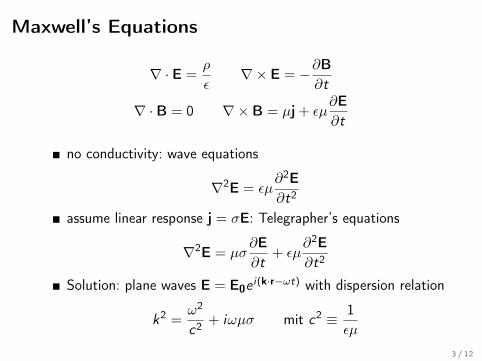
Maxwell’s Equations
∇ · E =ρ
ε∇× E = −∂B
∂t
∇ · B = 0 ∇× B = µj + εµ∂E∂t
no conductivity: wave equations
∇2E = εµ∂2E∂t2
assume linear response j = σE: Telegrapher’s equations
∇2E = µσ∂E∂t
+ εµ∂2E∂t2
Solution: plane waves E = E0e i(k·r−ωt) with dispersion relation
k2 =ω2
c2 + iωµσ mit c2 ≡ 1εµ
3 / 12
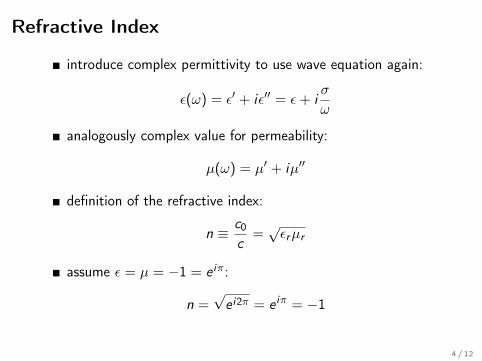
Refractive Index
introduce complex permittivity to use wave equation again:
ε(ω) = ε′ + iε′′ = ε+ iσ
ω
analogously complex value for permeability:
µ(ω) = µ′ + iµ′′
definition of the refractive index:
n ≡ c0
c=√εrµr
assume ε = µ = −1 = e iπ:
n =√
e i2π = e iπ = −1
4 / 12
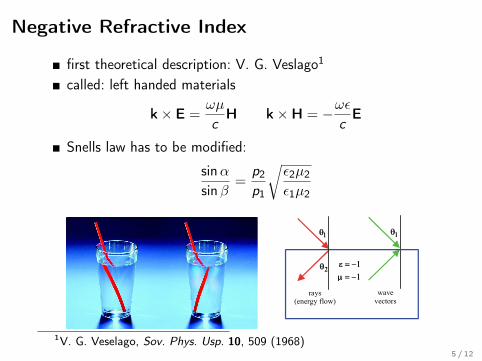
Negative Refractive Index
first theoretical description: V. G. Veslago1
called: left handed materials
k× E =ωµ
cH k×H = −ωε
cE
Snells law has to be modified:
sinαsinβ
=p2
p1
√ε2µ2
ε1µ2
be associated with a propagation constant and, in turn, with an effective refractive index.
Second, does the material exhibit a nega-tive phase velocity? In other words, how can we tell that the phase of a forward-moving wave is moving backwards inside the mate-rial? This might be possible if, to measure a beam deflected in the ‘wrong’ direction, we apply Snell’s law9, which relates the angles of incidence and refraction of a wave. However, even everyday optical materials, such as a bath-room mirror, may at least partially display the effects of negative refraction yet have a positive refractive index10. Indeed, it is now established that negative refraction can occur in materials displaying anisotropy, such as calcite, and in two- or three-dimensionally structured mate-rials such as photonic crystals11.
To identify the signatures of negative refrac-tion from a negative refractive index, Valentine et al.2 combined experimental results with theoretical modelling. Experimentally, the authors did turn to Snell’s law to determine the refractive index, but crucially they retrieved its value from the far-field transmission pattern of a prism configuration representing a signa-ture of the (backward) phase evolution inside the metamaterial. Together with supporting theoretical simulations that show a backward-moving phase inside the prism, this strongly indicates that Valentine and colleagues’ fishnet structure is indeed a three-dimensional mater-ial with a negative refractive index.
Another point in considering Valentine and colleagues’ material is whether, when light is shone onto it, the light lost passing through it is low. To be useful, materials should certainly not absorb all light. However, because the con-stituent elements of a metamaterial, particu-larly metals, always exhibit a loss in some part of the frequency spectrum, the engineering of losses is an important task. A promising solu-tion is to use nano-structuring (tightly coupled
BIOCHEMISTRY
Divergence from the superfamilyLawrence J. Marnett
The unique structure of an enzyme that synthesizes lipid mediators in plants defines its function and serves as a characteristic footprint in genomes of plants and some animals.
In plants and animals, molecular signalling pathways that are mediated by metabolites of polyunsaturated fatty acids are essential for communication at cellular and organismal lev-els. For example, the plant metabolites known as jasmonates and green-leaf volatiles control not only growth but also responses to wound-ing and infection1,2, and contribute to the characteristic taste and smell of certain plants. Jasmonates and green-leaf volatiles are formed from fatty-acid hydroperoxides through the action of the allene oxide synthase (AOS) and hydroperoxide lyase (HPL) enzymes, respec-tively3,4. Exactly how these enzymes react with their hydroperoxide substrates has remained unclear. The crystal structures of AOS — as
free enzyme and in complex with substrate and intermediate analogues — are presented by Lee et al.5 on page 363 of this issue, and provide fascinating clues.
Both AOSs and HPLs are members of the CYP74 family, which belongs to the cytochrome P450 (CYP) superfamily. CYP proteins contain a haem group, and are defined by the character-istic absorption of their ferrous carbon monox-ide complex at a wavelength of 450 nanometres. These enzymes catalyse oxidation reactions that are central to many metabolic pathways in a wide range of organisms — for example, they mediate steroid biosynthesis in humans and nutrient breakdown in bacteria6. To do this, they take two electrons from a reduct-
nano-plasmonic resonators) to simultaneously increase the bandwidth and effectively shift the losses to a frequency range where the optics is not impaired. In this respect, the metamate-rial described by Valentine et al.2 scores very well, with a record-breaking ‘figure of merit’ of 3.5, indicating low loss. In addition, this meta-material displays a negative refractive index over a remarkably wide window of the spec-trum, ranging from around 1,800 nm to less than 1,500 nm.
Finally, what uses might there be for a broadband, low-loss, three-dimensional optical
material with a negative refractive index? First, it would be a way of constructing Pendry’s per-fect lens4, and thus imaging a three-dimensional object the size of a molecule. Second, it would be beneficial for electromagnetic cloaking1 and its applications, in that a cloaking material that absorbs less radiation will ideally prevent the cloaked object from appearing as a dark silhou-ette. Third, the ability to slow down and store broadband light using the ‘trapped rainbow’ principle12 has clearly come closer to reality.
Saying goodbye to Flatland and entering Spaceland was not only a great achievement for A. Square, the protagonist in Abbott’s novella. It is also a promising step towards producing optical negative-index metamaterials. The prospects that this step offers for research involving the control and manipulation of light could hardly be more exciting. ■
Ortwin Hess is at the Advanced Technology Institute and Department of Physics, University of Surrey, Guildford GU2 7XH, UK. e-mail: [email protected]
1. Pendry, J. B., Shurig, D. & Smith, D. R. Science 312, 1780–1782 (2006).
2. Valentine, J. et al. Nature 455, 376–379 (2008). 3. Veselago, V. G. Sov. Phys. Usp. 10, 509–514 (1968). 4. Pendry, J. B. Phys. Rev. Lett. 85, 3966–3969 (2000).5. Shalaev, V. M. Nature Photonics 1, 41-48 (2007).6. Abbott, E. A. Flatland (Seeley, 1884).7. Hoffman, A. J. et al. Nature Mater. 6, 946–950
(2007).8. Yao, J. et al. Science 321, 930 (2008).9. Born, M. & Wolf, E. Principles of Optics (Cambridge Univ.
Press, 1999).10. Wegener, M., Dolling, G. & Linden, S. Nature Mater. 6,
475–476 (2007). 11. Cubukcu, E. et al. Nature 423, 604–605 (2003). 12. Tsakmakidis, K. L., Boardman, A. D. & Hess, O. Nature 450,
397–401 (2007).
Figure 1 | Negative refraction. The difference in the optical density of air and ‘normal’ water (left) causes a straw in a glass of water to seem to be shifted at the interface and slightly enlarged inside the liquid. In ‘negative-index water’ (right), the straw would seem to continue in ‘the wrong direction’. This is the principle that applies to negative-index metamaterials, such as that created by Valentine et al.2.
E. S
CH
REM
PP/S
PL
300
NATURE|Vol 455|18 September 2008NEWS & VIEWS
J. B. Pendry 2
Dispersion is an unavoidable aspect of negative refraction [2] and failing to take account of it can quickly lead to nonsensical results.
1θ1θ
2θ 11
ε = −µ = −
rays(energy flow)
wavevectors
11
211µ = −
Figure 2. In a double negative material as described by Veselago, light makes a negative angle with the normal. Note that the parallel component of the wave vector is always preserved in transmission, but that energy flow is opposite to the wave vector. This picture has been shown to be consistent with a negative refractive index.
These novel concepts generated considerable interest at the time but absence of any material realisation led to their eventual neglect. However in recent times it has been proposed that novel electromagnetic properties can be realised by micro-structuring a material on a scale much less than the wavelength [3, 4, 5]. These advances, described in section 2, enabled the field to move into an experimental phase. A short review of progress can be found in [6]. It was Smith et al [7] who first constructed and demonstrated a material in which the sign of the electrical permittivity, ε , and magnetic permeability, µ , were simultaneously negative and the same team verified the predicted negative refraction angle in a subsequent experiment[8]. Their work led to an explosion of interest in the field.
Refraction at an interface is commonly described by n the refractive index and we can show that causality forces us to choose a negative sign for the refractive index when both ε and µ are negative. Conventionally we take n as
given by εµ and, where both ε and µ are positive, choose the positive sign for the square root. However causality requires that both ε and µ have small positive imaginary parts representing the fact that real systems are always slightly lossy. Imagine that as we vary the frequency the real part of ε passes through zero, where there is a branch point in ε . By virtue of the small positive imaginary part of ε the causal solution forces us to take a trajectory above the branch point giving a
positive imaginary value to ε when 0ε < . A similar argument holds for µ and therefore,
, 0, 0r rn = − εµ ε < µ <
All the properties of these double negative materials are consistent with a negative refractive index, and it is now common to use the term ‘negatively refracting’ to describe these double negative materials.
In view of the role of causality in guiding us to physically correct solutions, we shall henceforth prefer to write 1ε → − rather than 1ε = − , with a similar convention for µ . Thus we stress the importance of a positive imaginary part to both ε and µ .
These conclusions on negative refraction have been disputed by some. We have seen that negative signs carry certain implications with them and have hidden consequences easy to confuse with inconsistencies. Perhaps the most forthright criticism came in a Physical Review Letter [9] entitled Wave Refraction in Negative-Index Media: Always Positive and Very Inhomogeneous. The argument ran as follows: a calculation of refraction at a positive/negative interface showed that the wavevector did indeed exhibit negative refraction as illustrated to the right in figure 2. To reveal the direction of the rays two parallel waves of slightly different frequency were incident on the sample. Motion of the interference pattern was interpreted as the group velocity of the rays. Calculations showed that inside the material the interference pattern normal did not lie parallel to the wavevector but at a positive angle to the surface normal in apparent contradiction to Veselago’s predictions, to experiment [8], and to computer simulations [10].
In fact the problem turned out to be not the calculation but its interpretation as was pointed out in a subsequent Comment [11]. Dispersion is an essential ingredient of negative materials so the two incident waves see a slightly different refractive index and are refracted through different angles. Hence the two internal wavevectors are no longer parallel, the interference pattern no longer has a normal in the direction of the group velocity, and therefore cannot be interpreted as positive refraction. A rather simple argument shows that the group velocity must always be aligned with the wavevector. An isotropic medium, assumed in the calculations, allows only two unique directions: parallel or anti-parallel to the wavevector. Only the anti-parallel choice results in energy being transported away from the interface and thus the issue is resolved in favour of negative refraction.
During the past year computer simulations and experiments have greatly clarified the picture. As a result by the middle of the year I was able to write in a piece for
1V. G. Veselago, Sov. Phys. Usp. 10, 509 (1968)5 / 12
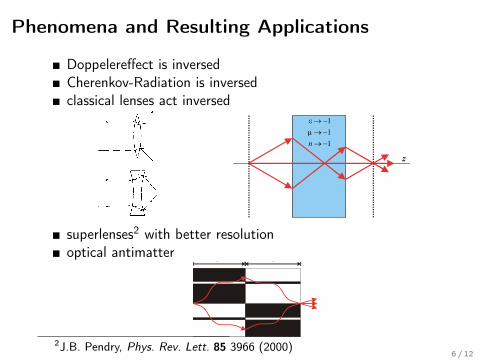
Phenomena and Resulting Applications
Doppelereffect is inversedCherenkov-Radiation is inversedclassical lenses act inversedE L E C T R O D Y N A M I C S O F S U B S T A N C E S WITH N E G A T I V E e AND 511
FIG. 3. Passage of a ray throughthe boundary between two media. 1 —incident ray; 2 — reflected ray; 3 — re-flected ray if the second medium is left-handed; 4 — refracted ray if the secondmedium is right-handed.
pendently of the rightnesses of the two media. As forthe z component, it keeps the same direction only ifthe two media are of the same Tightness. If the right-nesses are different, the z components change sign.This corresponds to the fact that in passage into amedium of different Tightness the vectors E and Hnot only change in magnitude owing to the differencein e and M but also undergo a reflection relative tothe interface of the two media. The same thing hap-pens to the vector k also. The simultaneous reflec-tion of all three vectors corresponds precisely to achange of sign of the determinant G in (6). The pathof the refracted ray produced as the result of suchreflections is shown in Fig. 3. As we see, when thesecond medium is left-handed the refracted ray lieson the opposite side of the z axis from its positionin the case of a right-handed second medium J5-' Itmust be noted that the direction of the reflected rayis always the same, independent of the rightnesses ofthe two media. It can be seen from Fig. 3 that theusual Snell's law
sin <psin ij)
(14)
has to be given a more precise form if the rightnessesof media 1 and 2 are different. The correct way towrite the formula is now
sin cp PiPi
(15)
Here pj and p2 are the rightnesses of the first andsecond media. It is clear from (15) that the index ofrefraction of two media can be negative if the right-
FIG. 4. Passage of rays of light through a plate of thickness dmade of a left-handed substance. A — source of radiation; B — de-tector of radiation.
FIG. 5. Paths of rays through lenses made of left-handed sub-stances, situated in vacuum.
nesses of the media are different. In particular, theindex of refraction of a left-handed medium relativeto vacuum is negative.'-1-'
Fresnel 's formulas are commonly used to find theamplitudes of the reflected and refracted light.*•"These formulas involve the quantities e, pi, n, q>, ij>.In order not to make mistakes one must always usethe absolute values of these quantities in Fresnel 'sformulas.
An interesting case is that of a ray passing froma medium with e4 > 0, ^ > 0 into one with e2 = —e1(
;U2 = — Mi- In this case the ray undergoes refractionat the interface between the two media, but there isno reflected ray. The use of left-handed substanceswould in principle allow the design of very unusualrefracting systems. An example of such a system isa simple plate of thickness d made of a left-handedsubstance with n = - 1 and situated in vacuum. It isshown in Fig. 4 that such a plate can focus at a pointthe radiation from a point source located at a dis-tance I < d from the plate. This is not a lens in theusual sense of the word, however, since it will notfocus at a point a bundle of rays coming from infinity.As for actual lenses, the paths of rays throughlenses made of a left-handed substance are shown inFig. 5. It is seen that the convex and concave lenseshave "changed places ," since the convex lens has adiverging effect and the concave lens a convergingeffect.
FIG. 6. Reflection of a ray propagated in a medium with ( < 0and fi < 0 from an ideally reflecting body. The source of radiationis denoted by a heavy black point.
Negative refraction 3
News and Views [12] and say that these materials were Positively Negative.
Figure 3. Boeing PhantomWorks 32° wedges. Right: negatively refracting sample, left: Teflon.
Figure 4. Angle of refraction by each of the two prisms shown in figure 3: left: data for negative sample; right: data for positive sample. The data clearly demonstrate that refraction is reversed in a negatively refracting medium.
The experiments of Parazzoli et al at Boeing [13] were amongst several experimental [14] and computational [15,16,17] demonstrations of negative refraction which confirmed the earlier results. They prepared two prisms shown in figure 3: one negatively refracting carefully constructed from low loss material, the other positively refracting but of the same physical dimensions. The deviation of a microwave beam freely propagating in air was measured for each sample and the results are shown in figure 4, the clearest demonstration that these media refract radiation through negative angles.
This period of controversy ensured that the concept of negative refraction had a full and vigorous public debate before being accepted as valid.
The new materials have many strange properties: a reversed Doppler shift (see also [18]), and Cerenkov radiation that emerges in the opposite direction to conventional radiation. The strangest property follows
directly from negative refraction and is the ability of the material to focus light. We illustrate this effect in figure 5 for the case 1n = − when focussing is free from aberration, and all rays radiating from a point source are brought to a double focus: once inside the slab and again outside. We also choose 1, 1ε → − µ → − so that the material’s impedance matches to vacuum and there is no reflection at the interface. This is a rather good lens: free from aberrations and free from spurious reflections. In fact we shall see that it is even better than that!
A lens functions by acting on all rays radiated from an object, restoring each to its proper phase at the image plane. A conventional lens ensures that each ray has the same optical path length to the image plane and therefore all the phases are correctly reproduced, except for a constant additional term which vanishes in the intensity. Our new lens is even more efficient. As the wave packets (see figure 1) enter the negative slab the phase ‘clock’ is set in reverse and winds backwards in angle so that propagation through a thickness d of this medium unwinds the phase acquired passing through the same thickness of vacuum. Wave packets arrive at the image plane with exactly the same phase as in the object plane. This is another clue to the superior nature of this lens.
z
111n
ε → −µ→ −→ −
111n
µ→ −→ −
Figure 5. A negative refractive index medium bends light to a negative angle relative to the surface normal. Light formerly diverging from a point source in the object plane is set in reverse and converges back to a point. Released from the medium the light reaches a focus for a second time in the image plane.
Now we know that we can build on this foundation and develop new applications based on the concept. Many applications are being tested for antennae and radar applications where their novel properties give added flexibility in design. New radar lenses are being developed which offer compact and relatively aberration free performance. Wave guides have been constructed which show novel dispersion characteristics as a consequences of negative fillings.
superlenses2 with better resolutionoptical antimatter
http://www.physicstoday.org DRS&JBPsubmit060404.doc at 06/04/2004 page 6 of 9 December 2003 Physics Today
By the time they reach the image they have negligible amplitude, figure 4b), and for this reason are commonly referred to as ‘the near field’, and the propagating rays as ‘the far field’.
If by some magic we could amplify the near fields we could in principle recoup their contribution, but the amplification would have to be of just the right amount and possibly very strong for the most localized components. This is a tall order but by a remarkable chance the new negative slab lens achieves this feat14.
In figure 4c) we see rays contributing to the image for the negative slab. Just as for the conventional lens, the rays only contribute details greater that about half a wavelength in diameter. In contrast the behavior of the near field is remarkably different as shown in figure 4d). It has the capacity to excite short wavelength resonances of the negative surface which are akin to the surface plasmons familiar on the surfaces of metals such as silver. Interaction with the plasmon like excitation kicks the decaying wave into the corresponding growing wave and the negative medium amplifies the wave, compensating for the decay that occurred in an equal thickness of vacuum. the resonances have a finite width and therefore this super lensing effect is a narrow band phenomenon: the requirement of 1, 1= − = −ε µ can be met only at one frequency because negative media are necessarily
00
25
50 100thickness (nm)
50experimenttheory
T 2
Figure 5. Amplifying the near field: theory (dashed line) predicts that thin silver films will transmit amplified evanescent waves, at least up to a critical thickness after which losses dominate and spoil the resonant effect. Amplification factors of around 30× are achieved before collapse. The data points for samples of varying thickness, taken from a paper by Nick Fang and colleagues15, agree with theory within experimental error.
d d
a)
energy
phase
energy
phase
+ =
c)
d d
d)
b)
Figure 6. Generalizing the perfect lens: a) an 1n = − slab draws light to a perfect focus; b) shows how the focus is achieved by the negative slab ‘unwinding’ or negating the phase acquired in passing through free space. Green arrows show the phase velocity advancing in the positive medium and retreating in the negative medium. c) Focusing can occur through two more complex objects provided that one is the inverse mirror image of the other; d) a graphical statement of the optical cancellation mirror antisymmetric regions of space optically annihilate one another. A negative medium is in effect a piece of optical antimatter.
2J.B. Pendry, Phys. Rev. Lett. 85 3966 (2000)6 / 12

Phenomena and Resulting Applications
cloaking device to hide
Continuous medium simulations of cloakingstructures were performed by means of theCOMSOL Multiphysics finite-element–basedelectromagnetics solver (12). The simulationresult of the ideal case is shown in Fig. 4A, withmaterial properties as in Eq. 2, and no absorptionloss. Several real-world effects were incorporatedinto another simulation (Fig. 4B) to matchexperimental conditions as much as possible. Inthe latter simulation, the reduced material proper-ties of Eq. 3 were used, and mrðrÞ was approx-imated by a 10-step piecewise constant functionto mimic the concentric rings of the fabricatedcloak. Additionally, absorption loss was added
corresponding to that found in the unit cellsimulations (and given in Fig. 2).
For the experimental confirmation, wemeasured the metamaterial cloak in a parallel-plate waveguide comprising two flat conducting(Al) plates spaced 11 mm apart (Fig. 3). Micro-waves were introduced through an X-band (8 to12 GHz) coax-to-waveguide adapter that wasattached to the lower plate and were incident onthe cloak, which rested on the lower plate andwas nearly of the same height (10 mm) as theplate separation.
A field-sensing antenna was formed from acoaxial fixture inserted into a hole drilledthrough the upper plate. The center conductor and dielectric of the coaxial connector ex-tended to a position flush with the lower sur-face of the upper plate and did not protrude intothe chamber volume. The lower plate wasmounted on two orthogonal linear translationstages, so that the lower plate (including thecloak, waveguide feed, and absorber) could betranslated with respect to the upper plate and tothe detector. By stepping the lower plate in smallincrements and recording the field amplitude andphase at every step, a full 2D spatial field map ofthe microwave scattering pattern could be ac-quired both inside the cloak and in the sur-rounding free-space region. Further experimentaldetails can be found in (16) and in the supportingonline material.
Both the cloak surrounding a 25-mm-radiusCu cylinder (Fig. 4D) and the bare Cu cylinder(Fig. 4C) were measured. The samples wereplaced on the lower plate in the center of themapping region and illuminated with micro-waves over a discrete set of frequencies thatincluded the expected operating frequency of
the cloak. At each frequency, the complexelectric field was acquired, and the processwas repeated for all x and y positions in the scanrange. After reviewing the field maps at allfrequencies, the optimal frequency for the cloaksample was determined to be 8.5 GHz, in near-exact agreement with the design target. Theoptimal frequency was selected as that whichbest matched the simulated field plots. Theacquired real part of the electric field distribu-tion is shown (Fig. 4, C and D).
Comparison of Fig. 4, C and D, shows thatthe cloak reduces both backscatter (reflection)and forward scatter (shadow). The backscatteris particularly evident in movie S3 as a strongstanding-wave component. Comparison of Fig.4, B and D, shows that the field plots foundthrough full-wave simulations are in markedagreement with the experimental data. Theunderlying physics of the cloaking mechanismcan be studied even further by viewing the fieldanimations (movies S1 to S5). As the wavespropagate through the cloak, the center sectionof the wavefront begins to lag as it approachesthe inner radius, exhibiting a compression inwavelength and a reduction in intensity. Thewavefront then separates to pass around thecloak hole and reforms on the opposite side,where its center section initially leads thewavefront. The wavefronts at the boundaryof the cloak match the wavefronts outside thecloak, which essentially correspond to those ofempty space. The scattering is thus minimized,though not perfectly, as a result of the reducedparameter implementation. The fields on theexit side are noticeably attenuated because ofthe absorption of the cloak material.
The agreement between the simulation andthe experiment is evidence that metamaterialscan indeed be designed to detailed and exactingspecifications, including gradients and non-rectangular geometry. Though the invisibilityis imperfect because of the approximationsused and material absorption, our results doprovide an experimental display of the elec-tromagnetic cloaking mechanism and demon-strate the feasibility of implementing mediaspecified by the transformation optics methodwith metamaterial technology.
References and Notes1. J. B. Pendry, D. Schurig, D. R. Smith, Science 312, 1780
(2006).2. U. Leonhardt, Science 312, 1777 (2006).3. A. J. Ward, J. B. Pendry, J. Mod. Opt. 43, 773 (1996).4. U. Leonhardt, T. G. Philbin, N. J. Phys. 8, 247 (2006).5. D. Schurig, J. B. Pendry, D. R. Smith, Opt. Express 14, 9794
(2006).6. A. Alu, N. Engheta, Phys. Rev. E Stat. Nonlin. Soft Matter
Phys. 72, 016623 (2005).7. G. W. Milton, N.-A. P. Nicorovici, Proc. R. Soc. London
Ser. A 462, 1364 (2006).8. A. I. Nachman, Ann. Math. 128, 531 (1988).9. G. Gbur, Prog. Opt. 45, 273 (2003).
10. A. Greenleaf, M. Lassas, G. Uhlmann, Physiol. Meas. 24,413 (2003).
11. A. Greenleaf, M. Lassas, G. Uhlmann, Math. Res. Lett. 10,1 (2003).
Fig. 3. Cutaway view of the planar waveguideapparatus. Microwaves (red and yellow patterns)are introduced by means of a coaxial-to-waveguidetransition (not shown) attached to the lower plate(lined with a circular sawtooth-shaped micro-wave absorber). An antenna mounted in the fixedupper plate measures the phase and amplitudeof the electric field. To perform field maps, westepped the lower plate in the lateral directions(black arrows).
Fig. 4. Snapshots of time-dependent, steady-state electric field patterns, with stream lines [black lines in(A to C)] indicating the direction of power flow (i.e., the Poynting vector). The cloak lies in the annularregion between the black circles and surrounds a conducting Cu cylinder at the inner radius. The fieldsshown are (A) the simulation of the cloak with the exact material properties, (B) the simulation of the cloakwith the reduced material properties, (C) the experimental measurement of the bare conducting cylinder,and (D) the experimental measurement of the cloaked conducting cylinder. Animations of the simulationsand the measurements (movies S1 to S5) show details of the field propagation characteristics within thecloak that cannot be inferred from these static frames. The right-hand scale indicates the instantaneousvalue of the field.
www.sciencemag.org SCIENCE VOL 314 10 NOVEMBER 2006 979
REPORTS
on
June
27,
201
1w
ww
.sci
ence
mag
.org
Dow
nloa
ded
from
terial parameters. In particular, the followingmaterial properties
ez ¼�
b
b − a
�2
mr ¼�r − a
r
�2
my ¼ 1 ð3Þ
have the same dispersion as those of Eq. 2, im-plying that waves will have the same dynamicsin the medium. In the geometric limit, forexample, rays will follow the same paths inmedia defined by Eqs. 2 or 3, and refractionangles into or out of the media will also be thesame (12). The only penalty for using thereduced set of material properties (Eq. 3) is anonzero reflectance.
To implement the material specification inEq. 3 with a metamaterial, we must choose theoverall dimensions, design the appropriate unitcells, and specify their layout, which for ourimplementation represents a pattern that isneither cubic nor even periodic. All three ofthese design elements share parameters, makingit advantageous and necessary to optimize themall at once. Equation 3 shows that the desiredcloak will have constant ez and my, with mrvarying radially throughout the structure. Thisparameter set can be achieved in a metama-terial in which split-ring resonators (SRRs),known to provide a magnetic response thatcan be tailored (17), are positioned with theiraxes along the radial direction (Fig. 1).
As can be seen from Eq. 3, the transformedmaterial properties depend strongly on thechoice of a and b . Because of constraints fromthe unit cell design and layout requirements,we chose the seemingly arbitrary values a =27.1 mm and b = 58.9 mm. The resultingmaterial properties are plotted in Fig. 1.
All metamaterials reported to date haveconsisted of elements repeated in cubic orother standard lattice configurations and areusually diagonal in the Cartesian basis. The
layout of our cylindrical cloak, however, usescells that are diagonal in a cylindrical basisand has “unit cells” that are curved sectorswith varied electromagnetic environments.The correct retrieval procedure that wouldobtain the effective medium properties fromsuch irregular unit cells is not yet available.Given that the curvature is not extreme in thiscloak design, however, we modeled the unitcells as right-rectangular prisms in a periodicarray of like cells, with the assumption thatthe actual cells will produce minor correctionsin the effective medium properties.
Because of constraints of the layout, we chosea rectangular unit cell with dimensions ay = az =10/3 mm and ar = 10/p mm. We were able toobtain both the desired ez and mr(r) from an SRRby tuning two of its geometric parameters: thelength of the split s and the radius of thecorners r (Fig. 2). The parameters r and s shiftthe frequency of the electric and magneticresonance, respectively, though there is somecross-coupling that must be compensated for.
Using commercial, full-wave, finite-elementsimulation software (Microwave Studio, Com-puter Simulation Technology), we performed aseries of scattering (S) parameter simulations forthe SRR unit cells over a discrete set of theparameters r and s covering the range of interest.A standard retrieval procedure (18, 19) was thenperformed to obtain the effective material proper-ties ez and mr from the S parameters. The discreteset of simulations and extractions was interpo-lated to obtain the particular values of thegeometric parameters that yielded the desiredmaterial properties. We chose an operatingfrequency of 8.5 GHz, which yields a reasonableeffectivemedium parameter l/ay > 10, where l isthe wavelength in free space.
The layout consisted of 10 concentric cylin-ders, each of which was three unit cells tall. Theevenly spaced set of cylinder radii was chosen so
that an integral number of unit cells fit exact-ly around the circumference of each cylinder,necessitating a particular ratio of radial-to-circumferential unit cell size. We chose to in-crease the number of unit cells in each successivecylinder by six, enabling us to use six supportingradial spokes that can intersect each of thecylinders in the spaces between the SRRs. Thisled to the requirement ar /ay = 3/p. Additionally,to minimize the magnetoelectric coupling inher-ent in single-split SRRs (20), we alternated theirorientation along the z direction (Fig. 1).
The overall scale of the cloak is such that acomplete field mapping of the cloak and itsimmediate environment is feasible (Fig. 3). Bythe same reasoning, numerical simulations of thecloak are also feasible, so long as the cloak is ap-proximated by continuous materials. A com-plete simulation of the actual cloak structure,including the details of the thousands of SRRs,would be impractical for general optimizationstudies.
Fig. 1. 2D microwave cloakingstructure (background image) witha plot of the material parametersthat are implemented. mr (red line)is multiplied by a factor of 10 forclarity. my (green line) has theconstant value 1. ez (blue line)has the constant value 3.423. TheSRRs of cylinder 1 (inner) andcylinder 10 (outer) are shown inexpanded schematic form (trans-parent square insets).
Fig. 2. SRR design. The in-plane lattice parame-ters are ay = az = 10/3 mm. The ring is square, withedge length l = 3mm and trace width w = 0.2 mm.The substrate is 381-mm-thick Duroid 5870 (e =2.33, td = 0.0012 at 10 GHz, where td is the losstangent). The Cu film, from which the SRRs arepatterned, is 17 mm thick. The parameters r and sare given in the table together with the associatedvalue of mr. The extractions gave roughly constantvalues for the imaginary parts of the materialparameters, yielding 0.002 and 0.006 for theimaginary part of ez and mr, respectively. The innercylinder (cyl.) is 1 and the outer cylinder is 10.
10 NOVEMBER 2006 VOL 314 SCIENCE www.sciencemag.org978
REPORTS
on
June
27,
201
1w
ww
.sci
ence
mag
.org
Dow
nloa
ded
from
3
3D. Schurig et al. Science 314, 977-980 (2006)7 / 12
Metamaterials
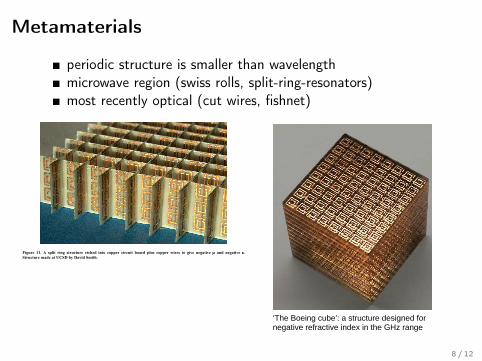
periodic structure is smaller than wavelengthmicrowave region (swiss rolls, split-ring-resonators)most recently optical (cut wires, fishnet)
J. B. Pendry 6
rµ iµ
1µ = −
resω negω
+20
0
-20frequency
perm
eab i
lity
r i
1
res neg
Figure 10. Schematic permeability of the magnetic metamaterial shown in figure 9 showing the resonant response of the structure at resω . Note that the frequency
at which 1rµ = − is far removed from the resonant
frequency and in this instance is in a region where iµ is small.
The split ring structure has the philosophy that first we design a resonant element with a magnetic response, then we assemble these elements into a 2D or 3D structure. However a critical aspect of magnetic activity is the ability of the element to capture a large cross section of incident magnetic flux and this may be limited by the design. For example cylinders of circular cross section cannot be closer packed than the hexagonal close packed structure. This limits the activity of the structure.
Recently an alternative approach has been proposed which fills space more efficiently and therefore can have greater activity. The Toronto group [19,20] has been producing some of the key designs based on theory of the ‘inverted’ waveguide.
In figure 12 we see the conventional waveguide in finite element form and the dispersion relationship of the waves it supports: the spectrum extends to zero frequency, there is an upper cut off, and the dispersion is everywhere positive. In contrast the inverted waveguide, figure 13, has capacitative impedance along the length of the guide, shunted by inductive impedance. This acts as a band pass filter with a lower and upper cut off and negative dispersion of the allowed band, a characteristic of a medium with a negative refractive index.
Figure 11. A split ring structure etched into copper circuit board plus copper wires to give negative µ and negative ε.Structure made at UCSD by David Smith.
© 2003 American Institute of Physics DRS&JBPsubmit060404.doc at 06/04/2004 page 1 of 9 December 2003 Physics Today
Reversing Light: Negative Refraction
ictor Veselago, in a paper1 published in 1967, pondered the consequences for electromagnetic waves interacting with a hypothetical material for
which both the electric permittivity, ε , and the magnetic permeability, µ , were simultaneously negative. As no naturally occurring material or compound has ever been demonstrated with negative ε andµ , Veselago wondered whether this apparent asymmetry in material properties was just happenstance, or perhaps had a more fundamental origin. Veselago concluded that not only should such materials be possible but, if ever found, would exhibit remarkable properties unlike those of any known materials, giving a twist to virtually all electromagnetic phenomena. Amongst these properties is a negative index of refraction and, although Veselago always referred to the materials as ‘left handed’, we shall prefer the negative index description. They mean one and the same thing, but our description appeals more to everyday intuition and is less likely to be confused with chirality, an entirely different phenomenon.
So why are there no materials with negative ε andµ ? We first need to understand what it means to have a negative ε or µ , and how it occurs in materials. The Drude-Lorentz model of a material is a good starting point, as it conceptually replaces the atoms and molecules of a real material by a set of harmonically bound electron oscillators, resonant at some frequency 0ω . At frequencies far below 0ω , an applied electric field displaces the electrons from the positive core, inducing a polarization in the same direction as the applied electric field. At frequencies near the resonance, the induced polarization becomes very large, as is typically the case in resonance phenomena; the large response represents accumulation of energy over many cycles, such that a considerable amount of energy is stored in the resonator (medium) relative to the driving field. So large is this stored energy that even changing the sign of the applied electric field has little effect on the polarization near
resonance! That is, as the frequency of the driving electric field is swept through the resonance, the polarization flips from in-phase to out-of-phase with the driving field and the material exhibits a negative response. If instead of electrons the material response were due to harmonically bound magnetic moments, then a negative magnetic response would exist.
Though somewhat less common than positive materials, negative materials are nevertheless easy to find. Materials with ε negative include metals (e.g., silver, gold, aluminum) at optical frequencies, while materials with µ negative include resonant ferromagnetic or antiferromagnetic systems.
That negative material parameters occur near a resonance has two important consequences. First, negative material parameters will exhibit frequency dispersion: that is to say they will vary as a function of frequency. Second, the usable bandwidth of negative materials will be relatively narrow compared with positive materials. This can help us answer our initial question as to why materials with both negative ε and µ are not readily found. The resonances in existing materials that give rise to electric polarizations typically occur at very high frequencies, in the optical, for metals, or at least in the THz to infrared region for semiconductors and insulators. On the other hand, resonances in magnetic systems typically occur at much lower frequencies, usually tailing off toward the THz and infrared region. In short, the fundamental electronic and magnetic processes that give rise to resonant phenomena in materials simply do not occur at the same frequencies, although no physical law would preclude this. Metamaterials extend material response Because of the seeming separation in frequency between electric and magnetic resonant phenomena, Veselago’s analysis of materials with ε and µ both negative might
John B. Pendry and David R. Smith
First hypothesized in 1967 by Victor Veselago, materials with negative refractive index have only been appreciated this decade.
John Pendry is professor of physics at Imperial College London. David Smith is adjunct professor of physics at UCSD.
‘The Boeing cube’: a structure designed for negative refractive index in the GHz range
8 / 12
Overview
Negative refractive index metamaterials REVIEW FEATURE
JULY-AUGUST 2006 | VOLUME 9 | NUMBER 7-8 33
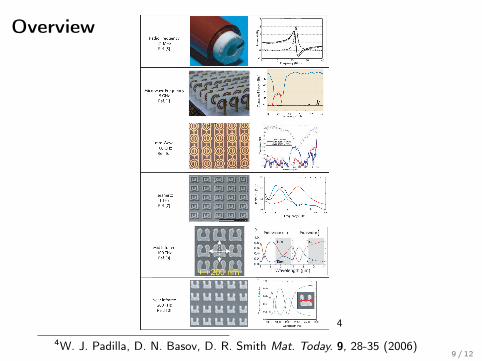
Fig. 4 Summary of MM results from RF to near optical frequencies. In the left column we detail the frequency range in which each MM was demonstrated and notethe reference number in this review. The middle column shows a photo of the MM from each publication, and the third column shows some data detailing the MMresponse. The top row is an investigation of ‘swiss-roll’-type magnetic structures to guide magnetic flux in magnetic resonance imaging machines5. The second rowis the original work in which NI materials were discovered at microwave frequencies1. The third row shows some recent work on MMs at millimeter-wavefrequencies6. The next column details the first work extending MMs out of the microwave into the terahertz regime7. The bottom two columns show furtherextension of the SRR magnetic MM medium to MIR8 and NIR10 frequencies. [Part (a) reproduced with permission from5. © 2001 American Association for theAdvancement of Science (AAAS). Part (b) reproduced with permission from1. © 2000 American Physical Society (APS). Part (c) reproduced with permission from6.Part (d) reproduced with permission from7. © 2004 AAAS. Part (e) reproduced with permission from8. © 2004 AAAS. Part (f) reproduced with permission from10. © 2005 APS.]
(a)
(b)
(c)
(d)
(e)
(f)
mt97_8p28_35.qxd 06/15/2006 15:25 Page 33
4
4W. J. Padilla, D. N. Basov, D. R. Smith Mat. Today. 9, 28-35 (2006)9 / 12
Infrared Region
determination of the refractive index, because the refraction angledepends solely on the phase gradient that the light beam experienceswhen refracted from the angled output face. We used a femtosecondsynchronously pumped optical parametric oscillator as a tunable
light source to determine the refractive index at different wave-lengths. The beam was focused on the sample, and a charge-coupleddevice (CCD) camera was placed in the Fourier plane (Fig. 2c).
Figure 3a shows the beam shift d resulting from the bending oflight at the prism output at different wavelengths, ranging from 1,200to 1,700 nm. The measurement was performed on a prism of angleb 5 5.0u and the beam shift is plotted along with reference measure-ments of transmission through a window, without the presence of theprism (left panel). Clearly, as the wavelength increases, the beam shiftresulting from the prism refraction is changing from positive tonegative, indicating a transition from a positive index in the shorterwavelengths to a negative index in the longer wavelengths. At a wave-length l of 1,475 nm, the index of refraction is approaching zero; thatis, the beam does not acquire any phase while propagating in themetamaterial. Consequently there is no phase gradient at the angledoutput face and the exiting beam is exactly normal to the output face(see dashed lines in Figs 2b and 3a).
Figure 3b depicts the measured refractive index of the 3D fishnetmetamaterial at various wavelengths. The refractive index variesfrom n 5 0.63 6 0.05 at 1,200 nm to n 5 21.23 6 0.34 at 1,775 nm.The refractive index was determined from multiple measurements oftwo fishnet prisms with angles of b 5 5.0u and 4.7u and for wave-lengths ranging from 1,200 to 1,800 nm. Although there is a correla-tion between the beam spot positions shown in Fig. 3a and therefractive index in Fig. 3b, it should be noted that Fig. 3b showsthe average of measurements on different prisms with the standarddeviation as error bars, whereas Fig. 3a shows an individual measure-ment. The experimental results are found to be in good agreementwith the theoretical predictions (black line in Fig. 3b) on the basis ofrigorous coupled-wave analysis (RCWA). The measured negativerefraction angle is a direct result of negative phase evolution for lightpropagating inside the sample caused by a negative refractive index.This is illustrated in Fig. 3c by a numerical calculation of the in-planeelectromagnetic field distribution in the fishnet prism at
5 µm Quartz
Prism
n = 1 n < 0
Lens 1 Lens 2Sample
Laserbeam
Camera
Imag
e
b
c
a
a
b
d
f2
f2 f2
b
n = 1.5
n = –1
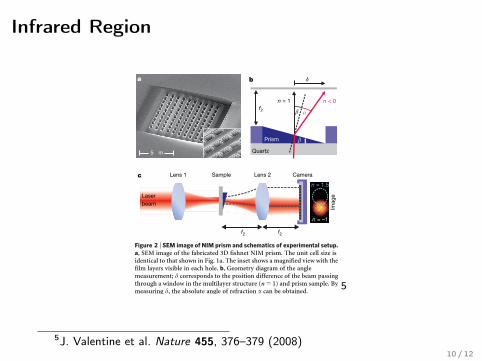
Figure 2 | SEM image of NIM prism and schematics of experimental setup.a, SEM image of the fabricated 3D fishnet NIM prism. The unit cell size isidentical to that shown in Fig. 1a. The inset shows a magnified view with thefilm layers visible in each hole. b, Geometry diagram of the anglemeasurement; d corresponds to the position difference of the beam passingthrough a window in the multilayer structure (n 5 1) and prism sample. Bymeasuring d, the absolute angle of refraction a can be obtained.c, Experimental setup for the beam refraction measurement. The focallength of lens 1 is 50 mm and that of lens 2 is f2 5 40 mm. Lens 2 is placed in a2f configuration, resulting in the Fourier image at the camera position.
ba Window Prism
–5 0 5 10Position (mm)
–5 0 5 10Position (mm)
1,200 nm
1,350 nm
1,475 nm
1,590 nm
1,700 nm
n = 1 n = 1 n = 0
1,200 1,400 1,600 1,800–1.5
–1.0
–0.5
0
0.5
1.0
Ind
ex o
f ref
ract
ion
Wavelength (nm)
l = 1,763 nmn = –1.4
250 235 220 205 190 175Frequency (THz)
c
Figure 3 | Experimental results and finite-difference time-domainsimulations. a, Fourier-plane images of the beam for the window and prismsample for various wavelengths. The horizontal axis corresponds to thebeam shift d, and positions of n 5 1 and n 5 0 are denoted by the white lines.The image intensity for each wavelength has been normalized for clarity.b, Measurements and simulation of the fishnet refractive index. The circlesshow the results of the experimental measurement with error bars (s.d.,
n 5 4 measurements). The measurement agrees closely with the simulatedrefractive index using the RCWA method (black line). c, Left: simulation ofthe in-plane electric field component for the prism structure at 1,763 nm,showing the phase front of the light. Negative-phase propagation resultingfrom the negative refractive index leads to negative refraction angle asmeasured by the beam shift in the experiment. Right: magnified plot of thefield distribution in the prism.
NATURE | Vol 455 | 18 September 2008 LETTERS
377
©2008 Macmillan Publishers Limited. All rights reserved
5
5J. Valentine et al. Nature 455, 376–379 (2008)10 / 12
Infrared Regiondetermination of the refractive index, because the refraction angledepends solely on the phase gradient that the light beam experienceswhen refracted from the angled output face. We used a femtosecondsynchronously pumped optical parametric oscillator as a tunable
light source to determine the refractive index at different wave-lengths. The beam was focused on the sample, and a charge-coupleddevice (CCD) camera was placed in the Fourier plane (Fig. 2c).
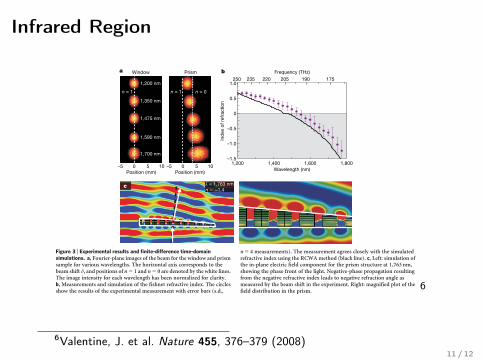
Figure 3a shows the beam shift d resulting from the bending oflight at the prism output at different wavelengths, ranging from 1,200to 1,700 nm. The measurement was performed on a prism of angleb 5 5.0u and the beam shift is plotted along with reference measure-ments of transmission through a window, without the presence of theprism (left panel). Clearly, as the wavelength increases, the beam shiftresulting from the prism refraction is changing from positive tonegative, indicating a transition from a positive index in the shorterwavelengths to a negative index in the longer wavelengths. At a wave-length l of 1,475 nm, the index of refraction is approaching zero; thatis, the beam does not acquire any phase while propagating in themetamaterial. Consequently there is no phase gradient at the angledoutput face and the exiting beam is exactly normal to the output face(see dashed lines in Figs 2b and 3a).
Figure 3b depicts the measured refractive index of the 3D fishnetmetamaterial at various wavelengths. The refractive index variesfrom n 5 0.63 6 0.05 at 1,200 nm to n 5 21.23 6 0.34 at 1,775 nm.The refractive index was determined from multiple measurements oftwo fishnet prisms with angles of b 5 5.0u and 4.7u and for wave-lengths ranging from 1,200 to 1,800 nm. Although there is a correla-tion between the beam spot positions shown in Fig. 3a and therefractive index in Fig. 3b, it should be noted that Fig. 3b showsthe average of measurements on different prisms with the standarddeviation as error bars, whereas Fig. 3a shows an individual measure-ment. The experimental results are found to be in good agreementwith the theoretical predictions (black line in Fig. 3b) on the basis ofrigorous coupled-wave analysis (RCWA). The measured negativerefraction angle is a direct result of negative phase evolution for lightpropagating inside the sample caused by a negative refractive index.This is illustrated in Fig. 3c by a numerical calculation of the in-planeelectromagnetic field distribution in the fishnet prism at
5 µm Quartz
Prism
n = 1 n < 0
Lens 1 Lens 2Sample
Laserbeam
Camera
Imag
e
b
c
a
a
b
d
f2
f2 f2
b
n = 1.5
n = –1
Figure 2 | SEM image of NIM prism and schematics of experimental setup.a, SEM image of the fabricated 3D fishnet NIM prism. The unit cell size isidentical to that shown in Fig. 1a. The inset shows a magnified view with thefilm layers visible in each hole. b, Geometry diagram of the anglemeasurement; d corresponds to the position difference of the beam passingthrough a window in the multilayer structure (n 5 1) and prism sample. Bymeasuring d, the absolute angle of refraction a can be obtained.c, Experimental setup for the beam refraction measurement. The focallength of lens 1 is 50 mm and that of lens 2 is f2 5 40 mm. Lens 2 is placed in a2f configuration, resulting in the Fourier image at the camera position.
ba Window Prism
–5 0 5 10Position (mm)
–5 0 5 10Position (mm)
1,200 nm
1,350 nm
1,475 nm
1,590 nm
1,700 nm
n = 1 n = 1 n = 0
1,200 1,400 1,600 1,800–1.5
–1.0
–0.5
0
0.5
1.0
Ind
ex o
f ref
ract
ion
Wavelength (nm)
l = 1,763 nmn = –1.4
250 235 220 205 190 175Frequency (THz)
c
Figure 3 | Experimental results and finite-difference time-domainsimulations. a, Fourier-plane images of the beam for the window and prismsample for various wavelengths. The horizontal axis corresponds to thebeam shift d, and positions of n 5 1 and n 5 0 are denoted by the white lines.The image intensity for each wavelength has been normalized for clarity.b, Measurements and simulation of the fishnet refractive index. The circlesshow the results of the experimental measurement with error bars (s.d.,
n 5 4 measurements). The measurement agrees closely with the simulatedrefractive index using the RCWA method (black line). c, Left: simulation ofthe in-plane electric field component for the prism structure at 1,763 nm,showing the phase front of the light. Negative-phase propagation resultingfrom the negative refractive index leads to negative refraction angle asmeasured by the beam shift in the experiment. Right: magnified plot of thefield distribution in the prism.
NATURE | Vol 455 | 18 September 2008 LETTERS
377
©2008 Macmillan Publishers Limited. All rights reserved
6
6Valentine, J. et al. Nature 455, 376–379 (2008)11 / 12
Outlook
negative refractive index over wide wavelength rangenegative permeability already achieved over complete opticalregion7
dissipation is a problemprocessing of nanometer scale structures
7C. Wenshan et al. Optics Express 15, 6 p.3333 (2007)12 / 12