Natural aerosols: Global budgets and climate implications Aerodyne, Inc. April 10, 2009 Colette L....
28
Natural aerosols: Global budgets and climate implications Aerodyne, Inc. April 10, 2009 Colette L. Heald
-
date post
21-Dec-2015 -
Category
Documents
-
view
215 -
download
0
Transcript of Natural aerosols: Global budgets and climate implications Aerodyne, Inc. April 10, 2009 Colette L....
Natural aerosols: Global budgets and climate implications
Aerodyne, Inc.April 10, 2009
Colette L. Heald
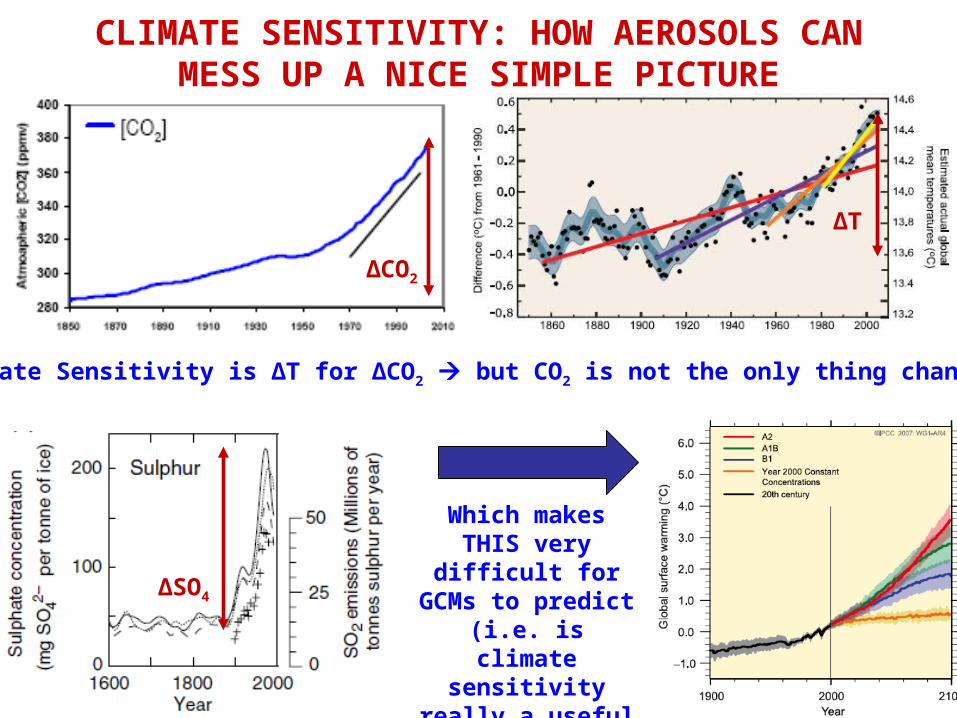
CLIMATE SENSITIVITY: HOW AEROSOLS CAN MESS UP A NICE SIMPLE PICTURE
ΔT
ΔCO2
Climate Sensitivity is ΔT for ΔCO2 but CO2 is not the only thing changing!
Which makes THIS very difficult for GCMs to predict
(i.e. is climate sensitivity really a useful concept?)
ΔSO4
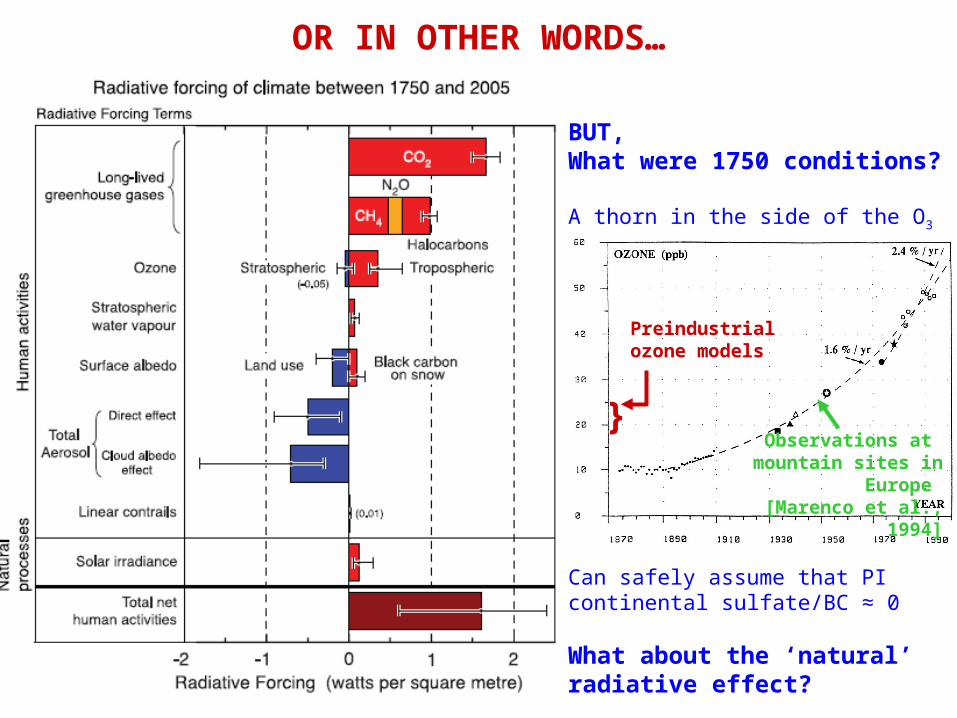
OR IN OTHER WORDS…
BUT,What were 1750 conditions?
A thorn in the side of the O3 community:
Preindustrialozone models
}Observations at
mountain sites in Europe [Marenco et al., 1994]
Can safely assume that PI continental sulfate/BC ≈ 0
What about the ‘natural’ radiative effect?
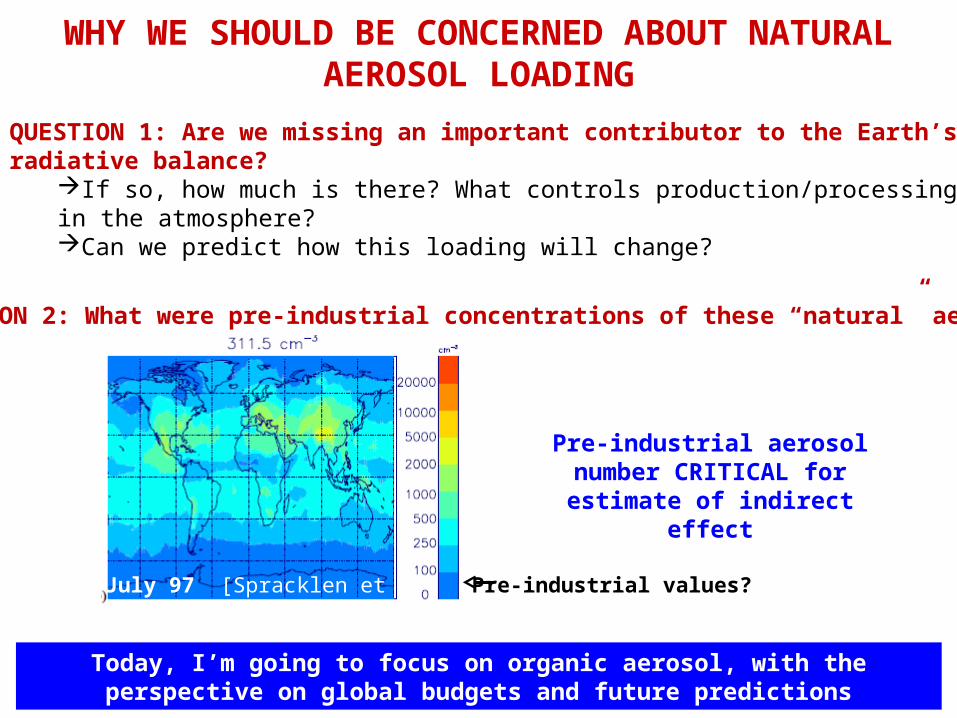
WHY WE SHOULD BE CONCERNED ABOUT NATURAL AEROSOL LOADING
QUESTION 1: Are we missing an important contributor to the Earth’s radiative balance?
If so, how much is there? What controls production/processing in the atmosphere?Can we predict how this loading will change?
QUESTION 2: What were pre-industrial concentrations of these “natural” aerosols?
Today, I’m going to focus on organic aerosol, with the perspective on global budgets and future predictions
Pre-industrial aerosol number CRITICAL for
estimate of indirect effect
July 97 [Spracklen et al., 2005] Pre-industrial values?
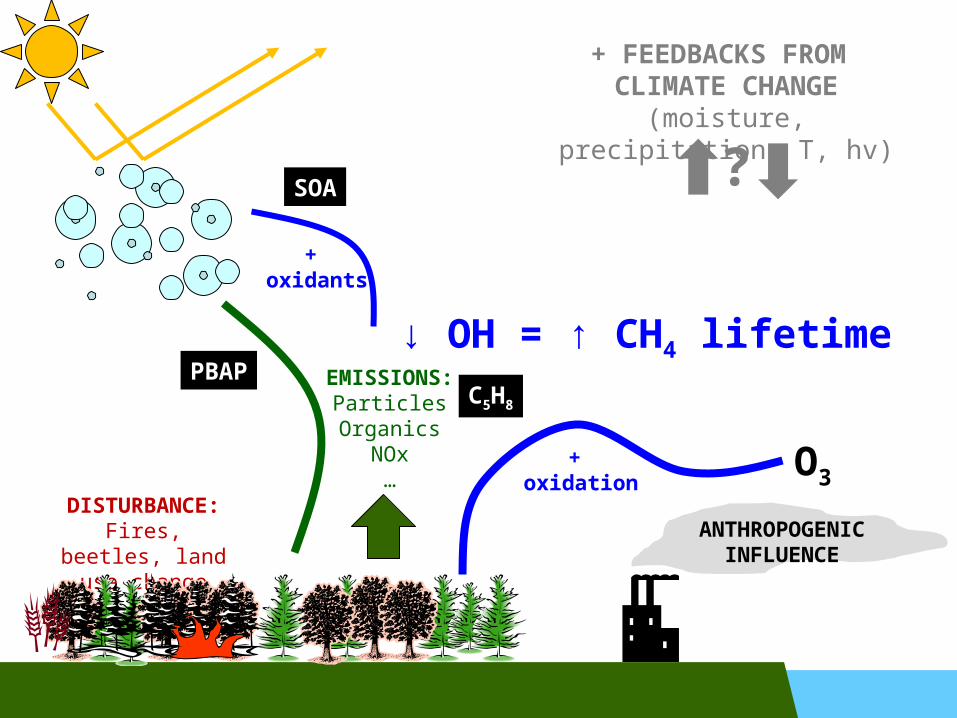
DISTURBANCE:Fires, beetles,
land use change
EMISSIONS:ParticlesOrganics
NOx…
+ oxidants
+ oxidation
O3
ANTHROPOGENIC INFLUENCE
↓ OH = ↑ CH4 lifetime
+ FEEDBACKS FROM CLIMATE CHANGE
(moisture, precipitation, T, hv)
?
PBAP
SOA
C5H8
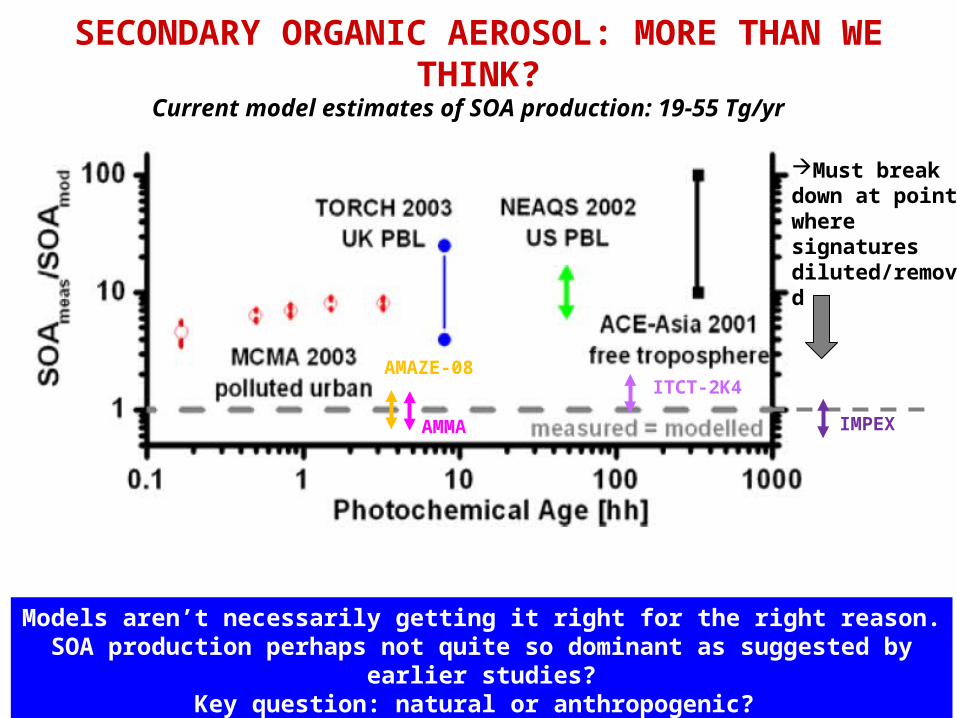
SECONDARY ORGANIC AEROSOL: MORE THAN WE THINK?
ITCT-2K4
IMPEX
AMAZE-08
AMMA
Models aren’t necessarily getting it right for the right reason.SOA production perhaps not quite so dominant as suggested by earlier studies?
Key question: natural or anthropogenic?
Must break down at point where signatures diluted/removed
Current model estimates of SOA production: 19-55 Tg/yr
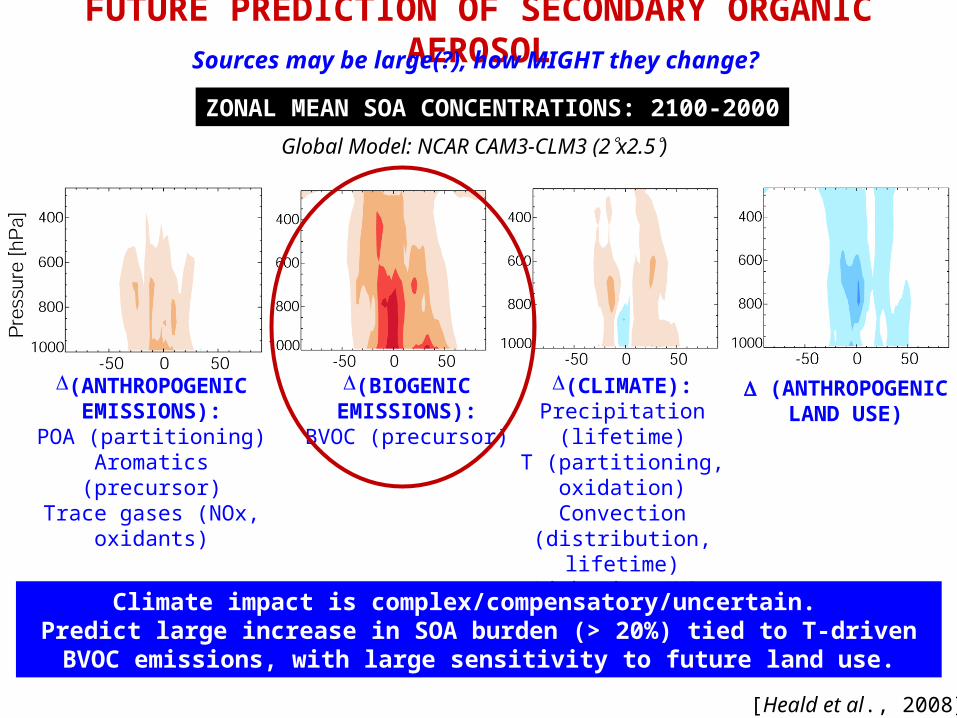
FUTURE PREDICTION OF SECONDARY ORGANIC AEROSOLSources may be large(?), how MIGHT they change?
ZONAL MEAN SOA CONCENTRATIONS: 2100-2000
(ANTHROPOGENIC EMISSIONS):
POA (partitioning)Aromatics (precursor)
Trace gases (NOx, oxidants)
(BIOGENIC EMISSIONS):
BVOC (precursor)
(CLIMATE):Precipitation (lifetime)
T (partitioning, oxidation)Convection (distribution,
lifetime)Lightning (NOx aloft)Water vapour (POH)
(ANTHROPOGENIC LAND USE)
Climate impact is complex/compensatory/uncertain. Predict large increase in SOA burden (> 20%) tied to T-driven BVOC emissions,
with large sensitivity to future land use.
Global Model: NCAR CAM3-CLM3 (2x2.5)
[Heald et al., 2008]
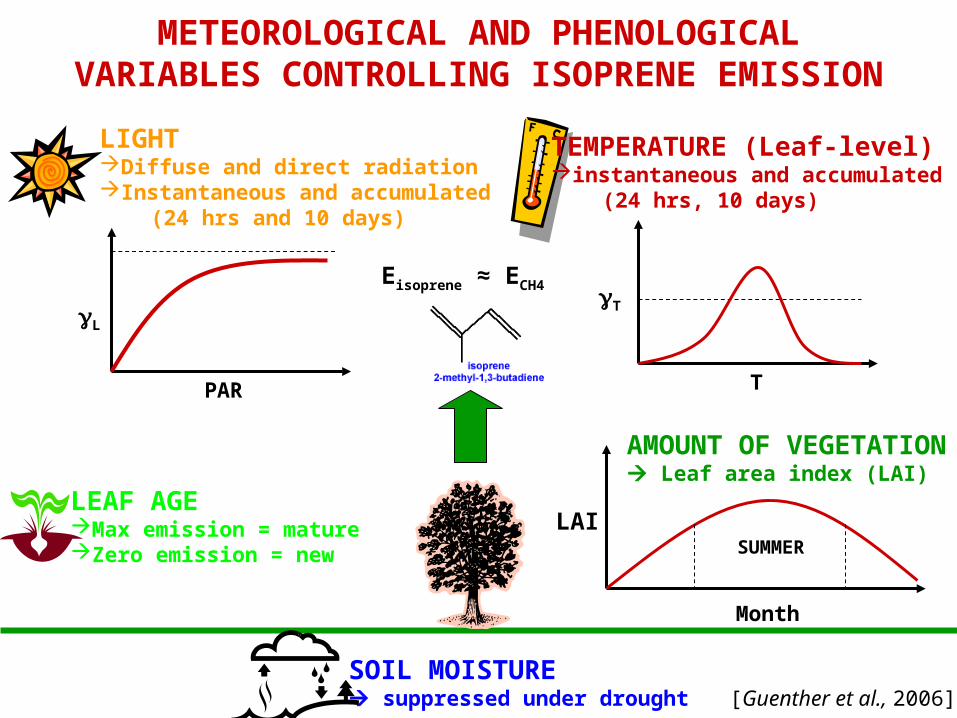
METEOROLOGICAL AND PHENOLOGICAL VARIABLES CONTROLLING ISOPRENE EMISSION
LIGHTDiffuse and direct radiationInstantaneous and accumulated (24 hrs and 10 days)
TEMPERATURE (Leaf-level)instantaneous and accumulated (24 hrs, 10 days)
TPAR
L
T
[Guenther et al., 2006]SOIL MOISTURE suppressed under drought
AMOUNT OF VEGETATION Leaf area index (LAI)
Month
LAISUMMER
LEAF AGEMax emission = mature Zero emission = new
Eisoprene ≈ ECH4
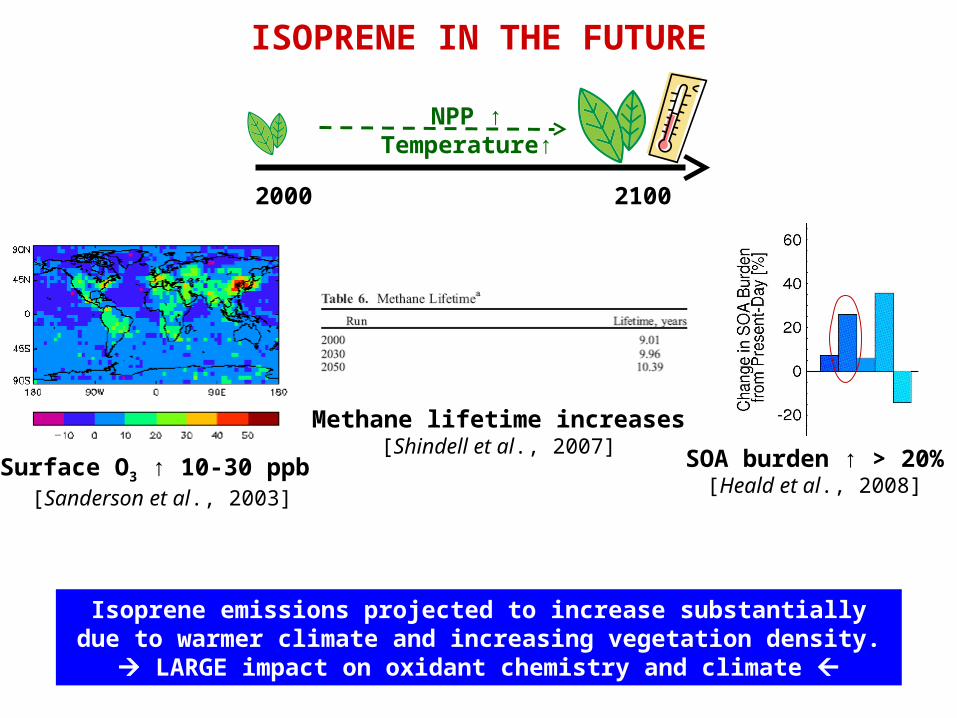
ISOPRENE IN THE FUTURE
Isoprene emissions projected to increase substantially due to warmer climate and increasing vegetation density.
LARGE impact on oxidant chemistry and climate
2000 2100
NPP ↑ Temperature↑
Surface O3 ↑ 10-30 ppb [Sanderson et al., 2003]
Methane lifetime increases[Shindell et al., 2007] SOA burden ↑ > 20%
[Heald et al., 2008]
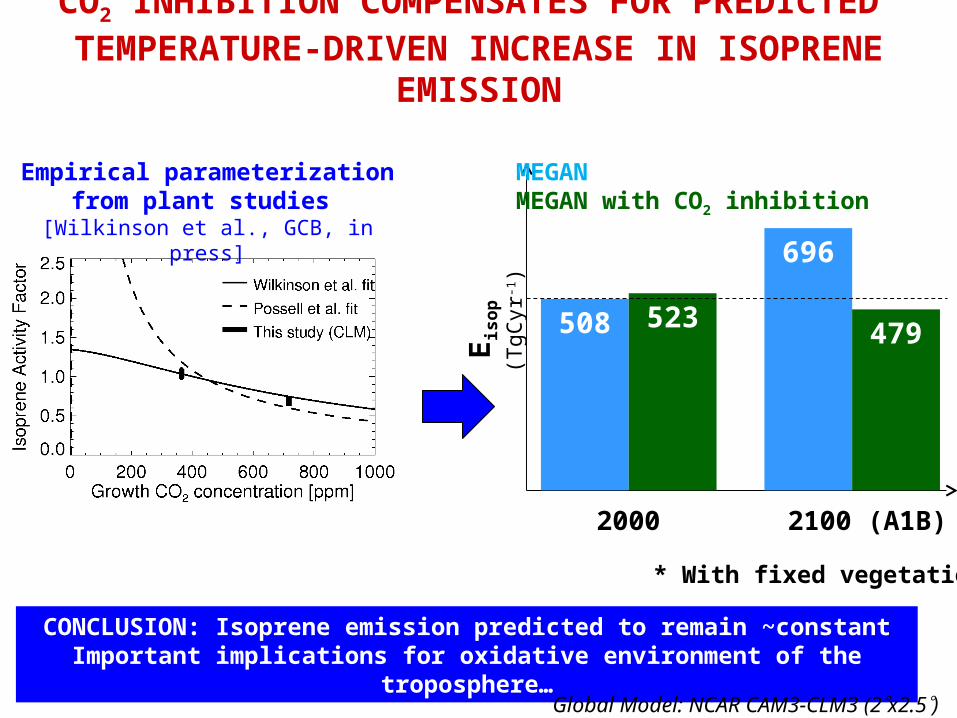
CO2 INHIBITION COMPENSATES FOR PREDICTED TEMPERATURE-DRIVEN INCREASE IN ISOPRENE EMISSION
CONCLUSION: Isoprene emission predicted to remain ~constantImportant implications for oxidative environment of the troposphere…
* With fixed vegetation
508 523
696
479Eis
op
(TgC
yr-1)
2000 2100 (A1B)
MEGANMEGAN with CO2 inhibition
Global Model: NCAR CAM3-CLM3 (2x2.5)
Empirical parameterization from plant studies
[Wilkinson et al., GCB, in press]
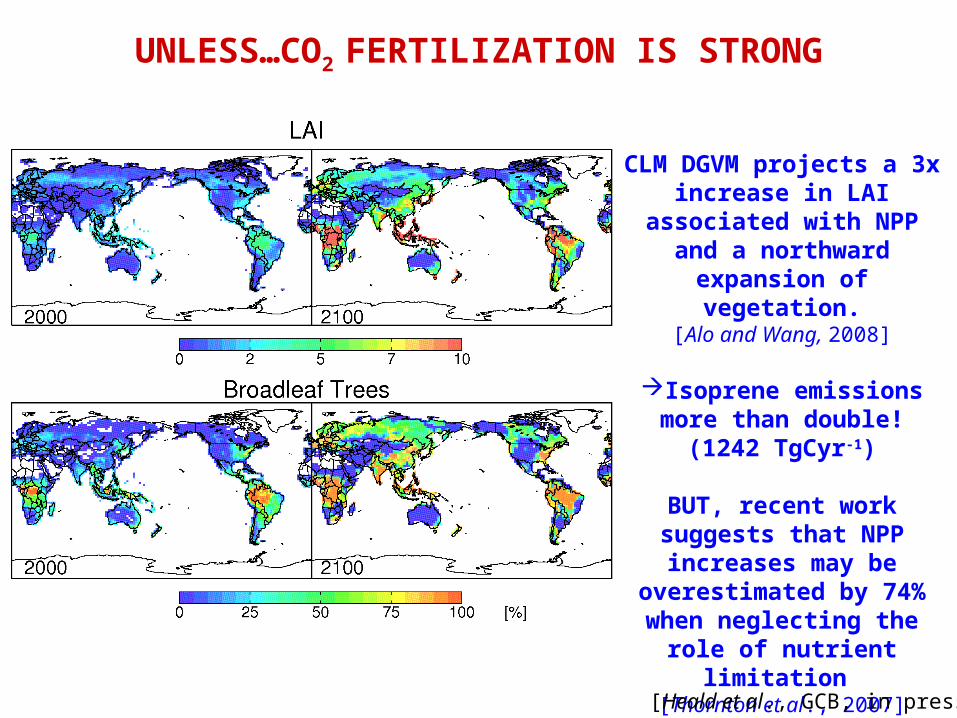
UNLESS…CO2 FERTILIZATION IS STRONG
CLM DGVM projects a 3x increase in LAI associated with NPP and a northward expansion of vegetation.
[Alo and Wang, 2008]
Isoprene emissions more than double! (1242 TgCyr-1)
BUT, recent work suggests that NPP increases may be
overestimated by 74% when neglecting the role of
nutrient limitation [Thornton et al., 2007]
[Heald et al., GCB, in press]
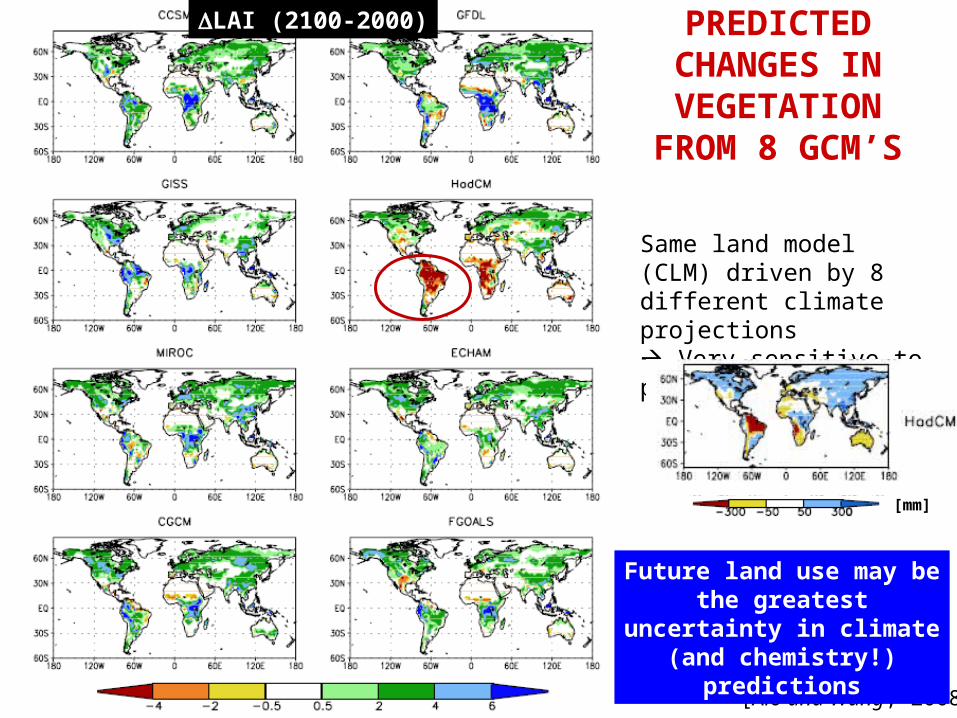
PREDICTED CHANGES IN VEGETATIONFROM 8 GCM’S
Same land model (CLM) driven by 8 different climate projections Very sensitive to precip
[Alo and Wang, 2008]
LAI (2100-2000)
[mm]
Future land use may be the greatest uncertainty in
climate (and chemistry!) predictions
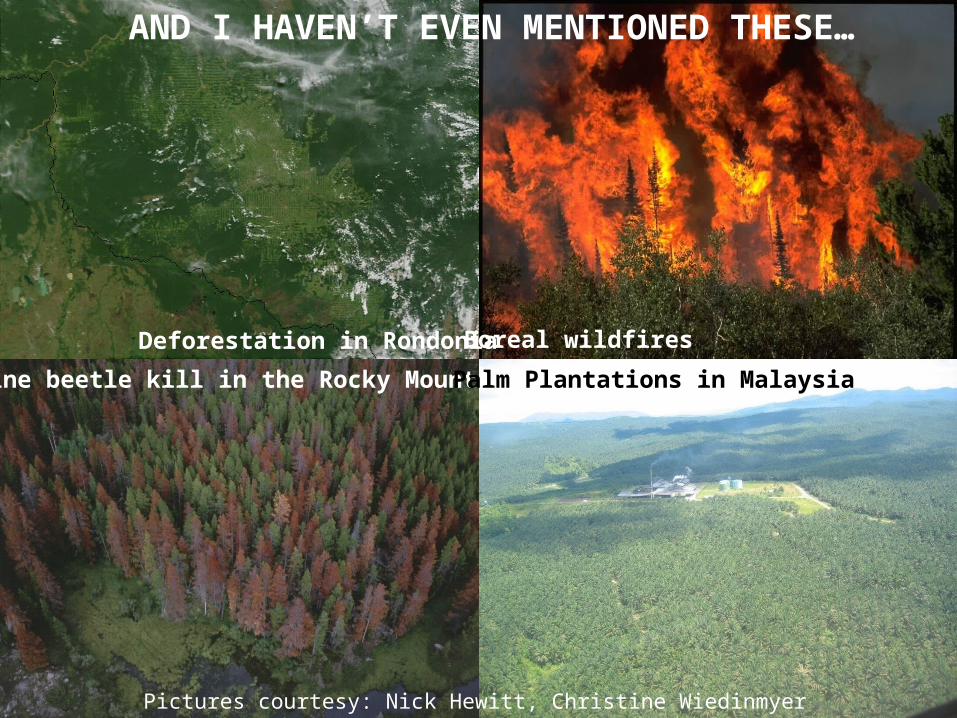
AND I HAVEN’T EVEN MENTIONED THESE…
Pictures courtesy: Nick Hewitt, Christine Wiedinmyer
Deforestation in Rondonia Boreal wildfires
Pine beetle kill in the Rocky Mountains Palm Plantations in Malaysia
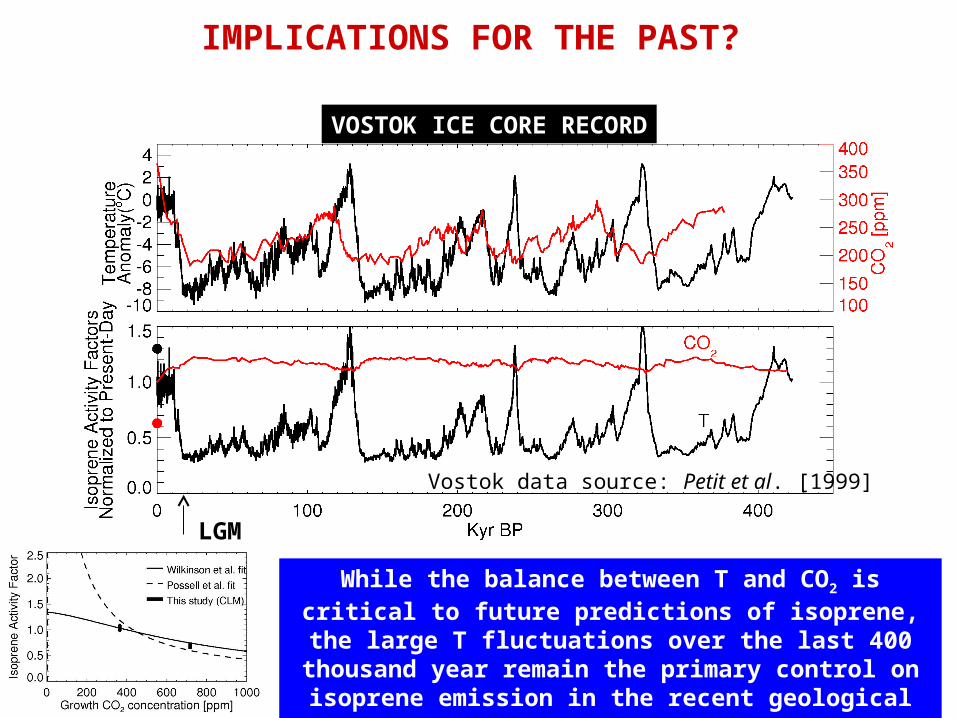
IMPLICATIONS FOR THE PAST?
VOSTOK ICE CORE RECORD
While the balance between T and CO2 is critical to future predictions of isoprene, the large T fluctuations over the
last 400 thousand year remain the primary control on isoprene emission in the recent geological past. However effect at low CO2 highly uncertain
Vostok data source: Petit et al. [1999]
LGM
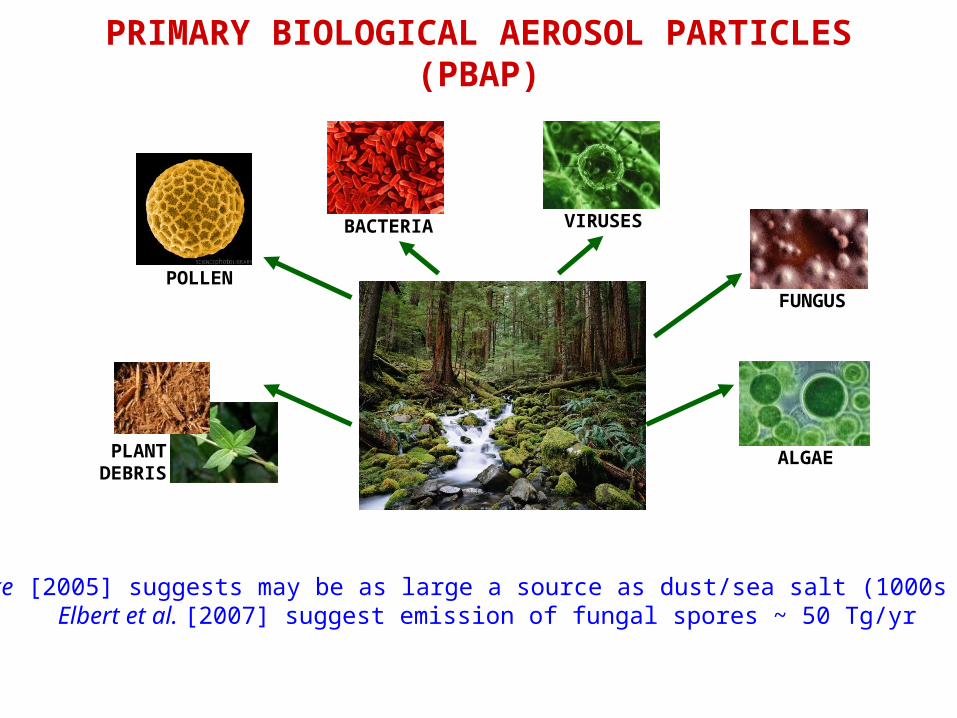
PRIMARY BIOLOGICAL AEROSOL PARTICLES (PBAP)
POLLEN
BACTERIA VIRUSES
FUNGUS
ALGAEPLANTDEBRIS
Jaenicke [2005] suggests may be as large a source as dust/sea salt (1000s Tg/yr)Elbert et al. [2007] suggest emission of fungal spores ~ 50 Tg/yr
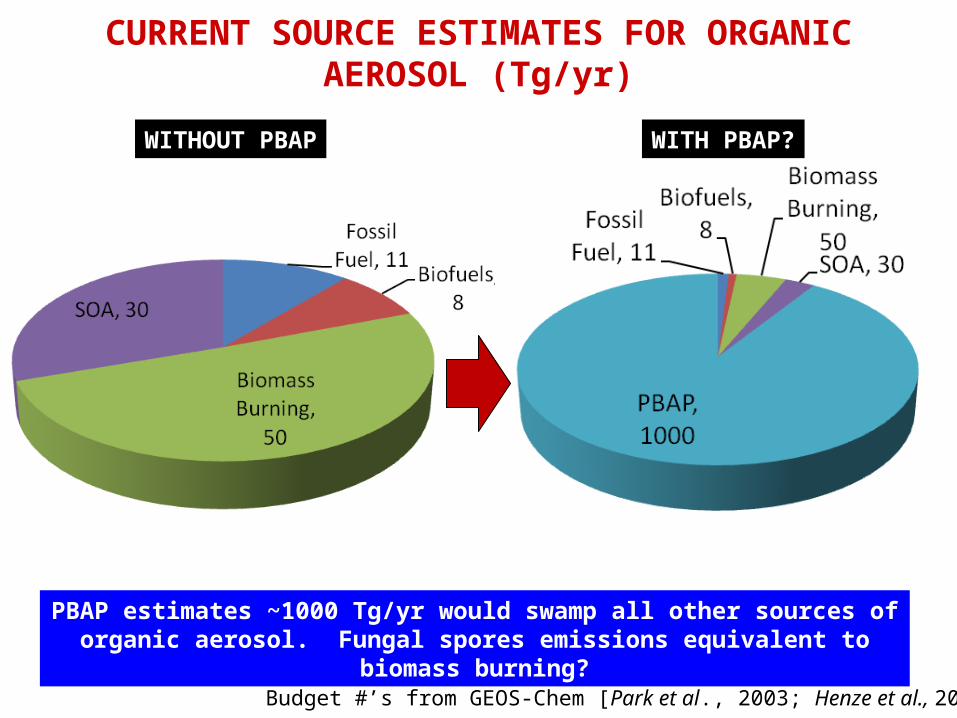
CURRENT SOURCE ESTIMATES FOR ORGANIC AEROSOL (Tg/yr)
WITHOUT PBAP WITH PBAP?
PBAP estimates ~1000 Tg/yr would swamp all other sources of organic aerosol. Fungal spores emissions equivalent to biomass burning?
Budget #’s from GEOS-Chem [Park et al., 2003; Henze et al., 2008]
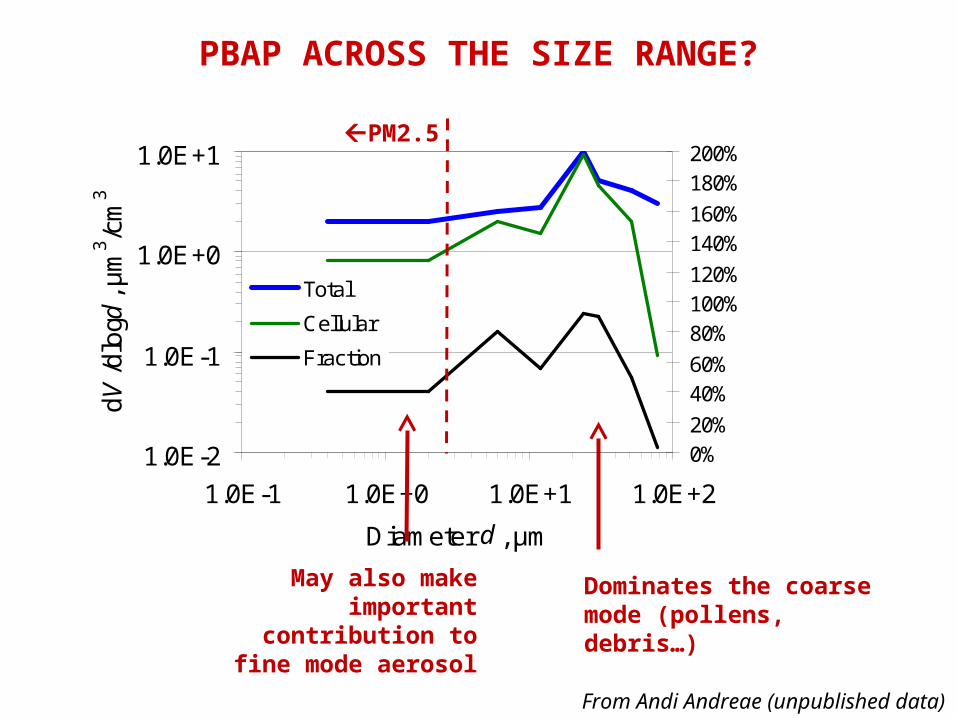
PBAP ACROSS THE SIZE RANGE?
1.0E-2
1.0E-1
1.0E+0
1.0E+1
1.0E-1 1.0E+0 1.0E+1 1.0E+2
Diameter d , µm
dV
/dlo
gd, µ
m3 /c
m3
0%20%
40%60%
80%100%120%
140%160%
180%200%
Total
Cellular
Fraction
From Andi Andreae (unpublished data)
Dominates the coarse mode (pollens, debris…)
May also make important contribution
to fine mode aerosol
PM2.5
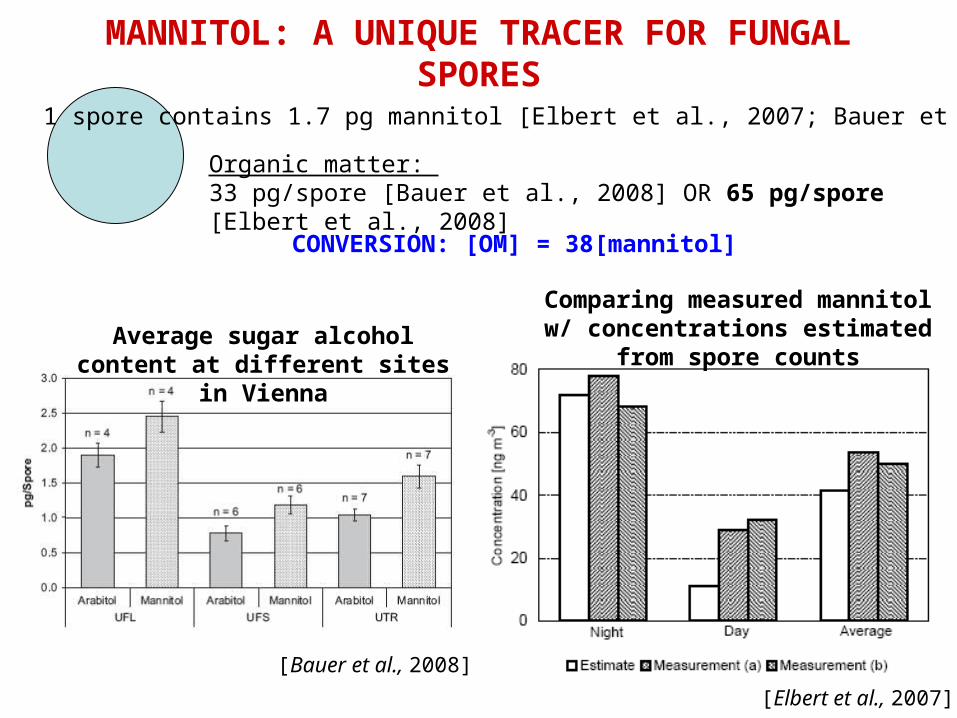
MANNITOL: A UNIQUE TRACER FOR FUNGAL SPORES
1 spore contains 1.7 pg mannitol [Elbert et al., 2007; Bauer et al., 2008]
Organic matter: 33 pg/spore [Bauer et al., 2008] OR 65 pg/spore [Elbert et al., 2008]
CONVERSION: [OM] = 38[mannitol]
Average sugar alcohol content at different sites in Vienna
Comparing measured mannitol w/ concentrations estimated from
spore counts
[Elbert et al., 2007]
[Bauer et al., 2008]
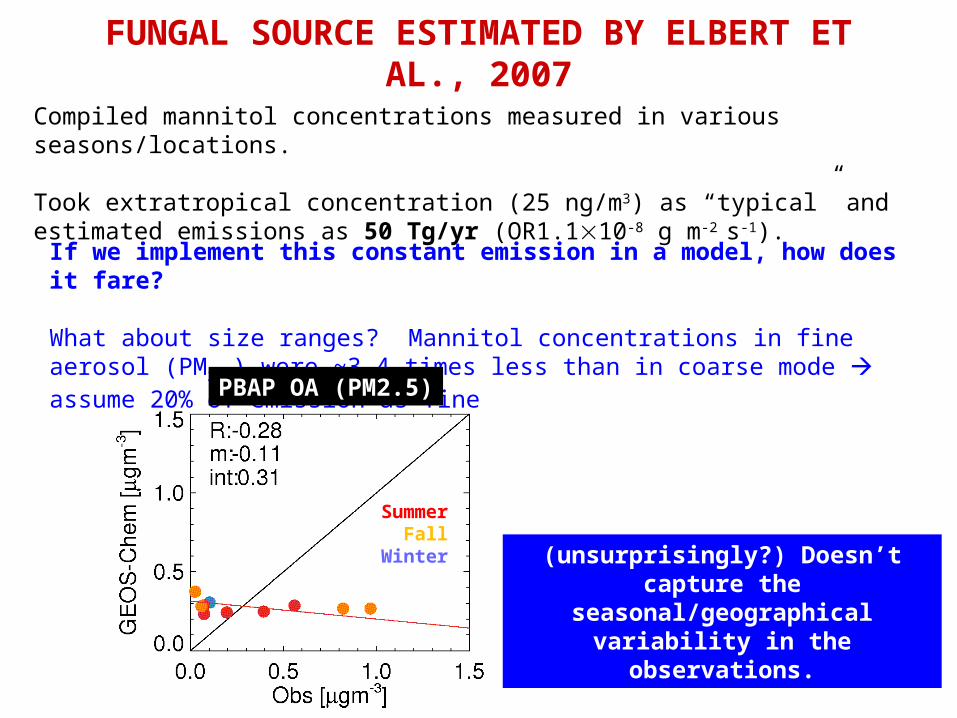
If we implement this constant emission in a model, how does it fare?
What about size ranges? Mannitol concentrations in fine aerosol (PM2.5) were ~3-4 times less than in coarse mode assume 20% of emission as fine
FUNGAL SOURCE ESTIMATED BY ELBERT ET AL., 2007
Compiled mannitol concentrations measured in various seasons/locations.
Took extratropical concentration (25 ng/m3) as “typical” and estimated emissions as 50 Tg/yr (OR1.110-8 g m-2 s-1).
PBAP OA (PM2.5)
(unsurprisingly?) Doesn’t capture the seasonal/geographical variability
in the observations.
SummerFall
Winter
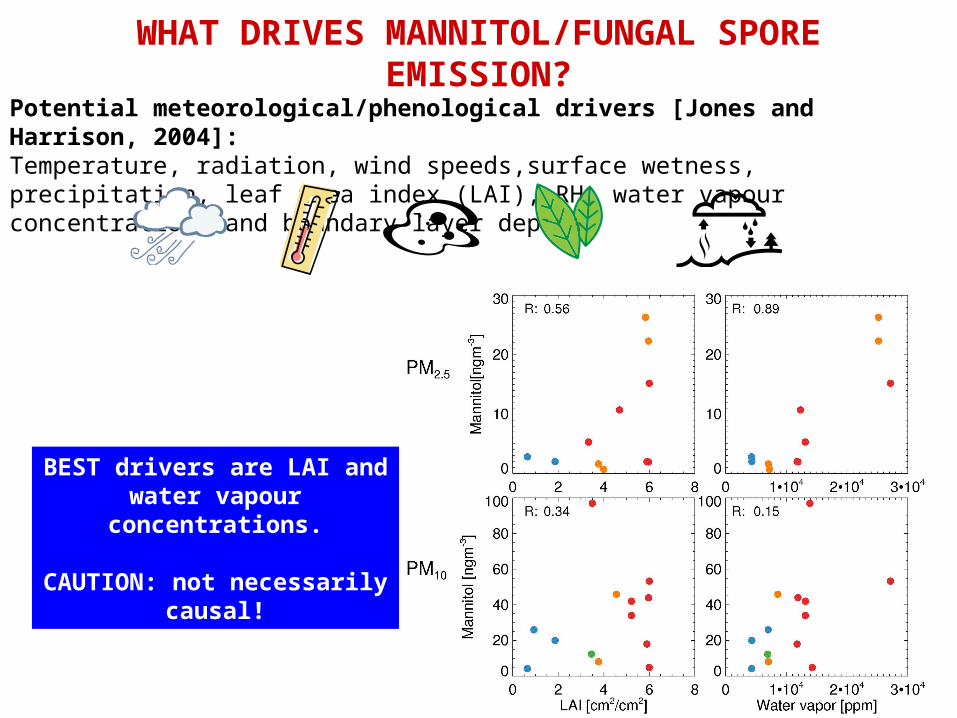
WHAT DRIVES MANNITOL/FUNGAL SPORE EMISSION?Potential meteorological/phenological drivers [Jones and Harrison, 2004]: Temperature, radiation, wind speeds,surface wetness, precipitation, leaf area index (LAI), RH, water vapour concentrations and boundary layer depths
BEST drivers are LAI and water vapour concentrations.
CAUTION: not necessarily causal!
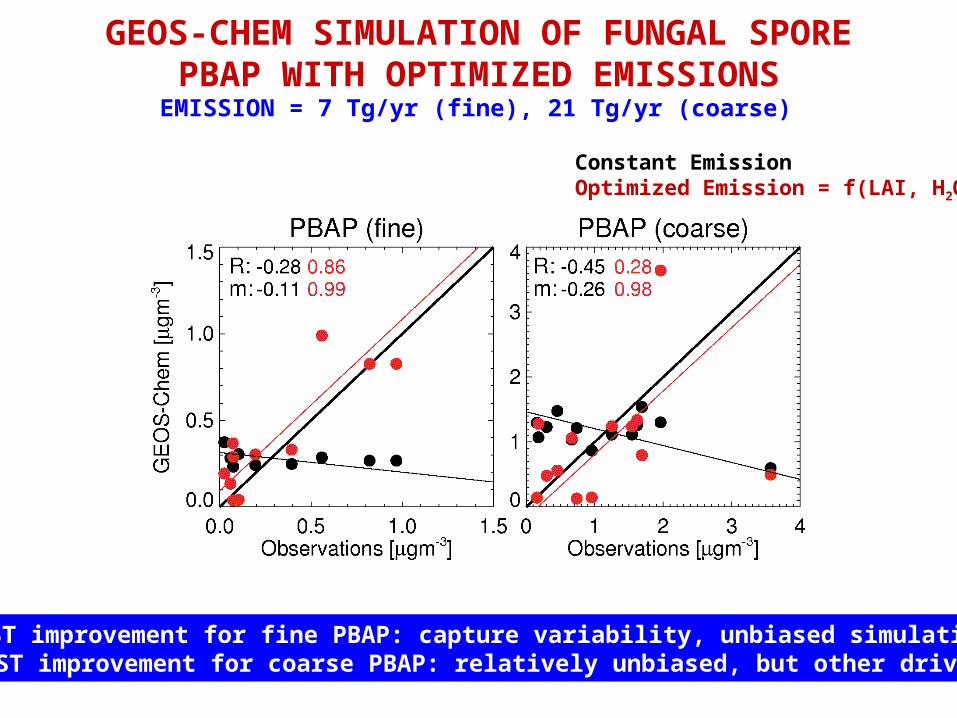
GEOS-CHEM SIMULATION OF FUNGAL SPORE PBAP WITH OPTIMIZED EMISSIONS
Constant EmissionOptimized Emission = f(LAI, H2O)
VAST improvement for fine PBAP: capture variability, unbiased simulationMODEST improvement for coarse PBAP: relatively unbiased, but other drivers?
EMISSION = 7 Tg/yr (fine), 21 Tg/yr (coarse)
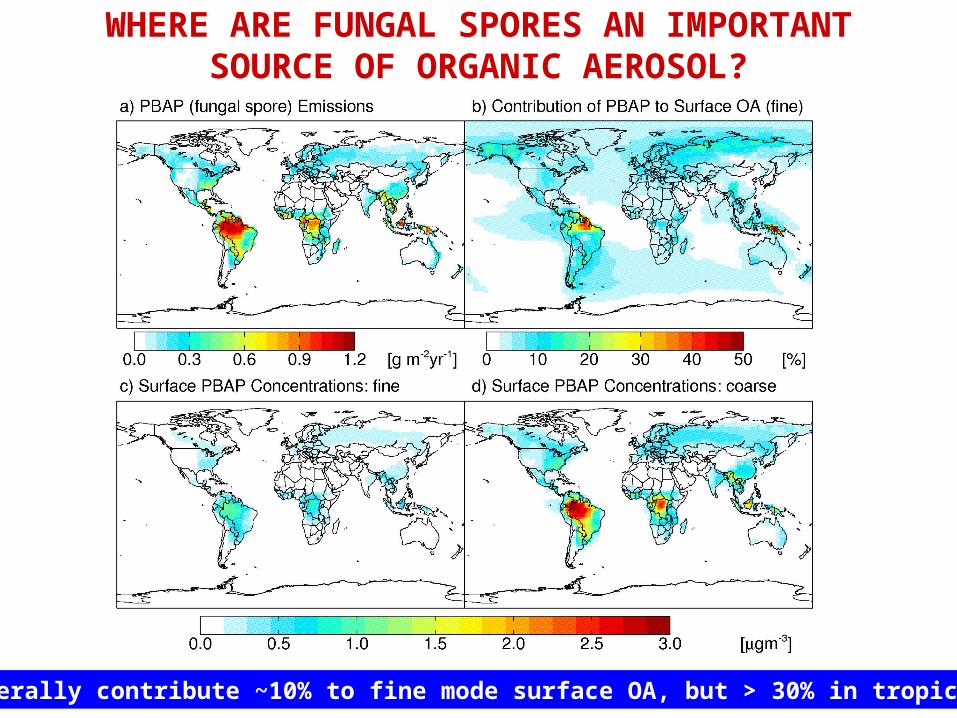
WHERE ARE FUNGAL SPORES AN IMPORTANT SOURCE OF ORGANIC AEROSOL?
Generally contribute ~10% to fine mode surface OA, but > 30% in tropics
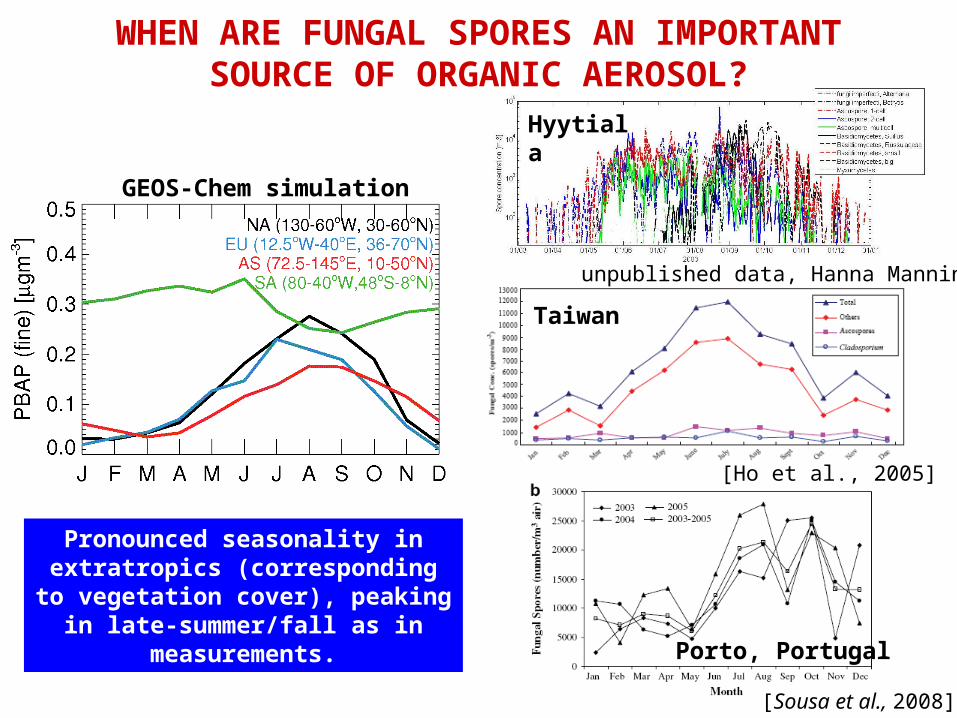
WHEN ARE FUNGAL SPORES AN IMPORTANT SOURCE OF ORGANIC AEROSOL?
Pronounced seasonality in extratropics (corresponding to
vegetation cover), peaking in late-summer/fall as in measurements.
Taiwan
Hyytiala
[Sousa et al., 2008]
[Ho et al., 2005]
unpublished data, Hanna Manninen
Porto, Portugal
GEOS-Chem simulation
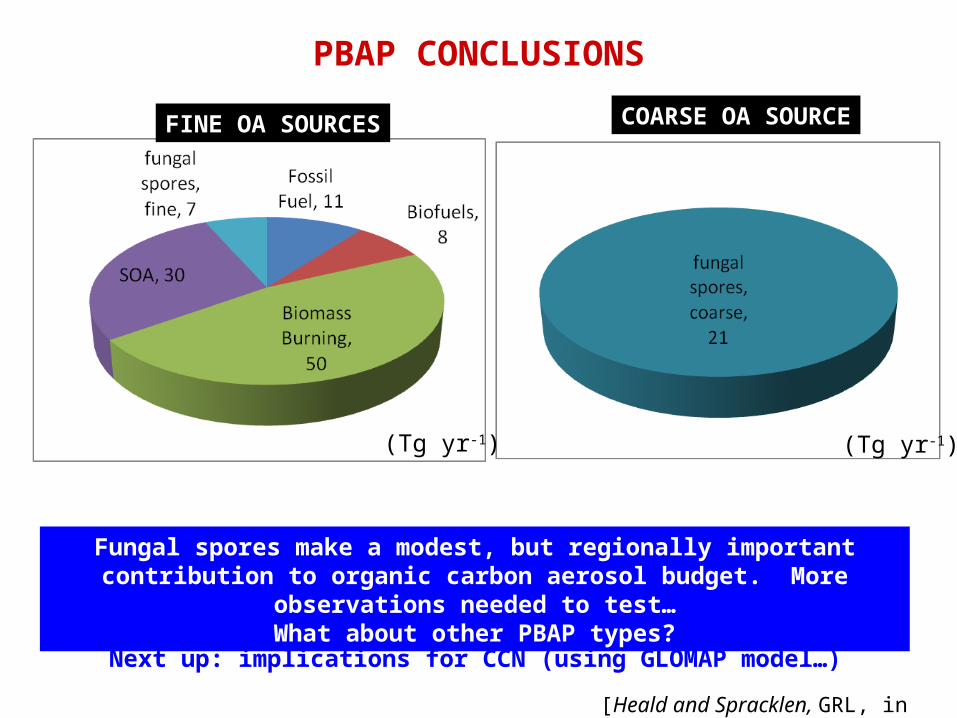
PBAP CONCLUSIONS
Next up: implications for CCN (using GLOMAP model…)
Fungal spores make a modest, but regionally important contribution to organic carbon aerosol budget. More observations needed to test…
What about other PBAP types?
FINE OA SOURCES COARSE OA SOURCE
(Tg yr-1) (Tg yr-1)
[Heald and Spracklen, GRL, in press]
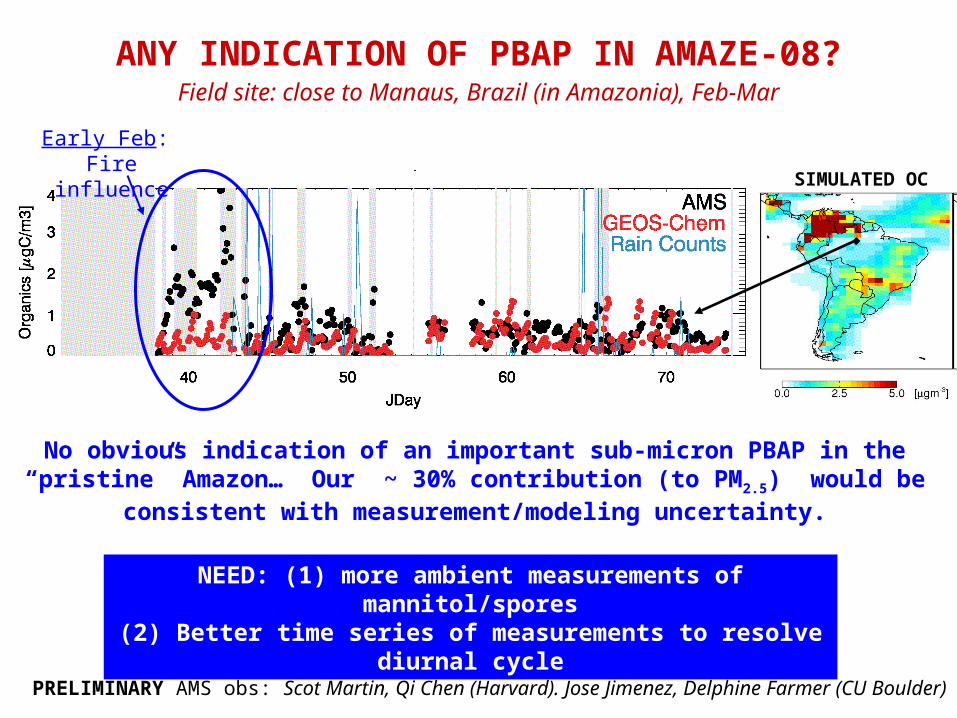
ANY INDICATION OF PBAP IN AMAZE-08?
PRELIMINARY AMS obs: Scot Martin, Qi Chen (Harvard). Jose Jimenez, Delphine Farmer (CU Boulder)
SIMULATED OC
Early Feb: Fire influence
Field site: close to Manaus, Brazil (in Amazonia), Feb-Mar
NEED: (1) more ambient measurements of mannitol/spores(2) Better time series of measurements to resolve diurnal cycle
No obvious indication of an important sub-micron PBAP in the “pristine” Amazon… Our ~ 30% contribution (to PM2.5) would be consistent with
measurement/modeling uncertainty.
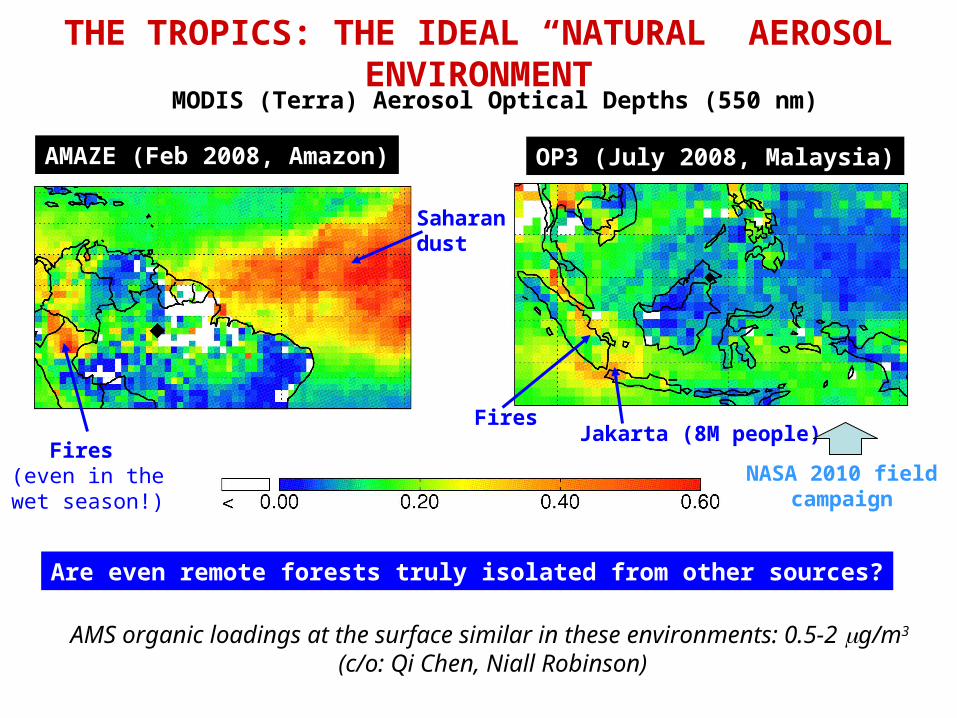
THE TROPICS: THE IDEAL “NATURAL” AEROSOL ENVIRONMENTMODIS (Terra) Aerosol Optical Depths (550 nm)
AMAZE (Feb 2008, Amazon) OP3 (July 2008, Malaysia)
AMS organic loadings at the surface similar in these environments: 0.5-2 g/m3 (c/o: Qi Chen, Niall Robinson)
Are even remote forests truly isolated from other sources?
Fires (even in the wet
season!)
Saharan dust
FiresJakarta (8M people)
NASA 2010 field campaign
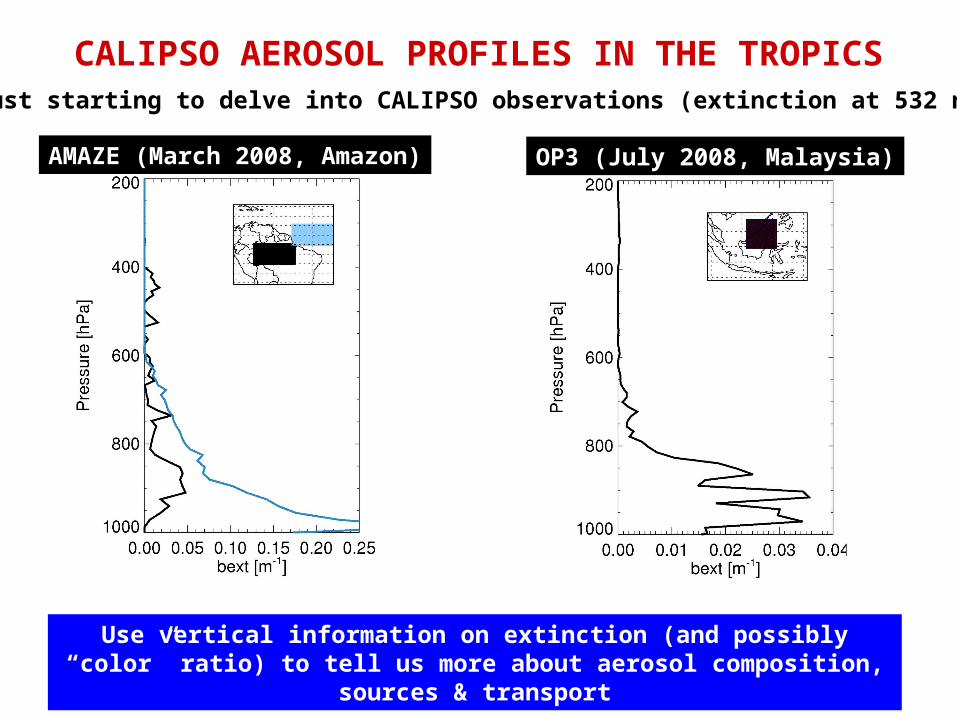
CALIPSO AEROSOL PROFILES IN THE TROPICSJust starting to delve into CALIPSO observations (extinction at 532 nm)….
AMAZE (March 2008, Amazon) OP3 (July 2008, Malaysia)
Use vertical information on extinction (and possibly “color” ratio) to tell us more about aerosol composition, sources & transport
ACKNOWLEDGEMENTS
Dominick Spracklen
Mick Wilkinson, Russ Monson
Clement Alo, Guiling Wang
Alex Guenther
Qi Chen, Scot Martin
Delphine Farmer, Jose Jimenez