Nano- and Multiscale Polymer...
28
Nano- and Multiscale Polymer Composites This report presents a detailed investigation of the properties of nano- and micro- scale particle reinforced poly(ethylene terephthalate), PET. The aim of this work is to demonstrate the effect of the addition of specific nanoclay on the mechanical performance of unreinforced/reinforced glass fibre polymer matrices. 2010 Universidade do Minho TECNA SOE1/P1/E184
Transcript of Nano- and Multiscale Polymer...
Nano- and Multiscale Polymer Composites This report presents a detailed investigation of the properties of nano- and micro-scale particle reinforced poly(ethylene terephthalate), PET. The aim of this work is to demonstrate the effect of the addition of specific nanoclay on the mechanical performance of unreinforced/reinforced glass fibre polymer matrices.
2010
Universidade do Minho TECNA SOE1/P1/E184
Nano- and Multiscale Polymer Composites
Carlos Nuno Veiga Barbosa
Júlio César Machado Viana
TECNA associated members:
Universidade do Minho
Instituto Tecnológico de Aragón
Universidad de Zaragoza
Université de Pau et des Pays de l’Adour
Ecole Nationale d’Ingénieurs de Tarbes
EXECUTIVE SUMMARY
Poly (ethylene terephthalate), PET, has become one of the most important engineering polymers in the
past two decades and has been considered a commodity due to the diversity of its applications, low-cost
and high performance. One way to enhance its properties is to reinforce the PET matrix with inclusions
(e.g. short glass fibres, or nanoparticles). A low percentage of incorporation of added inclusions is desired
to reduce weight, to decrease polymer viscosity and reduce processing equipment wear, without
compromising the polymer properties and costs.
In this work we are mainly interested in studying the influence of inclusions of specific nanoclays
(Cloisite15A) on the mechanical properties of different PET systems [unreinforced (PET00) and glass
fibre reinforced (PET20 and PET35)] at different temperatures. The effects on the crystallization
behaviour, thermal stability, and mechanical properties of these compounds are examined. Industrial
processing methods such as extrusion and injection moulding were used for the preparation of PET
layered silicate nanocomposites.
3
TABLE OF CONTENTS
1. Scope .................................................................................................................................................... 5
2. Masterbatch, mixtures and specimens moulding .................................................................................. 6
2.1 Masterbatch and mixtures preparation ......................................................................................... 6
2.2 Specimens moulding .................................................................................................................... 7
3. Morphological, thermal and mechanical characterization .................................................................... 8
3.1 Wide angle x-ray scattering, WAXS, conditions ......................................................................... 8
3.2 Transmission electron microscopy, TEM, conditions .................................................................. 8
3.3 Scanning electron microscopy, SEM, conditions ......................................................................... 8
3.4 Differential scanning calorimetry, DSC, conditions .................................................................... 8
3.5 Thermogravimetric analysis, TGA, conditions ............................................................................ 9
3.6 tensile tests conditions .................................................................................................................. 9
4. results and discussion ......................................................................................................................... 10
4.1 WAXS results and discussion .................................................................................................... 10
4.2 TEM results and discussion ........................................................................................................ 11
4.3 SEM results and discussion ........................................................................................................ 12
4.4 DSC results and discussion ........................................................................................................ 12
4.5 TGA results and discussion ........................................................................................................ 16
4.6 UMinho tensile test results and discussion @ 23 ºC .................................................................. 17
4.6.1 Neat PET grades @ 23 ºC .................................................................................................. 17
4.6.2 PET00 nanocomposites @ 23 ºC ........................................................................................ 17
4.6.3 PET20 multiscale composites @ 23 ºC .............................................................................. 18
4.6.4 PET35 multiscale composites @ 23 ºC .............................................................................. 18
4.6.5 Discussion of tensile test results @ 23 ºC .......................................................................... 19
4.7 UMinho tensile test results and discussion @ 120 ºC ................................................................ 21
4.7.1 Neat PET grades @ 120 ºC ................................................................................................ 21
4
4.7.2 PET00 nanocomposites @ 120 ºC ...................................................................................... 22
4.7.3 PET20 multiscale composites @ 120 ºC ............................................................................ 22
4.7.4 PET35 multiscale composites @ 120 ºC ............................................................................ 23
4.7.5 Discussion of tensile test results @ 120 ºC ........................................................................ 23
5. CONCLUSIONS ................................................................................................................................ 26
5
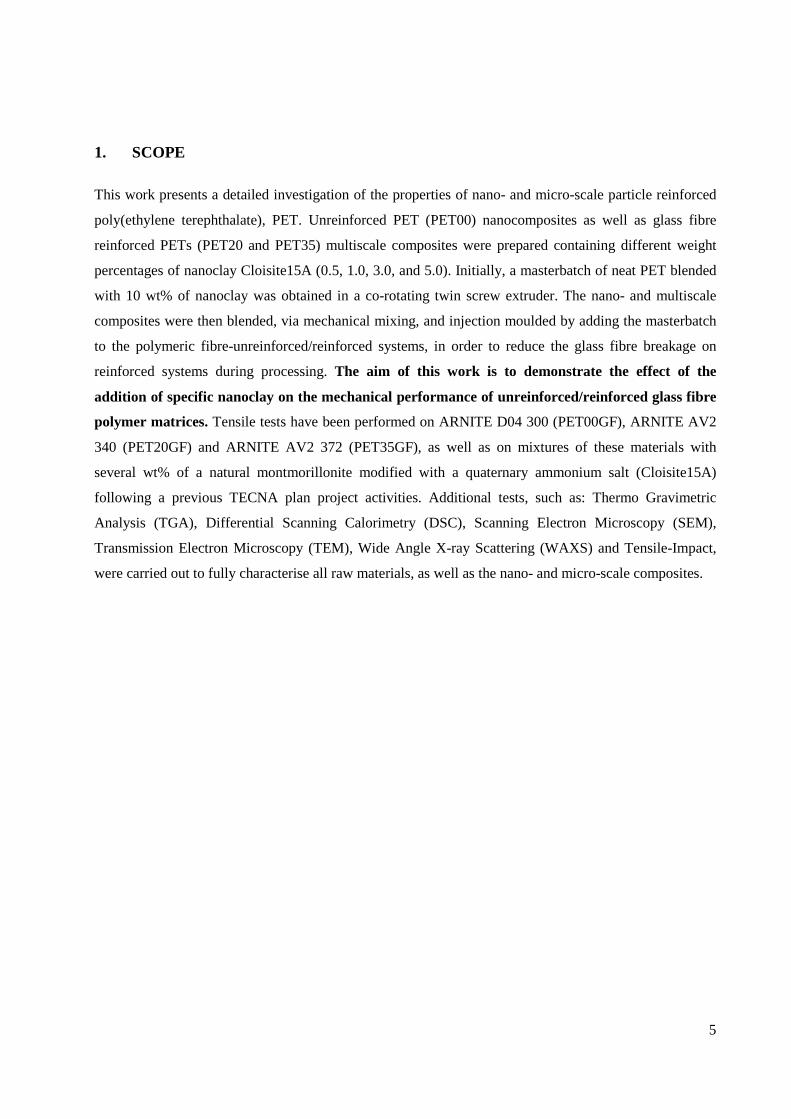
1. SCOPE
This work presents a detailed investigation of the properties of nano- and micro-scale particle reinforced
poly(ethylene terephthalate), PET. Unreinforced PET (PET00) nanocomposites as well as glass fibre
reinforced PETs (PET20 and PET35) multiscale composites were prepared containing different weight
percentages of nanoclay Cloisite15A (0.5, 1.0, 3.0, and 5.0). Initially, a masterbatch of neat PET blended
with 10 wt% of nanoclay was obtained in a co-rotating twin screw extruder. The nano- and multiscale
composites were then blended, via mechanical mixing, and injection moulded by adding the masterbatch
to the polymeric fibre-unreinforced/reinforced systems, in order to reduce the glass fibre breakage on
reinforced systems during processing. The aim of this work is to demonstrate the effect of the
addition of specific nanoclay on the mechanical performance of unreinforced/reinforced glass fibre
polymer matrices. Tensile tests have been performed on ARNITE D04 300 (PET00GF), ARNITE AV2
340 (PET20GF) and ARNITE AV2 372 (PET35GF), as well as on mixtures of these materials with
several wt% of a natural montmorillonite modified with a quaternary ammonium salt (Cloisite15A)
following a previous TECNA plan project activities. Additional tests, such as: Thermo Gravimetric
Analysis (TGA), Differential Scanning Calorimetry (DSC), Scanning Electron Microscopy (SEM),
Transmission Electron Microscopy (TEM), Wide Angle X-ray Scattering (WAXS) and Tensile-Impact,
were carried out to fully characterise all raw materials, as well as the nano- and micro-scale composites.
6
2. MASTERBATCH, MIXTURES AND SPECIMENS MOULDING
2.1 MASTERBATCH AND MIXTURES PREPARATION
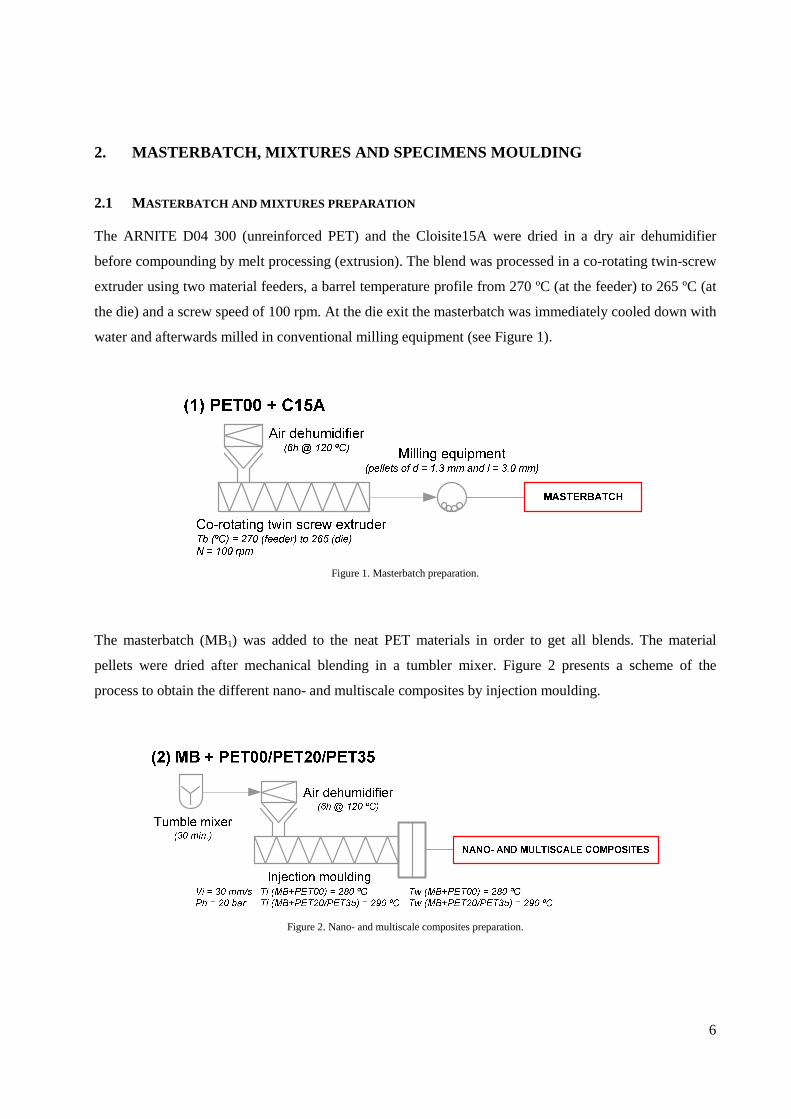
The ARNITE D04 300 (unreinforced PET) and the Cloisite15A were dried in a dry air dehumidifier
before compounding by melt processing (extrusion). The blend was processed in a co-rotating twin-screw
extruder using two material feeders, a barrel temperature profile from 270 ºC (at the feeder) to 265 ºC (at
the die) and a screw speed of 100 rpm. At the die exit the masterbatch was immediately cooled down with
water and afterwards milled in conventional milling equipment (see Figure 1).
Figure 1. Masterbatch preparation.
The masterbatch (MB1) was added to the neat PET materials in order to get all blends. The material
pellets were dried after mechanical blending in a tumbler mixer. Figure 2 presents a scheme of the
process to obtain the different nano- and multiscale composites by injection moulding.
Figure 2. Nano- and multiscale composites preparation.
7
2.2 SPECIMENS MOULDING
Test specimens, described in Table 1, were obtained by injection moulding using the Ferromatik-
Milacron K85 machine. The injection conditions have been fixed according to the material data sheet
(Figure 2 presents the main injection conditions).
Table 1. Sample’s identification at UMinho.
CODE DESCRIPTION
GF00_UM_01-05 ARNITE D04 300 (PET + 00 % GF)
GF20_UM_01-05 ARNITE AV2 340 (PET + 20 % GF)
GF35_UM_01-05 ARNITE AV2 372 (PET + 35 % GF)
GF00_0.5C15A_UM_01-05 ARNITE D04 300 (00 % GF) + CLOISITE 15A (0.5 % NC)
GF00_1.0C15A _UM_01-05 ARNITE D04 300 (00 % GF) + CLOISITE 15A (1.0 % NC)
GF00_3.0C15A _UM_01-05 ARNITE D04 300 (00 % GF) + CLOISITE 15A (3.0 % NC)
GF00_5.0C15A _UM_01-05 ARNITE D04 300 (00 % GF) + CLOISITE 15A (5.0 % NC)
GF20_0.5C15A _UM_01-05 ARNITE AV2 340 (20 % GF) + CLOISITE 15A (0.5 % NC)
GF20_1.0C15A _UM_01-05 ARNITE AV2 340 (20 % GF) + CLOISITE 15A (1.0 % NC)
GF20_3.0C15A _UM_01-05 ARNITE AV2 340 (20 % GF) + CLOISITE 15A (3.0 % NC)
GF20_5.0C15A _UM_01-05 ARNITE AV2 340 (20 % GF) + CLOISITE 15A (5.0 % NC)
GF35_0.5C15A _UM_01-05 ARNITE AV2 372 (35 % GF) + CLOISITE 15A (0.5 % NC)
GF35_1.0C15A _UM_01-05 ARNITE AV2 372 (35 % GF) + CLOISITE 15A (1.0 % NC)
GF35_3.0C15A _UM_01-05 ARNITE AV2 372 (35 % GF) + CLOISITE 15A (3.0 % NC)
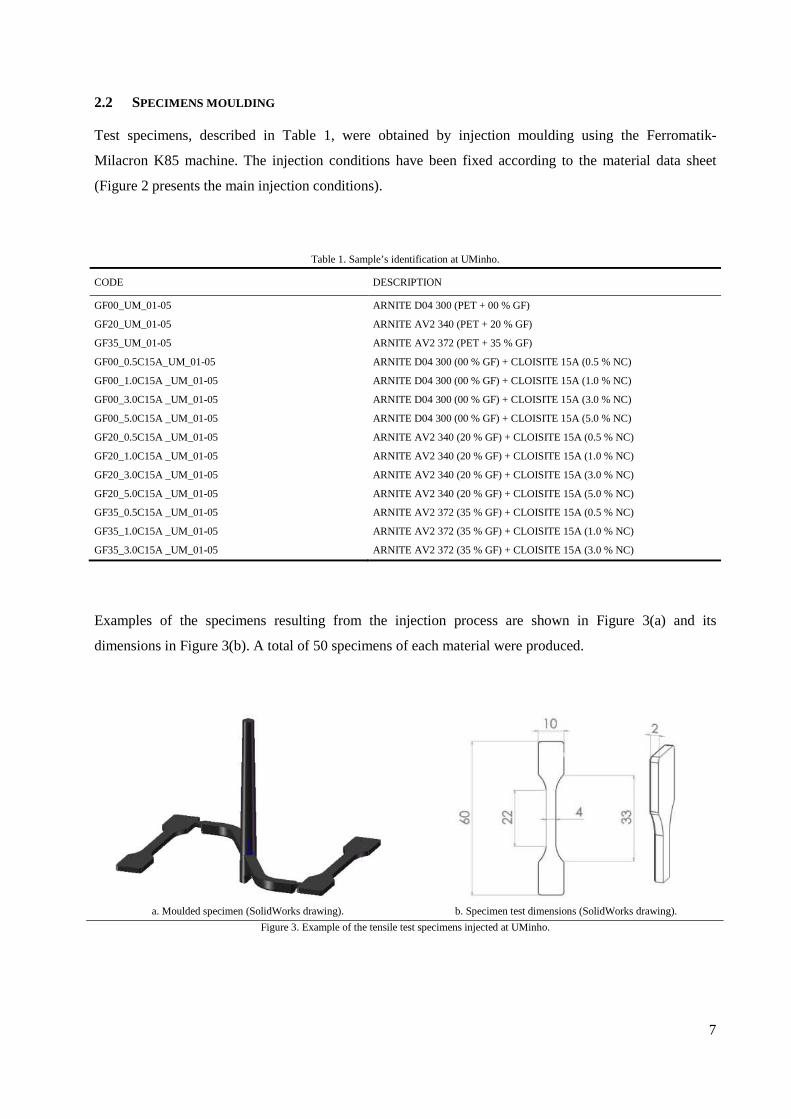
Examples of the specimens resulting from the injection process are shown in Figure 3(a) and its
dimensions in Figure 3(b). A total of 50 specimens of each material were produced.
a. Moulded specimen (SolidWorks drawing).
b. Specimen test dimensions (SolidWorks drawing).
Figure 3. Example of the tensile test specimens injected at UMinho.
8
3. MORPHOLOGICAL, THERMAL AND MECHANICAL CHARACTERIZAT ION
3.1 WIDE ANGLE X -RAY SCATTERING , WAXS, CONDITIONS
Injection moulded samples were characterised by wide angle X-ray scattering, WAXS. These
experiments were performed in a BRUKER D8 Discover diffractometer. Samples were scanned using a
θ/2θ mode X-ray of Cu Kα radiation (λ = 1.5406 Å) at a step size of 0.04 º/min and 2θ range from 2º to
10º. The interlayer spacing of the nanoclay was determined using the Bragg’s law.
� � 2� ��� (1)
where � is the spacing between diffraction lattice planes and θ is the measured diffraction angle. As
aforementioned, characterisation by WAXS was performed in a 2θ range between 2º and 10º
corresponding to a lattice spacing range between 44.14-8.84 Å, respectively. Nanoclay Cloisite15A
presents a catalogue gallery distance of 31.5 Å (peak at 2θ = 2.8º).
3.2 TRANSMISSION ELECTRON MICROSCOPY , TEM, CONDITIONS
All samples were ultramicrotomed with a diamond knife of Diatome on a Leica EM UC7 microtome at
room temperature to give sections with a nominal thickness of 70 nm. The sections were transferred from
water (room temperature) to carbon-coated 150-mesh Cu grids. Bright-field images were obtained at 200
kV, under low-dose conditions, with a FEI TECNAI T20 electron microscope. Low-magnification images
were taken at 38000 and 86000x; high magnification images were taken at 125000x and 400000x.
3.3 SCANNING ELECTRON MICROSCOPY , SEM, CONDITIONS
The fracture surfaces of the samples, broken in liquid nitrogen, were examined by scanning electron
microscopy, using a Nova NanoSEM 200 (FEI).
3.4 DIFFERENTIAL SCANNING CALORIMETRY , DSC, CONDITIONS
A Perkin-Elmer DSC7 running in standard mode was used. The temperature of the cold block was kept at
5 ºC and the nitrogen purge gas flow rate was 20 cm3/min. For evaluating the melting range, heating
9
experiments were performed for all samples, from 30 to 300ºC, at a heating rate of 10 ºC/min. For these
experiments, a base line was obtained with two empty pans, in the same working temperature range and
with the same scanning rate.
Both cold crystallization and melting parameters were obtained from the heating scans. The glass
transition temperature (�) was identified too. Melting (�) and cold crystallization ( ) temperatures
were considered to be the maximum of the endothermic and of the exothermic peaks of the thermographs,
respectively. The melting (��) and the cold crystallization (� ) enthalpies were determined from the
areas of the melting peaks and crystallization peaks, respectively. The calculation of the relative
percentage of crystallinity (� ) was based on a two-phase (crystalline–amorphous) peak area method,
being given by:
� �∆�� � ∆�
∆�� (2)
where ∆� is the enthalpy released during cold crystallization, ∆�� is the enthalpy required for melting,
and ∆�� is the enthalpy of fusion of 100 % crystalline PET, taken to be equal to 120 J/g. The reported
results are the average of three samples.
3.5 THERMOGRAVIMETRIC ANALYSIS , TGA, CONDITIONS
In a TGA experiments, changes in the weight of a specimen are monitored as the specimen is
progressively heated up. This leads to a series of weight-loss steps that allow the components to be
quantitatively measured. The samples were heated up stepwise from 30 ºC to 800 ºC, with a rate of 10
ºC/min in an air atmosphere until the complete decomposition of the PET material was achieved. The
amount of polymer and remaining fillers of each mixture was determined by analysing obtained weight-
loss curves. The temperature of degradation, Tonset, and the temperature at maximum mass loss rate, Tpeak,
were assessed.
3.6 TENSILE TESTS CONDITIONS
Tensile mechanical behaviour of the studied materials was assessed using a universal testing machine –
Shimatzu 50 KN. The tests were carried out at two temperatures (23 ± 2 ºC and 120 ± 2 ºC) and at a strain
rate of 1 mm/min. Tensile tests have been performed in order to analyse the tensile modulus (E), the
stress at yield (σy) and the strain at break (εb) from the stress-strain curves.
10
4. RESULTS AND DISCUSSION
4.1 WAXS RESULTS AND DISCUSSION
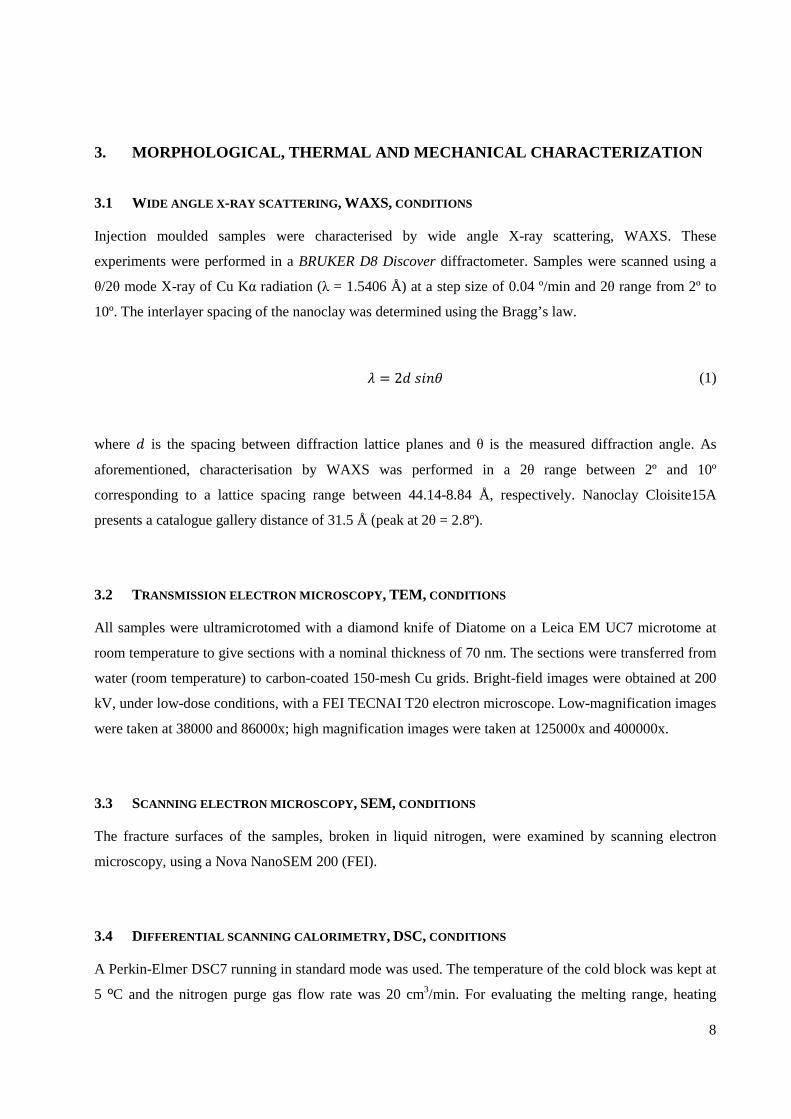
Figure 4 shows the WAXS patterns of Cloisite15A and masterbatch (PET00NC10). Moreover, Table 2
presents the values of the lower angles (2θ) and the basal distance (d001) for all samples. Pristine C15A (in
the absence of polymer) presents a basal gallery distance of 30.23 Å which 2θ peak corresponds to 2.92º
(compared to the 2.8º from the supplier data). For the masterbatch, which was prepared by extrusion
process, a sharper and intense peak appear at approximately 2θ = 2.6º (d001 = 33.95 Å). The slight
increase of about 12 % in the interlayer spacing (by 3.72 Å) suggests that some PET intercalated into the
gallery space and so, the obtained nanocomposite is intercalated rather than fully exfoliated.
Figure 4. WAXS patterns of C15A (Cloisite15A) and MB (masterbatch).
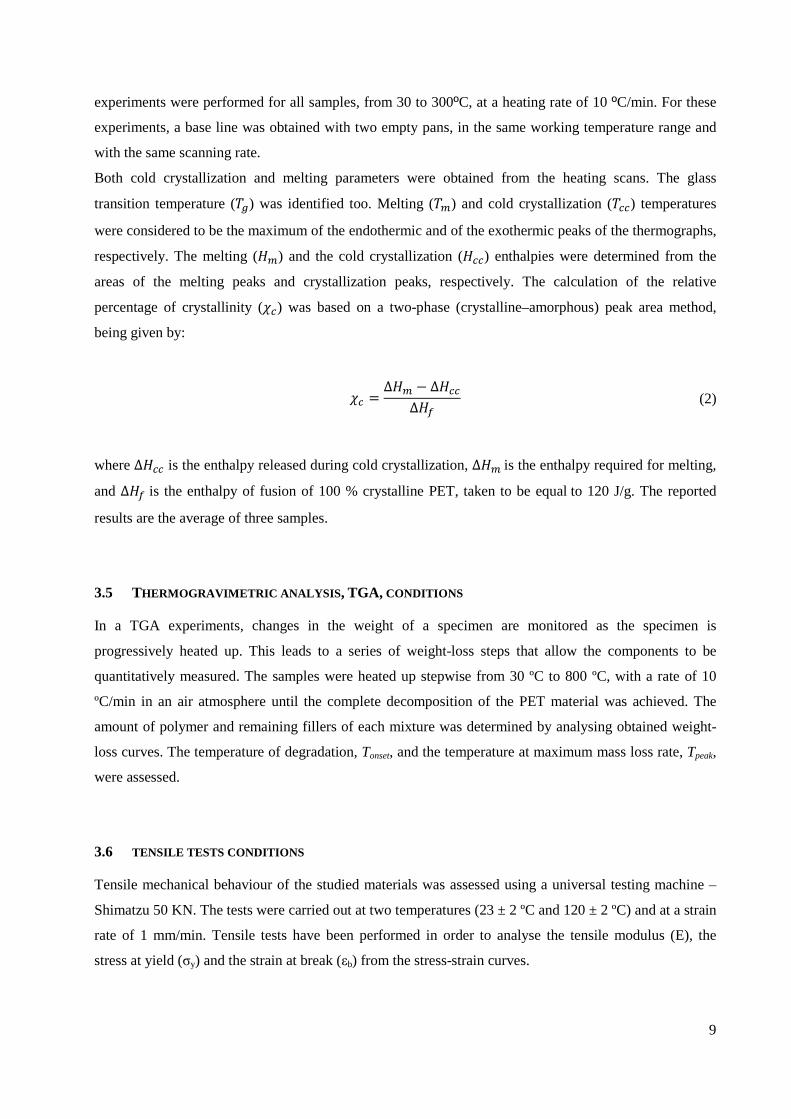
Table 2. WAXS data for nanoclay and PET based nanocomposites.
Sample 2θ (º) d001 (Å) ∆ %
Cloisite15A 2.80 926 31.5
Masterbatch (PET00NC10) 2.48 561 35.6 ▲ 13.0
Mix 1 (PET00NC0.5) 3.00 46 29.4 ▼ 6.7
Mix 2 (PET00NC1.0) 2.84 1878 31.1 ▼ 1.3
Mix 3 (PET00NC3.0) 2.72 1169 32.5 ▲ 3.2
Mix 4 (PET00NC5.0) 2.72 305 32.5 ▲ 3.2
Mix 5 (PET20NC0.5) 3.52 62 25.1 ▼ 20.3
Mix 6 (PET20NC1.0) 3.48 46 25.4 ▼ 19.4
Mix 7 (PET20NC3.0) 2.72 331 32.5 ▲ 3.2
Mix 8 (PET20NC5.0) 2.76 380 32.0 ▲ 1.6
Mix9 (PET35NC0.5) 3.36 50 26.3 ▼ 16.5
Mix10 (PET35NC1.0) 3.56 41 24.8 ▼ 21.3
Mix11 (PET35NC3.0) 2.68 425 32.9 ▲ 4.4
11
Comparing the Table 2 it can be seen that the nanocomposites with amounts of 0.5 wt% of C15A present
the highest angles meaning the lowest gallery distance among all mixtures prepared by injection
moulding. On the other hand the mixtures with 5 wt% of C15A are showing the lowest angles meaning
the highest gallery spacing among all nanocomposites. The interlayer spacing of PET00NC5.0 and
PET20NC5.0 is almost reaching the initial value of the masterbatch. Adding 3 wt% of C15A by mixing
the masterbatch into the PET systems reveals that the basal distance (d001) is still higher than the original
nanoclay, but smaller in comparison to the layer distance in the masterbatch.
This study shows that the basal distance in reprocessed nanocomposites is strongly dependent on the
original gallery spacing of the nanoclay in the masterbatch. The higher the masterbatch amount in
injected polymer systems the closer is its basal distance to the former gallery spacing. Moreover, the
presence of glass fibre reinforcement in a PET matrix seems to have no influence on the intercalation of
the polymer molecules into nanoclay galleries.
As the masterbatch was rather intercalated than exfoliated, it was presumed that all nanocomposites
would present a similar structure, meaning that none of the samples reach fully clay exfoliation. It was
concluded that to produce exfoliation it is necessary to use a different screw configuration (higher shear
rates) and/or different processing conditions (higher residence time and screw speed), or compatibilizers.
4.2 TEM RESULTS AND DISCUSSION
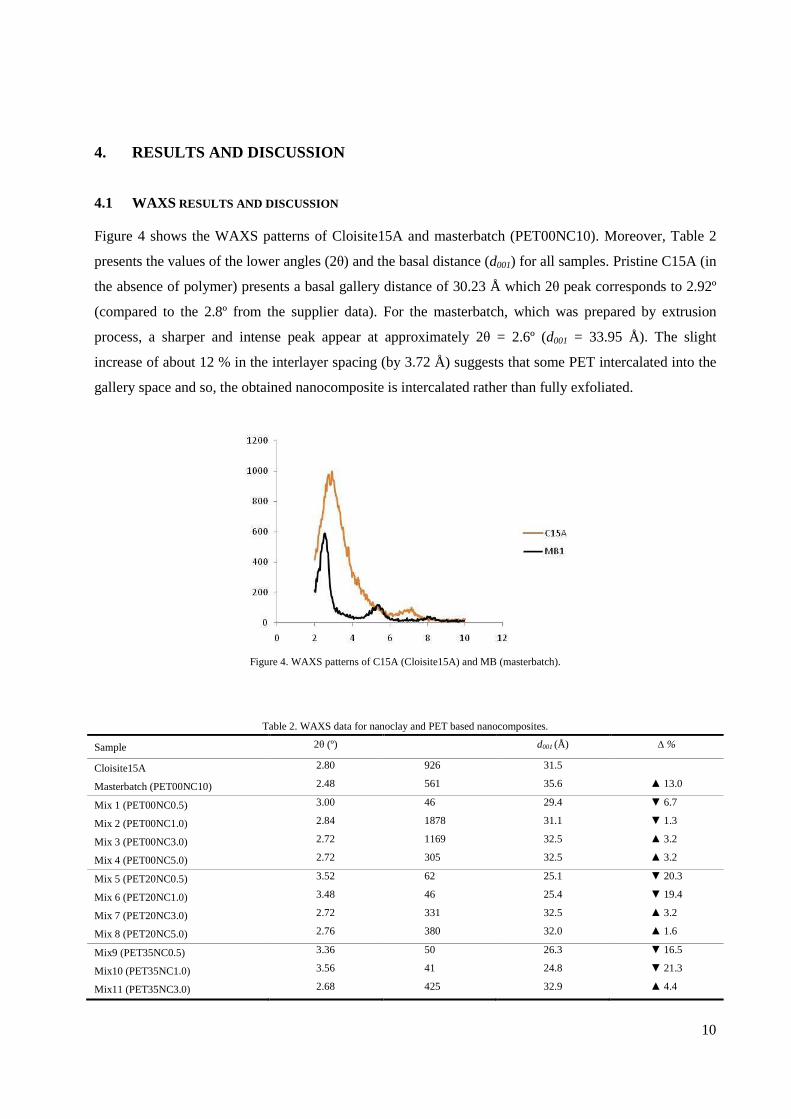
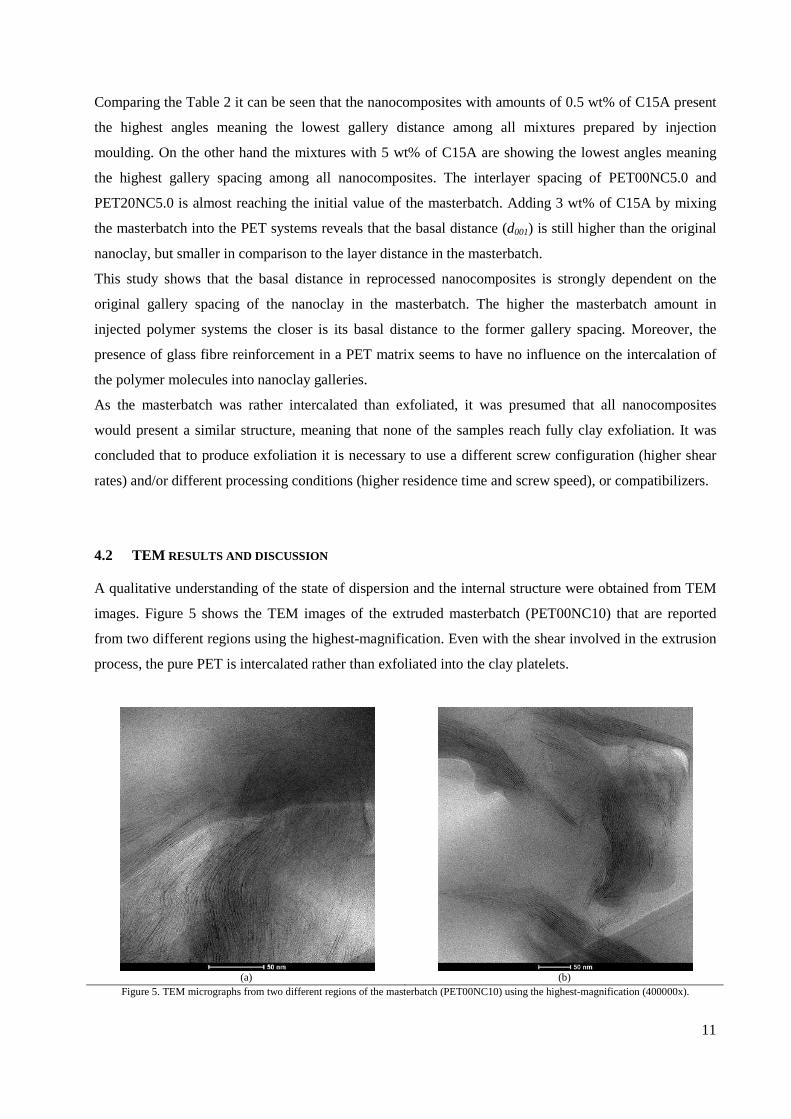
A qualitative understanding of the state of dispersion and the internal structure were obtained from TEM
images. Figure 5 shows the TEM images of the extruded masterbatch (PET00NC10) that are reported
from two different regions using the highest-magnification. Even with the shear involved in the extrusion
process, the pure PET is intercalated rather than exfoliated into the clay platelets.
(a)
(b)
Figure 5. TEM micrographs from two different regions of the masterbatch (PET00NC10) using the highest-magnification (400000x).
12
Exfoliated structure is presumed to be required to impart the nanocomposites with enhanced mechanical
properties, and in many occasions intercalated or less exfoliated structures are discarded. However,
Bousmina (*) found out that the best enhancement in young’s modulus is exhibited by samples that have
intermediate level of exfoliation rather than fully exfoliated (meaning a percolation network). (*) M. Bousmina, “Study of intercalation and exfoliation processes in polymer nanocomposites,” Macromolecules, vol. 39,
2006, pp. 4259-4263
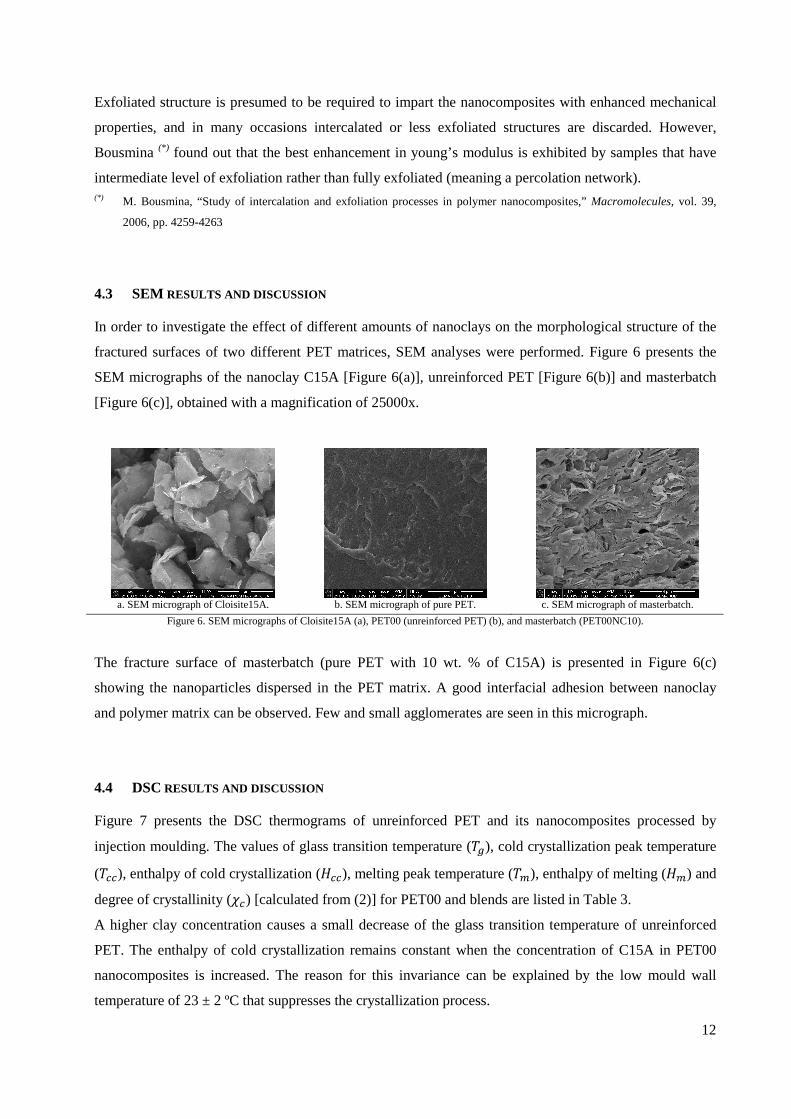
4.3 SEM RESULTS AND DISCUSSION
In order to investigate the effect of different amounts of nanoclays on the morphological structure of the
fractured surfaces of two different PET matrices, SEM analyses were performed. Figure 6 presents the
SEM micrographs of the nanoclay C15A [Figure 6(a)], unreinforced PET [Figure 6(b)] and masterbatch
[Figure 6(c)], obtained with a magnification of 25000x.
a. SEM micrograph of Cloisite15A.
b. SEM micrograph of pure PET.
c. SEM micrograph of masterbatch.
Figure 6. SEM micrographs of Cloisite15A (a), PET00 (unreinforced PET) (b), and masterbatch (PET00NC10).
The fracture surface of masterbatch (pure PET with 10 wt. % of C15A) is presented in Figure 6(c)
showing the nanoparticles dispersed in the PET matrix. A good interfacial adhesion between nanoclay
and polymer matrix can be observed. Few and small agglomerates are seen in this micrograph.
4.4 DSC RESULTS AND DISCUSSION
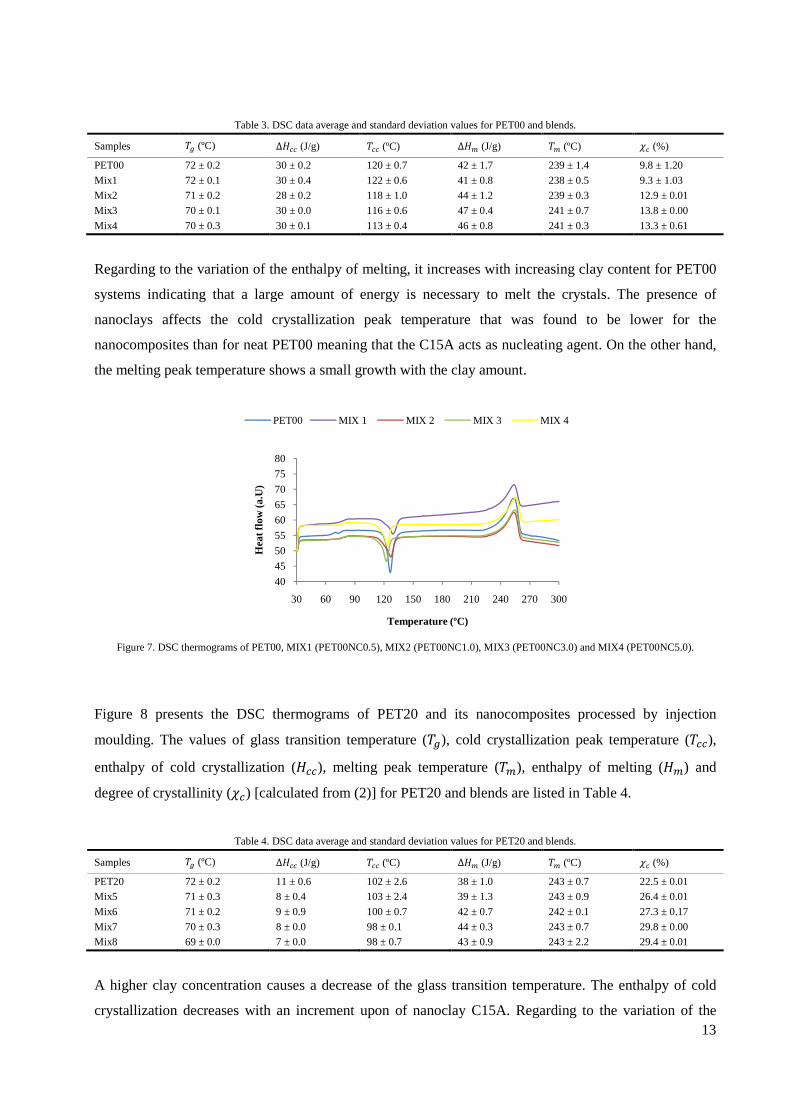
Figure 7 presents the DSC thermograms of unreinforced PET and its nanocomposites processed by
injection moulding. The values of glass transition temperature (�), cold crystallization peak temperature
( ), enthalpy of cold crystallization (� ), melting peak temperature (�), enthalpy of melting (��) and
degree of crystallinity (� ) [calculated from (2)] for PET00 and blends are listed in Table 3.
A higher clay concentration causes a small decrease of the glass transition temperature of unreinforced
PET. The enthalpy of cold crystallization remains constant when the concentration of C15A in PET00
nanocomposites is increased. The reason for this invariance can be explained by the low mould wall
temperature of 23 ± 2 ºC that suppresses the crystallization process.
13
Table 3. DSC data average and standard deviation values for PET00 and blends.
Samples � (ºC) ∆� (J/g) (ºC) ∆�� (J/g) � (ºC) � (%)
PET00 72 ± 0.2 30 ± 0.2 120 ± 0.7 42 ± 1.7 239 ± 1.4 9.8 ± 1.20
Mix1 72 ± 0.1 30 ± 0.4 122 ± 0.6 41 ± 0.8 238 ± 0.5 9.3 ± 1.03
Mix2 71 ± 0.2 28 ± 0.2 118 ± 1.0 44 ± 1.2 239 ± 0.3 12.9 ± 0.01
Mix3 70 ± 0.1 30 ± 0.0 116 ± 0.6 47 ± 0.4 241 ± 0.7 13.8 ± 0.00
Mix4 70 ± 0.3 30 ± 0.1 113 ± 0.4 46 ± 0.8 241 ± 0.3 13.3 ± 0.61
Regarding to the variation of the enthalpy of melting, it increases with increasing clay content for PET00
systems indicating that a large amount of energy is necessary to melt the crystals. The presence of
nanoclays affects the cold crystallization peak temperature that was found to be lower for the
nanocomposites than for neat PET00 meaning that the C15A acts as nucleating agent. On the other hand,
the melting peak temperature shows a small growth with the clay amount.
Figure 7. DSC thermograms of PET00, MIX1 (PET00NC0.5), MIX2 (PET00NC1.0), MIX3 (PET00NC3.0) and MIX4 (PET00NC5.0).
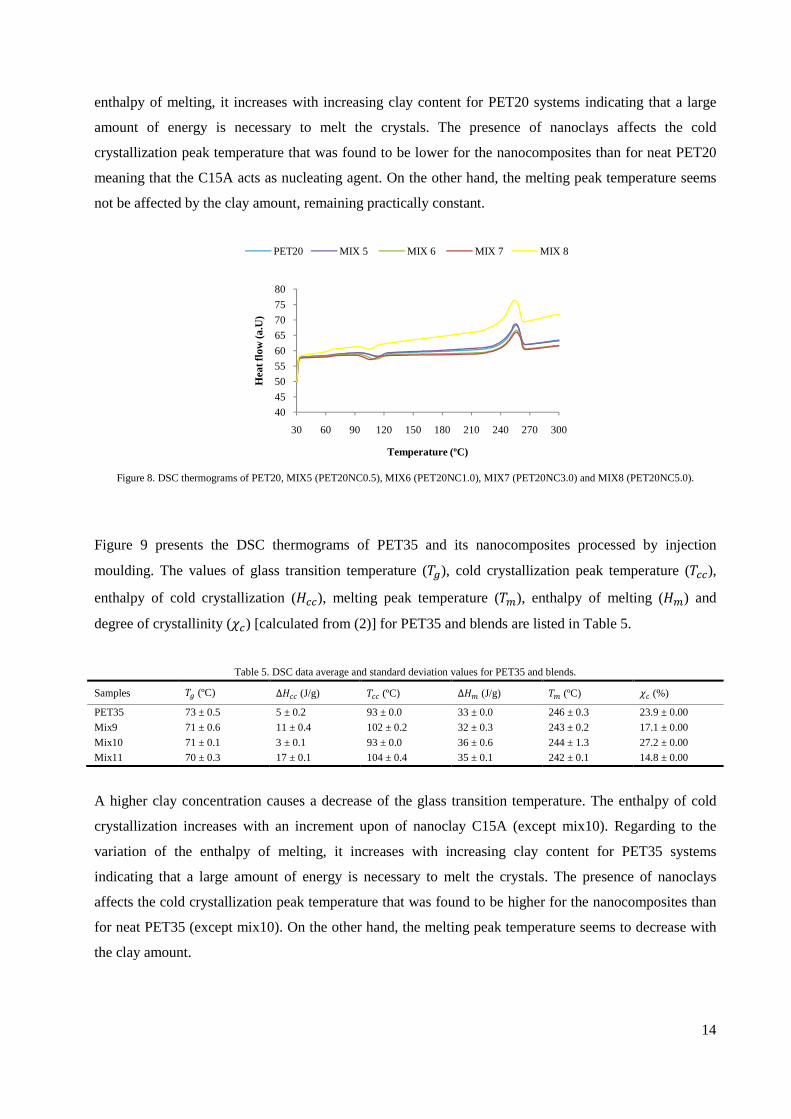
Figure 8 presents the DSC thermograms of PET20 and its nanocomposites processed by injection
moulding. The values of glass transition temperature (�), cold crystallization peak temperature ( ),
enthalpy of cold crystallization (� ), melting peak temperature (�), enthalpy of melting (��) and
degree of crystallinity (� ) [calculated from (2)] for PET20 and blends are listed in Table 4.
Table 4. DSC data average and standard deviation values for PET20 and blends.
Samples � (ºC) ∆� (J/g) (ºC) ∆�� (J/g) � (ºC) � (%)
PET20 72 ± 0.2 11 ± 0.6 102 ± 2.6 38 ± 1.0 243 ± 0.7 22.5 ± 0.01
Mix5 71 ± 0.3 8 ± 0.4 103 ± 2.4 39 ± 1.3 243 ± 0.9 26.4 ± 0.01
Mix6 71 ± 0.2 9 ± 0.9 100 ± 0.7 42 ± 0.7 242 ± 0.1 27.3 ± 0.17
Mix7 70 ± 0.3 8 ± 0.0 98 ± 0.1 44 ± 0.3 243 ± 0.7 29.8 ± 0.00
Mix8 69 ± 0.0 7 ± 0.0 98 ± 0.7 43 ± 0.9 243 ± 2.2 29.4 ± 0.01
A higher clay concentration causes a decrease of the glass transition temperature. The enthalpy of cold
crystallization decreases with an increment upon of nanoclay C15A. Regarding to the variation of the
40
45
50
55
60
65
70
75
80
30 60 90 120 150 180 210 240 270 300
Hea
t flo
w (a
.U)
Temperature (ºC)
PET00 MIX 1 MIX 2 MIX 3 MIX 4
14
enthalpy of melting, it increases with increasing clay content for PET20 systems indicating that a large
amount of energy is necessary to melt the crystals. The presence of nanoclays affects the cold
crystallization peak temperature that was found to be lower for the nanocomposites than for neat PET20
meaning that the C15A acts as nucleating agent. On the other hand, the melting peak temperature seems
not be affected by the clay amount, remaining practically constant.
Figure 8. DSC thermograms of PET20, MIX5 (PET20NC0.5), MIX6 (PET20NC1.0), MIX7 (PET20NC3.0) and MIX8 (PET20NC5.0).
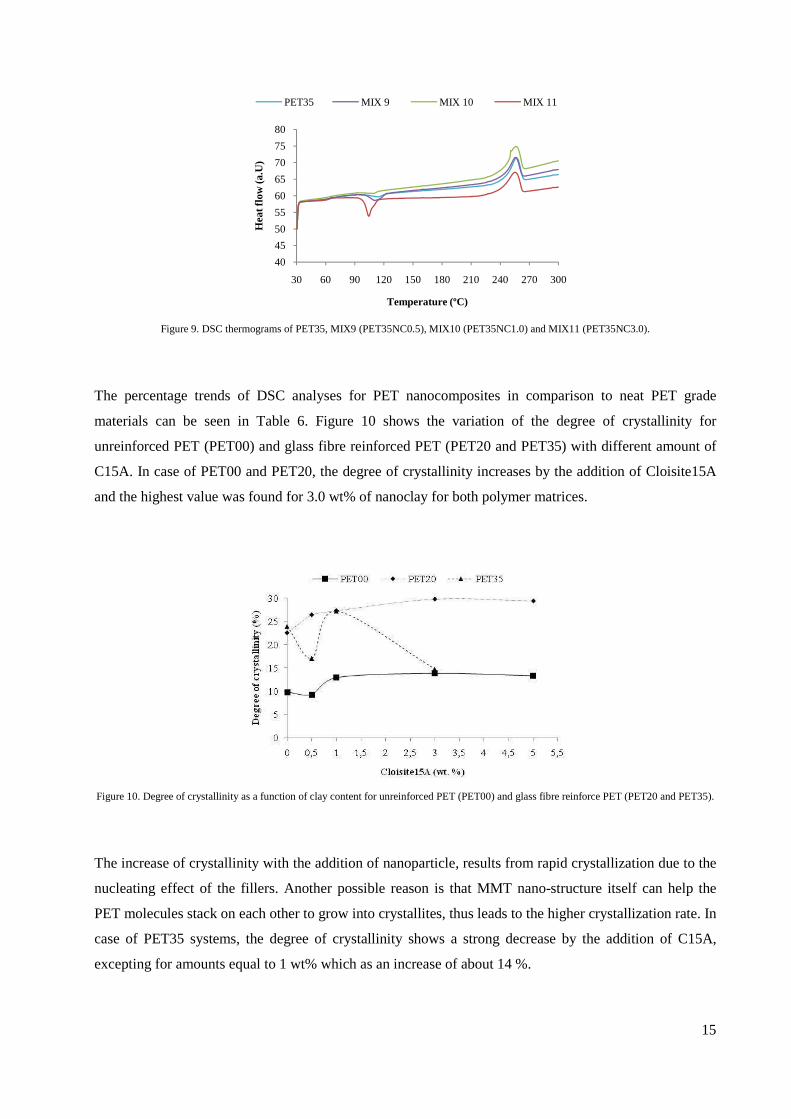
Figure 9 presents the DSC thermograms of PET35 and its nanocomposites processed by injection
moulding. The values of glass transition temperature (�), cold crystallization peak temperature ( ),
enthalpy of cold crystallization (� ), melting peak temperature (�), enthalpy of melting (��) and
degree of crystallinity (� ) [calculated from (2)] for PET35 and blends are listed in Table 5.
Table 5. DSC data average and standard deviation values for PET35 and blends.
Samples � (ºC) ∆� (J/g) (ºC) ∆�� (J/g) � (ºC) � (%)
PET35 73 ± 0.5 5 ± 0.2 93 ± 0.0 33 ± 0.0 246 ± 0.3 23.9 ± 0.00
Mix9 71 ± 0.6 11 ± 0.4 102 ± 0.2 32 ± 0.3 243 ± 0.2 17.1 ± 0.00
Mix10 71 ± 0.1 3 ± 0.1 93 ± 0.0 36 ± 0.6 244 ± 1.3 27.2 ± 0.00
Mix11 70 ± 0.3 17 ± 0.1 104 ± 0.4 35 ± 0.1 242 ± 0.1 14.8 ± 0.00
A higher clay concentration causes a decrease of the glass transition temperature. The enthalpy of cold
crystallization increases with an increment upon of nanoclay C15A (except mix10). Regarding to the
variation of the enthalpy of melting, it increases with increasing clay content for PET35 systems
indicating that a large amount of energy is necessary to melt the crystals. The presence of nanoclays
affects the cold crystallization peak temperature that was found to be higher for the nanocomposites than
for neat PET35 (except mix10). On the other hand, the melting peak temperature seems to decrease with
the clay amount.
40
45
50
55
60
65
70
75
80
30 60 90 120 150 180 210 240 270 300
Hea
t flo
w (a
.U)
Temperature (ºC)
PET20 MIX 5 MIX 6 MIX 7 MIX 8
15
Figure 9. DSC thermograms of PET35, MIX9 (PET35NC0.5), MIX10 (PET35NC1.0) and MIX11 (PET35NC3.0).
The percentage trends of DSC analyses for PET nanocomposites in comparison to neat PET grade
materials can be seen in Table 6. Figure 10 shows the variation of the degree of crystallinity for
unreinforced PET (PET00) and glass fibre reinforced PET (PET20 and PET35) with different amount of
C15A. In case of PET00 and PET20, the degree of crystallinity increases by the addition of Cloisite15A
and the highest value was found for 3.0 wt% of nanoclay for both polymer matrices.
Figure 10. Degree of crystallinity as a function of clay content for unreinforced PET (PET00) and glass fibre reinforce PET (PET20 and PET35).
The increase of crystallinity with the addition of nanoparticle, results from rapid crystallization due to the
nucleating effect of the fillers. Another possible reason is that MMT nano-structure itself can help the
PET molecules stack on each other to grow into crystallites, thus leads to the higher crystallization rate. In
case of PET35 systems, the degree of crystallinity shows a strong decrease by the addition of C15A,
excepting for amounts equal to 1 wt% which as an increase of about 14 %.
40
45
50
55
60
65
70
75
80
30 60 90 120 150 180 210 240 270 300
Hea
t flo
w (a
.U)
Temperature (ºC)
PET35 MIX 9 MIX 10 MIX 11
16
Table 6. Percentage trends of DSC analyses for PET nanocomposites in comparison to neat PET grade materials.
Material C15A (wt. %) � ∆� ∆�� � �
PET00
0.5 ≈ ≈ ▲ 1.7 ▼ 2.4 ▼ 0.4 ▼ 5.1
1.0 ▼ 1.4 ▼ 6.7 ▼ 1.7 ▲ 4.8 ≈ ▲ 31.6
3.0 ▼ 2.8 ≈ ▼ 3.3 ▲ 11.9 ▲ 0.8 ▲ 40.1
5.0 ▼ 2.8 ≈ ▼ 5.8 ▲ 9.5 ▲ 0.8 ▲ 35.7
PET20
0.5 ▼ 1.4 ▼ 27.3 ▲ 1.0 ▲ 2.6 ≈ ▲ 17.3
1.0 ▼ 1.4 ▼ 18.2 ▼ 2.0 ▲ 10.5 ▼ 0.4 ▲ 21.3
3.0 ▼ 2.8 ▼ 27.3 ▼ 3.9 ▲ 15.8 ≈ ▲ 32.4
5.0 ▼ 4.2 ▼ 36.4 ▼ 3.9 ▲ 13.2 ≈ ▲ 30.7
PET35
0.5 ▼ 2.7 ▲ 12.0 ▲ 9.7 ▼ 3.0 ▼ 1.2 ▼ 28.5
1.0 ▼ 2.7 ▼ 40 ≈ ▲ 9.1 ▼ 0.8 ▲ 13.8
3.0 ▼ 4.1 ▲ 24.0 ▲ 11.8 ▲ 6.1 ▼ 1.6 ▼ 38.1
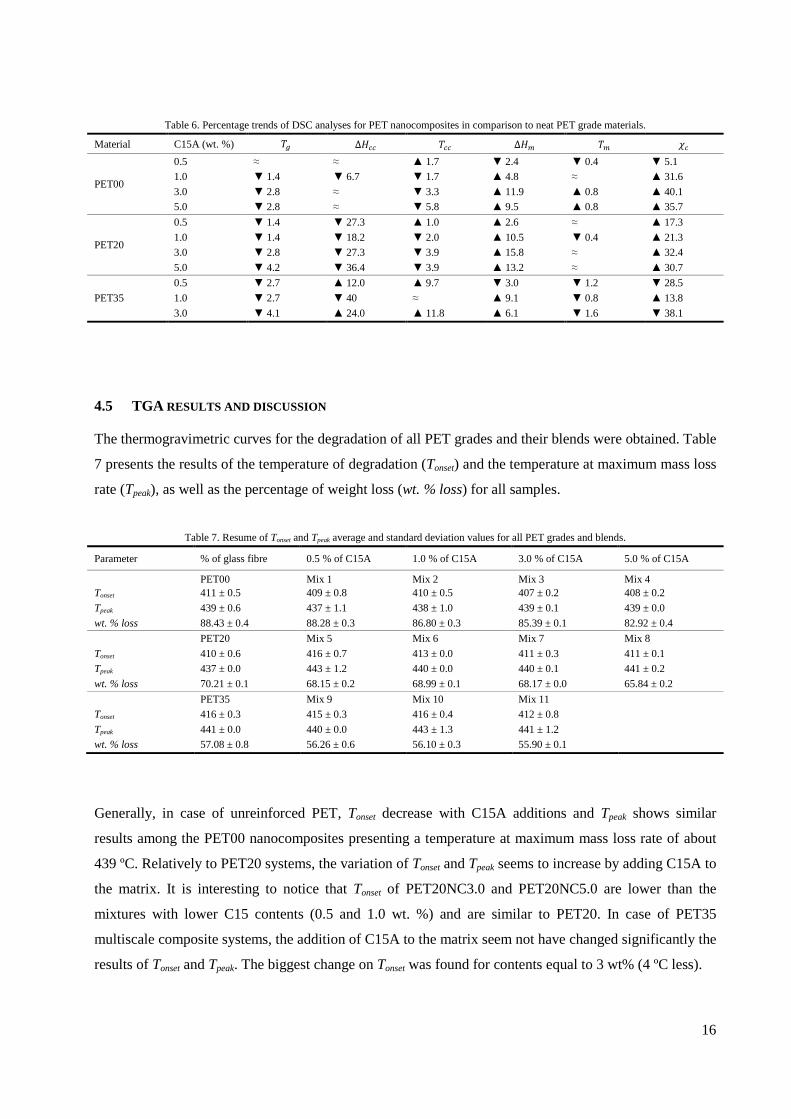
4.5 TGA RESULTS AND DISCUSSION
The thermogravimetric curves for the degradation of all PET grades and their blends were obtained. Table
7 presents the results of the temperature of degradation (Tonset) and the temperature at maximum mass loss
rate (Tpeak), as well as the percentage of weight loss (wt. % loss) for all samples.
Table 7. Resume of Tonset and Tpeak average and standard deviation values for all PET grades and blends.
Parameter % of glass fibre 0.5 % of C15A 1.0 % of C15A 3.0 % of C15A 5.0 % of C15A
PET00 Mix 1 Mix 2 Mix 3 Mix 4 Tonset 411 ± 0.5 409 ± 0.8 410 ± 0.5 407 ± 0.2 408 ± 0.2
Tpeak 439 ± 0.6 437 ± 1.1 438 ± 1.0 439 ± 0.1 439 ± 0.0
wt. % loss 88.43 ± 0.4 88.28 ± 0.3 86.80 ± 0.3 85.39 ± 0.1 82.92 ± 0.4
PET20 Mix 5 Mix 6 Mix 7 Mix 8
Tonset 410 ± 0.6 416 ± 0.7 413 ± 0.0 411 ± 0.3 411 ± 0.1
Tpeak 437 ± 0.0 443 ± 1.2 440 ± 0.0 440 ± 0.1 441 ± 0.2
wt. % loss 70.21 ± 0.1 68.15 ± 0.2 68.99 ± 0.1 68.17 ± 0.0 65.84 ± 0.2
PET35 Mix 9 Mix 10 Mix 11
Tonset 416 ± 0.3 415 ± 0.3 416 ± 0.4 412 ± 0.8
Tpeak 441 ± 0.0 440 ± 0.0 443 ± 1.3 441 ± 1.2
wt. % loss 57.08 ± 0.8 56.26 ± 0.6 56.10 ± 0.3 55.90 ± 0.1
Generally, in case of unreinforced PET, Tonset decrease with C15A additions and Tpeak shows similar
results among the PET00 nanocomposites presenting a temperature at maximum mass loss rate of about
439 ºC. Relatively to PET20 systems, the variation of Tonset and Tpeak seems to increase by adding C15A to
the matrix. It is interesting to notice that Tonset of PET20NC3.0 and PET20NC5.0 are lower than the
mixtures with lower C15 contents (0.5 and 1.0 wt. %) and are similar to PET20. In case of PET35
multiscale composite systems, the addition of C15A to the matrix seem not have changed significantly the
results of Tonset and Tpeak. The biggest change on Tonset was found for contents equal to 3 wt% (4 ºC less).
17
4.6 UM INHO TENSILE TEST RESULTS AND DISCUSSION @ 23 ºC
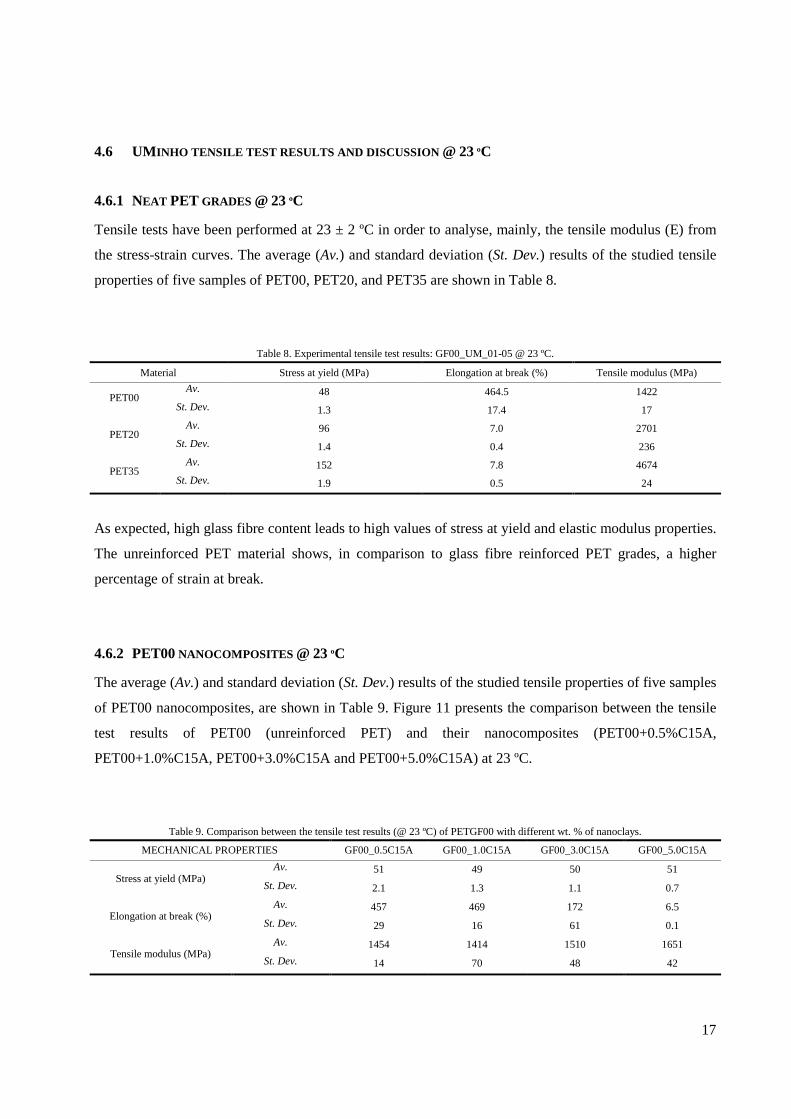
4.6.1 NEAT PET GRADES @ 23 ºC
Tensile tests have been performed at 23 ± 2 ºC in order to analyse, mainly, the tensile modulus (E) from
the stress-strain curves. The average (Av.) and standard deviation (St. Dev.) results of the studied tensile
properties of five samples of PET00, PET20, and PET35 are shown in Table 8.
Table 8. Experimental tensile test results: GF00_UM_01-05 @ 23 ºC.
Material Stress at yield (MPa) Elongation at break (%) Tensile modulus (MPa)
PET00 Av. 48 464.5 1422
St. Dev. 1.3 17.4 17
PET20 Av. 96 7.0 2701
St. Dev. 1.4 0.4 236
PET35 Av. 152 7.8 4674
St. Dev. 1.9 0.5 24
As expected, high glass fibre content leads to high values of stress at yield and elastic modulus properties.
The unreinforced PET material shows, in comparison to glass fibre reinforced PET grades, a higher
percentage of strain at break.
4.6.2 PET00 NANOCOMPOSITES @ 23 ºC
The average (Av.) and standard deviation (St. Dev.) results of the studied tensile properties of five samples
of PET00 nanocomposites, are shown in Table 9. Figure 11 presents the comparison between the tensile
test results of PET00 (unreinforced PET) and their nanocomposites (PET00+0.5%C15A,
PET00+1.0%C15A, PET00+3.0%C15A and PET00+5.0%C15A) at 23 ºC.
Table 9. Comparison between the tensile test results (@ 23 ºC) of PETGF00 with different wt. % of nanoclays.
MECHANICAL PROPERTIES GF00_0.5C15A GF00_1.0C15A GF00_3.0C15A GF00_5.0C15A
Stress at yield (MPa) Av. 51 49 50 51
St. Dev. 2.1 1.3 1.1 0.7
Elongation at break (%) Av. 457 469 172 6.5
St. Dev. 29 16 61 0.1
Tensile modulus (MPa) Av. 1454 1414 1510 1651
St. Dev. 14 70 48 42
18
a. Stress at yield (MPa).
b. Strain at break (%).
c. Elastic modulus (MPa).
Figure 11. Comparison between the tensile test results (@ 23 ºC) of neat PETGF00 with PETGF00 + wt. % of nanoclays.
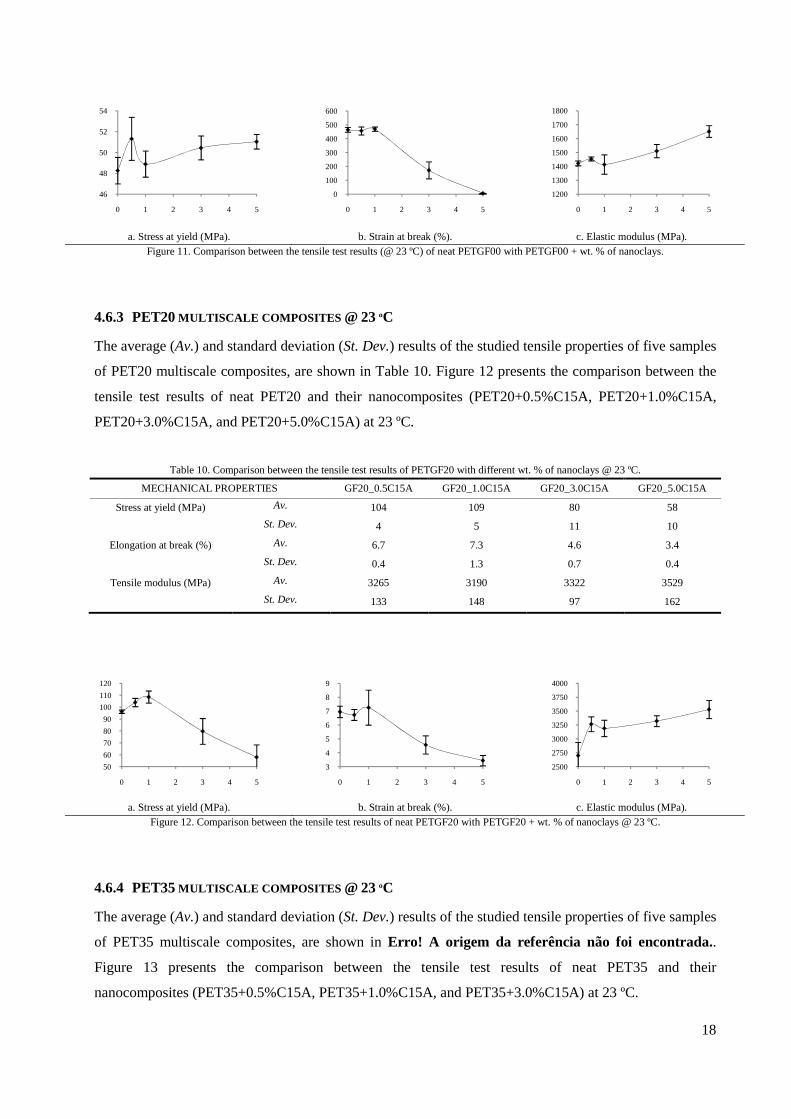
4.6.3 PET20 MULTISCALE COMPOSITES @ 23 ºC
The average (Av.) and standard deviation (St. Dev.) results of the studied tensile properties of five samples
of PET20 multiscale composites, are shown in Table 10. Figure 12 presents the comparison between the
tensile test results of neat PET20 and their nanocomposites (PET20+0.5%C15A, PET20+1.0%C15A,
PET20+3.0%C15A, and PET20+5.0%C15A) at 23 ºC.
Table 10. Comparison between the tensile test results of PETGF20 with different wt. % of nanoclays @ 23 ºC.
MECHANICAL PROPERTIES GF20_0.5C15A GF20_1.0C15A GF20_3.0C15A GF20_5.0C15A
Stress at yield (MPa) Av. 104 109 80 58
St. Dev. 4 5 11 10
Elongation at break (%) Av. 6.7 7.3 4.6 3.4
St. Dev. 0.4 1.3 0.7 0.4
Tensile modulus (MPa) Av. 3265 3190 3322 3529
St. Dev. 133 148 97 162
a. Stress at yield (MPa).
b. Strain at break (%).
c. Elastic modulus (MPa).
Figure 12. Comparison between the tensile test results of neat PETGF20 with PETGF20 + wt. % of nanoclays @ 23 ºC.
4.6.4 PET35 MULTISCALE COMPOSITES @ 23 ºC
The average (Av.) and standard deviation (St. Dev.) results of the studied tensile properties of five samples
of PET35 multiscale composites, are shown in Erro! A origem da referência não foi encontrada..
Figure 13 presents the comparison between the tensile test results of neat PET35 and their
nanocomposites (PET35+0.5%C15A, PET35+1.0%C15A, and PET35+3.0%C15A) at 23 ºC.
46
48
50
52
54
0 1 2 3 4 5
0
100
200
300
400
500
600
0 1 2 3 4 5
1200
1300
1400
1500
1600
1700
1800
0 1 2 3 4 5
50
60
70
80
90
100
110
120
0 1 2 3 4 5
3
4
5
6
7
8
9
0 1 2 3 4 5
2500
2750
3000
3250
3500
3750
4000
0 1 2 3 4 5
19
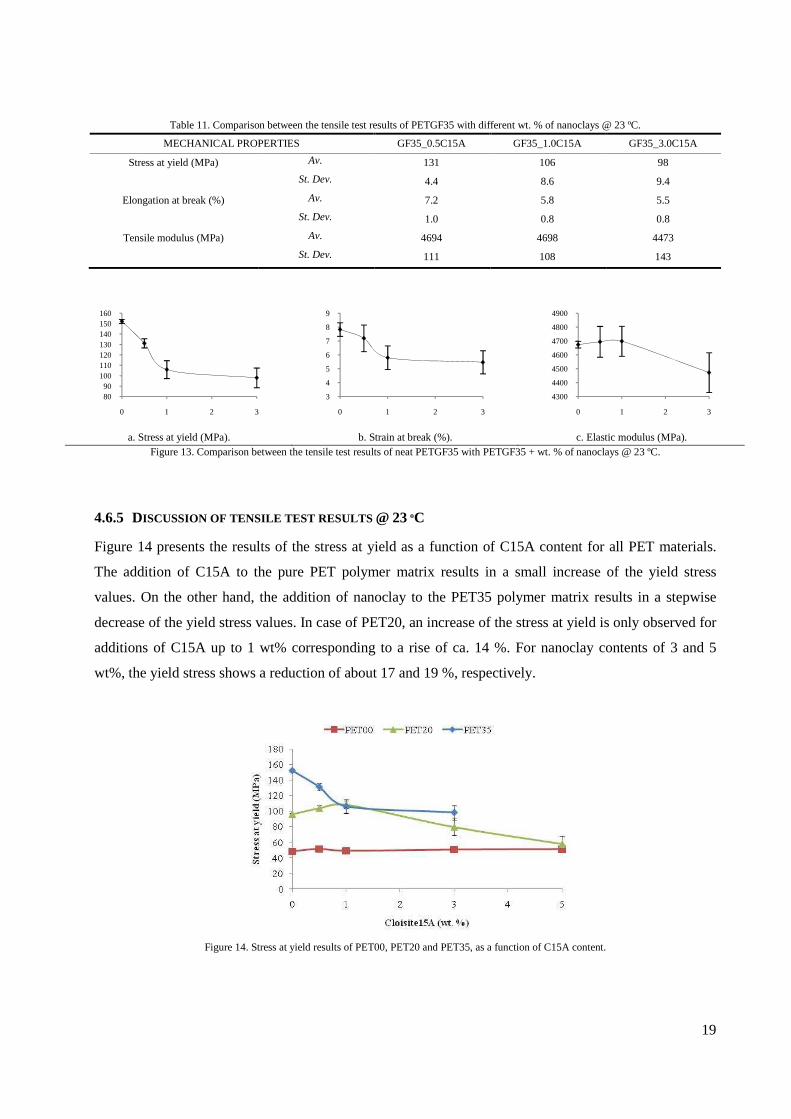
Table 11. Comparison between the tensile test results of PETGF35 with different wt. % of nanoclays @ 23 ºC.
MECHANICAL PROPERTIES GF35_0.5C15A GF35_1.0C15A GF35_3.0C15A
Stress at yield (MPa) Av. 131 106 98
St. Dev. 4.4 8.6 9.4
Elongation at break (%) Av. 7.2 5.8 5.5
St. Dev. 1.0 0.8 0.8
Tensile modulus (MPa) Av. 4694 4698 4473
St. Dev. 111 108 143
a. Stress at yield (MPa).
b. Strain at break (%).
c. Elastic modulus (MPa).
Figure 13. Comparison between the tensile test results of neat PETGF35 with PETGF35 + wt. % of nanoclays @ 23 ºC.
4.6.5 DISCUSSION OF TENSILE TEST RESULTS @ 23 ºC
Figure 14 presents the results of the stress at yield as a function of C15A content for all PET materials.
The addition of C15A to the pure PET polymer matrix results in a small increase of the yield stress
values. On the other hand, the addition of nanoclay to the PET35 polymer matrix results in a stepwise
decrease of the yield stress values. In case of PET20, an increase of the stress at yield is only observed for
additions of C15A up to 1 wt% corresponding to a rise of ca. 14 %. For nanoclay contents of 3 and 5
wt%, the yield stress shows a reduction of about 17 and 19 %, respectively.
Figure 14. Stress at yield results of PET00, PET20 and PET35, as a function of C15A content.
8090
100110120130140150160
0 1 2 3
3
4
5
6
7
8
9
0 1 2 3
4300
4400
4500
4600
4700
4800
4900
0 1 2 3
20
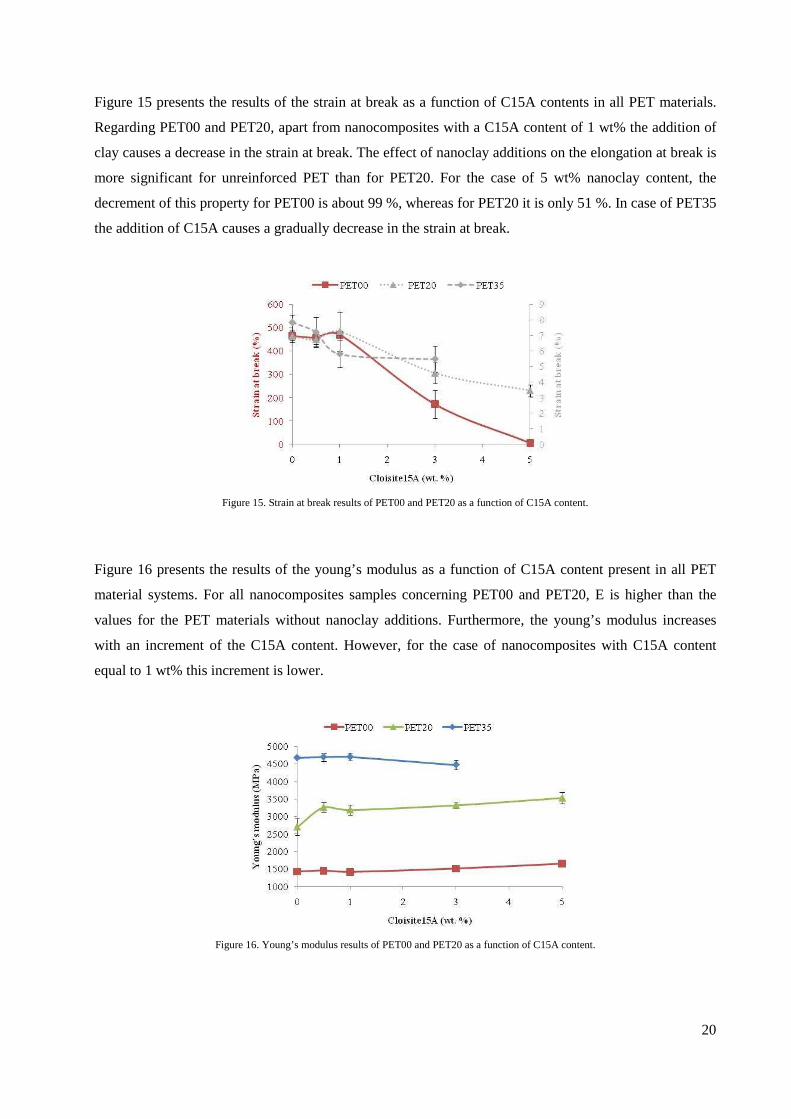
Figure 15 presents the results of the strain at break as a function of C15A contents in all PET materials.
Regarding PET00 and PET20, apart from nanocomposites with a C15A content of 1 wt% the addition of
clay causes a decrease in the strain at break. The effect of nanoclay additions on the elongation at break is
more significant for unreinforced PET than for PET20. For the case of 5 wt% nanoclay content, the
decrement of this property for PET00 is about 99 %, whereas for PET20 it is only 51 %. In case of PET35
the addition of C15A causes a gradually decrease in the strain at break.
Figure 15. Strain at break results of PET00 and PET20 as a function of C15A content.
Figure 16 presents the results of the young’s modulus as a function of C15A content present in all PET
material systems. For all nanocomposites samples concerning PET00 and PET20, E is higher than the
values for the PET materials without nanoclay additions. Furthermore, the young’s modulus increases
with an increment of the C15A content. However, for the case of nanocomposites with C15A content
equal to 1 wt% this increment is lower.
Figure 16. Young’s modulus results of PET00 and PET20 as a function of C15A content.
21
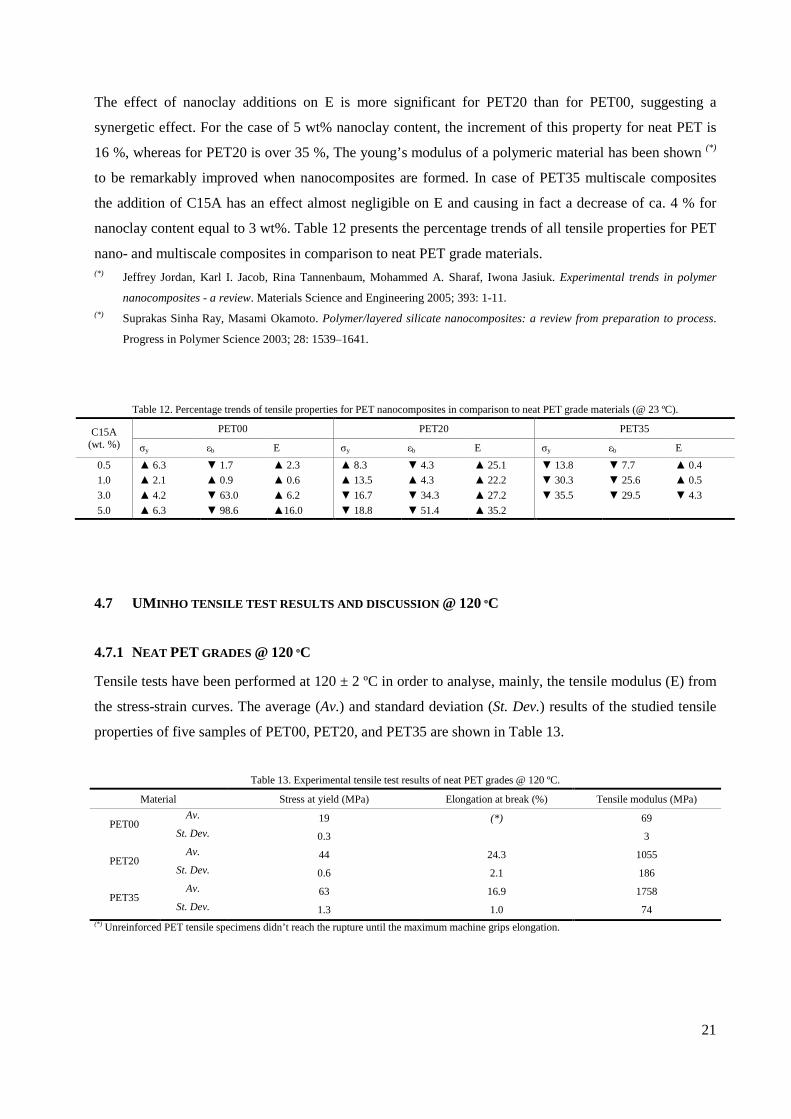
The effect of nanoclay additions on E is more significant for PET20 than for PET00, suggesting a
synergetic effect. For the case of 5 wt% nanoclay content, the increment of this property for neat PET is
16 %, whereas for PET20 is over 35 %, The young’s modulus of a polymeric material has been shown (*)
to be remarkably improved when nanocomposites are formed. In case of PET35 multiscale composites
the addition of C15A has an effect almost negligible on E and causing in fact a decrease of ca. 4 % for
nanoclay content equal to 3 wt%. Table 12 presents the percentage trends of all tensile properties for PET
nano- and multiscale composites in comparison to neat PET grade materials. (*) Jeffrey Jordan, Karl I. Jacob, Rina Tannenbaum, Mohammed A. Sharaf, Iwona Jasiuk. Experimental trends in polymer
nanocomposites - a review. Materials Science and Engineering 2005; 393: 1-11. (*) Suprakas Sinha Ray, Masami Okamoto. Polymer/layered silicate nanocomposites: a review from preparation to process.
Progress in Polymer Science 2003; 28: 1539–1641.
Table 12. Percentage trends of tensile properties for PET nanocomposites in comparison to neat PET grade materials (@ 23 ºC).
C15A (wt. %)
PET00 PET20 PET35
σy εb E σy εb E σy εb E
0.5 ▲ 6.3 ▼ 1.7 ▲ 2.3 ▲ 8.3 ▼ 4.3 ▲ 25.1 ▼ 13.8 ▼ 7.7 ▲ 0.4
1.0 ▲ 2.1 ▲ 0.9 ▲ 0.6 ▲ 13.5 ▲ 4.3 ▲ 22.2 ▼ 30.3 ▼ 25.6 ▲ 0.5
3.0 ▲ 4.2 ▼ 63.0 ▲ 6.2 ▼ 16.7 ▼ 34.3 ▲ 27.2 ▼ 35.5 ▼ 29.5 ▼ 4.3
5.0 ▲ 6.3 ▼ 98.6 ▲16.0 ▼ 18.8 ▼ 51.4 ▲ 35.2
4.7 UM INHO TENSILE TEST RESULTS AND DISCUSSION @ 120 ºC
4.7.1 NEAT PET GRADES @ 120 ºC
Tensile tests have been performed at 120 ± 2 ºC in order to analyse, mainly, the tensile modulus (E) from
the stress-strain curves. The average (Av.) and standard deviation (St. Dev.) results of the studied tensile
properties of five samples of PET00, PET20, and PET35 are shown in Table 13.
Table 13. Experimental tensile test results of neat PET grades @ 120 ºC.
Material Stress at yield (MPa) Elongation at break (%) Tensile modulus (MPa)
PET00 Av. 19 (*) 69
St. Dev. 0.3 3
PET20 Av. 44 24.3 1055
St. Dev. 0.6 2.1 186
PET35 Av. 63 16.9 1758
St. Dev. 1.3 1.0 74 (*) Unreinforced PET tensile specimens didn’t reach the rupture until the maximum machine grips elongation.
22
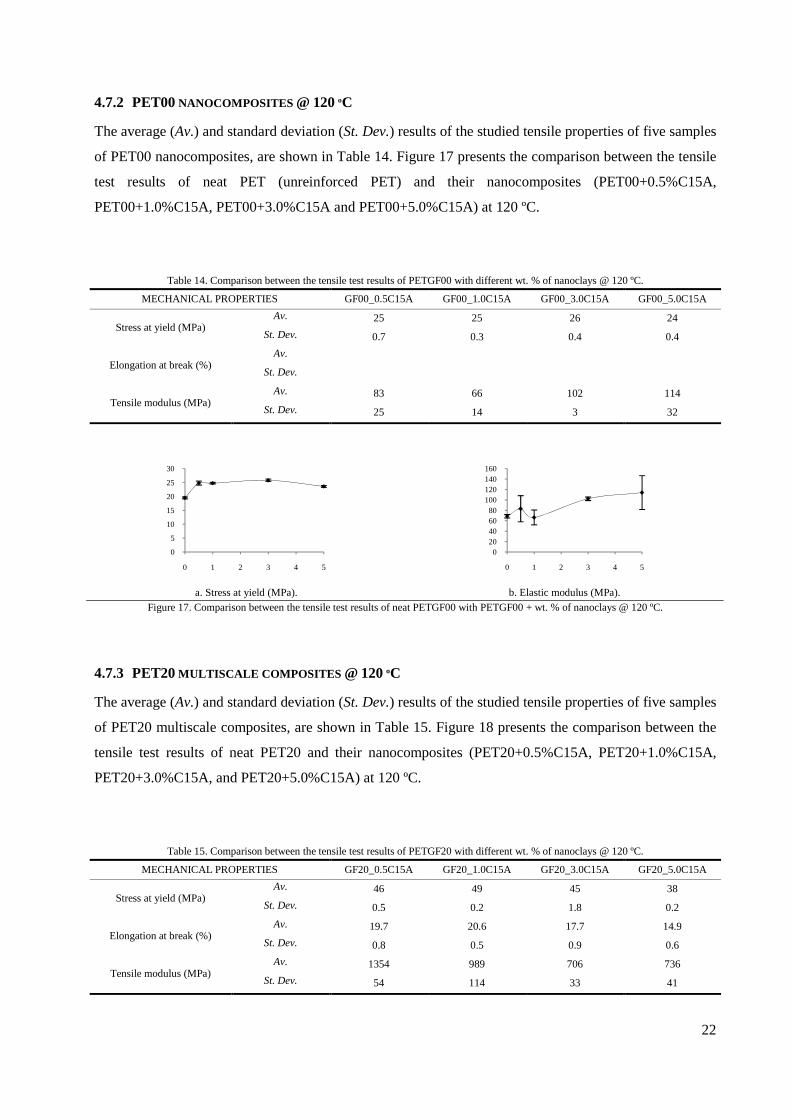
4.7.2 PET00 NANOCOMPOSITES @ 120 ºC
The average (Av.) and standard deviation (St. Dev.) results of the studied tensile properties of five samples
of PET00 nanocomposites, are shown in Table 14. Figure 17 presents the comparison between the tensile
test results of neat PET (unreinforced PET) and their nanocomposites (PET00+0.5%C15A,
PET00+1.0%C15A, PET00+3.0%C15A and PET00+5.0%C15A) at 120 ºC.
Table 14. Comparison between the tensile test results of PETGF00 with different wt. % of nanoclays @ 120 ºC.
MECHANICAL PROPERTIES GF00_0.5C15A GF00_1.0C15A GF00_3.0C15A GF00_5.0C15A
Stress at yield (MPa) Av. 25 25 26 24
St. Dev. 0.7 0.3 0.4 0.4
Elongation at break (%) Av.
St. Dev.
Tensile modulus (MPa) Av. 83 66 102 114
St. Dev. 25 14 3 32
a. Stress at yield (MPa).
b. Elastic modulus (MPa).
Figure 17. Comparison between the tensile test results of neat PETGF00 with PETGF00 + wt. % of nanoclays @ 120 ºC.
4.7.3 PET20 MULTISCALE COMPOSITES @ 120 ºC
The average (Av.) and standard deviation (St. Dev.) results of the studied tensile properties of five samples
of PET20 multiscale composites, are shown in Table 15. Figure 18 presents the comparison between the
tensile test results of neat PET20 and their nanocomposites (PET20+0.5%C15A, PET20+1.0%C15A,
PET20+3.0%C15A, and PET20+5.0%C15A) at 120 ºC.
Table 15. Comparison between the tensile test results of PETGF20 with different wt. % of nanoclays @ 120 ºC.
MECHANICAL PROPERTIES GF20_0.5C15A GF20_1.0C15A GF20_3.0C15A GF20_5.0C15A
Stress at yield (MPa) Av. 46 49 45 38
St. Dev. 0.5 0.2 1.8 0.2
Elongation at break (%) Av. 19.7 20.6 17.7 14.9
St. Dev. 0.8 0.5 0.9 0.6
Tensile modulus (MPa) Av. 1354 989 706 736
St. Dev. 54 114 33 41
0
5
10
15
20
25
30
0 1 2 3 4 5
020406080
100120140160
0 1 2 3 4 5
23
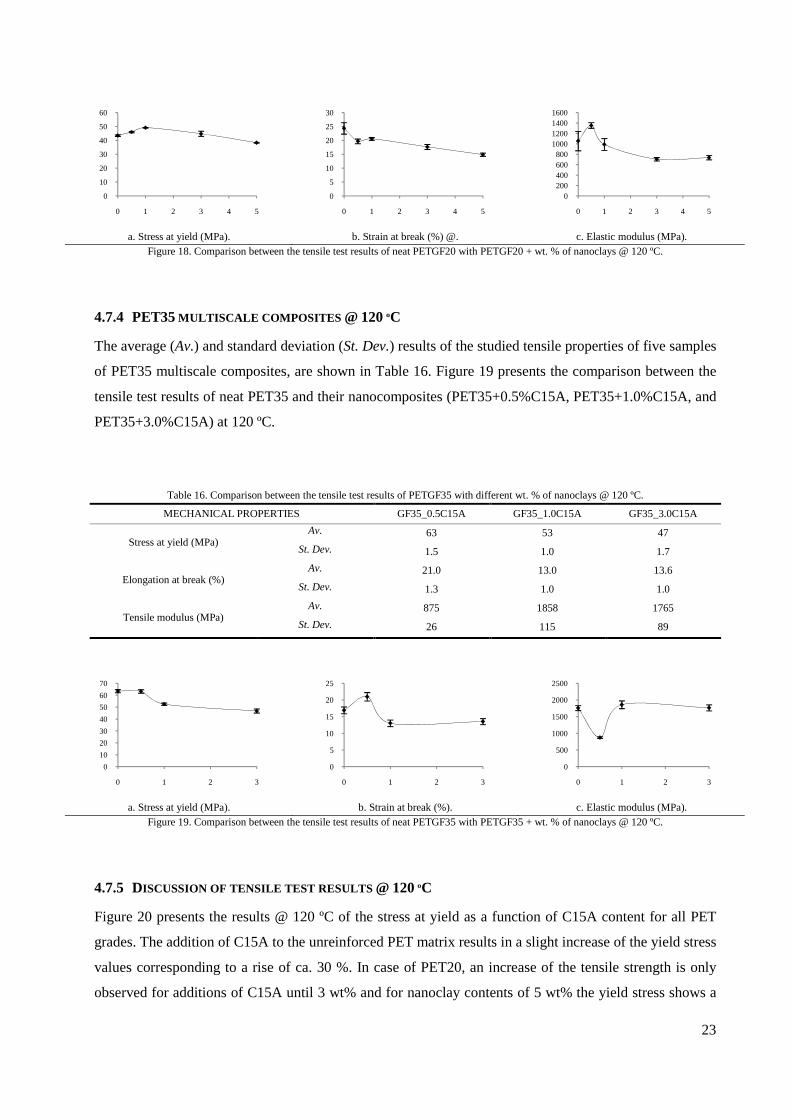
a. Stress at yield (MPa).
b. Strain at break (%) @.
c. Elastic modulus (MPa).
Figure 18. Comparison between the tensile test results of neat PETGF20 with PETGF20 + wt. % of nanoclays @ 120 ºC.
4.7.4 PET35 MULTISCALE COMPOSITES @ 120 ºC
The average (Av.) and standard deviation (St. Dev.) results of the studied tensile properties of five samples
of PET35 multiscale composites, are shown in Table 16. Figure 19 presents the comparison between the
tensile test results of neat PET35 and their nanocomposites (PET35+0.5%C15A, PET35+1.0%C15A, and
PET35+3.0%C15A) at 120 ºC.
Table 16. Comparison between the tensile test results of PETGF35 with different wt. % of nanoclays @ 120 ºC.
MECHANICAL PROPERTIES GF35_0.5C15A GF35_1.0C15A GF35_3.0C15A
Stress at yield (MPa) Av. 63 53 47
St. Dev. 1.5 1.0 1.7
Elongation at break (%) Av. 21.0 13.0 13.6
St. Dev. 1.3 1.0 1.0
Tensile modulus (MPa) Av. 875 1858 1765
St. Dev. 26 115 89
a. Stress at yield (MPa).
b. Strain at break (%).
c. Elastic modulus (MPa).
Figure 19. Comparison between the tensile test results of neat PETGF35 with PETGF35 + wt. % of nanoclays @ 120 ºC.
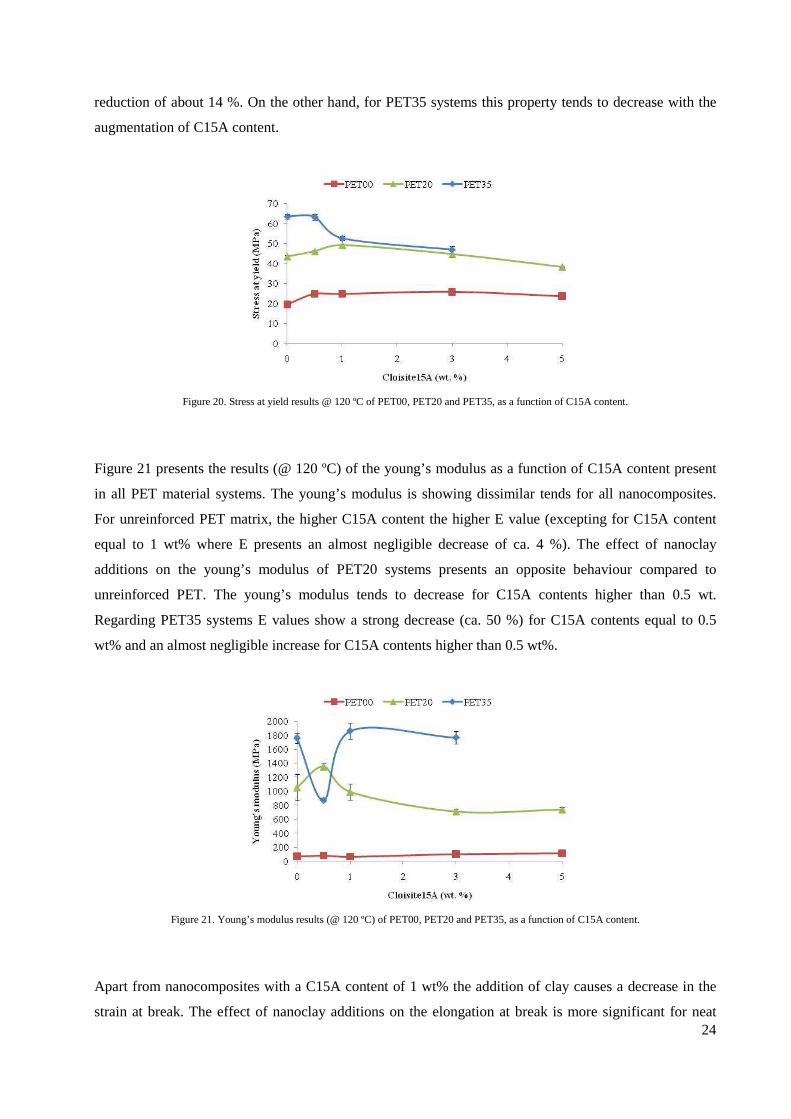
4.7.5 DISCUSSION OF TENSILE TEST RESULTS @ 120 ºC
Figure 20 presents the results @ 120 ºC of the stress at yield as a function of C15A content for all PET
grades. The addition of C15A to the unreinforced PET matrix results in a slight increase of the yield stress
values corresponding to a rise of ca. 30 %. In case of PET20, an increase of the tensile strength is only
observed for additions of C15A until 3 wt% and for nanoclay contents of 5 wt% the yield stress shows a
0
10
20
30
40
50
60
0 1 2 3 4 5
0
5
10
15
20
25
30
0 1 2 3 4 5
0200400600800
1000120014001600
0 1 2 3 4 5
0
10
20
30
40
50
60
70
0 1 2 3
0
5
10
15
20
25
0 1 2 3
0
500
1000
1500
2000
2500
0 1 2 3
24
reduction of about 14 %. On the other hand, for PET35 systems this property tends to decrease with the
augmentation of C15A content.
Figure 20. Stress at yield results @ 120 ºC of PET00, PET20 and PET35, as a function of C15A content.
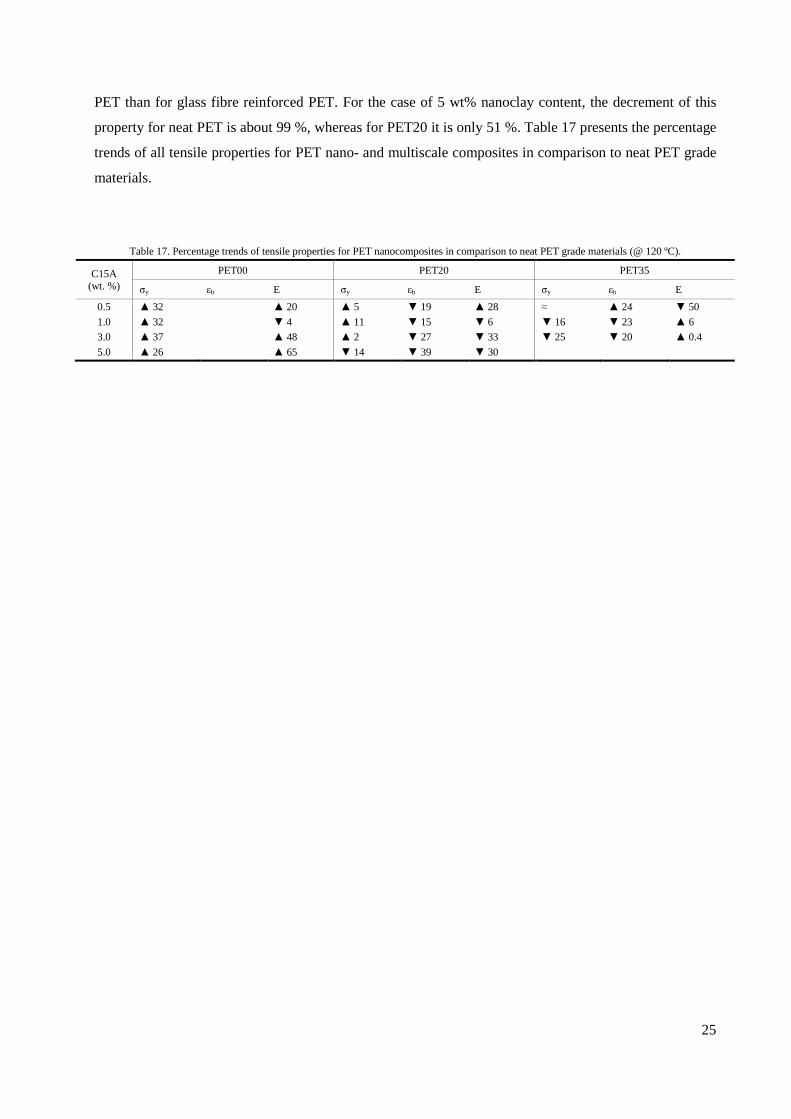
Figure 21 presents the results (@ 120 ºC) of the young’s modulus as a function of C15A content present
in all PET material systems. The young’s modulus is showing dissimilar tends for all nanocomposites.
For unreinforced PET matrix, the higher C15A content the higher E value (excepting for C15A content
equal to 1 wt% where E presents an almost negligible decrease of ca. 4 %). The effect of nanoclay
additions on the young’s modulus of PET20 systems presents an opposite behaviour compared to
unreinforced PET. The young’s modulus tends to decrease for C15A contents higher than 0.5 wt.
Regarding PET35 systems E values show a strong decrease (ca. 50 %) for C15A contents equal to 0.5
wt% and an almost negligible increase for C15A contents higher than 0.5 wt%.
Figure 21. Young’s modulus results (@ 120 ºC) of PET00, PET20 and PET35, as a function of C15A content.
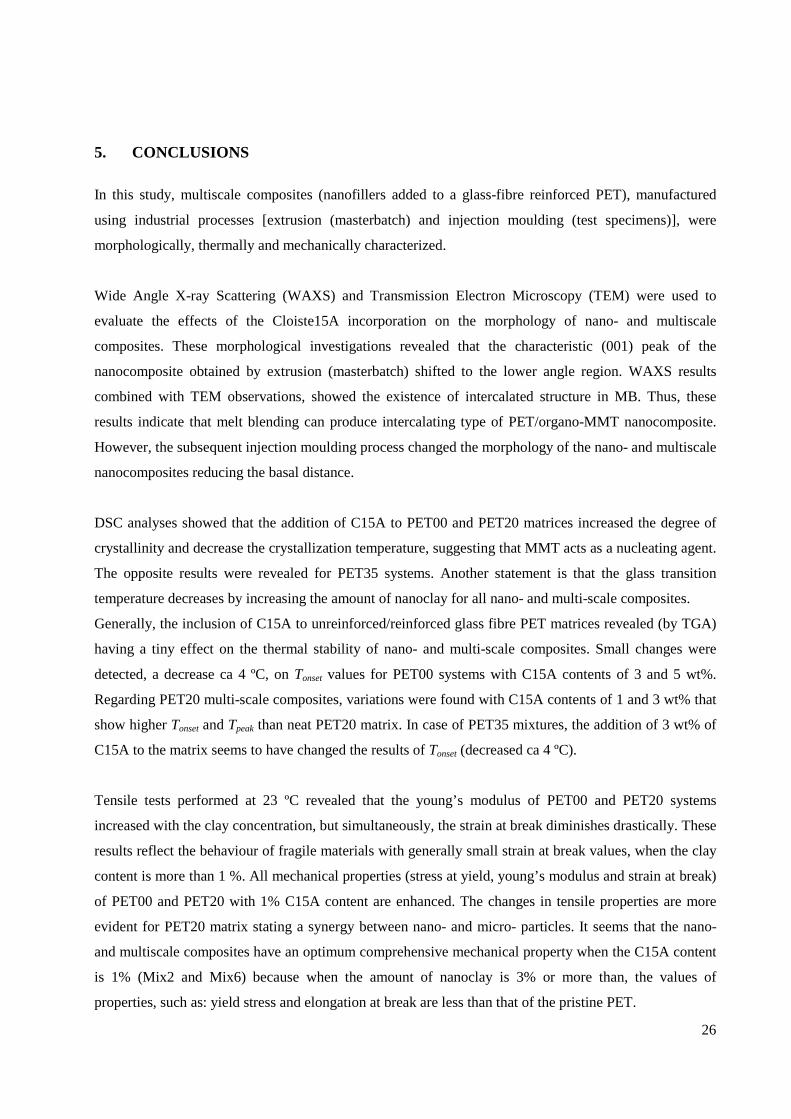
Apart from nanocomposites with a C15A content of 1 wt% the addition of clay causes a decrease in the
strain at break. The effect of nanoclay additions on the elongation at break is more significant for neat
25
PET than for glass fibre reinforced PET. For the case of 5 wt% nanoclay content, the decrement of this
property for neat PET is about 99 %, whereas for PET20 it is only 51 %. Table 17 presents the percentage
trends of all tensile properties for PET nano- and multiscale composites in comparison to neat PET grade
materials.
Table 17. Percentage trends of tensile properties for PET nanocomposites in comparison to neat PET grade materials (@ 120 ºC).
C15A (wt. %)
PET00 PET20 PET35
σy εb E σy εb E σy εb E
0.5 ▲ 32 ▲ 20 ▲ 5 ▼ 19 ▲ 28 ≈ ▲ 24 ▼ 50
1.0 ▲ 32 ▼ 4 ▲ 11 ▼ 15 ▼ 6 ▼ 16 ▼ 23 ▲ 6
3.0 ▲ 37 ▲ 48 ▲ 2 ▼ 27 ▼ 33 ▼ 25 ▼ 20 ▲ 0.4
5.0 ▲ 26 ▲ 65 ▼ 14 ▼ 39 ▼ 30
26
5. CONCLUSIONS
In this study, multiscale composites (nanofillers added to a glass-fibre reinforced PET), manufactured
using industrial processes [extrusion (masterbatch) and injection moulding (test specimens)], were
morphologically, thermally and mechanically characterized.
Wide Angle X-ray Scattering (WAXS) and Transmission Electron Microscopy (TEM) were used to
evaluate the effects of the Cloiste15A incorporation on the morphology of nano- and multiscale
composites. These morphological investigations revealed that the characteristic (001) peak of the
nanocomposite obtained by extrusion (masterbatch) shifted to the lower angle region. WAXS results
combined with TEM observations, showed the existence of intercalated structure in MB. Thus, these
results indicate that melt blending can produce intercalating type of PET/organo-MMT nanocomposite.
However, the subsequent injection moulding process changed the morphology of the nano- and multiscale
nanocomposites reducing the basal distance.
DSC analyses showed that the addition of C15A to PET00 and PET20 matrices increased the degree of
crystallinity and decrease the crystallization temperature, suggesting that MMT acts as a nucleating agent.
The opposite results were revealed for PET35 systems. Another statement is that the glass transition
temperature decreases by increasing the amount of nanoclay for all nano- and multi-scale composites.
Generally, the inclusion of C15A to unreinforced/reinforced glass fibre PET matrices revealed (by TGA)
having a tiny effect on the thermal stability of nano- and multi-scale composites. Small changes were
detected, a decrease ca 4 ºC, on Tonset values for PET00 systems with C15A contents of 3 and 5 wt%.
Regarding PET20 multi-scale composites, variations were found with C15A contents of 1 and 3 wt% that
show higher Tonset and Tpeak than neat PET20 matrix. In case of PET35 mixtures, the addition of 3 wt% of
C15A to the matrix seems to have changed the results of Tonset (decreased ca 4 ºC).
Tensile tests performed at 23 ºC revealed that the young’s modulus of PET00 and PET20 systems
increased with the clay concentration, but simultaneously, the strain at break diminishes drastically. These
results reflect the behaviour of fragile materials with generally small strain at break values, when the clay
content is more than 1 %. All mechanical properties (stress at yield, young’s modulus and strain at break)
of PET00 and PET20 with 1% C15A content are enhanced. The changes in tensile properties are more
evident for PET20 matrix stating a synergy between nano- and micro- particles. It seems that the nano-
and multiscale composites have an optimum comprehensive mechanical property when the C15A content
is 1% (Mix2 and Mix6) because when the amount of nanoclay is 3% or more than, the values of
properties, such as: yield stress and elongation at break are less than that of the pristine PET.
27
Tensile tests performed at 120 ºC have shown similar results concerning PET00 nanocomposites, i.e. the
stress at yield and young’s modulus are enhanced with C15A content. In case of PET20 systems, the
stress at yield and the strain at break shown the same variation already verified in tensile tests performed
at lower temperature – σy is improved up to 1 wt% of nanoclay content and εb tends to decrease by adding
C15A. The young’s modulus is only enhanced for the smallest nanoclay contents (0.5 wt %). Regarding
PET35 multi-scale composites, all mechanical properties values were reduced by addition of C15A, even
at both test temperatures, meaning that for higher micro reinforcement contents (short glass fibre) the
inclusion of nanofillers promotes an undesirable effect on the mechanical behaviour of the final
composites.
This study proves that non-fully-exfoliated nanocomposites may present improvements in mechanical
properties. For instance, clay exfoliation was not attained, but the particle dispersion (with intercalation)
improved the stiffness properties (modulus and strength) of produced nano- and multiscale composites.
AKNOWLEDGMENTS
The authors would like to thank Southern Clay Products and DSM for donation of nanoclays and PET
materials, respectively. This work was supported by TECNA: INTERREG IV-B SOE1/P1/E184. We
would also like to thank Nuria Garcia and Laura Figueras from INA-UZ (Instituto de Nanociencia de
Aragón da Universidad de Zaragoza), as well as Dr.ª and Dr.º from ENIT-