Nadia Magdalinou Clinical Research Fellow 27.02.14 Cerebrospinal Fluid Studies in MSA Nadia...
42
Cerebrospinal Fluid Studies in MSA Nadia Magdalinou Clinical Research Fellow 27.02.14
-
Upload
darrion-baines -
Category
Documents
-
view
224 -
download
2
Transcript of Nadia Magdalinou Clinical Research Fellow 27.02.14 Cerebrospinal Fluid Studies in MSA Nadia...
Cerebrospinal Fluid Studies
in MSA
Nadia Magdalinou
Clinical Research Fellow
27.02.14
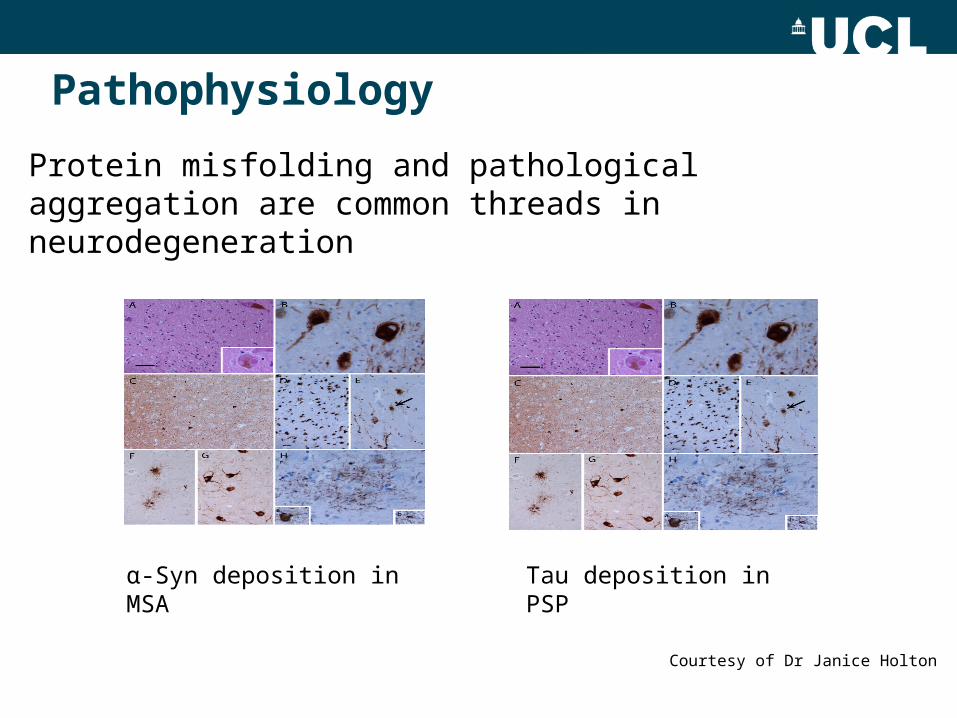
Pathophysiology
Protein misfolding and pathological aggregation are common threads in neurodegeneration
α-Syn deposition in MSA Tau deposition in PSP
Courtesy of Dr Janice Holton
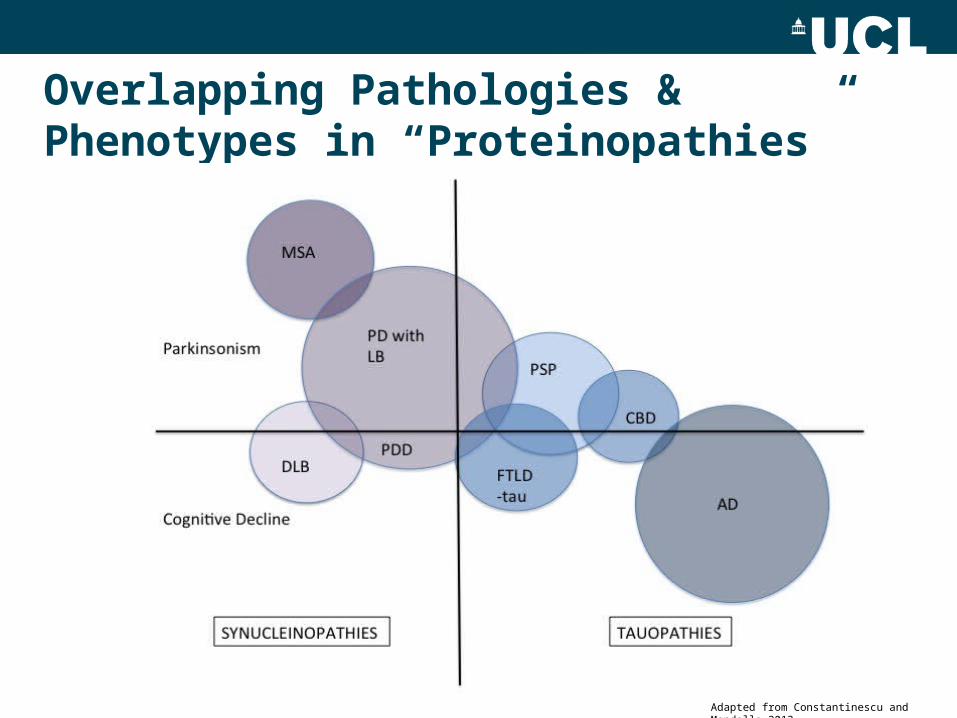
Overlapping Pathologies & Phenotypes in “Proteinopathies”
Adapted from Constantinescu and Mondello 2013
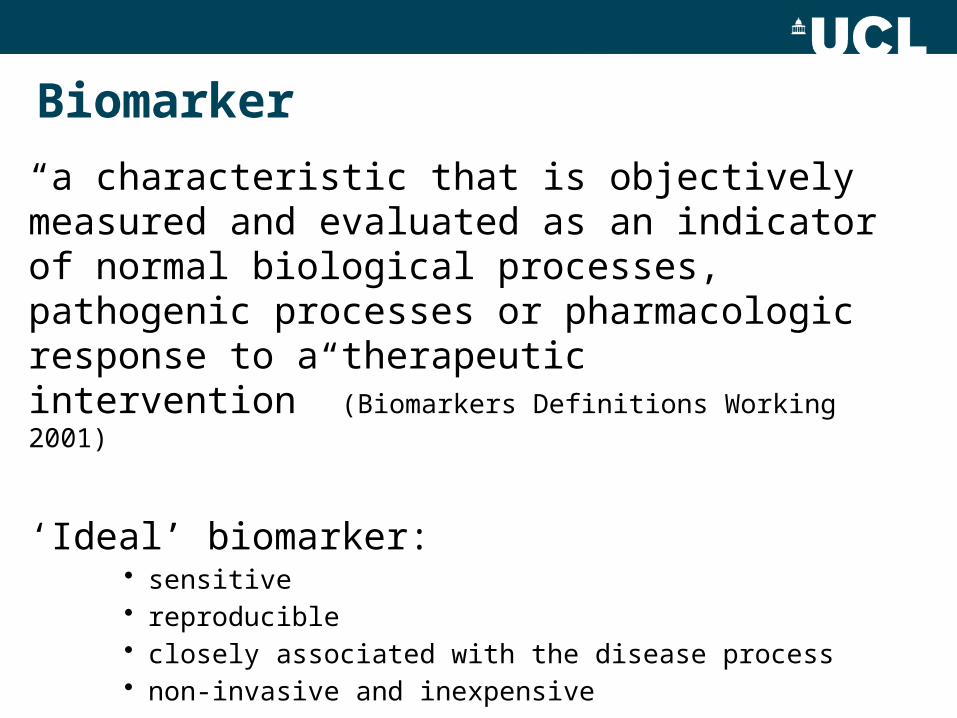
Biomarker
“a characteristic that is objectively measured and evaluated as an indicator of normal biological processes, pathogenic processes or pharmacologic response to a therapeutic intervention” (Biomarkers Definitions Working 2001)
‘Ideal’ biomarker: • sensitive• reproducible• closely associated with the disease process • non-invasive and inexpensive
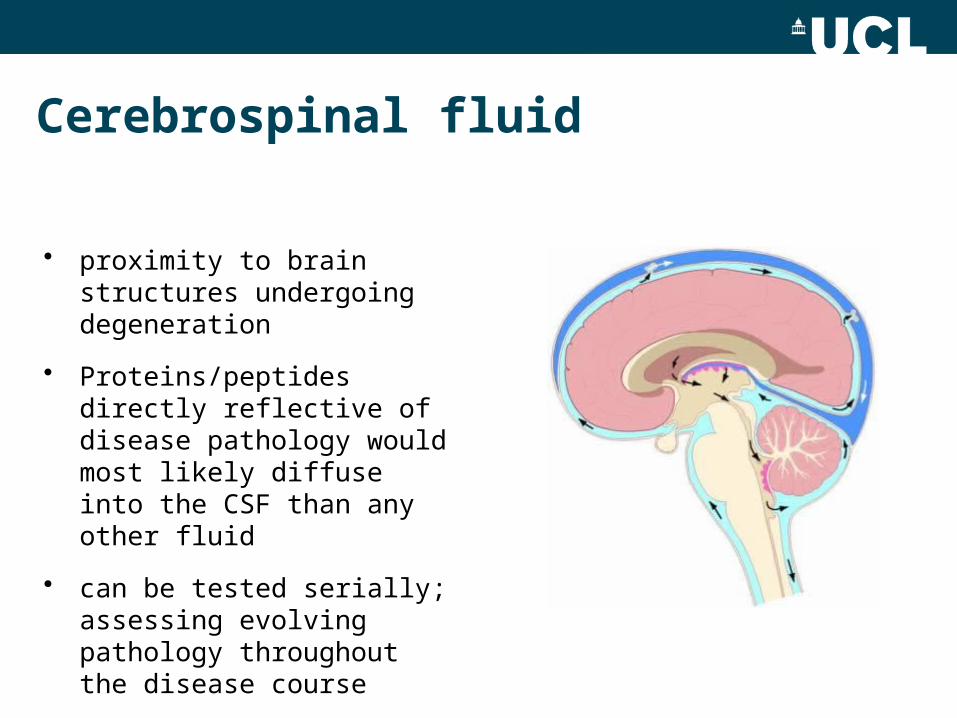
Cerebrospinal fluid
• proximity to brain structures undergoing degeneration
• Proteins/peptides directly reflective of disease pathology would most likely diffuse into the CSF than any other fluid
• can be tested serially; assessing evolving pathology throughout the disease course
CSF studies in Parkinsonism
Main focus to investigate a priori defined compounds (hypothesis-driven)
• in patients and in healthy controls • looking for differences, patterns and associations; α-Syn, tau
Recently, trend towards hypothesis-generating, “omics” techniques
• unbiased and sensitive approach • identifying markers unexpectedly involved in
neurodegeneration
Even though several promising candidates exist there is still no reliable biomarker
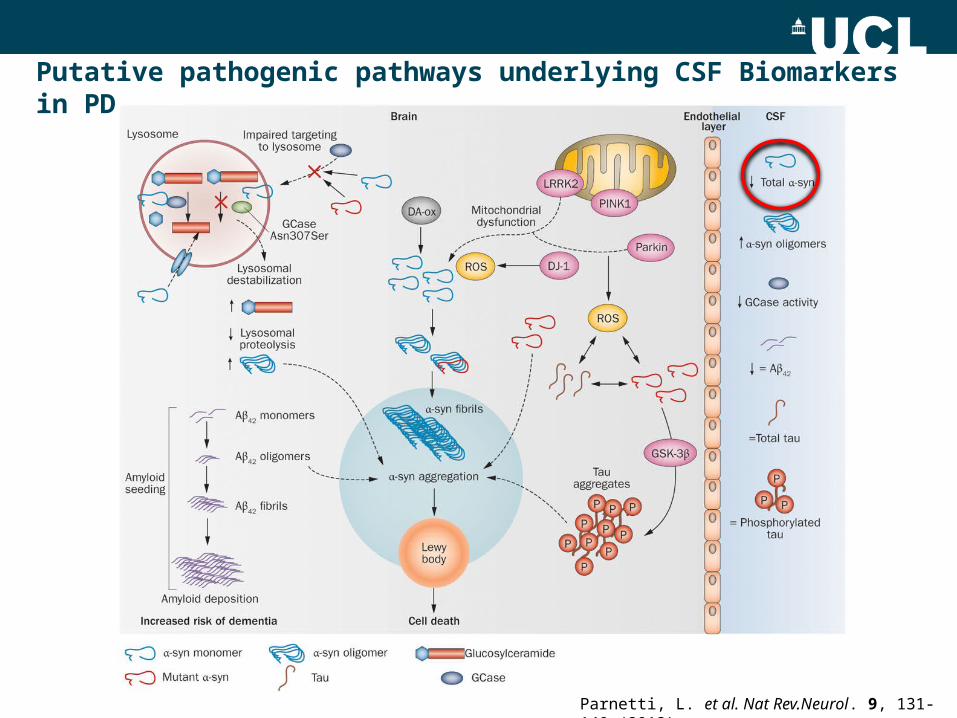
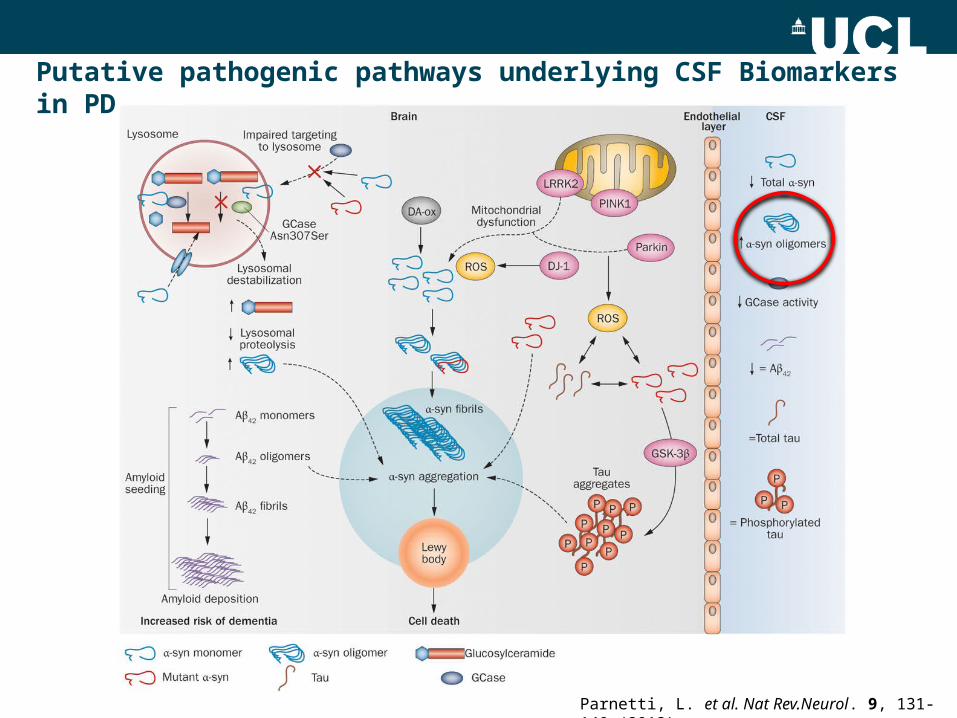
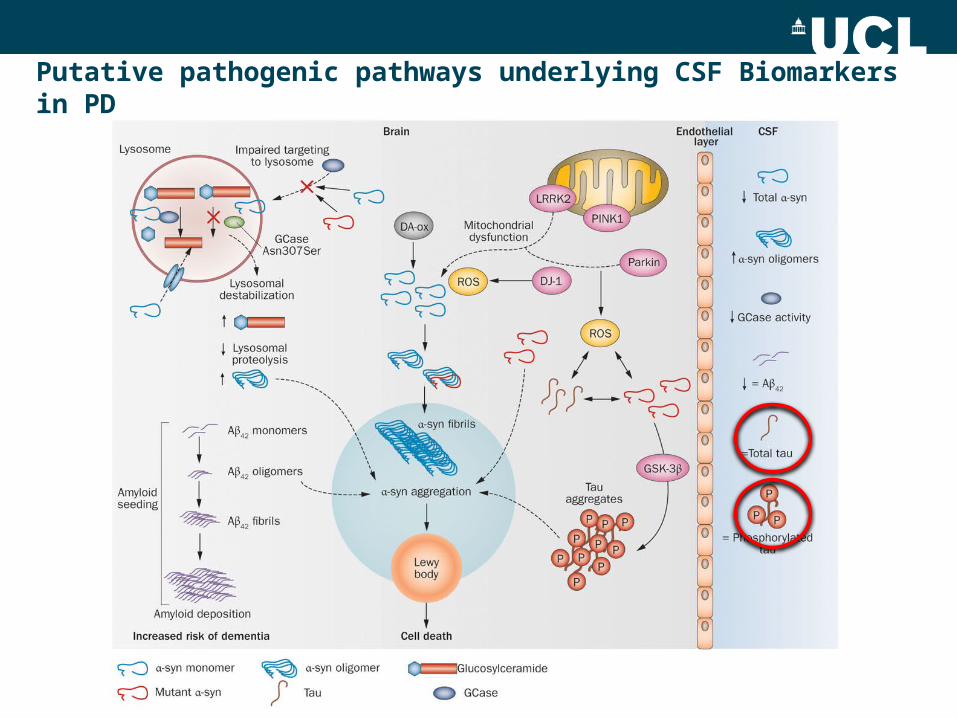
Putative pathogenic pathways underlying CSF Biomarkers in PD
Parnetti, L. et al. Nat Rev.Neurol. 9, 131-140 (2013)
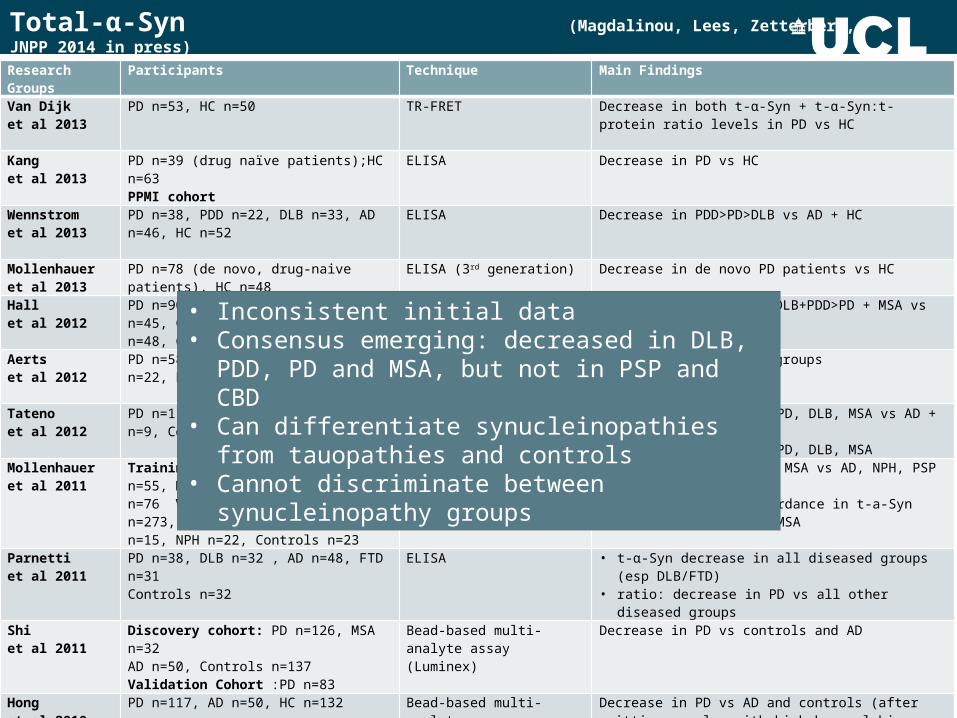
Total-α-Syn (Magdalinou, Lees, Zetterberg, JNPP 2014 in press)
Research Groups Participants Technique Main Findings
Van Dijk et al 2013
PD n=53, HC n=50 TR-FRET Decrease in both t- -Syn + t- -Syn:t-protein ratio levels in α αPD vs HC
Kang et al 2013
PD n=39 (drug naïve patients);HC n=63PPMI cohort
ELISA Decrease in PD vs HC
Wennstrom et al 2013
PD n=38, PDD n=22, DLB n=33, AD n=46, HC n=52
ELISA Decrease in PDD>PD>DLB vs AD + HC
Mollenhauer et al 2013
PD n=78 (de novo, drug-naive patients), HC n=48
ELISA (3rd generation) Decrease in de novo PD patients vs HC
Hall et al 2012
PD n=90, PDD n=33, DLB n=70, PSP n=45, CBD n=12, MSA n=48, AD n=48, Controls n=107
Bead-based multi-analyte assay (Luminex)
Modest decrease in AD>DLB+PDD>PD + MSA vs Controls , AD and PSP
Aerts et al 2012
PD n=58, MSA n=47, DLB n=3, VaP n=22, PSP n=10, CBD n=2
ELISA No difference between groups
Tatenoet al 2012
PD n=11, DLB n=6, MSA n=11, AD n=9, Controls n=11
ELISA • t- -Syn decrease in PD, DLB, MSA vs AD + Controlsα• No difference among PD, DLB, MSA
Mollenhauer et al 2011
Training cohort: PD n=51, DLB n=55, MSA n=29, AD n=62, Controls n=76 Validation cohort: PD n=273, DLB n=66, PSP n=8, MSA n=15, NPH n=22, Controls n=23
ELISA (1st and 2nd generation) • Decrease in PD, DLB, MSA vs AD, NPH, PSP and controls• High degree of concordance in t-a-Syn levels between PD
+ MSA
Parnetti et al 2011
PD n=38, DLB n=32 , AD n=48, FTD n=31Controls n=32
ELISA • t- -Syn decrease in all diseased groups (esp DLB/FTD)α• ratio: decrease in PD vs all other diseased groups
Shi et al 2011
Discovery cohort: PD n=126, MSA n=32AD n=50, Controls n=137Validation Cohort :PD n=83
Bead-based multi-analyte assay (Luminex)
Decrease in PD vs controls and AD
Hong et al 2010
PD n=117, AD n=50, HC n=132 Bead-based multi-analyte assay (Luminex)
Decrease in PD vs AD and controls (after omitting samples with high haemoglobin concentration)
Nogutsi et al 2009
DLB n=16, AD n=21 ELISA No difference
Spies et al 2009
DLB n=40, AD n=131, VaD n=28, FTD n=39 ELISA No difference
Ohrfelt et al 2009
PD n=15, DLB n=15, AD n=66, Controls n= 55 ELISA Decrease in AD, no difference in parkinsonian groups
Mollenhauer et al 2008
PD n=8, DLB n=38, AD n=13, CJD n=8, Controls n=13
ELISA (1st and 2nd generation) Marginal decrease in LBD and PD vs all other groups
• Inconsistent initial data• Consensus emerging: decreased in DLB, PDD, PD
and MSA, but not in PSP and CBD• Can differentiate synucleinopathies from
tauopathies and controls• Cannot discriminate between synucleinopathy
groups
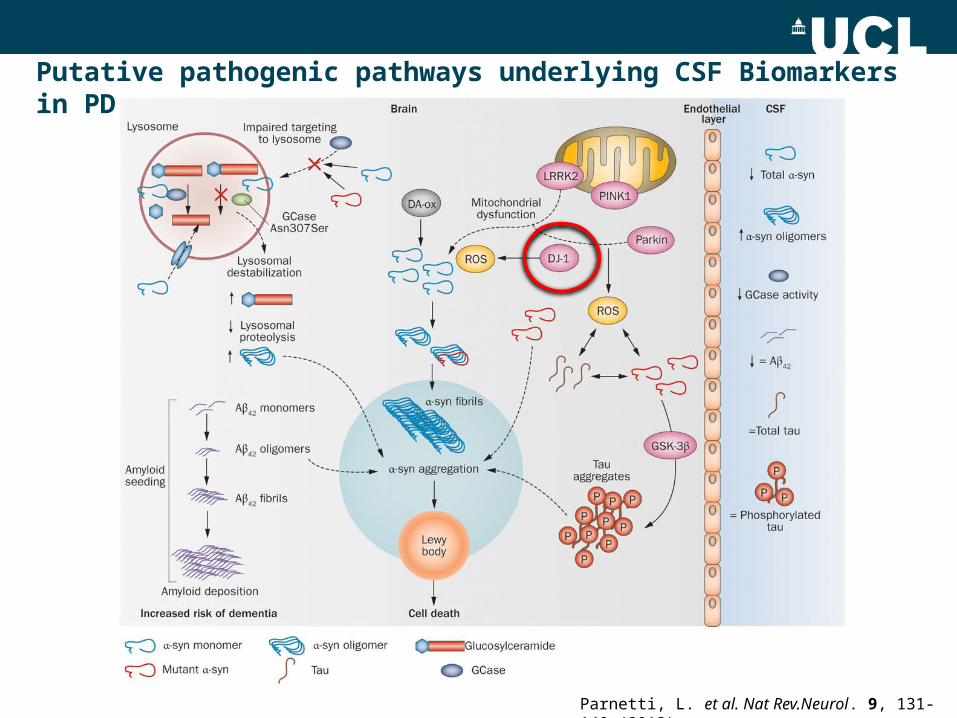
Putative pathogenic pathways underlying CSF Biomarkers in PD
Parnetti, L. et al. Nat Rev.Neurol. 9, 131-140 (2013)
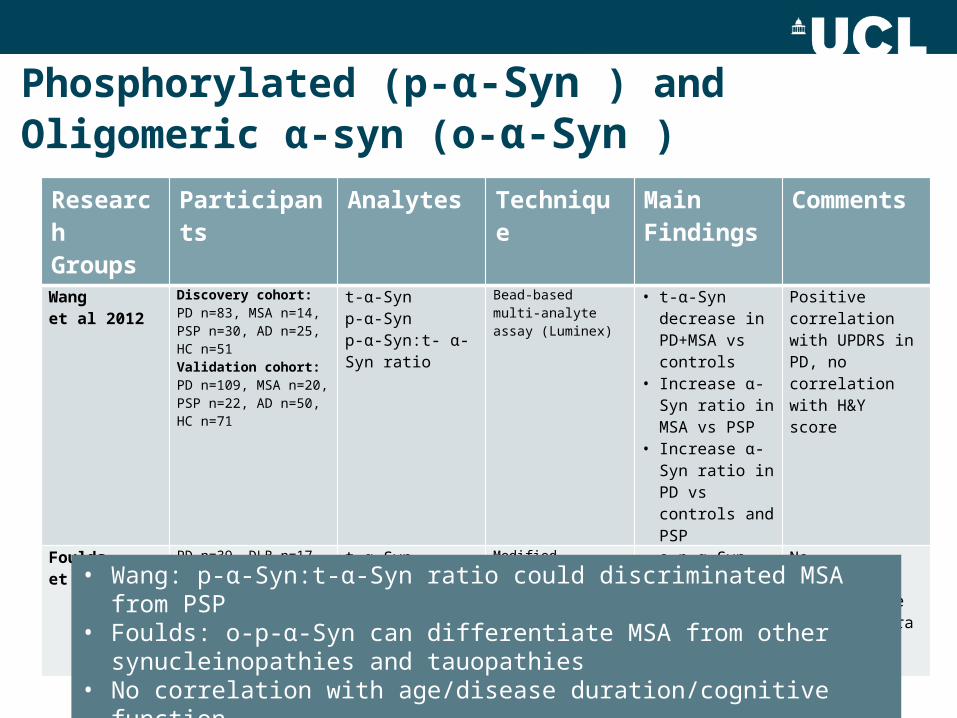
Phosphorylated (p- -Syn α ) and Oligomeric α-syn (o- -Syn α )
Research Groups
Participants Analytes Technique Main Findings
Comments
Wang et al 2012
Discovery cohort:PD n=83, MSA n=14, PSP n=30, AD n=25, HC n=51Validation cohort:PD n=109, MSA n=20, PSP n=22, AD n=50, HC n=71
t- -Syn αp- -Synαp- -Syn:t- -Syn α αratio
Bead-based multi-analyte assay (Luminex)
• t- -Syn decrease αin PD+MSA vs controls
• Increase -Syn αratio in MSA vs PSP
• Increase -Syn αratio in PD vs controls and PSP
Positive correlation with UPDRS in PD, no correlation with H&Y score
Fouldset al 2012
PD n=39, DLB n=17, PSP n=12, MSA n=8, Controls n=26
Post-mortem samples
t- -Syn αp- -Synαo- -Syn αo-p- -Syn α
Modified Sandwich ELISAs
• o-p- -Syn α can differentiate pts with MSA from all other groups
No correlation with disease severity/duration
• Wang: p- -Syn:t- -Syn ratio could discriminated MSA from PSPα α• Foulds: o-p- -Syn can differentiate MSA from other synucleinopathies and α
tauopathies• No correlation with age/disease duration/cognitive function
Putative pathogenic pathways underlying CSF Biomarkers in PD
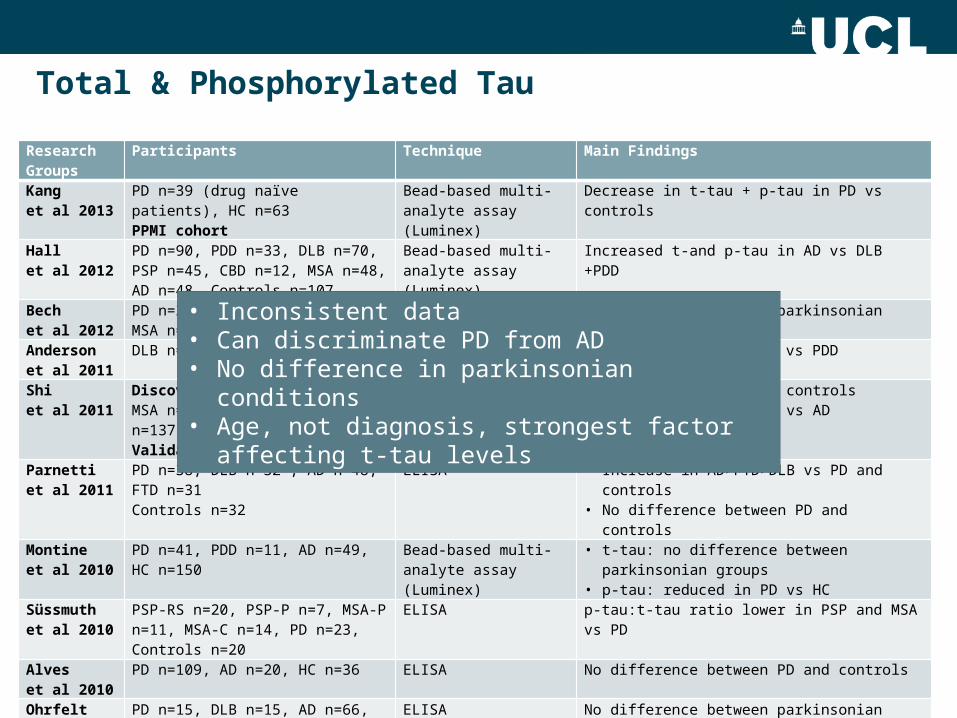
Total & Phosphorylated Tau
Research Groups
Participants Technique Main Findings
Kang et al 2013
PD n=39 (drug naïve patients), HC n=63PPMI cohort
Bead-based multi-analyte assay (Luminex)
Decrease in t-tau + p-tau in PD vs controls
Hall et al 2012
PD n=90, PDD n=33, DLB n=70, PSP n=45, CBD n=12, MSA n=48, AD n=48, Controls n=107
Bead-based multi-analyte assay (Luminex)
Increased t-and p-tau in AD vs DLB +PDD
Bech et al 2012
PD n=22, PDD n=3, DLB n=11, MSA n=10, PSP n=20, CBD n=3
ELISA No difference between parkinsonian groups
Anderson et al 2011
DLB n=47, PDD n=17, AD n=150 ELISA Increased t-tau in DLB vs PDD
Shi et al 2011
Discovery cohort:PD n=126, MSA n=32, AD n=50, Controls n=137Validation Cohort: PD n=83
Bead-based multi-analyte assay (Luminex)
• Decrease in PD vs to controls• Decrease in PD + MSA vs AD
Parnetti et al 2011
PD n=38, DLB n=32 , AD n=48, FTD n=31Controls n=32
ELISA • Increase in AD>FTD>DLB vs PD and controls• No difference between PD and controls
Montine et al 2010
PD n=41, PDD n=11, AD n=49, HC n=150 Bead-based multi-analyte assay (Luminex)
• t-tau: no difference between parkinsonian groups• p-tau: reduced in PD vs HC
Süssmuthet al 2010
PSP-RS n=20, PSP-P n=7, MSA-P n=11, MSA-C n=14, PD n=23, Controls n=20
ELISA p-tau:t-tau ratio lower in PSP and MSA vs PD
Alves et al 2010
PD n=109, AD n=20, HC n=36
ELISA No difference between PD and controls
Ohrfeltet al 2009
PD n=15, DLB n=15, AD n=66, Controls n= 55
ELISA No difference between parkinsonian groups
Compta et al 2009
PD n=20, PDD n=20, HC n=15 ELISA t- and p- tau: increase in PDD vs PD and controls
Parnetti et al 2008
PD n=20, PDD n=8, DLB n=19, AD n=23, HC n=20
ELISA • t-tau: DLB>PDD>controls• p-tau: no difference between parkinsonian groups
• Inconsistent data• Can discriminate PD from AD• No difference in parkinsonian conditions• Age, not diagnosis, strongest factor affecting t-tau
levels
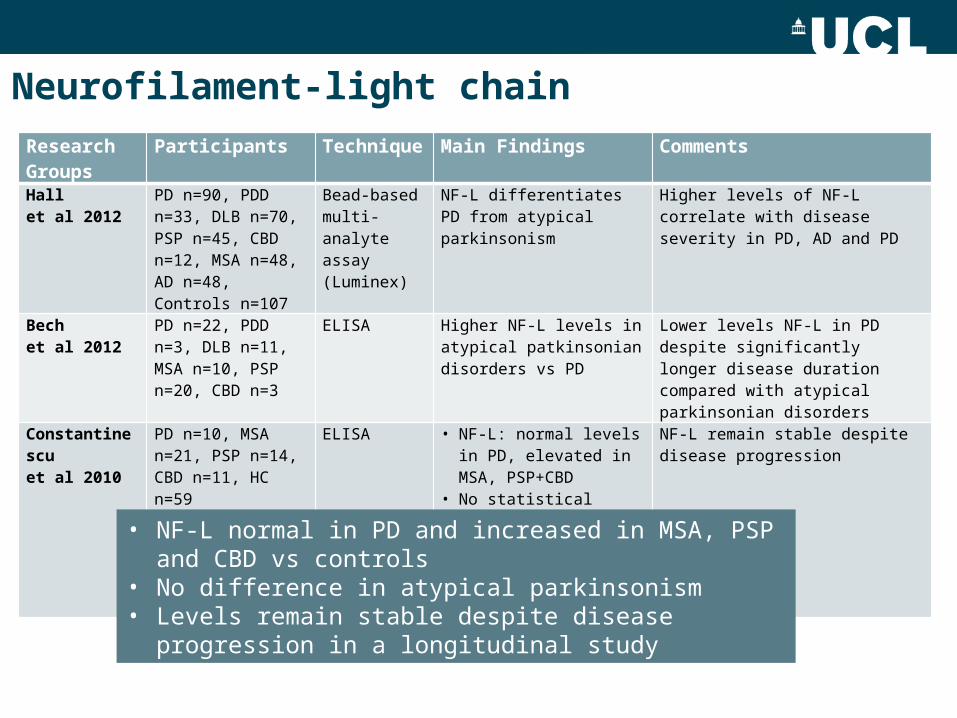
Neurofilament-light chainResearch Groups
Participants Technique Main Findings Comments
Hall et al 2012
PD n=90, PDD n=33, DLB n=70, PSP n=45, CBD n=12, MSA n=48, AD n=48, Controls n=107
Bead-based multi-analyte assay (Luminex)
NF-L differentiates PD from atypical parkinsonism
Higher levels of NF-L correlate with disease severity in PD, AD and PD
Bech et al 2012
PD n=22, PDD n=3, DLB n=11, MSA n=10, PSP n=20, CBD n=3
ELISA Higher NF-L levels in atypical patkinsonian disorders vs PD
Lower levels NF-L in PD despite significantly longer disease duration compared with atypical parkinsonian disorders
Constantinescu et al 2010
PD n=10, MSA n=21, PSP n=14, CBD n=11, HC n=59(x2 consecutive samples available in all diseased groups, other than CBD)
ELISA • NF-L: normal levels in PD, elevated in MSA, PSP+CBD
• No statistical significance overtime
NF-L remain stable despite disease progression
• NF-L normal in PD and increased in MSA, PSP and CBD vs controls
• No difference in atypical parkinsonism• Levels remain stable despite disease progression in a
longitudinal study
Putative pathogenic pathways underlying CSF Biomarkers in PD
Parnetti, L. et al. Nat Rev.Neurol. 9, 131-140 (2013)
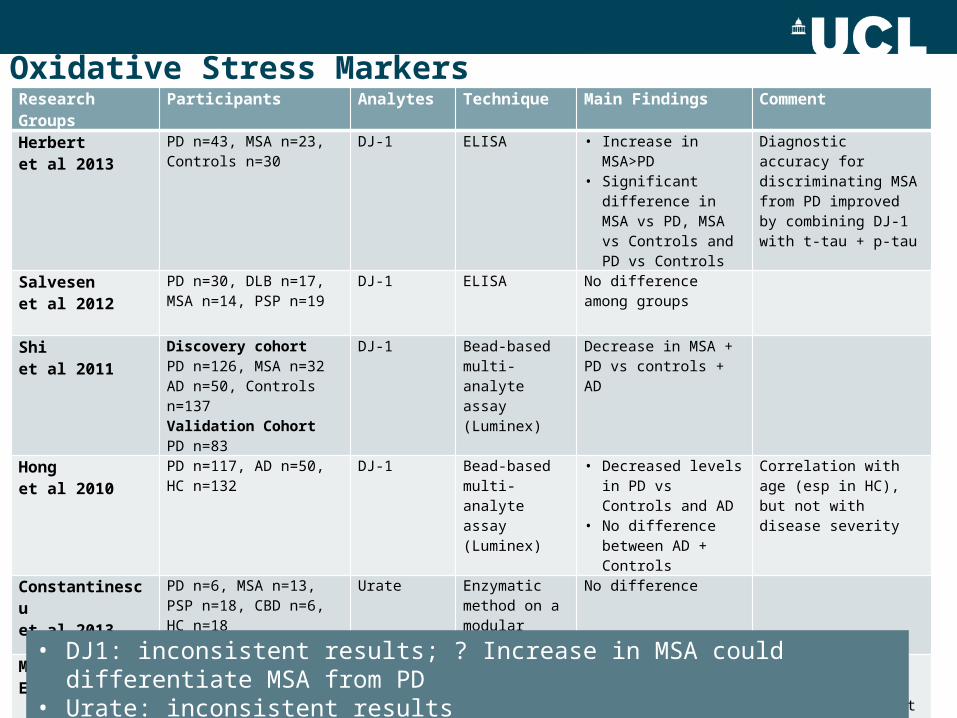
Oxidative Stress MarkersResearch Groups Participants Analytes Technique Main Findings Comment
Herbert et al 2013
PD n=43, MSA n=23, Controls n=30
DJ-1 ELISA • Increase in MSA>PD• Significant difference
in MSA vs PD, MSA vs Controls and PD vs Controls
Diagnostic accuracy for discriminating MSA from PD improved by combining DJ-1 with t-tau + p-tau
Salvesen et al 2012
PD n=30, DLB n=17, MSA n=14, PSP n=19
DJ-1 ELISA No difference among groups
Shi et al 2011
Discovery cohortPD n=126, MSA n=32AD n=50, Controls n=137Validation CohortPD n=83
DJ-1
Bead-based multi-analyte assay (Luminex)
Decrease in MSA + PD vs controls + AD
Hong et al 2010
PD n=117, AD n=50, HC n=132
DJ-1 Bead-based multi-analyte assay (Luminex)
• Decreased levels in PD vs Controls and AD
• No difference between AD + Controls
Correlation with age (esp in HC), but not with disease severity
Constantinescu et al 2013
PD n=6, MSA n=13, PSP n=18, CBD n=6, HC n=18
Urate Enzymatic method on a modular system
No difference
MaetzlerEt al 2011
PD n=55, PDD n=20, DLB n=20, Controls n=76
Uric acid ADVIA analyser + photometric methods
Increase in PD vs DLB Positive correlation with Aβ42 in HC but not in DLB
Gmitterová et al 2009
PD n=27, PSS n=21, LBD n=18, AD n=18 Controls n=13
8-OHdgG ELISA Increase in PD and PDD vs controls, but only significant difference between non demented PD + controls
Increase in 8-OHdG levels with lower MMSE score in PDD
• DJ1: inconsistent results; ? Increase in MSA could differentiate MSA from PD• Urate: inconsistent results
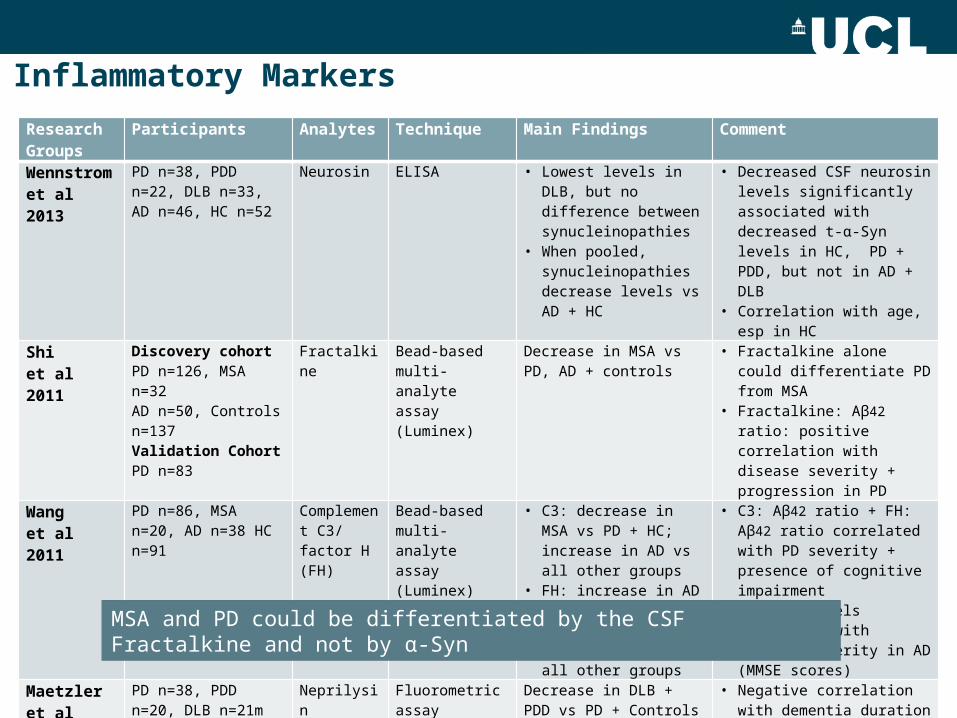
Inflammatory Markers
Research Groups
Participants Analytes Technique Main Findings Comment
Wennstrom et al 2013
PD n=38, PDD n=22, DLB n=33, AD n=46, HC n=52
Neurosin ELISA • Lowest levels in DLB, but no difference between synucleinopathies
• When pooled, synucleinopathies decrease levels vs AD + HC
• Decreased CSF neurosin levels significantly associated with decreased t- -Syn levels in HC, α PD + PDD, but not in AD + DLB
• Correlation with age, esp in HC
Shi et al 2011
Discovery cohortPD n=126, MSA n=32AD n=50, Controls n=137Validation CohortPD n=83
Fractalkine
Bead-based multi-analyte assay (Luminex)
Decrease in MSA vs PD, AD + controls
• Fractalkine alone could differentiate PD from MSA
• Fractalkine: Aβ42 ratio: positive correlation with disease severity + progression in PD
Wang et al 2011
PD n=86, MSA n=20, AD n=38 HC n=91
Complement C3/ factor H (FH)
Bead-based multi-analyte assay (Luminex)
• C3: decrease in MSA vs PD + HC; increase in AD vs all other groups
• FH: increase in AD vs PD + HC
• C3:FH ratio: decreas in MSA vs all other groups
• C3: Aβ42 ratio + FH: Aβ42 ratio correlated with PD severity + presence of cognitive impairment
• C3 + FH levels correlated with disease severity in AD (MMSE scores)
Maetzleret al 2010
PD n=38, PDD n=20, DLB n=21m Controls n=23
Neprilysin Fluorometric assay
Decrease in DLB + PDD vs PD + Controls
• Negative correlation with dementia duration
• Positive correlation with Aβ42 levels
MSA and PD could be differentiated by the CSF Fractalkine and not by α-Syn
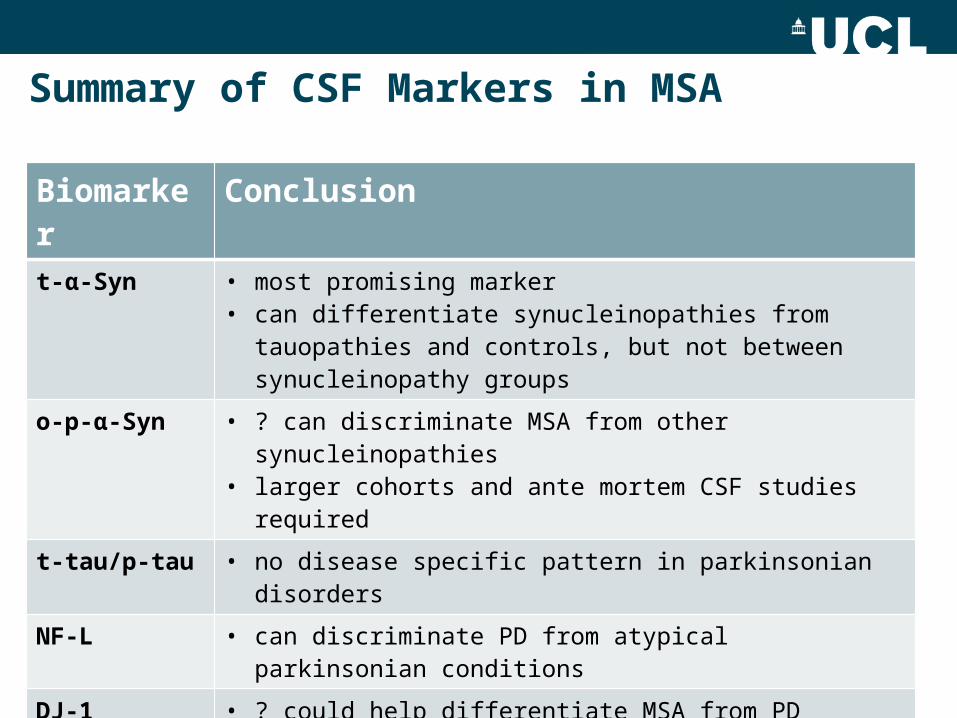
Summary of CSF Markers in MSA
Biomarker Conclusion
t-α-Syn • most promising marker• can differentiate synucleinopathies from tauopathies and
controls, but not between synucleinopathy groups
o-p-α-Syn • ? can discriminate MSA from other synucleinopathies• larger cohorts and ante mortem CSF studies required
t-tau/p-tau • no disease specific pattern in parkinsonian disorders
NF-L • can discriminate PD from atypical parkinsonian conditions
DJ-1 • ? could help differentiate MSA from PD
Oxidative stress/Inflammatory
• promising results requiring further studies
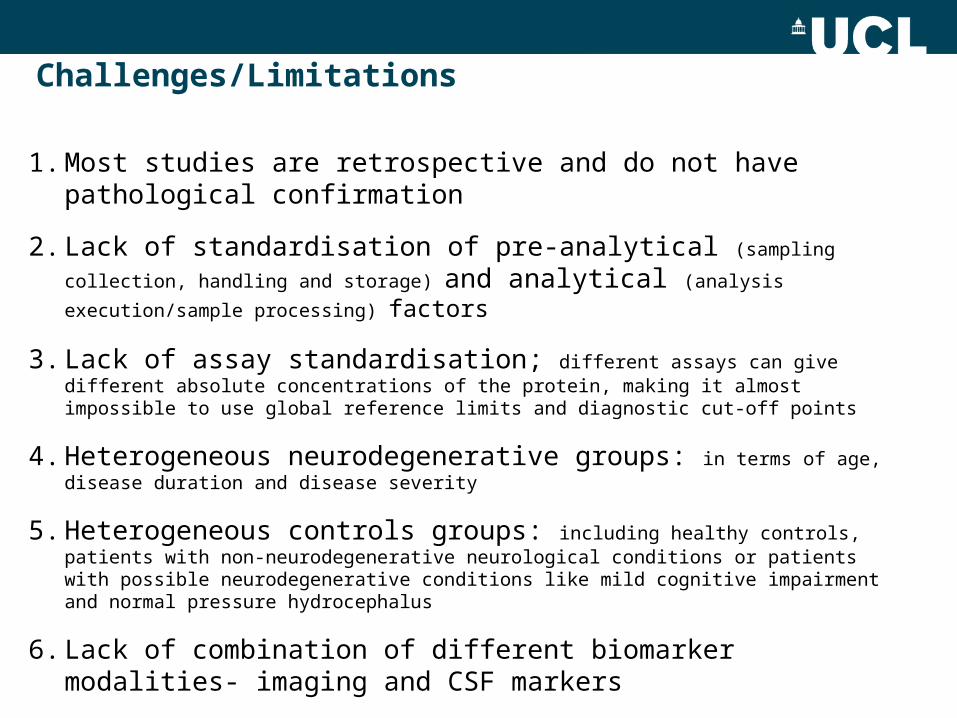
Challenges/Limitations
1. Most studies are retrospective and do not have pathological confirmation
2. Lack of standardisation of pre-analytical (sampling collection, handling and storage)
and analytical (analysis execution/sample processing) factors
3. Lack of assay standardisation; different assays can give different absolute concentrations of the protein, making it almost impossible to use global reference limits and diagnostic cut-off points
4. Heterogeneous neurodegenerative groups: in terms of age, disease duration and disease severity
5. Heterogeneous controls groups: including healthy controls, patients with non-neurodegenerative neurological conditions or patients with possible neurodegenerative conditions like mild cognitive impairment and normal pressure hydrocephalus
6. Lack of combination of different biomarker modalities- imaging and CSF markers
TARGETED CEREBROSPINAL FLUID MARKERS IN PARKINSONISM
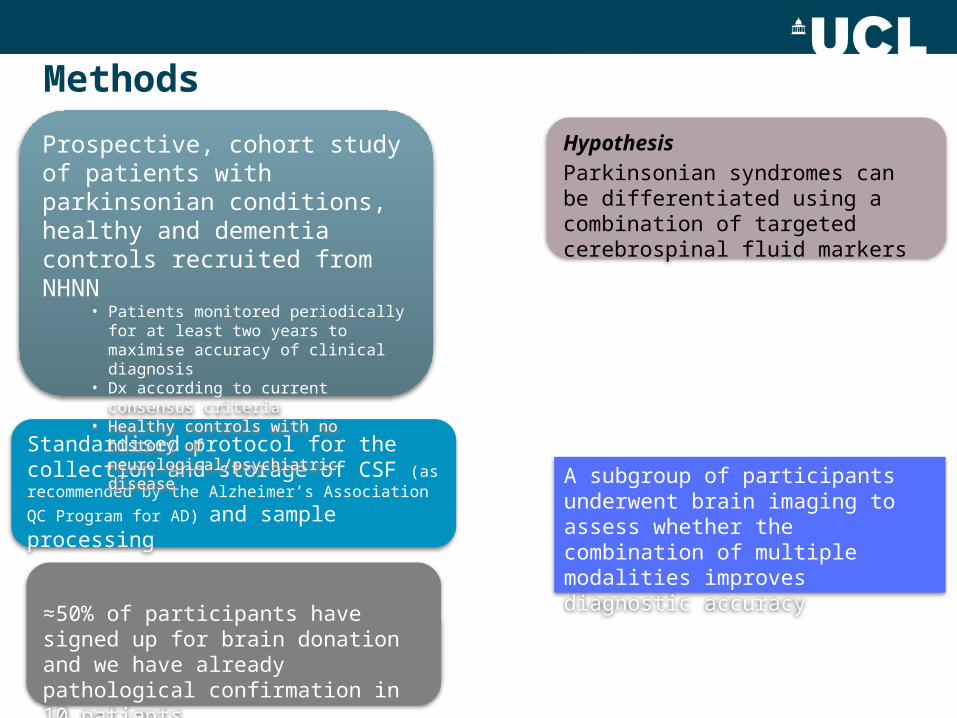
Methods
Standardised protocol for the collection and storage of CSF (as recommended by the Alzheimer’s
Association QC Program for AD) and sample processing
Prospective, cohort study of patients with parkinsonian conditions, healthy and dementia controls recruited from NHNN
• Patients monitored periodically for at least two years to maximise accuracy of clinical diagnosis
• Dx according to current consensus criteria• Healthy controls with no history of
neurological/psychiatric disease
A subgroup of participants underwent brain imaging to assess whether the combination of multiple modalities improves diagnostic accuracy
≈50% of participants have signed up for brain donation and we have already pathological confirmation in 10 patients
Hypothesis
Parkinsonian syndromes can be differentiated using a combination of targeted cerebrospinal fluid markers
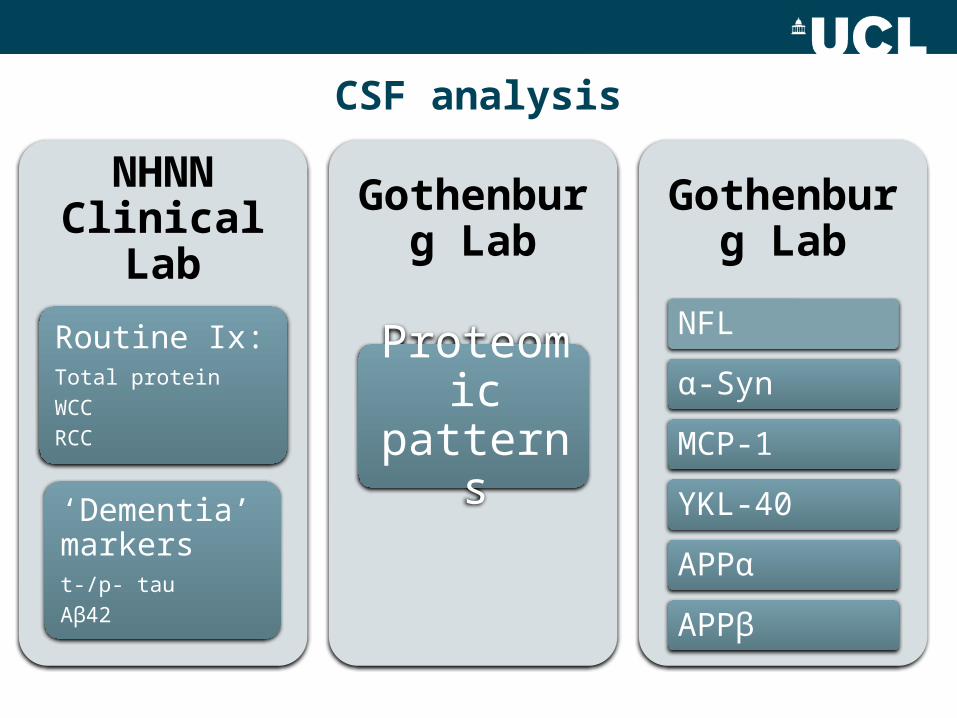
CSF analysis
NHNN Clinical Lab
Routine Ix:Total protein
WCC
RCC
‘Dementia’ markerst-/p- tau
Aβ42
Gothenburg Lab
Proteomic patterns
Gothenburg Lab
NFL
α-Syn
MCP-1
YKL-40
APPα
APPβ
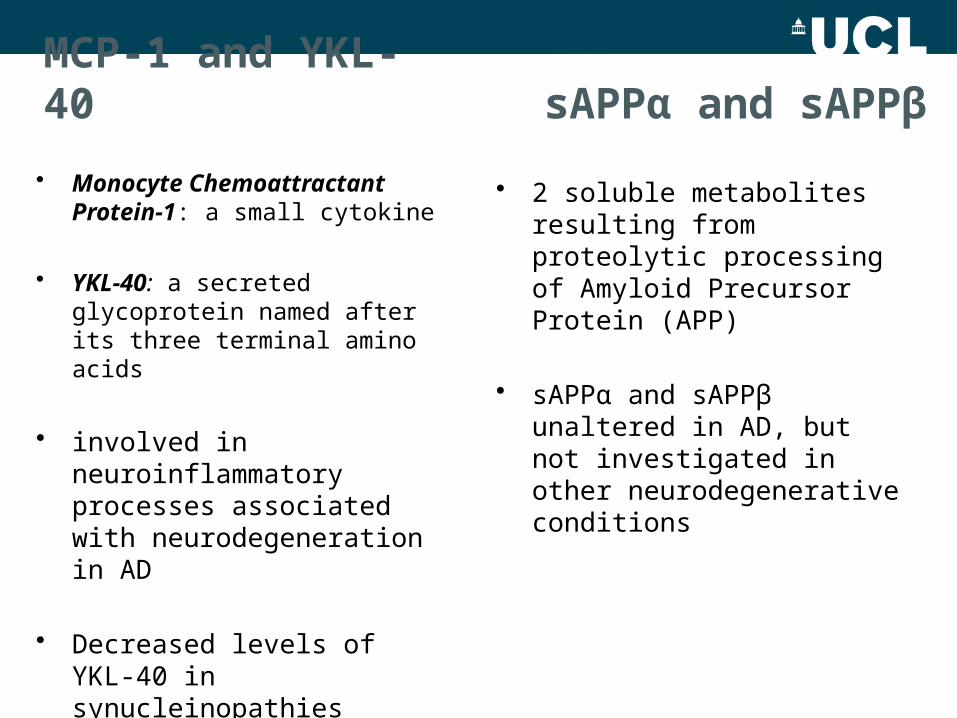
MCP-1 and YKL-40
• Monocyte Chemoattractant Protein-1: a small cytokine
• YKL-40: a secreted glycoprotein named after its three terminal amino acids
• involved in neuroinflammatory processes associated with neurodegeneration in AD
• Decreased levels of YKL-40 in synucleinopathies compared with tauopathies and healthy controls (Olsson et al 2013)
sAPPα and sAPPβ
• 2 soluble metabolites resulting from proteolytic processing of Amyloid Precursor Protein (APP)
• sAPPα and sAPPβ unaltered in AD, but not investigated in other neurodegenerative conditions
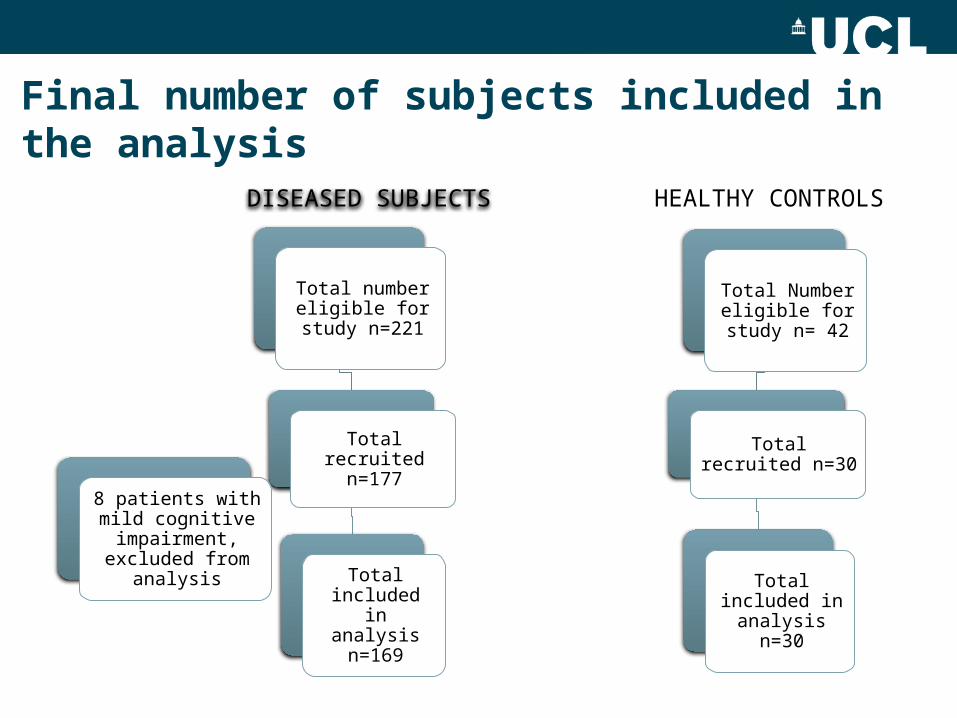
Final number of subjects included in the analysis
Total number eligible for study
n=221
Total recruited n=177
Total included in analysis
n=169
Total Number eligible for study
n= 42
Total recruited n=30
Total included in analysis
n=30
8 patients with mild cognitive
impairment, excluded from
analysis
DISEASED SUBJECTS HEALTHY CONTROLS
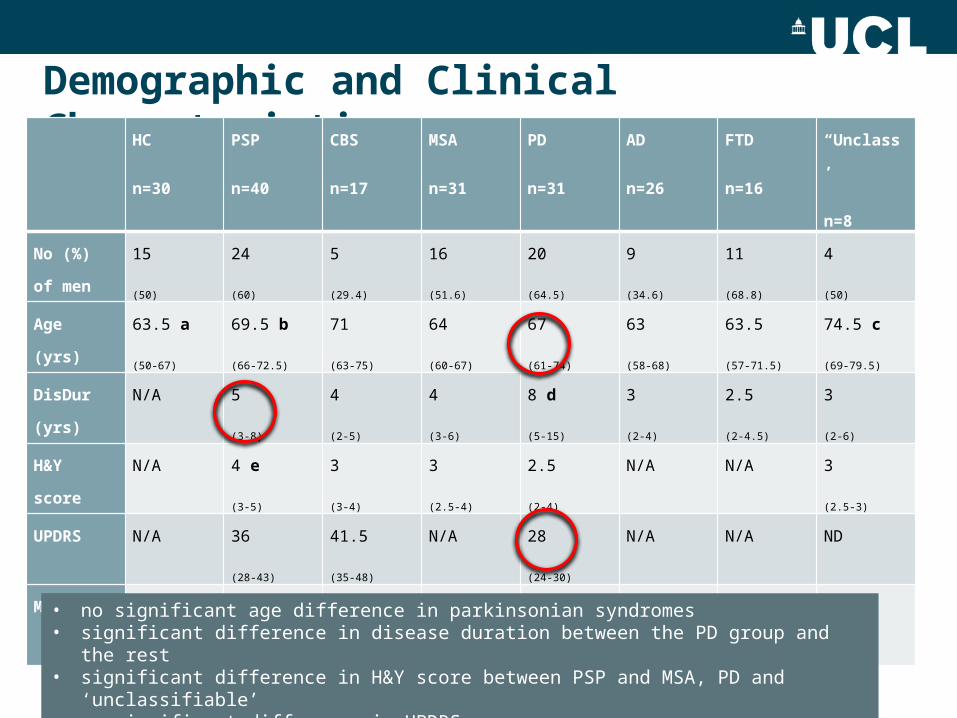
Demographic and Clinical Characteristics HC
n=30
PSP
n=40
CBS
n=17
MSA
n=31
PD
n=31
AD
n=26
FTD
n=16
“Unclass’
n=8
No (%) of
men
15
(50)
24
(60)
5
(29.4)
16
(51.6)
20
(64.5)
9
(34.6)
11
(68.8)
4
(50)
Age (yrs) 63.5 a
(50-67)
69.5 b
(66-72.5)
71
(63-75)
64
(60-67)
67
(61-74)
63
(58-68)
63.5
(57-71.5)
74.5 c
(69-79.5)
DisDur
(yrs)
N/A 5
(3-8)
4
(2-5)
4
(3-6)
8 d
(5-15)
3
(2-4)
2.5
(2-4.5)
3
(2-6)
H&Y score N/A 4 e
(3-5)
3
(3-4)
3
(2.5-4)
2.5
(2-4)
N/A N/A 3
(2.5-3)
UPDRS N/A 36
(28-43)
41.5
(35-48)
N/A 28
(24-30)
N/A N/A ND
MMSE 30
(30-30)
27
(25-28.5)
26
(26-28)
N/A 28 f
(24-30)
ND ND ND
• no significant age difference in parkinsonian syndromes • significant difference in disease duration between the PD group and the rest• significant difference in H&Y score between PSP and MSA, PD and ‘unclassifiable’ • no significant difference in UPDRS • significant difference in MMSE scores between PD and controls
‘Dementia’ Markers
HC
n=30
PSP
n=40
CBS
n=17
MSA
n=31
PD
n=31
AD
n=26
FTD
n=16
“Unclass’
n=8
t-tau
(ng/mL)
303.5
(189-402)
260.5
(234-369)
275
(217-377)
277
(210-341)
339
(226-444)
806 a
(469-1140)
241.5
(219-361.5)
358.5
(234-388.5)
p-tau
(ng/mL)
38
(29-54)
34
(31-44.5)
36
(30-43)
34
(28-38)
39
(31-54)
81.5 b
(57-94)
35
(30-44.5)
36
(33-41)
Aβ42
(ng/mL)
953
(771-1199)
659
(539-838.5)
716
(547-975)
775
(520-911)
770
(584-1044)
363.5 c
(264-511)
878
(695-1140.5)
689
(478.5-858)
t-tau/Aβ42
(ng/mL)
0.3
(0.22-0.36)
0.415
(0.3-0.53)
0.35
(0.23-0.53)
0.43
(0.28-0.53)
0.38
(0.3-0.61)
2.17 d
(1.495-3.475)
0.335
(0.22-0.465)
0.48
(0.37-0.66)
Aβ42, t-tau and p-tau showed a significant difference between AD and all other groups, but did not discriminate between parkinsonian syndromes
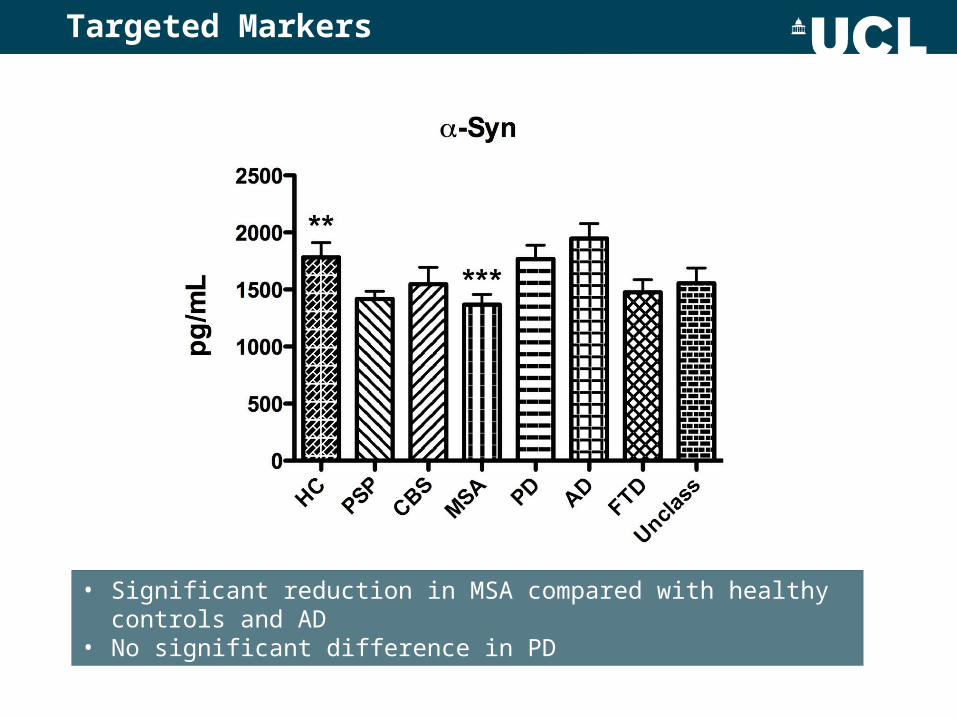
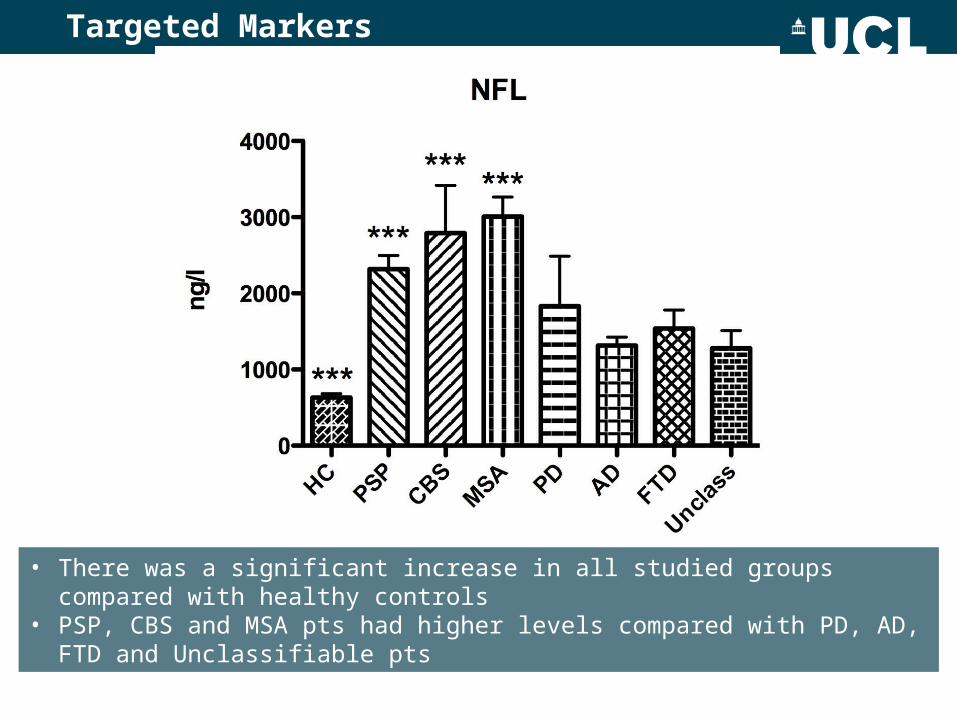
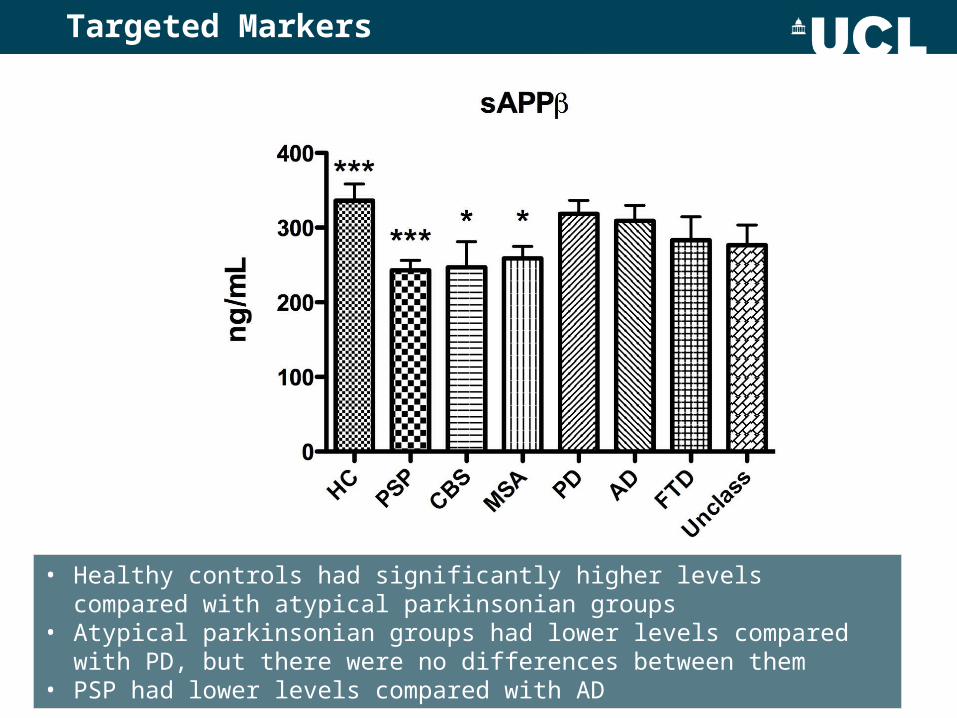
Targeted Markers
• Significant reduction in MSA compared with healthy controls and AD• No significant difference in PD
Targeted Markers
• There was a significant increase in all studied groups compared with healthy controls
• PSP, CBS and MSA pts had higher levels compared with PD, AD, FTD and Unclassifiable pts
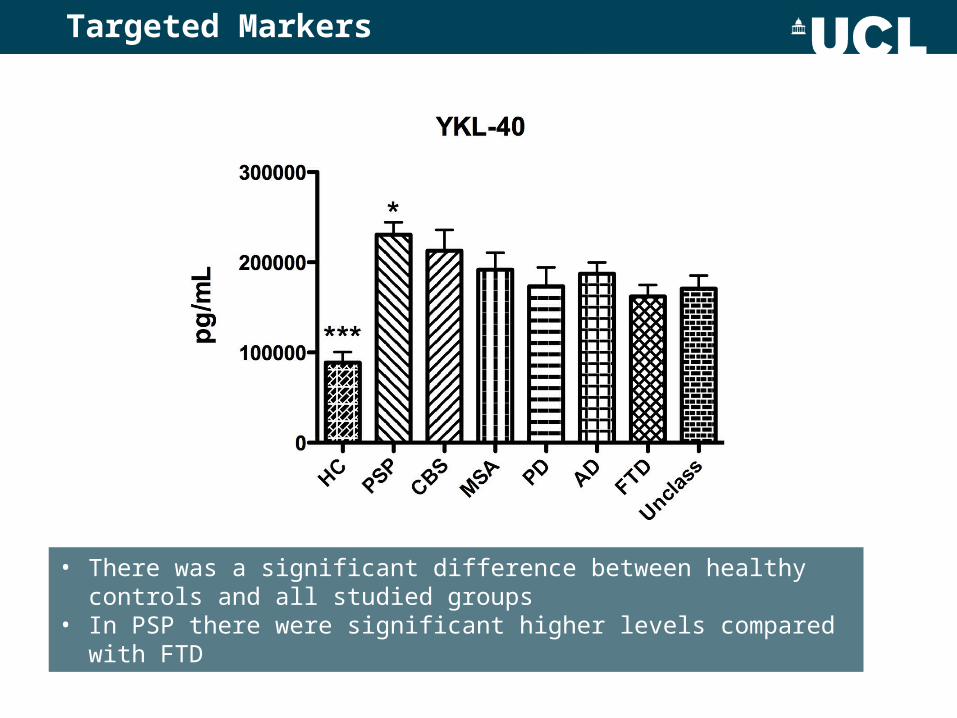
Targeted Markers
• There was a significant difference between healthy controls and all studied groups
• In PSP there were significant higher levels compared with FTD
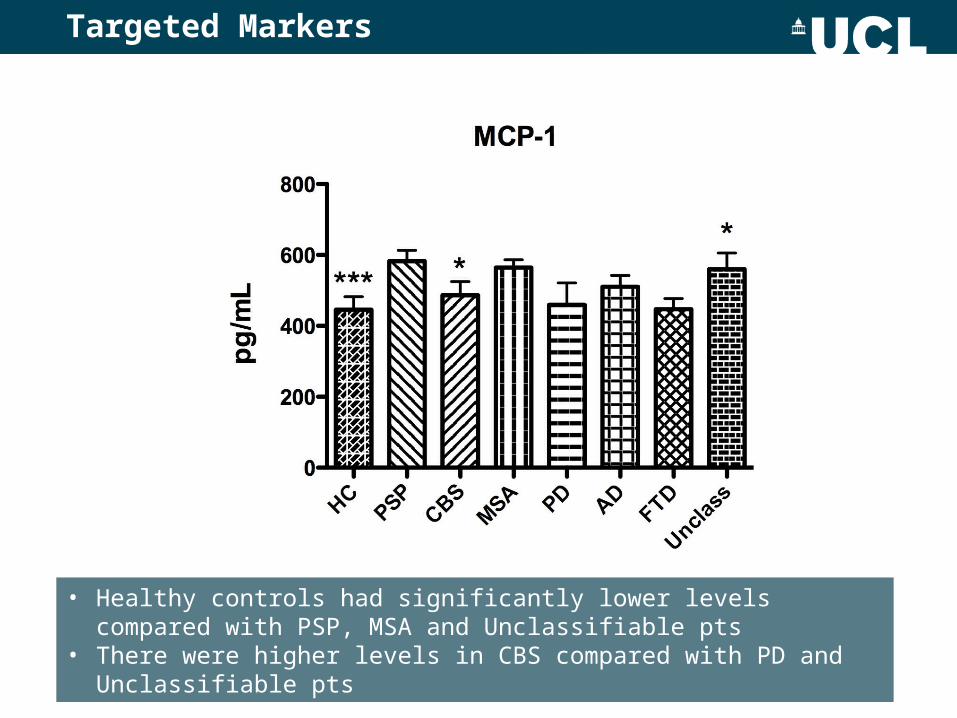
Targeted Markers
• Healthy controls had significantly lower levels compared with PSP, MSA and Unclassifiable pts
• There were higher levels in CBS compared with PD and Unclassifiable pts
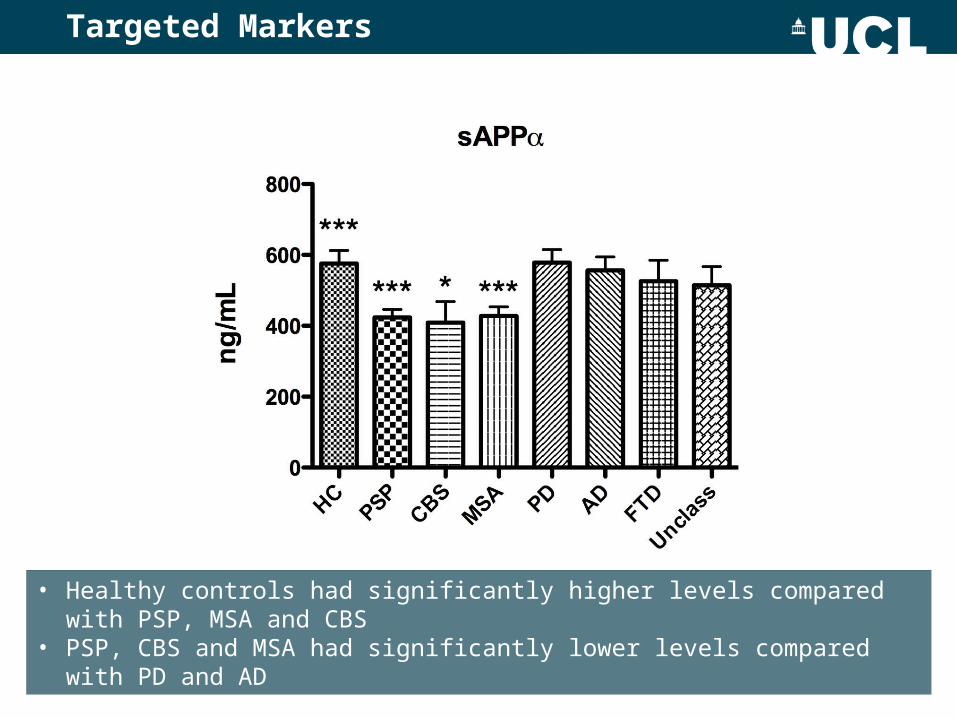
Targeted Markers
• Healthy controls had significantly higher levels compared with PSP, MSA and CBS
• PSP, CBS and MSA had significantly lower levels compared with PD and AD
Targeted Markers
• Healthy controls had significantly higher levels compared with atypical parkinsonian groups
• Atypical parkinsonian groups had lower levels compared with PD, but there were no differences between them
• PSP had lower levels compared with AD
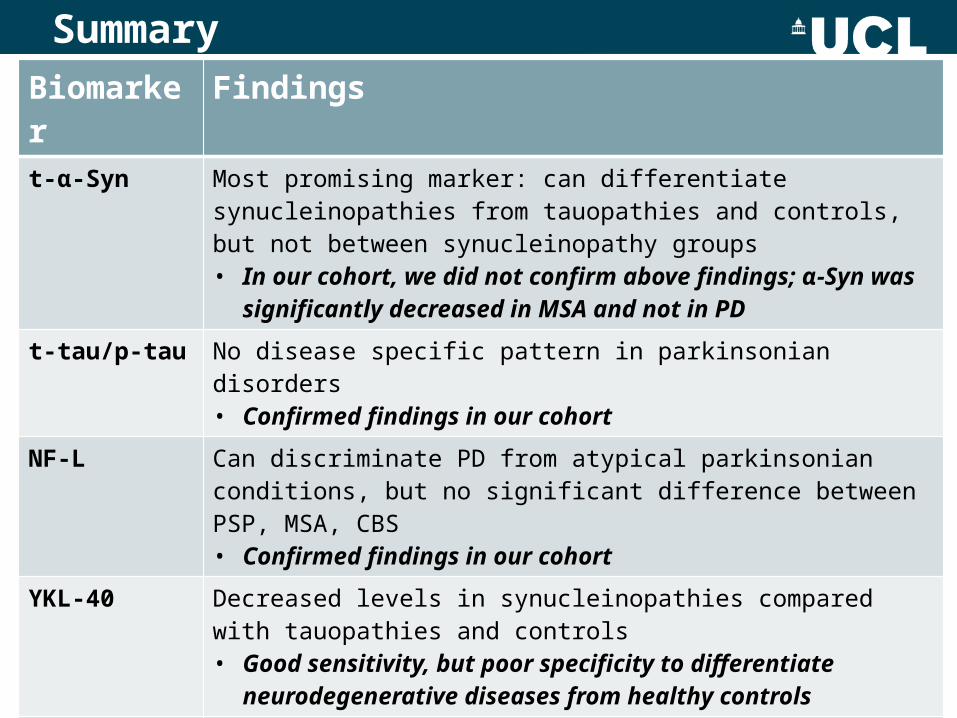
SummaryBiomarker Findingst-α-Syn Most promising marker: can differentiate synucleinopathies from
tauopathies and controls, but not between synucleinopathy groups• In our cohort, we did not confirm above findings; α-Syn was
significantly decreased in MSA and not in PD
t-tau/p-tau No disease specific pattern in parkinsonian disorders• Confirmed findings in our cohort
NF-L Can discriminate PD from atypical parkinsonian conditions, but no significant difference between PSP, MSA, CBS• Confirmed findings in our cohort
YKL-40 Decreased levels in synucleinopathies compared with tauopathies and controls• Good sensitivity, but poor specificity to differentiate
neurodegenerative diseases from healthy controls
MCP-1 • Significant difference in MSA and PSP compared with healthy controls
• Could differentiate CBS from PD
APPαAPPβ
• Could discriminate atypical parkinsonian groups from PD and healthy controls, but there was no significant difference between PSP, MSA and CBS
Summary
Conclusion
• Unpublished data• Preliminary analysis only• Promising early results: reproduced other
published data• Unlikely that a single biomarker will hold the
answer: combination of markers may be required
CEREBROSPINAL FLUID PROTEOMICS IN PARKINSONISM
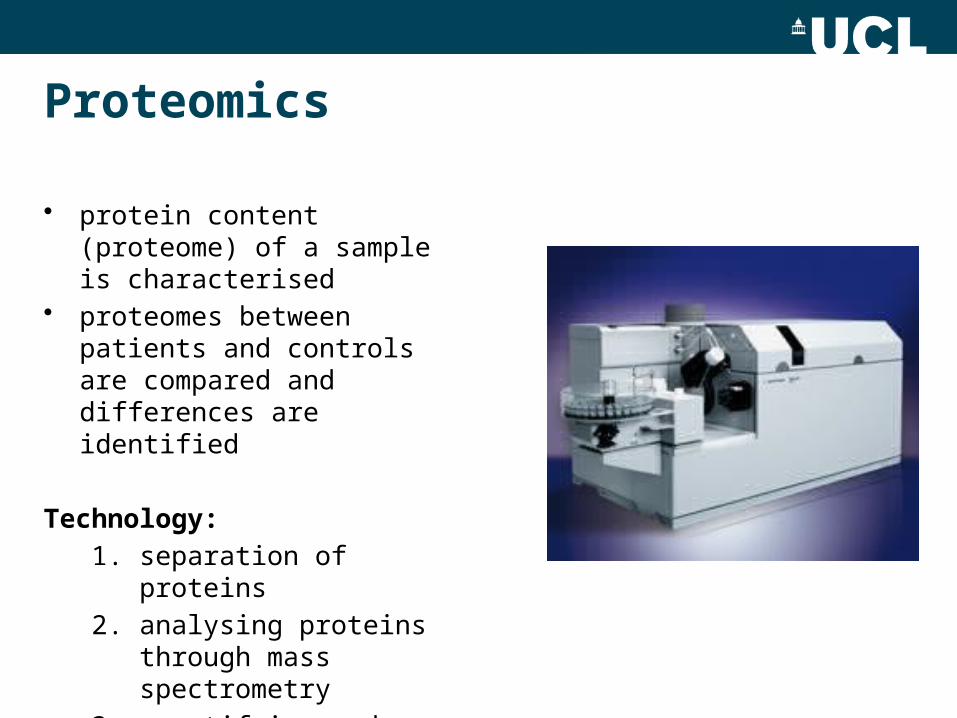
Proteomics
• protein content (proteome) of a sample is characterised
• proteomes between patients and controls are compared and differences are identified
Technology:
1. separation of proteins
2. analysing proteins through mass spectrometry
3. quantifying and identifying proteins through advanced data processing
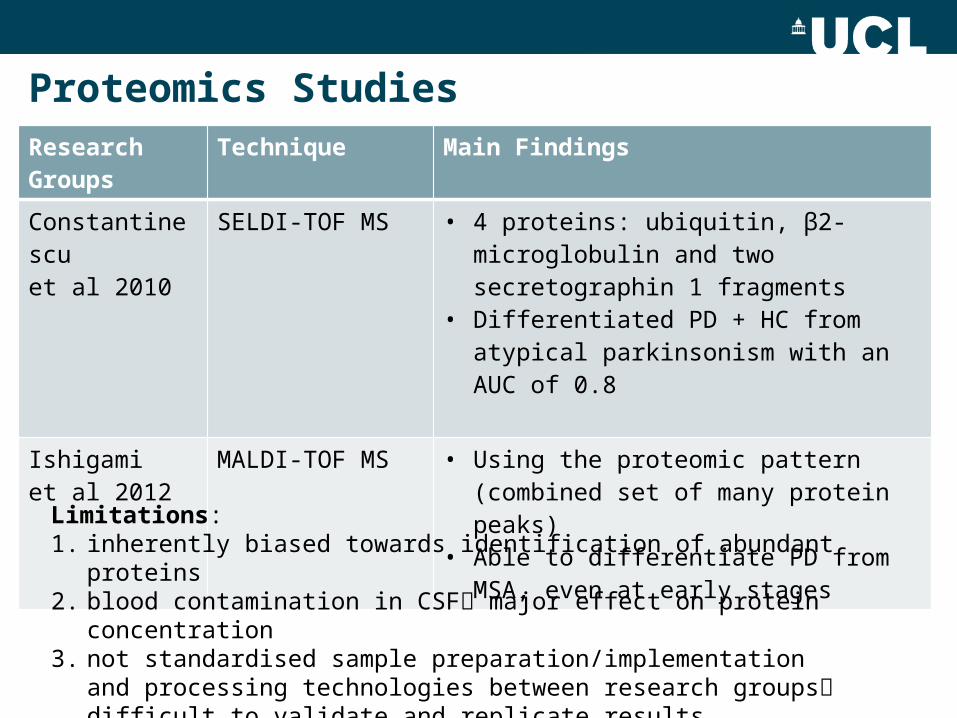
Proteomics StudiesResearch Groups
Technique Main Findings
Constantinescu et al 2010
SELDI-TOF MS • 4 proteins: ubiquitin, β2-microglobulin and two secretographin 1 fragments
• Differentiated PD + HC from atypical parkinsonism with an AUC of 0.8
Ishigami et al 2012
MALDI-TOF MS • Using the proteomic pattern (combined set of many protein peaks)
• Able to differentiate PD from MSA, even at early stages
Limitations:1. inherently biased towards identification of abundant proteins2. blood contamination in CSF major effect on protein concentration3. not standardised sample preparation/implementation and processing
technologies between research groups difficult to validate and replicate results
Proteomics
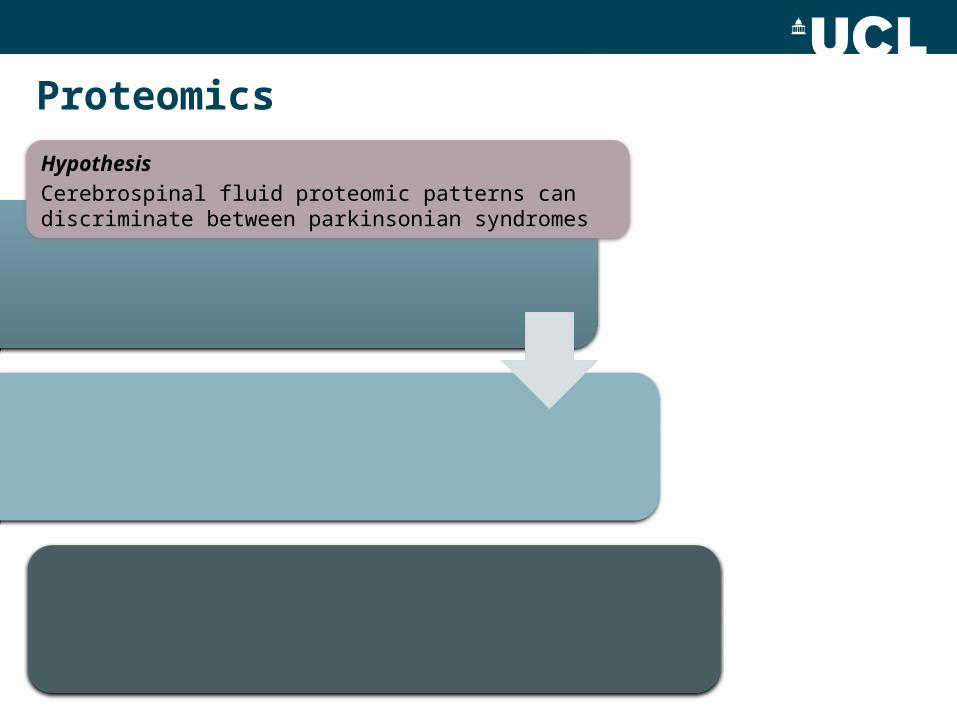
Hypothesis
Cerebrospinal fluid proteomic patterns can discriminate between parkinsonian syndromes
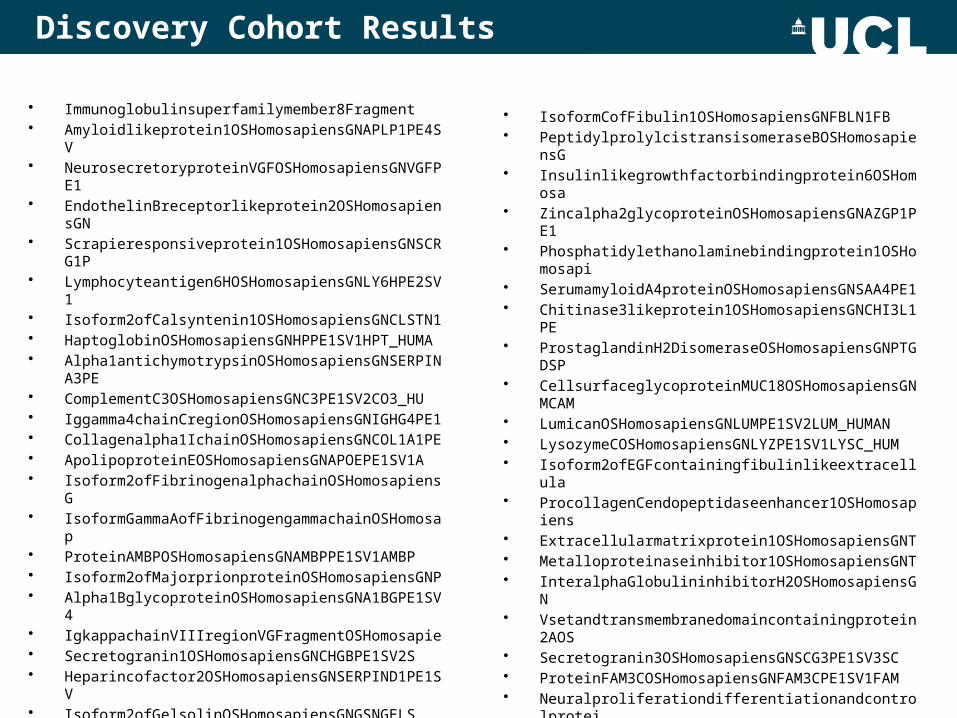
Discovery Cohort Results
• Immunoglobulinsuperfamilymember8Fragment• Amyloidlikeprotein1OSHomosapiensGNAPLP1PE4SV• NeurosecretoryproteinVGFOSHomosapiensGNVGFPE1• EndothelinBreceptorlikeprotein2OSHomosapiensGN• Scrapieresponsiveprotein1OSHomosapiensGNSCRG1P• Lymphocyteantigen6HOSHomosapiensGNLY6HPE2SV1• Isoform2ofCalsyntenin1OSHomosapiensGNCLSTN1• HaptoglobinOSHomosapiensGNHPPE1SV1HPT_HUMA• Alpha1antichymotrypsinOSHomosapiensGNSERPINA3PE• ComplementC3OSHomosapiensGNC3PE1SV2CO3_HU• Iggamma4chainCregionOSHomosapiensGNIGHG4PE1• Collagenalpha1IchainOSHomosapiensGNCOL1A1PE• ApolipoproteinEOSHomosapiensGNAPOEPE1SV1A• Isoform2ofFibrinogenalphachainOSHomosapiensG• IsoformGammaAofFibrinogengammachainOSHomosap• ProteinAMBPOSHomosapiensGNAMBPPE1SV1AMBP• Isoform2ofMajorprionproteinOSHomosapiensGNP• Alpha1BglycoproteinOSHomosapiensGNA1BGPE1SV4• IgkappachainVIIIregionVGFragmentOSHomosapie• Secretogranin1OSHomosapiensGNCHGBPE1SV2S• Heparincofactor2OSHomosapiensGNSERPIND1PE1SV• Isoform2ofGelsolinOSHomosapiensGNGSNGELS• MonocytedifferentiationantigenCD14OSHomosapiensG• ComplementcomponentC7OSHomosapiensGNC7PE1SV2• ChromograninAOSHomosapiensGNCHGAPE1SV7CMG• Secretogranin2OSHomosapiensGNSCG2PE1SV2SC• Insulinlikegrowthfactorbindingprotein2OSHomosa• Fibulin1OSHomosapiensGNFBLN1PE1SV4FBLN1_H
• IsoformCofFibulin1OSHomosapiensGNFBLN1FB• PeptidylprolylcistransisomeraseBOSHomosapiensG• Insulinlikegrowthfactorbindingprotein6OSHomosa• Zincalpha2glycoproteinOSHomosapiensGNAZGP1PE1• Phosphatidylethanolaminebindingprotein1OSHomosapi• SerumamyloidA4proteinOSHomosapiensGNSAA4PE1• Chitinase3likeprotein1OSHomosapiensGNCHI3L1PE• ProstaglandinH2DisomeraseOSHomosapiensGNPTGDSP• CellsurfaceglycoproteinMUC18OSHomosapiensGNMCAM• LumicanOSHomosapiensGNLUMPE1SV2LUM_HUMAN• LysozymeCOSHomosapiensGNLYZPE1SV1LYSC_HUM• Isoform2ofEGFcontainingfibulinlikeextracellula• ProcollagenCendopeptidaseenhancer1OSHomosapiens• Extracellularmatrixprotein1OSHomosapiensGNT• Metalloproteinaseinhibitor1OSHomosapiensGNT• InteralphaGlobulininhibitorH2OSHomosapiensGN• Vsetandtransmembranedomaincontainingprotein2AOS• Secretogranin3OSHomosapiensGNSCG3PE1SV3SC• ProteinFAM3COSHomosapiensGNFAM3CPE1SV1FAM• Neuralproliferationdifferentiationandcontrolprotei
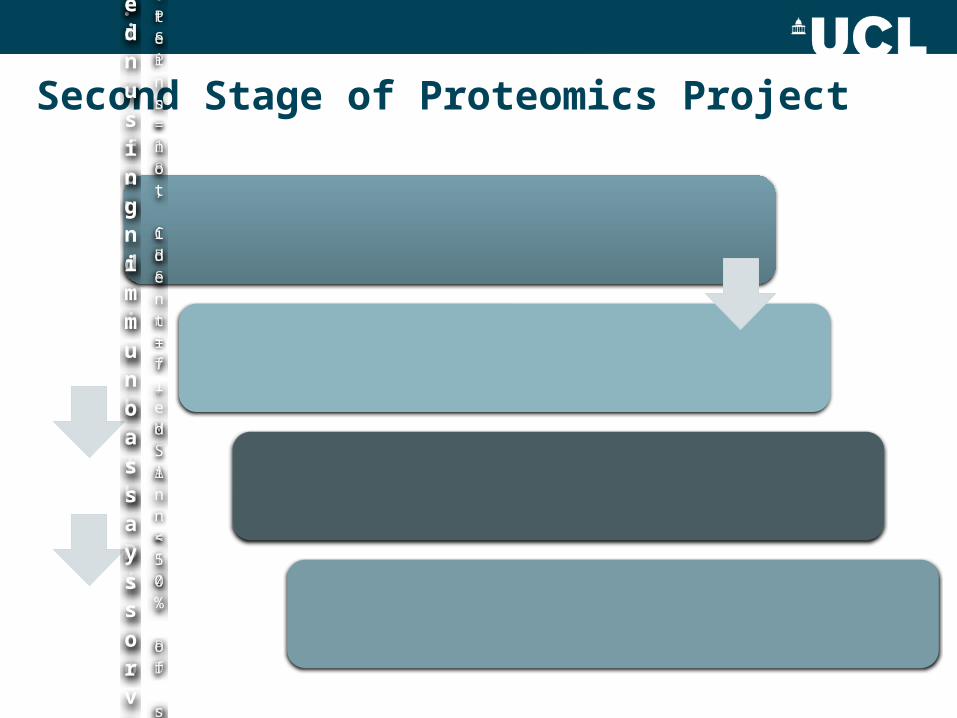
Second Stage of Proteomics Project
Validation Cohort n=67• P
SP n=18, CBS n=7, MSA n=14, PD n=13, HC n=15
Proteins identified• d
ata filtered by removing proteins not identified in <50% of subjects/not statistically significant
Match statistically significant proteins found in both Discovery & Validation cohorts
Study proteins identified using immunoassays or targeted spectrometry assays
• Early and accurate diagnosis in MSA is very important, esp with emergence of disease modifying drugs
• Clinical diagnosis is inaccurate, particularly in the early stages
• ‘Holy grail’- accurate diagnostic test
• Remains elusive; on-going work with established, hypothesis testing biomarkers and hypothesis generating markers from proteomics studies
• Combination of markers may be required
Conclusion

THANK YOU
Acknowledgements
RLWIAndrew Lees
Tom Warner
John Hardy
Rohan de Silva
Janice Holton
Helen Ling
Atbin Djamshidian
Alastair Noyce
Karen Doherty Geshanti Honhamuni
Connie Luk
Iliyana Komsiyska
Karen Shaw
DRCJason Warren
Nick Fox
Cath Mummery
Jon Schott
Martin Rossor
Ross Paterson
Jamie Toombs
Katie Judd
NHNNHenry Houlden
Nick Wood
Kailash Bhatia
Patricia Limousin
Tom Foltynie
Simon Farmer
Paul Jarman
Paola Giunti
Chris Mathias
Gordon Ingle
Lucia Schottlaender
Mike Lunn
Miles Chapman
Funding: PSP association, RLWI, Wolfson foundation award
GothenburgHenrik Zetterberg
Johan Gobom
Max Petzold