![arXiv:1103.3647v1 [astro-ph.HE] 18 Mar 2011 · 2018. 11. 10. · and kiloparsec scale jets apparently misaligned by ∼180 degrees (Homan et al. 2002, Wardle et al. 2005). PKS 1510−089](https://static.fdocument.org/doc/165x107/60acf04529ce614b8c10a63f/arxiv11033647v1-astro-phhe-18-mar-2011-2018-11-10-and-kiloparsec-scale.jpg)
Multi-band Study of the Blazar PKS 2155-304 with XMM-Newton
39
Multi-band study of the Blazar PKS 2155-304 with XMM-Newton Alok C. Gupta, ARIES, Nainital, India [email protected] , [email protected]
Transcript of Multi-band Study of the Blazar PKS 2155-304 with XMM-Newton
Multi-band study of the Blazar PKS 2155-304 with XMM-Newton
Alok C. Gupta, ARIES, Nainital, India
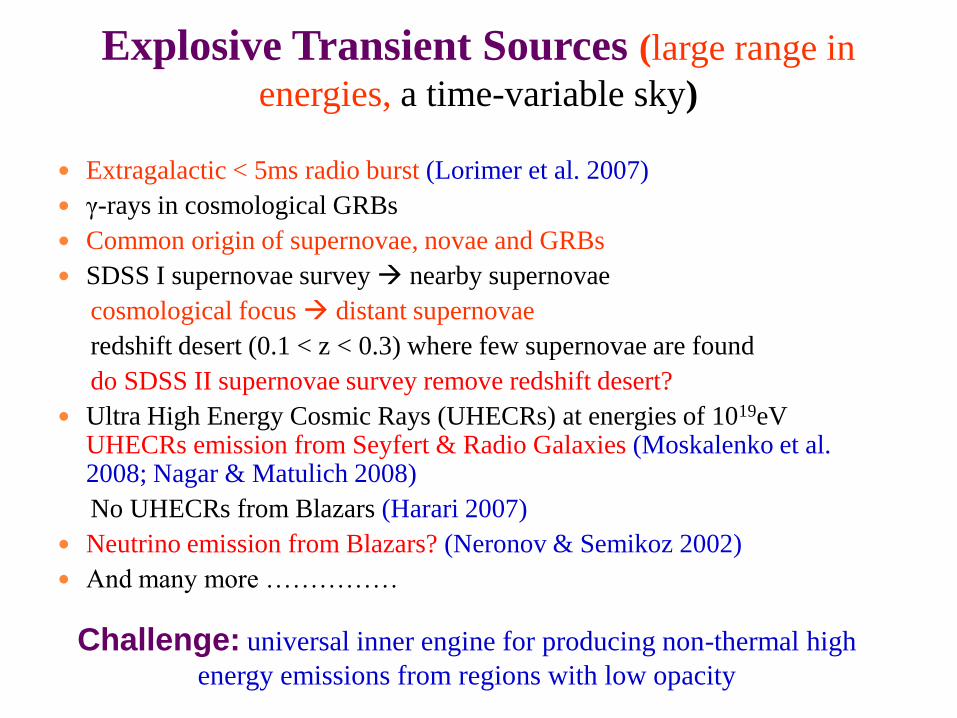
Explosive Transient Sources (large range in
energies, a time-variable sky)
Extragalactic < 5ms radio burst (Lorimer et al. 2007)
γ-rays in cosmological GRBs
Common origin of supernovae, novae and GRBs
SDSS I supernovae survey nearby supernovae
cosmological focus distant supernovae
redshift desert (0.1 < z < 0.3) where few supernovae are found
do SDSS II supernovae survey remove redshift desert?
Ultra High Energy Cosmic Rays (UHECRs) at energies of 1019eV UHECRs emission from Seyfert & Radio Galaxies (Moskalenko et al. 2008; Nagar & Matulich 2008)
No UHECRs from Blazars (Harari 2007)
Neutrino emission from Blazars? (Neronov & Semikoz 2002)
And many more ……………
Challenge: universal inner engine for producing non-thermal high
energy emissions from regions with low opacity
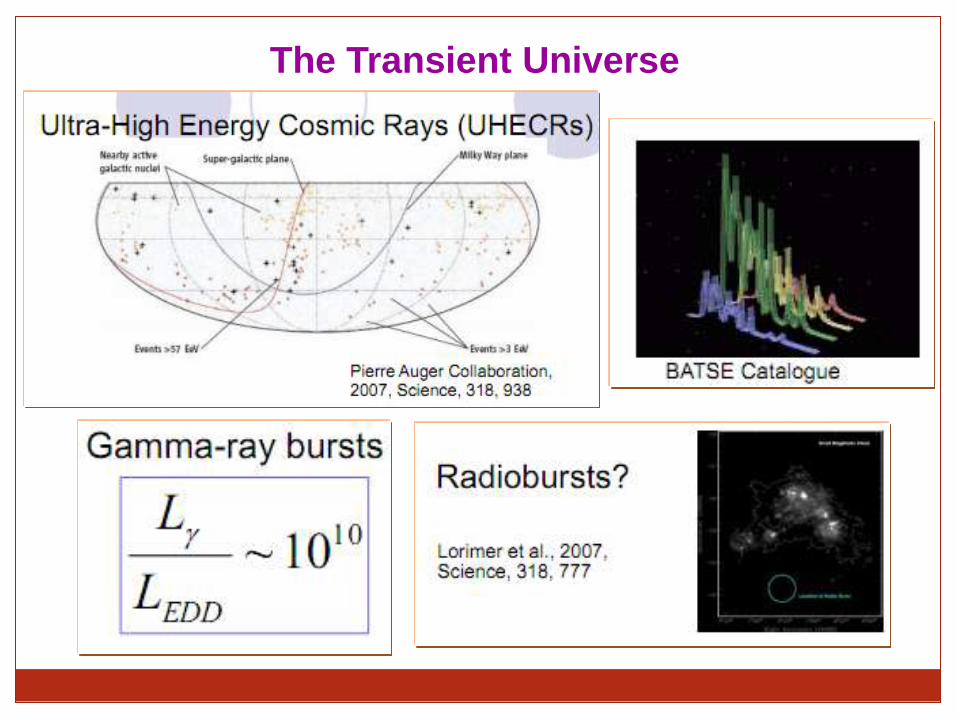
The Transient Universe
Explosive Transient Sources (large range in
energies, a time-variable sky)
In last few years studies on Transient Sources as producing
Tsunami of Papers
Talk Outline
Introduction
Multi-band (Optical/UV and X-ray) XMM-Newton Data
Motivation on the Blazar PKS 2155 – 304 studies
X-ray Intra-Day Variability (IDV)
X-ray QPO detection
X-ray emission modeling on IDV timescale
Multi-band (Optical/UV & X-ray Long Term Variability)
Multi-band Spectral modeling
Important Results & Discussion
Future Projects with ASTROSAT
Conclusion
Ph. D. Students: Dr. Haritma Gaur & Mr. Jai Bhagwan
ARIES, Nainital
Collaborators:
1. Prof. Paul J. Wiita, USA
2. Dr. Pawel Lachowicz, Poland
3. Prof. I. Papadakis, Greece
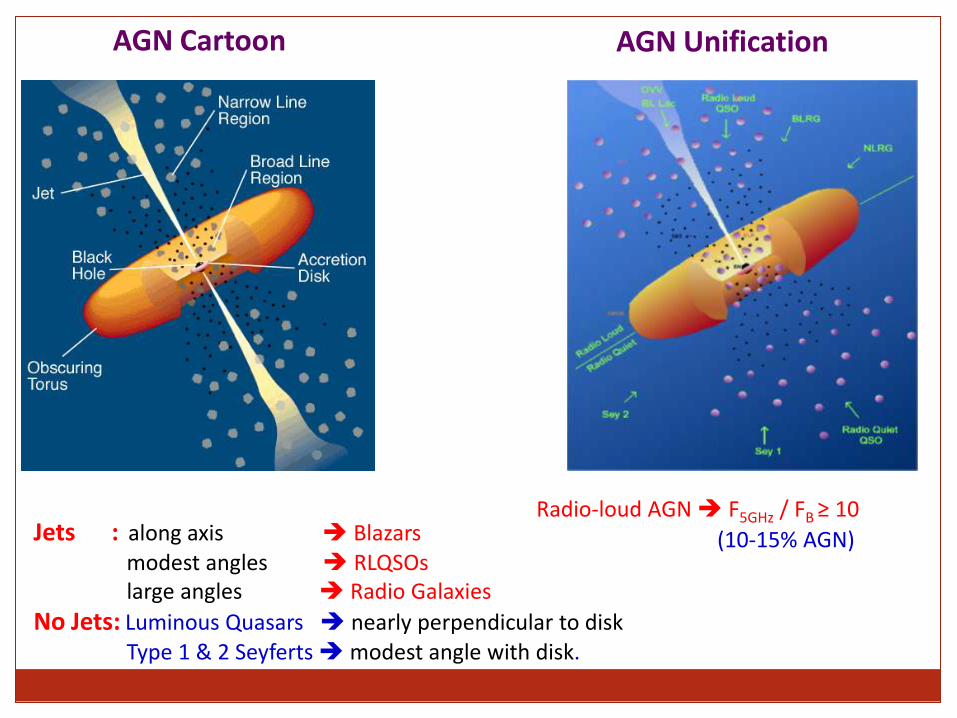
AGN Cartoon AGN Unification
Jets : along axis Blazars modest angles RLQSOs large angles Radio Galaxies
No Jets: Luminous Quasars nearly perpendicular to disk Type 1 & 2 Seyferts modest angle with disk.
Radio-loud AGN F5GHz / FB ≥ 10
(10-15% AGN)
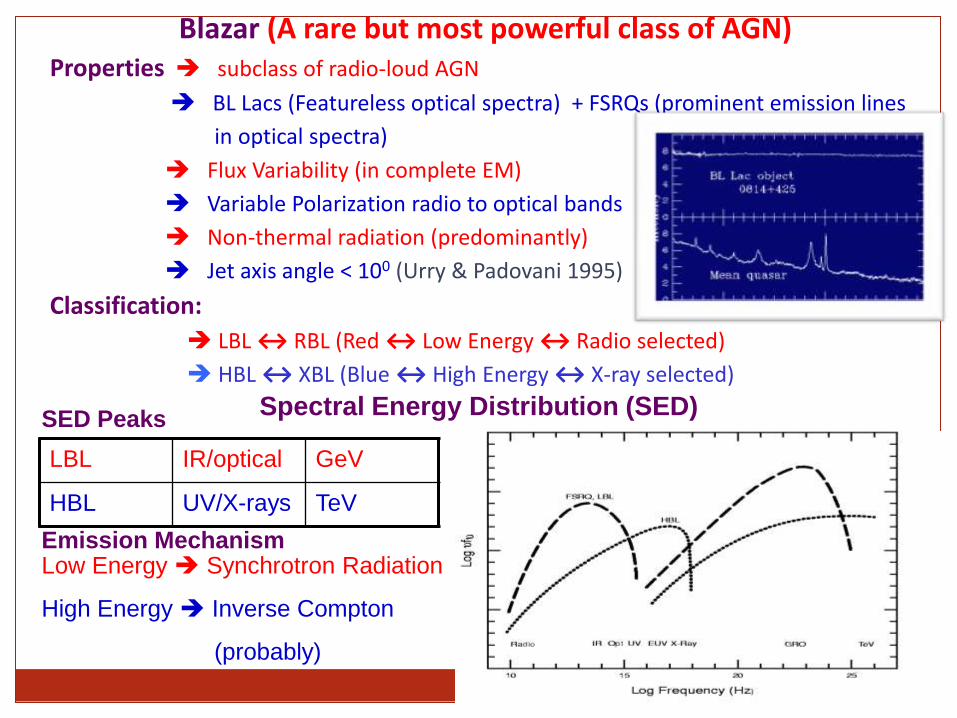
Blazar (A rare but most powerful class of AGN) Properties subclass of radio-loud AGN
BL Lacs (Featureless optical spectra) + FSRQs (prominent emission lines
in optical spectra)
Flux Variability (in complete EM)
Variable Polarization radio to optical bands
Non-thermal radiation (predominantly)
Jet axis angle < 100 (Urry & Padovani 1995)
Classification:
LBL ↔ RBL (Red ↔ Low Energy ↔ Radio selected)
HBL ↔ XBL (Blue ↔ High Energy ↔ X-ray selected)
Spectral Energy Distribution (SED)
LBL IR/optical GeV
HBL UV/X-rays TeV
SED Peaks
Emission Mechanism Low Energy Synchrotron Radiation
High Energy Inverse Compton
(probably)
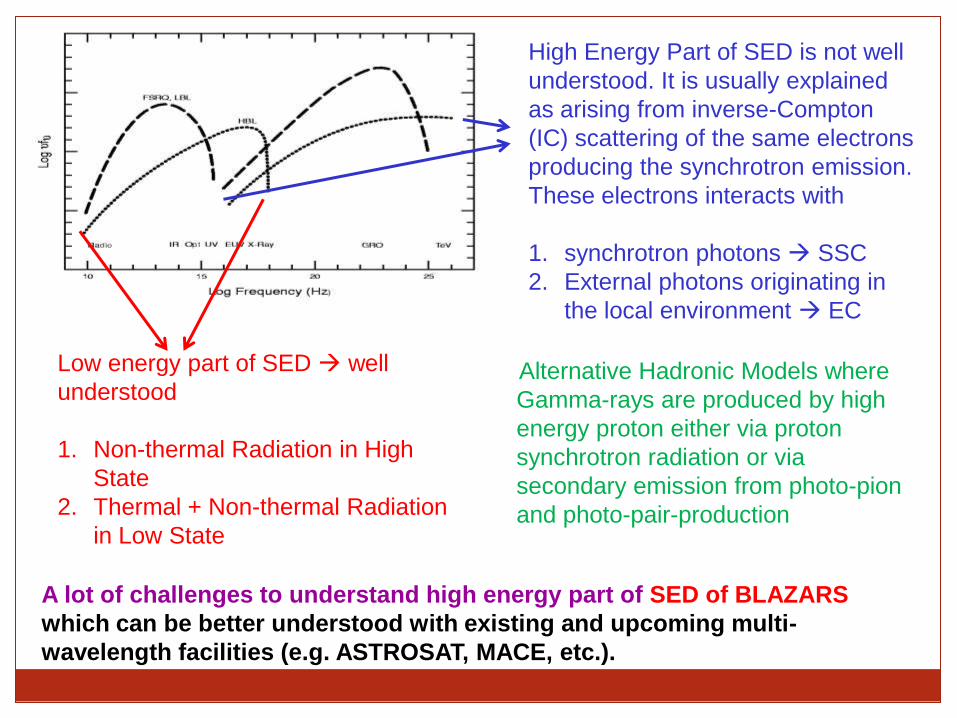
Low energy part of SED well
understood
1. Non-thermal Radiation in High
State
2. Thermal + Non-thermal Radiation
in Low State
High Energy Part of SED is not well
understood. It is usually explained
as arising from inverse-Compton
(IC) scattering of the same electrons
producing the synchrotron emission.
These electrons interacts with
1. synchrotron photons SSC
2. External photons originating in
the local environment EC
Alternative Hadronic Models where
Gamma-rays are produced by high
energy proton either via proton
synchrotron radiation or via
secondary emission from photo-pion
and photo-pair-production
A lot of challenges to understand high energy part of SED of BLAZARS
which can be better understood with existing and upcoming multi-
wavelength facilities (e.g. ASTROSAT, MACE, etc.).
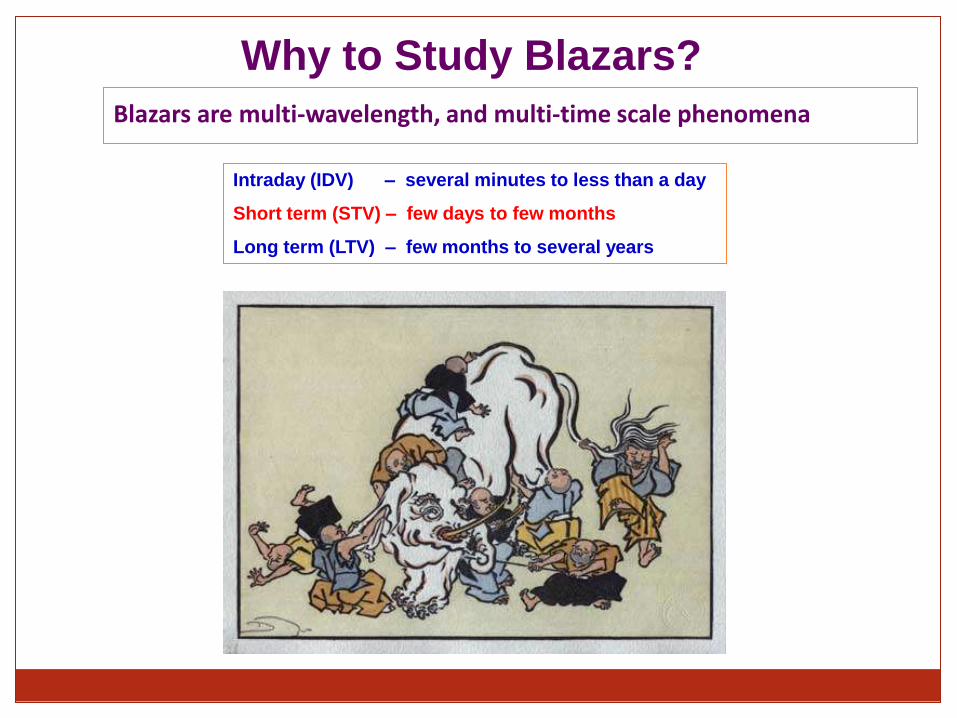
Why to Study Blazars?
Blazars are multi-wavelength, and multi-time scale phenomena
Intraday (IDV) – several minutes to less than a day
Short term (STV) – few days to few months
Long term (LTV) – few months to several years
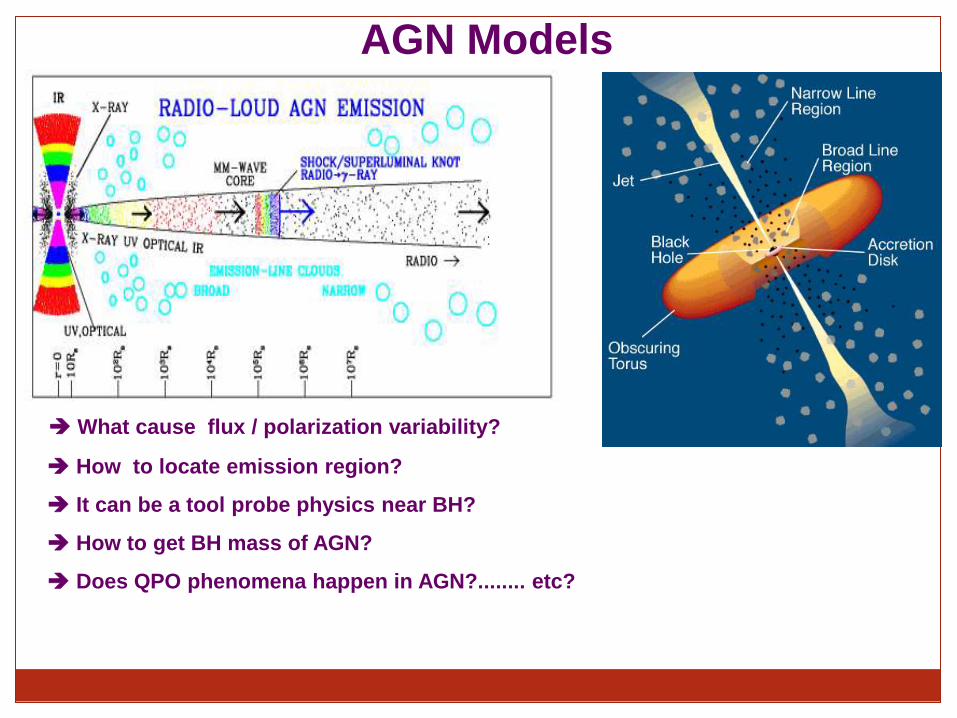
AGN Models
What cause flux / polarization variability?
How to locate emission region?
It can be a tool probe physics near BH?
How to get BH mass of AGN?
Does QPO phenomena happen in AGN?........ etc?
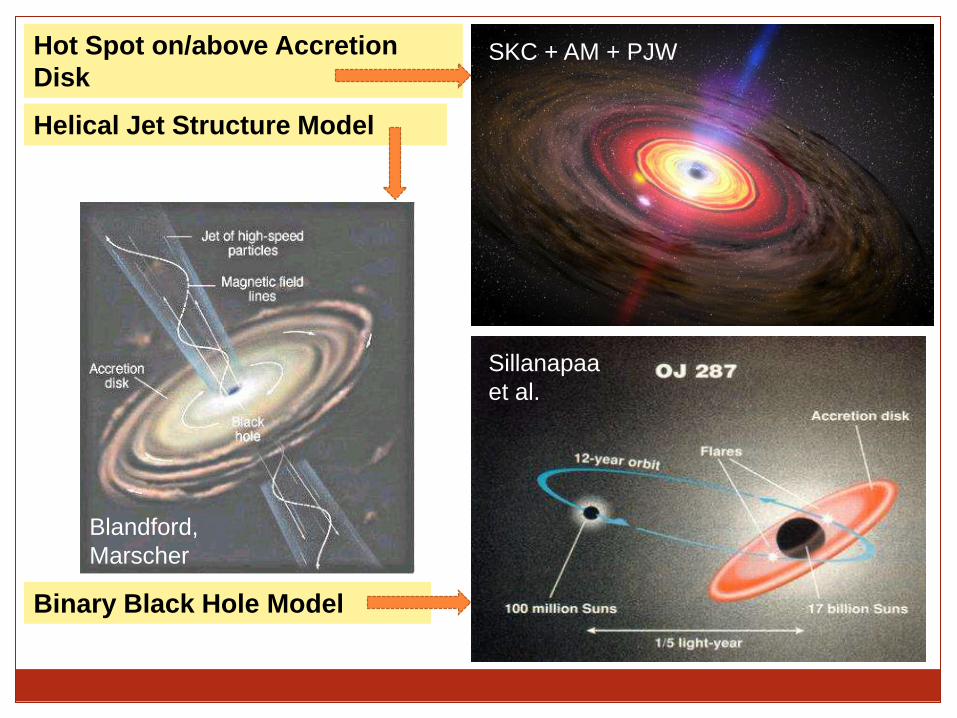
Hot Spot on/above Accretion
Disk
Helical Jet Structure Model
Binary Black Hole Model
SKC + AM + PJW
Blandford,
Marscher
Sillanapaa
et al.

X-ray observations of PKS 2155-304 with XMM-Newton
Gaur, Gupta, Lachowicz & Wiita, 2010, ApJ, 718, 279.
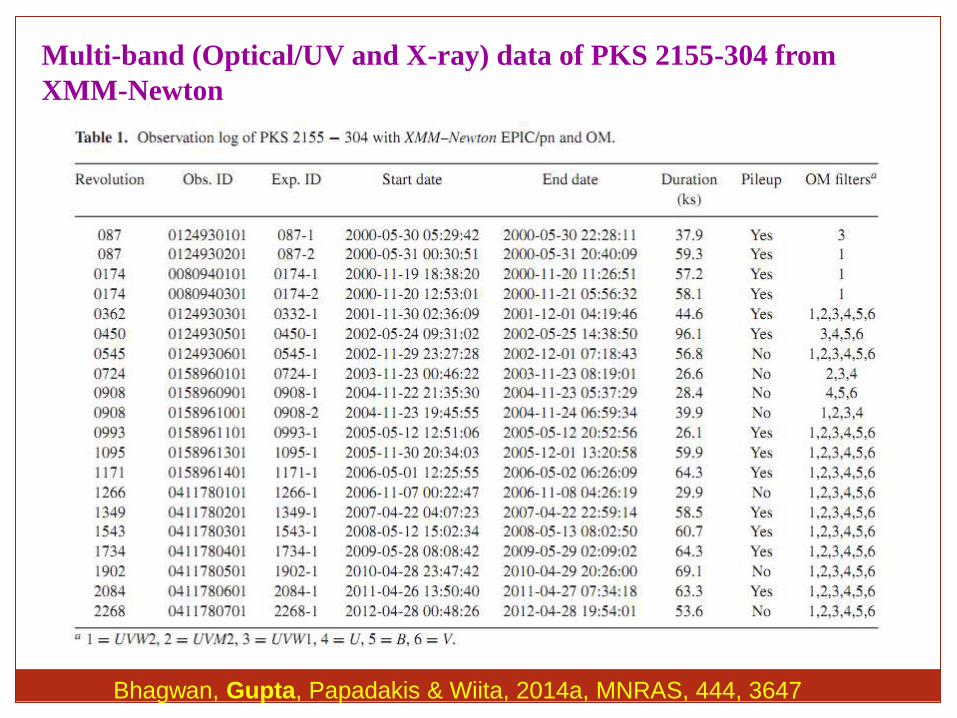
Multi-band (Optical/UV and X-ray) data of PKS 2155-304 from
XMM-Newton
Bhagwan, Gupta, Papadakis & Wiita, 2014a, MNRAS, 444, 3647
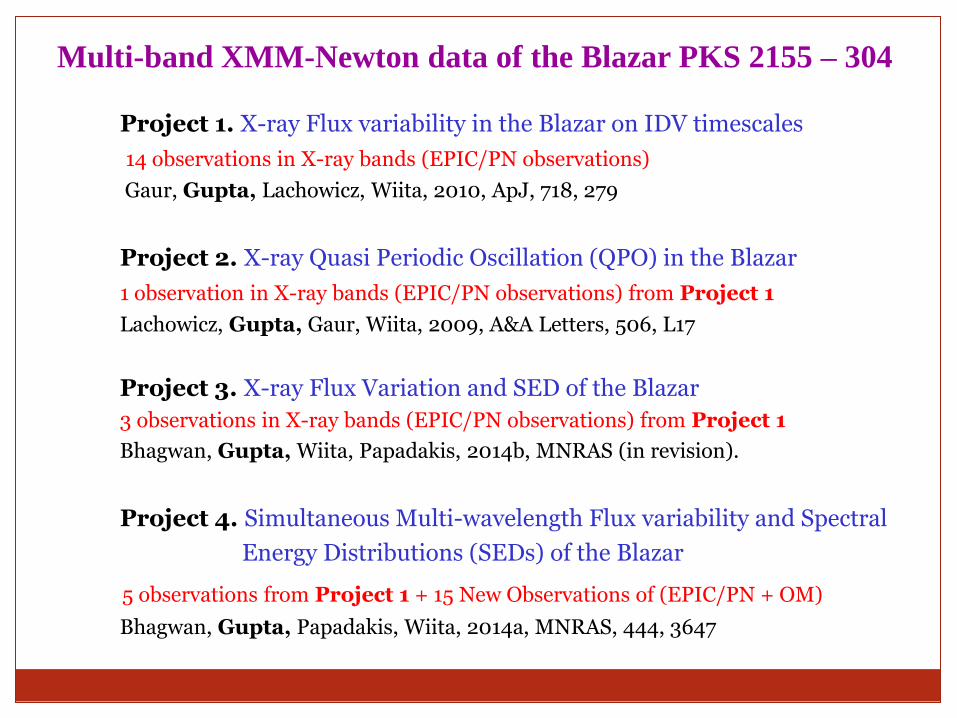
Multi-band XMM-Newton data of the Blazar PKS 2155 – 304
Project 1. X-ray Flux variability in the Blazar on IDV timescales
14 observations in X-ray bands (EPIC/PN observations)
Gaur, Gupta, Lachowicz, Wiita, 2010, ApJ, 718, 279
Project 2. X-ray Quasi Periodic Oscillation (QPO) in the Blazar
1 observation in X-ray bands (EPIC/PN observations) from Project 1
Lachowicz, Gupta, Gaur, Wiita, 2009, A&A Letters, 506, L17
Project 3. X-ray Flux Variation and SED of the Blazar
3 observations in X-ray bands (EPIC/PN observations) from Project 1
Bhagwan, Gupta, Wiita, Papadakis, 2014b, MNRAS (in revision).
Project 4. Simultaneous Multi-wavelength Flux variability and Spectral
Energy Distributions (SEDs) of the Blazar
5 observations from Project 1 + 15 New Observations of (EPIC/PN + OM)
Bhagwan, Gupta, Papadakis, Wiita, 2014a, MNRAS, 444, 3647
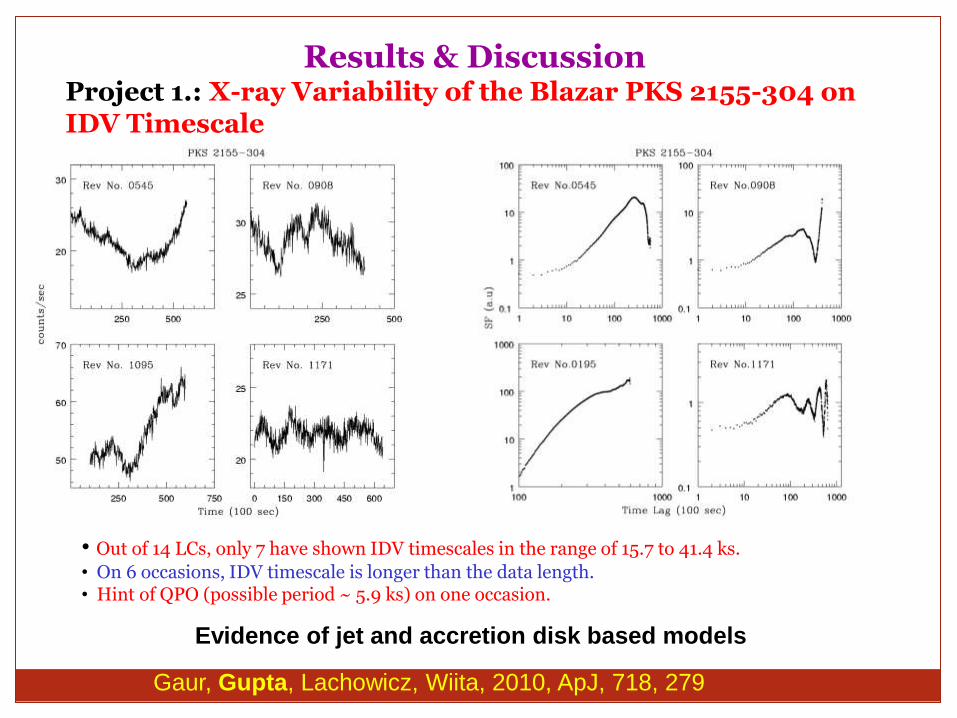
Results & Discussion Project 1.: X-ray Variability of the Blazar PKS 2155-304 on IDV Timescale
Evidence of jet and accretion disk based models
Gaur, Gupta, Lachowicz, Wiita, 2010, ApJ, 718, 279
• Out of 14 LCs, only 7 have shown IDV timescales in the range of 15.7 to 41.4 ks.
• On 6 occasions, IDV timescale is longer than the data length. • Hint of QPO (possible period ~ 5.9 ks) on one occasion.
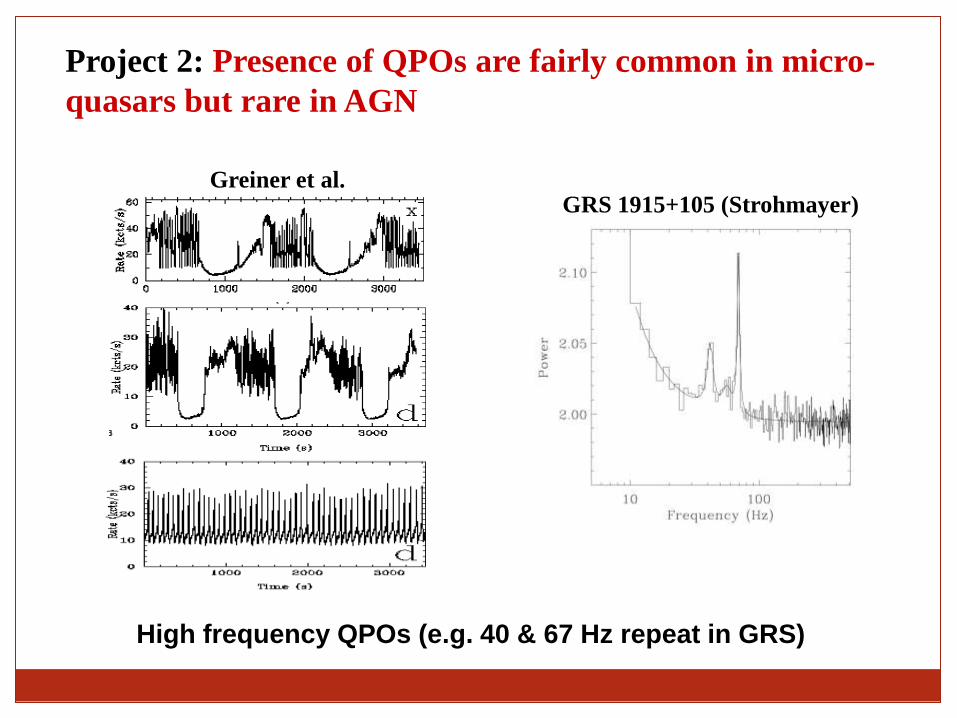
Project 2: Presence of QPOs are fairly common in micro-
quasars but rare in AGN
GRS 1915+105 (Strohmayer) Greiner et al.
High frequency QPOs (e.g. 40 & 67 Hz repeat in GRS)
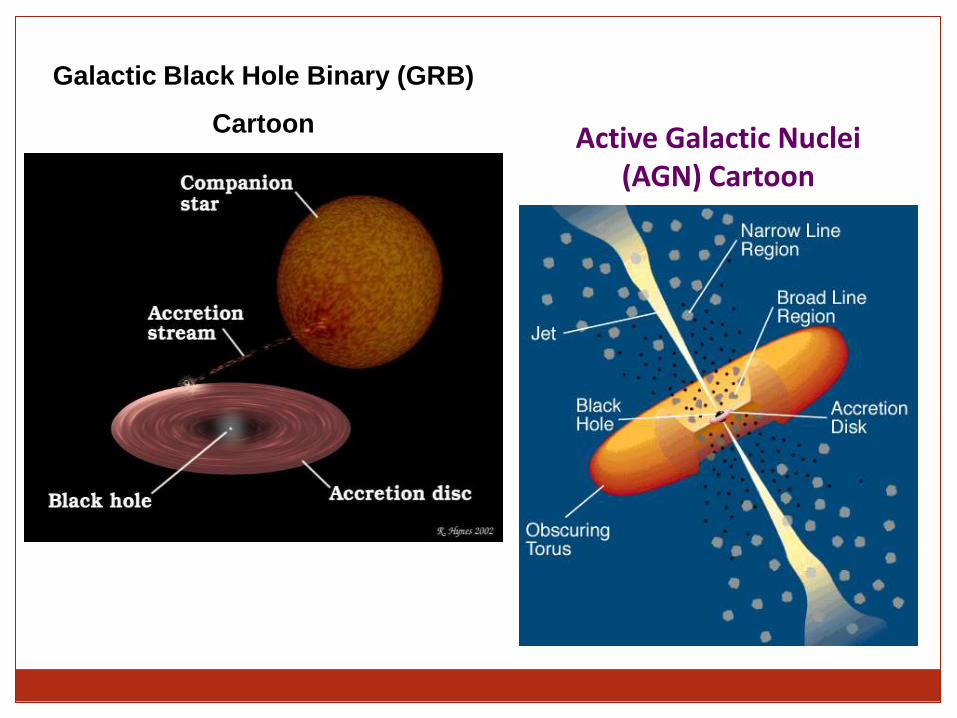
Galactic Black Hole Binary (GRB)
Cartoon Active Galactic Nuclei (AGN) Cartoon
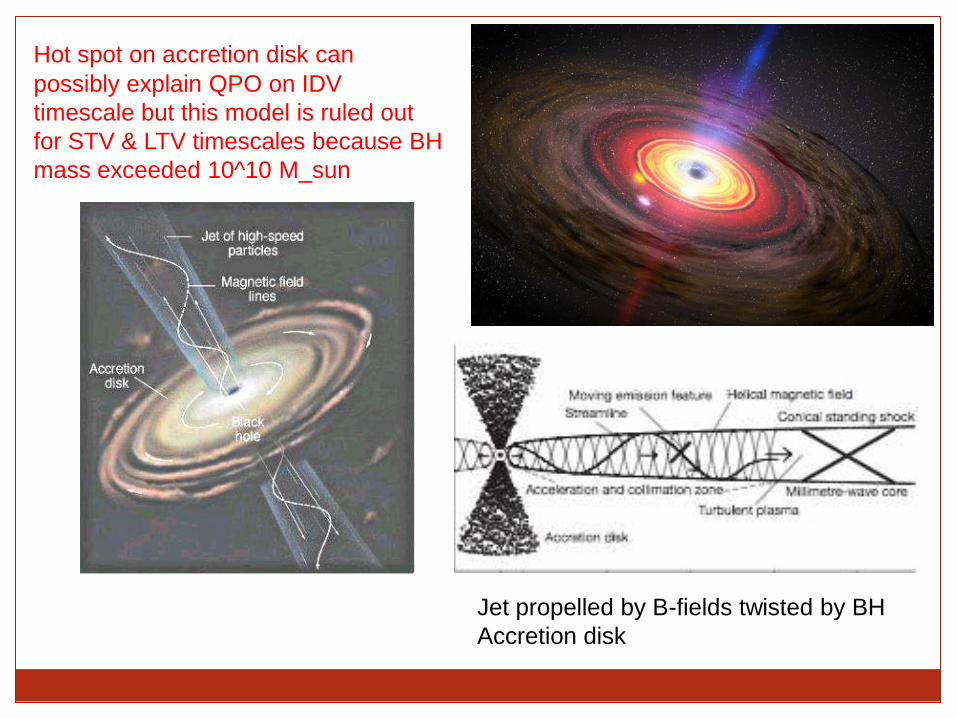
Jet propelled by B-fields twisted by BH
Accretion disk
Hot spot on accretion disk can possibly explain QPO on IDV
timescale but this model is ruled out
for STV & LTV timescales because BH
mass exceeded 10^10 M_sun
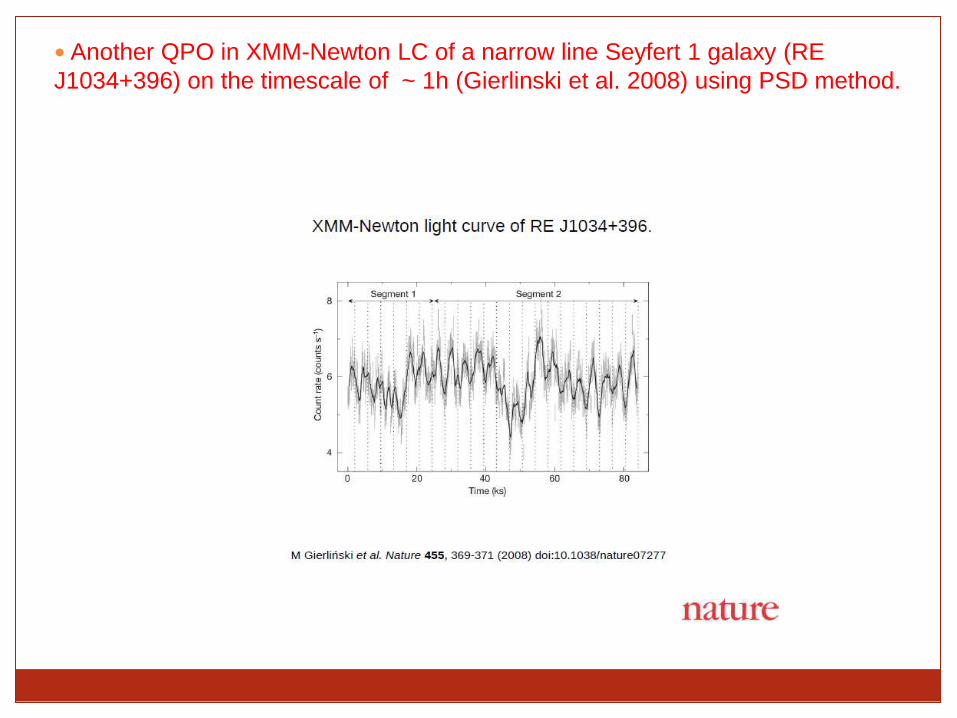
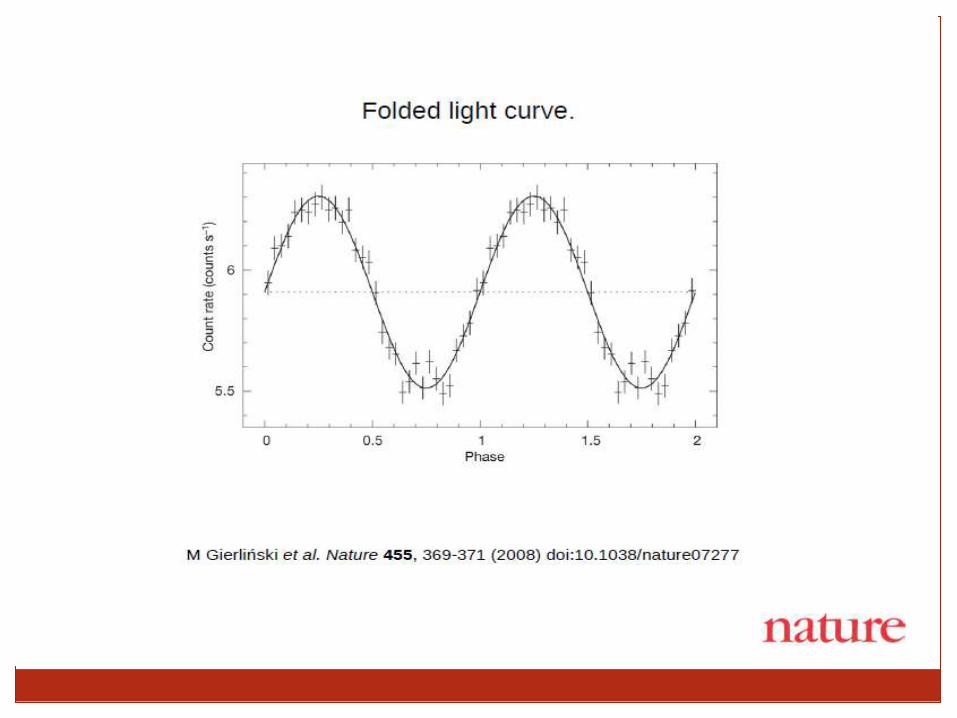
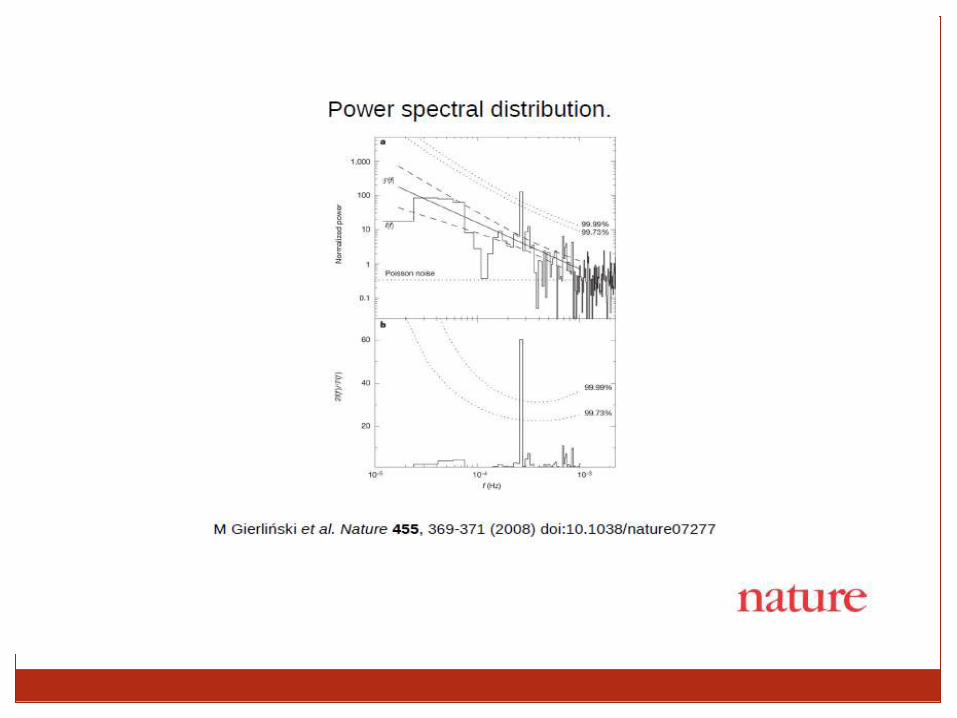
Another QPO in XMM-Newton LC of a narrow line Seyfert 1 galaxy (RE
J1034+396) on the timescale of ~ 1h (Gierlinski et al. 2008) using PSD method.
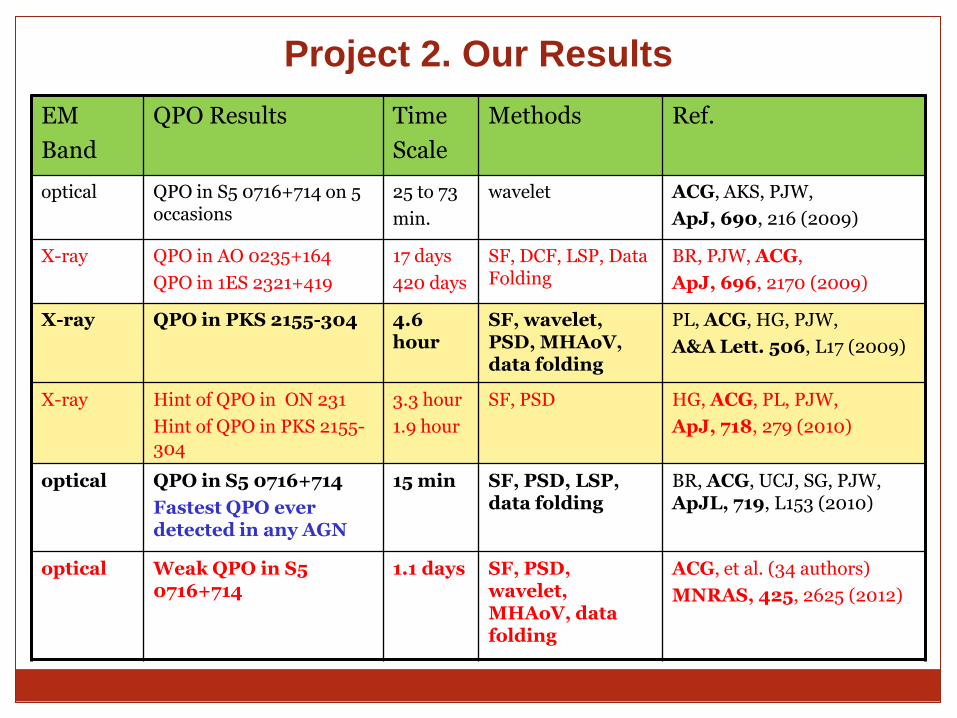
EM
Band
QPO Results Time
Scale
Methods Ref.
optical QPO in S5 0716+714 on 5 occasions
25 to 73
min.
wavelet ACG, AKS, PJW,
ApJ, 690, 216 (2009)
X-ray QPO in AO 0235+164
QPO in 1ES 2321+419
17 days
420 days
SF, DCF, LSP, Data Folding
BR, PJW, ACG,
ApJ, 696, 2170 (2009)
X-ray QPO in PKS 2155-304 4.6 hour
SF, wavelet, PSD, MHAoV, data folding
PL, ACG, HG, PJW,
A&A Lett. 506, L17 (2009)
X-ray Hint of QPO in ON 231
Hint of QPO in PKS 2155-304
3.3 hour
1.9 hour
SF, PSD HG, ACG, PL, PJW,
ApJ, 718, 279 (2010)
optical QPO in S5 0716+714
Fastest QPO ever detected in any AGN
15 min SF, PSD, LSP, data folding
BR, ACG, UCJ, SG, PJW, ApJL, 719, L153 (2010)
optical Weak QPO in S5 0716+714
1.1 days SF, PSD, wavelet, MHAoV, data folding
ACG, et al. (34 authors)
MNRAS, 425, 2625 (2012)
Project 2. Our Results
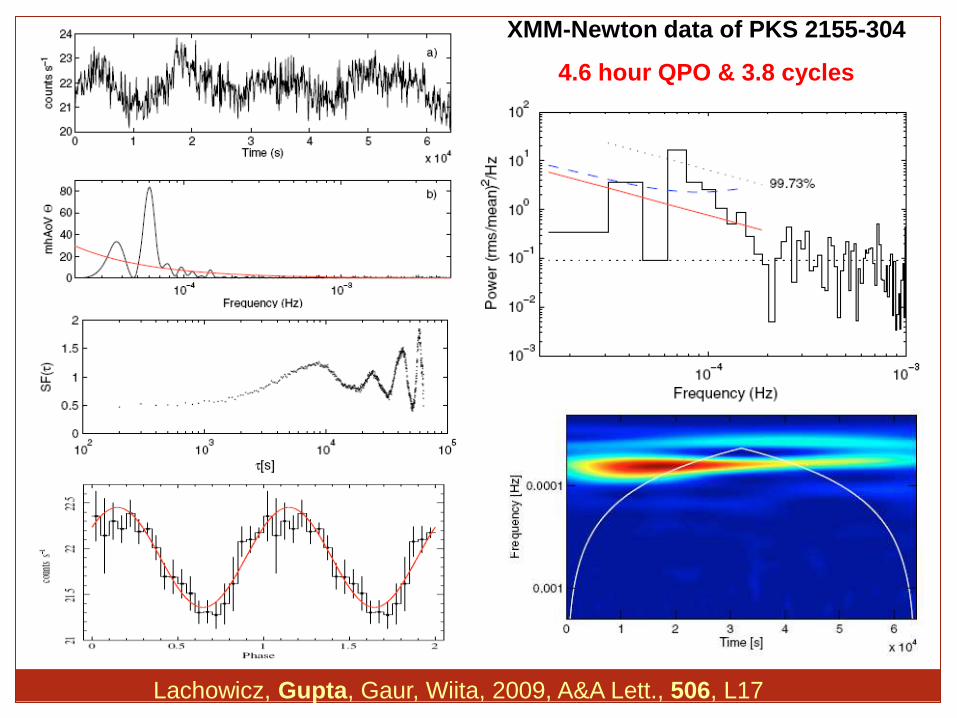
XMM-Newton data of PKS 2155-304
4.6 hour QPO & 3.8 cycles
Lachowicz, Gupta, Gaur, Wiita, 2009, A&A Lett., 506, L17
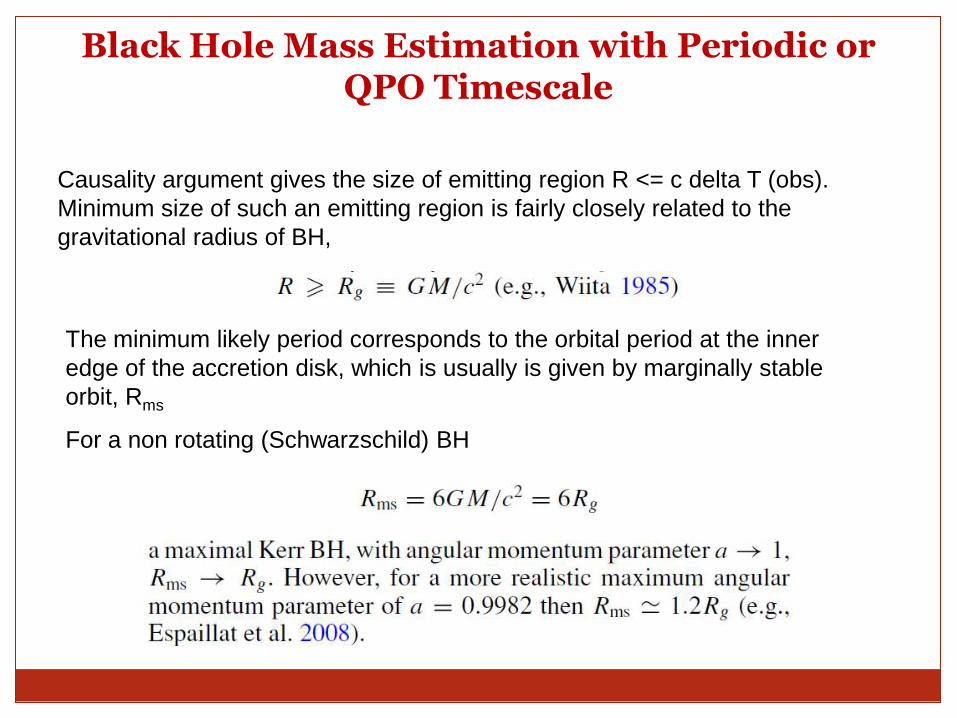
Black Hole Mass Estimation with Periodic or QPO Timescale
Causality argument gives the size of emitting region R <= c delta T (obs).
Minimum size of such an emitting region is fairly closely related to the
gravitational radius of BH,
The minimum likely period corresponds to the orbital period at the inner
edge of the accretion disk, which is usually is given by marginally stable
orbit, Rms
For a non rotating (Schwarzschild) BH
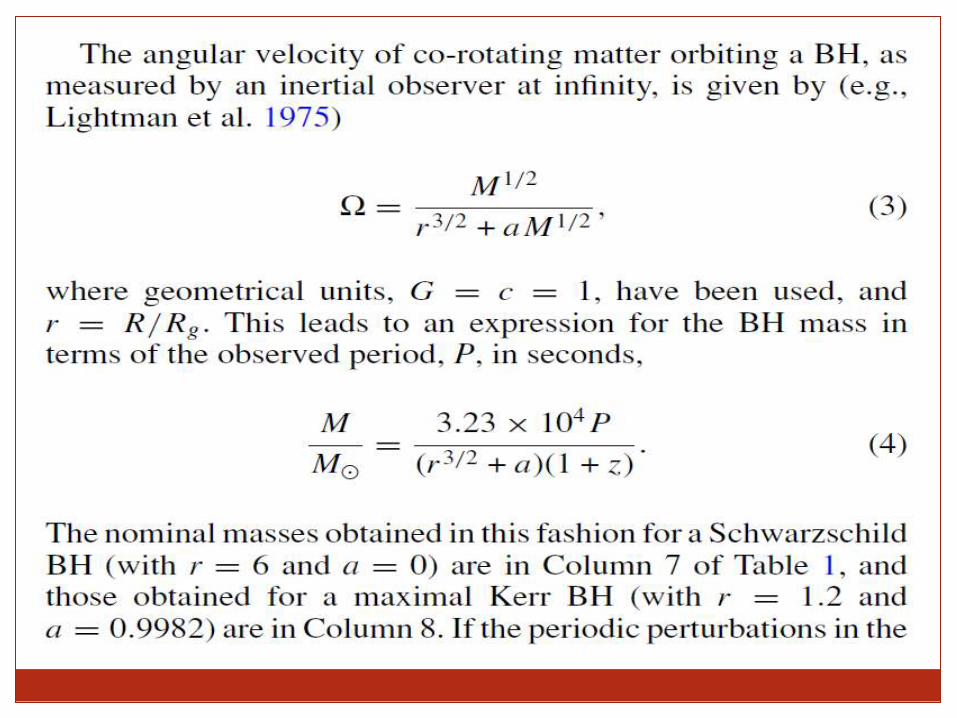
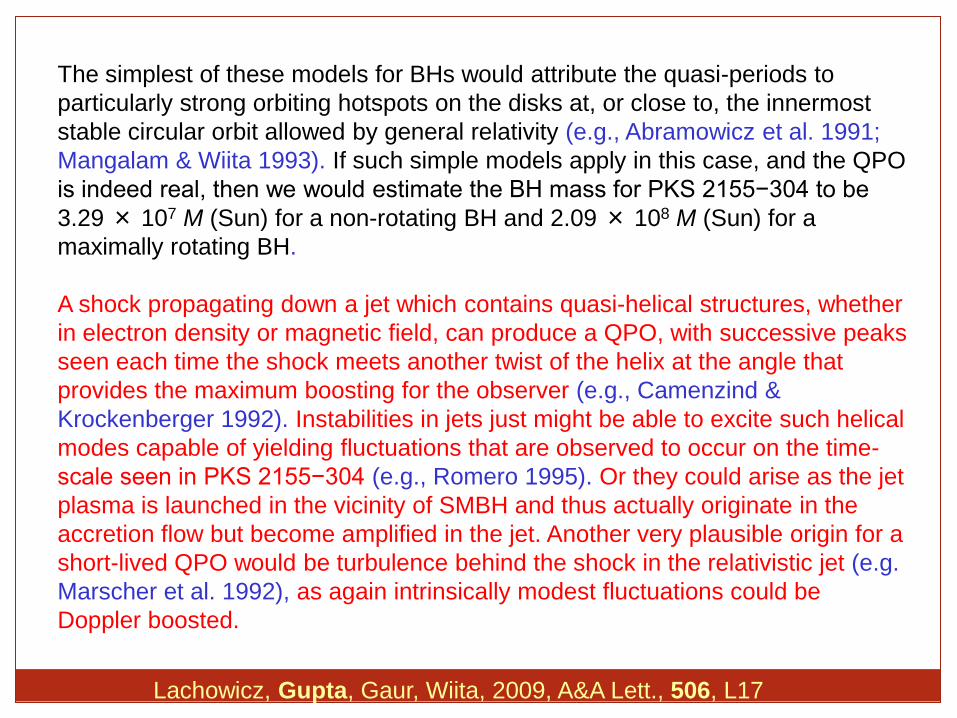
The simplest of these models for BHs would attribute the quasi-periods to
particularly strong orbiting hotspots on the disks at, or close to, the innermost
stable circular orbit allowed by general relativity (e.g., Abramowicz et al. 1991;
Mangalam & Wiita 1993). If such simple models apply in this case, and the QPO
is indeed real, then we would estimate the BH mass for PKS 2155−304 to be
3.29 × 10⁷ M (Sun) for a non-rotating BH and 2.09 × 10⁸ M (Sun) for a
maximally rotating BH.
A shock propagating down a jet which contains quasi-helical structures, whether
in electron density or magnetic field, can produce a QPO, with successive peaks
seen each time the shock meets another twist of the helix at the angle that
provides the maximum boosting for the observer (e.g., Camenzind &
Krockenberger 1992). Instabilities in jets just might be able to excite such helical
modes capable of yielding fluctuations that are observed to occur on the time-
scale seen in PKS 2155−304 (e.g., Romero 1995). Or they could arise as the jet
plasma is launched in the vicinity of SMBH and thus actually originate in the
accretion flow but become amplified in the jet. Another very plausible origin for a
short-lived QPO would be turbulence behind the shock in the relativistic jet (e.g.
Marscher et al. 1992), as again intrinsically modest fluctuations could be
Doppler boosted.
Lachowicz, Gupta, Gaur, Wiita, 2009, A&A Lett., 506, L17
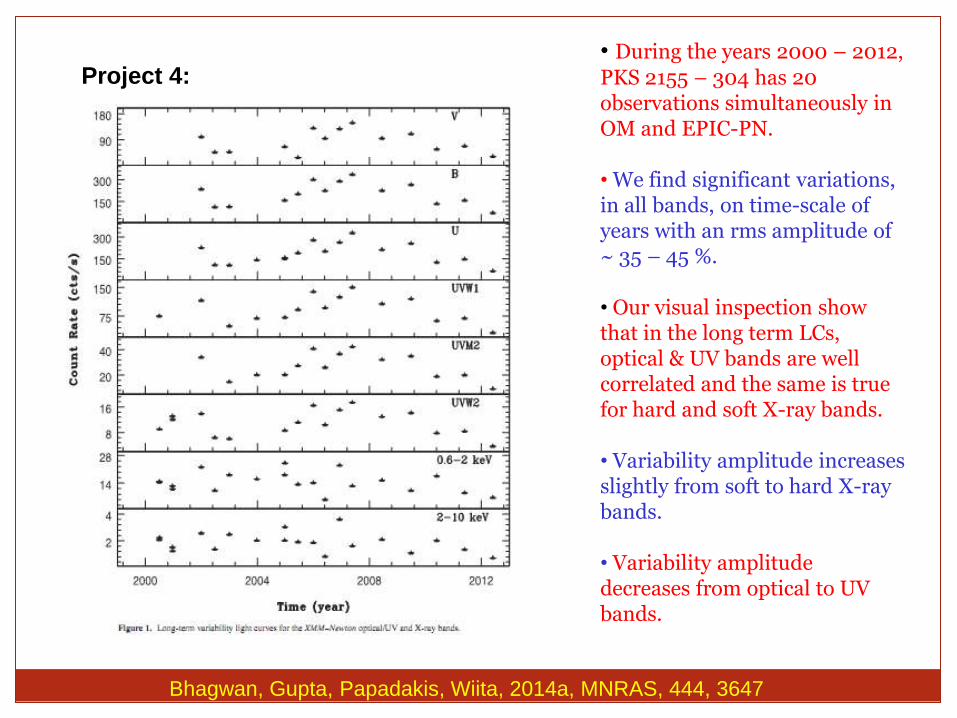
• During the years 2000 – 2012,
PKS 2155 – 304 has 20 observations simultaneously in OM and EPIC-PN. • We find significant variations, in all bands, on time-scale of years with an rms amplitude of ~ 35 – 45 %. • Our visual inspection show that in the long term LCs, optical & UV bands are well correlated and the same is true for hard and soft X-ray bands. • Variability amplitude increases slightly from soft to hard X-ray bands. • Variability amplitude decreases from optical to UV bands.
Project 4:
Bhagwan, Gupta, Papadakis, Wiita, 2014a, MNRAS, 444, 3647
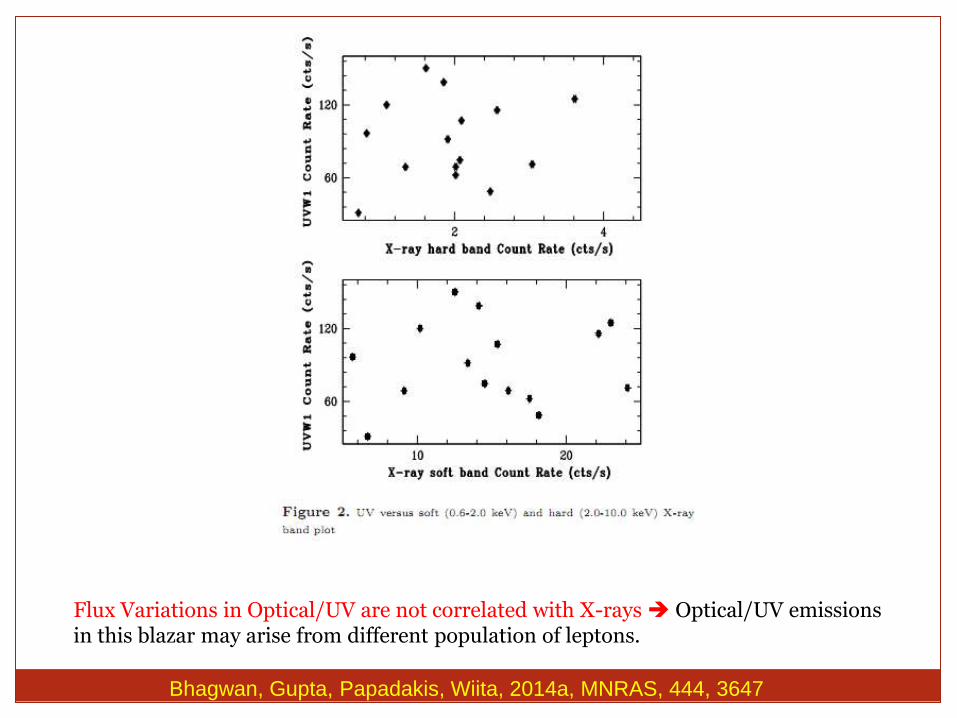
Bhagwan, Gupta, Papadakis, Wiita, 2014a, MNRAS, 444, 3647
Flux Variations in Optical/UV are not correlated with X-rays Optical/UV emissions in this blazar may arise from different population of leptons.
Bhagwan, Gupta, Papadakis, Wiita, 2014a, MNRAS, 444, 3647
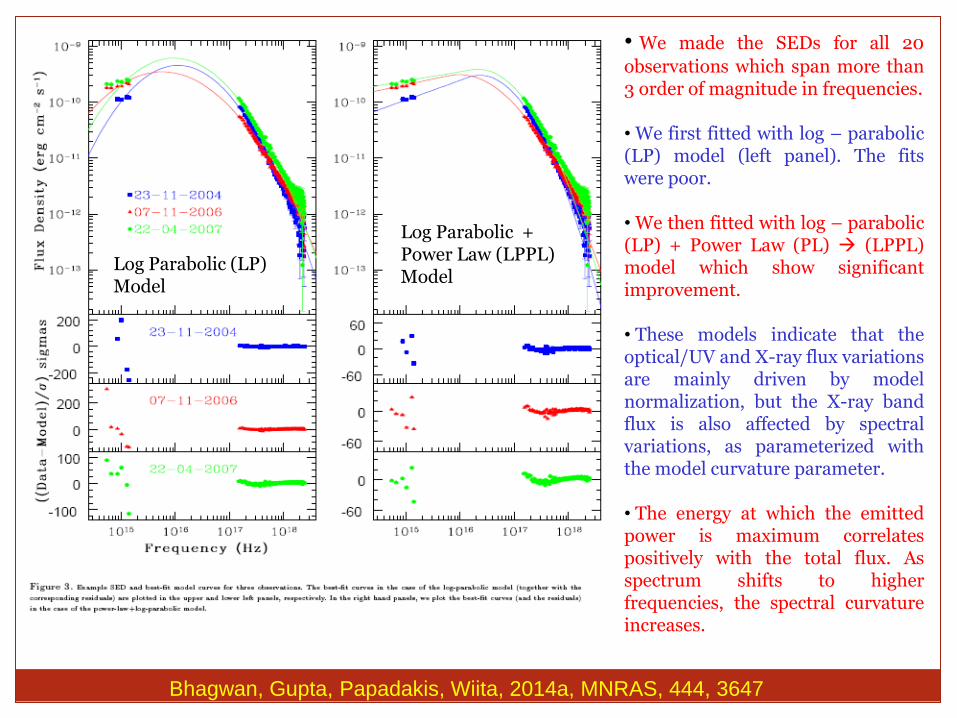
Log Parabolic (LP) Model
Log Parabolic + Power Law (LPPL) Model
• We made the SEDs for all 20
observations which span more than 3 order of magnitude in frequencies. • We first fitted with log – parabolic (LP) model (left panel). The fits were poor. • We then fitted with log – parabolic (LP) + Power Law (PL) (LPPL) model which show significant improvement. • These models indicate that the optical/UV and X-ray flux variations are mainly driven by model normalization, but the X-ray band flux is also affected by spectral variations, as parameterized with the model curvature parameter. • The energy at which the emitted power is maximum correlates positively with the total flux. As spectrum shifts to higher frequencies, the spectral curvature increases.
Bhagwan, Gupta, Papadakis, Wiita, 2014a, MNRAS, 444, 3647
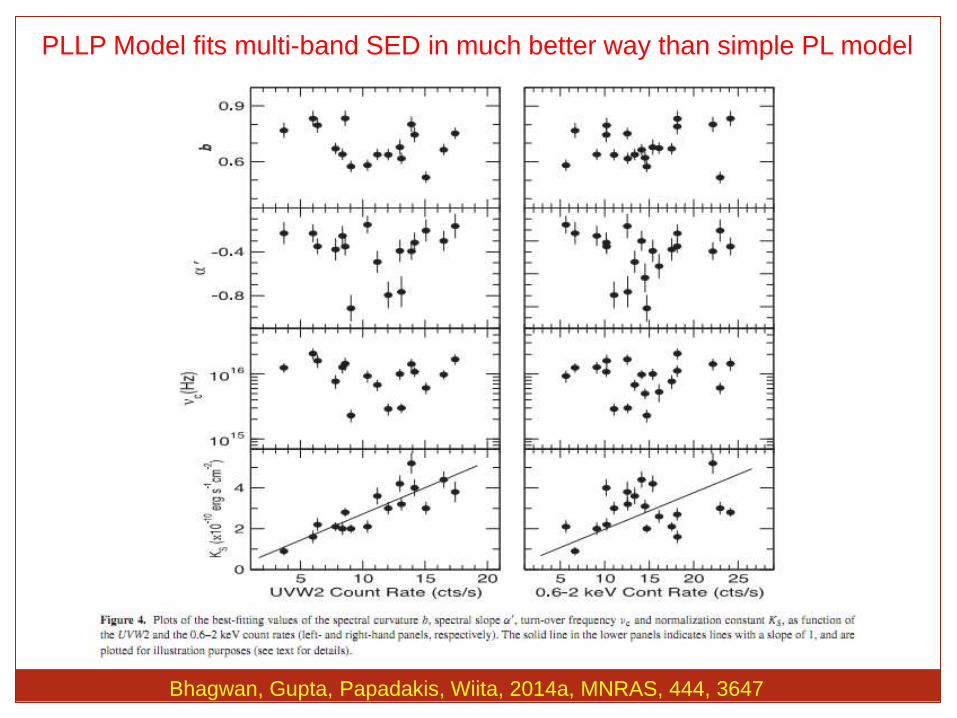
PLLP Model fits multi-band SED in much better way than simple PL model
Bhagwan, Gupta, Papadakis, Wiita, 2014a, MNRAS, 444, 3647
Bhagwan, Gupta, Papadakis, Wiita, 2014a, MNRAS, 444, 3647
Evidence of jet and accretion disk based models
Bhagwan, Gupta, Wiita, Papadakis 2014b, MNRAS, (in revision)
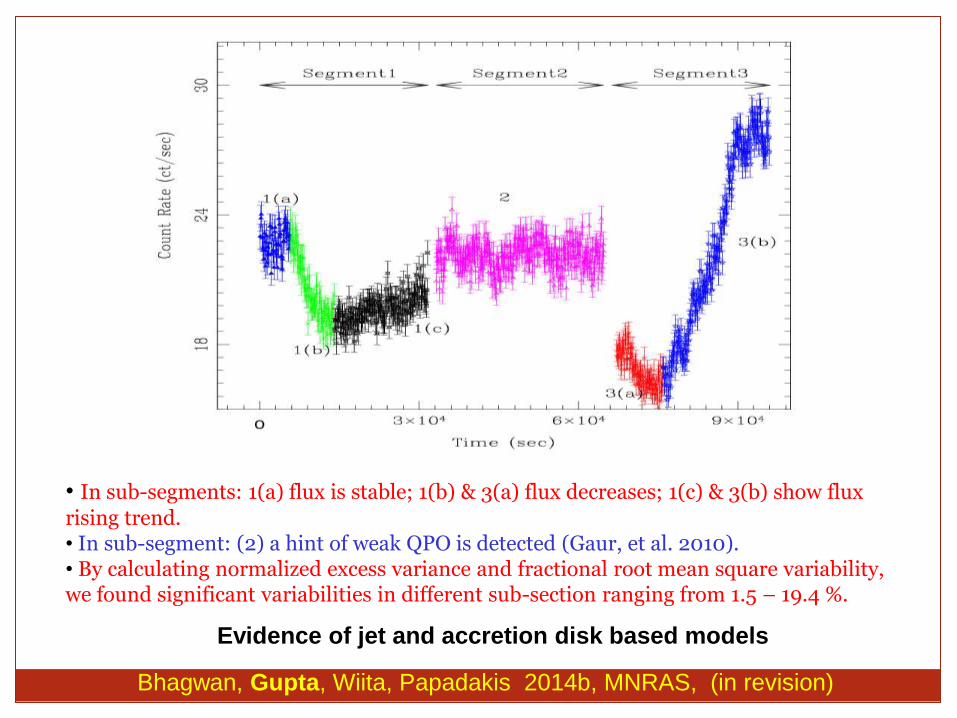
• In sub-segments: 1(a) flux is stable; 1(b) & 3(a) flux decreases; 1(c) & 3(b) show flux
rising trend. • In sub-segment: (2) a hint of weak QPO is detected (Gaur, et al. 2010). • By calculating normalized excess variance and fractional root mean square variability, we found significant variabilities in different sub-section ranging from 1.5 – 19.4 %.
Bhagwan, Gupta, Wiita, Papadakis, 2014b, MNRAS, (in revision)
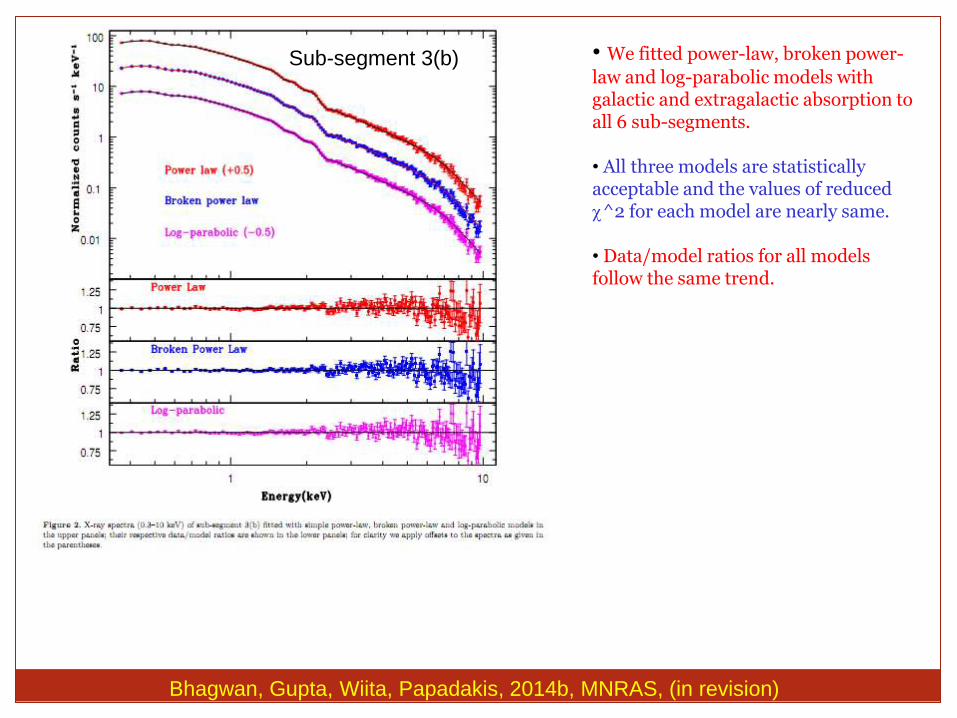
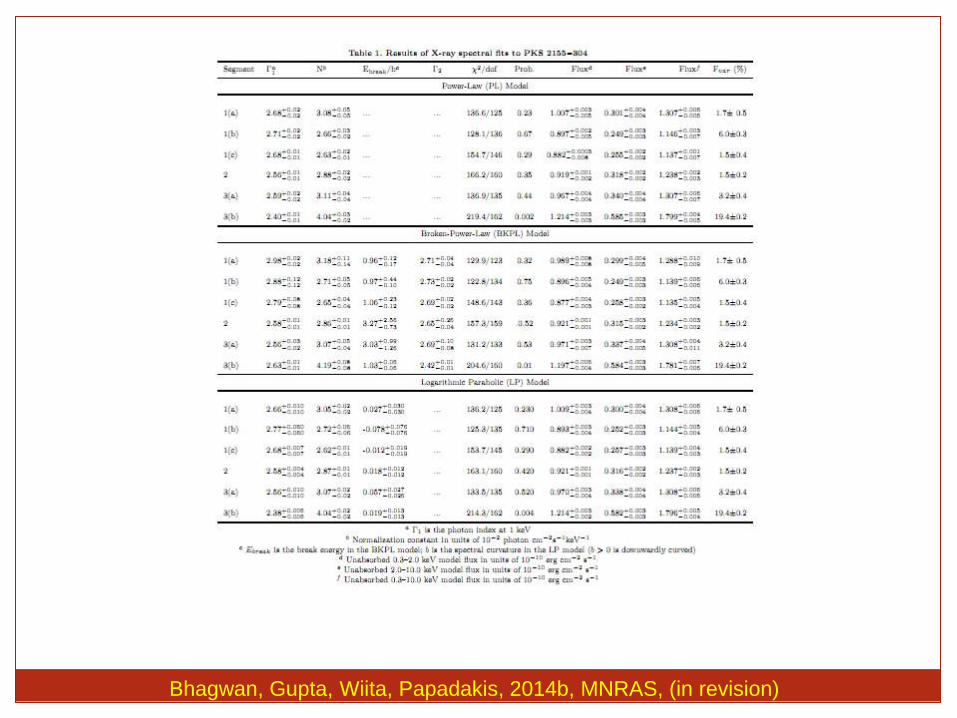
• We fitted power-law, broken power-
law and log-parabolic models with galactic and extragalactic absorption to all 6 sub-segments. • All three models are statistically acceptable and the values of reduced ^2 for each model are nearly same. • Data/model ratios for all models follow the same trend.
Sub-segment 3(b)
Bhagwan, Gupta, Wiita, Papadakis, 2014b, MNRAS, (in revision)
Bhagwan, Gupta, Wiita, Papadakis, 2014b, MNRAS, (in revision)
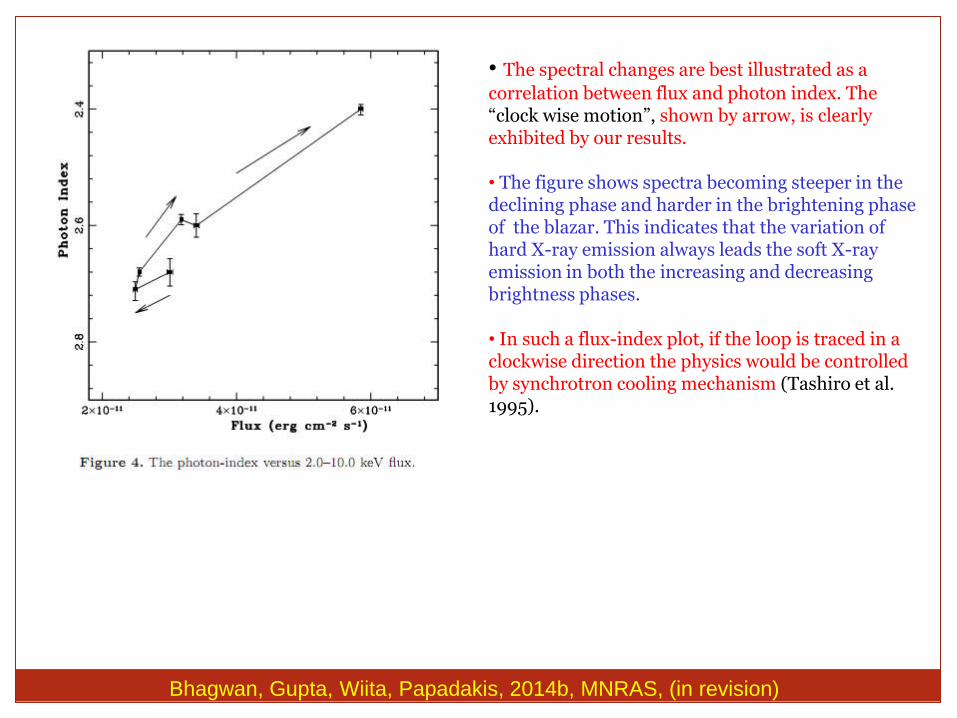
• The spectral changes are best illustrated as a
correlation between flux and photon index. The “clock wise motion”, shown by arrow, is clearly exhibited by our results. • The figure shows spectra becoming steeper in the declining phase and harder in the brightening phase of the blazar. This indicates that the variation of hard X-ray emission always leads the soft X-ray emission in both the increasing and decreasing brightness phases. • In such a flux-index plot, if the loop is traced in a clockwise direction the physics would be controlled by synchrotron cooling mechanism (Tashiro et al. 1995).
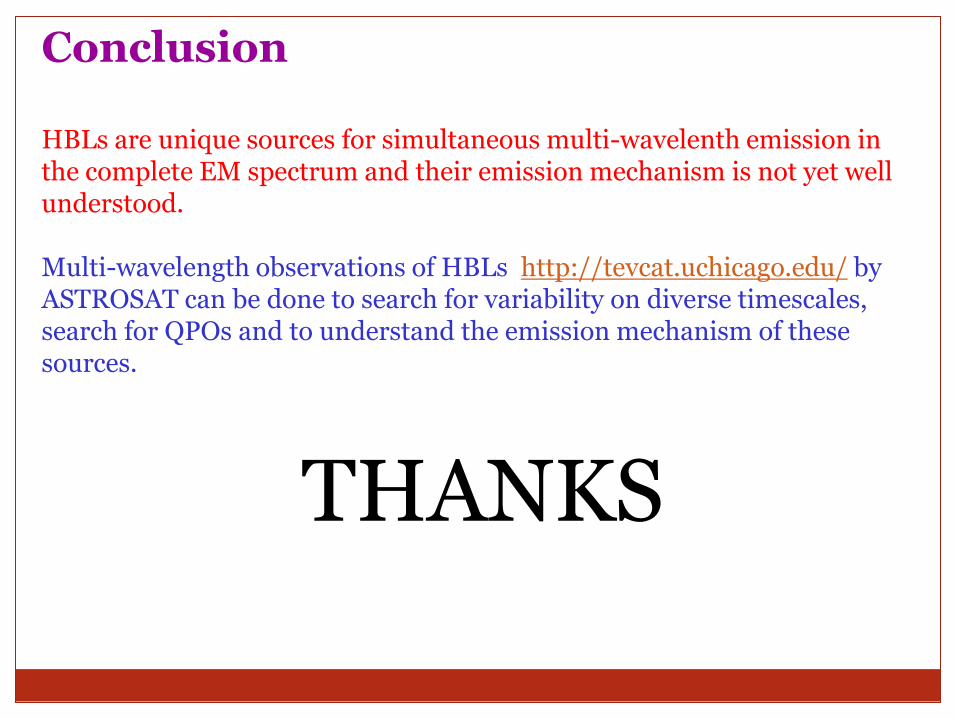
Why HBLs are potential candidates for ASTROSAT?
Revolution due to Fermi and recent development in VHE Gamma-rays
(GeV - TeV) facilities
HESS High Energy Stereoscopic
System
Other similar facilities
MAGIC (Europe); VERITAS (USA);
CANGAROO (JAPAN &
AUSTRALIA) ; TACTIC, HAGAR
MACE (upcoming in India)
Till 2005 no. of HBLs known 6
Till 2014 no. of HBLs known 44
HESS Telescope in Namibia; 37 institutes, 12 countries and about 200
scientists upcoming HESS II, CTA
Conclusion HBLs are unique sources for simultaneous multi-wavelenth emission in the complete EM spectrum and their emission mechanism is not yet well understood. Multi-wavelength observations of HBLs http://tevcat.uchicago.edu/ by ASTROSAT can be done to search for variability on diverse timescales, search for QPOs and to understand the emission mechanism of these sources.
THANKS

![Journal of Allergy & Therapy · ISSN:2155-6121 JAT an open access journal Volume 5 Issue 5 1000187 ... aged skin, xerosis, rosacea, and acne [1–5]. Many of these ... lipid bilayer,](https://static.fdocument.org/doc/165x107/5cacbed588c993d4278cc386/journal-of-allergy-therapy-issn2155-6121-jat-an-open-access-journal-volume.jpg)


![2.1 Prediktor Kategorik dan Uji di regresi logistik PKS/5... · 2016-08-30 · / v ] , ] o ~ o v i µ v +lsrwhvlv xqwxn nhehedvdq dqwdud ³$=7 wuhdwphqw´ gdq ³ghyhorsphqwri $,'6](https://static.fdocument.org/doc/165x107/5e76334f1229895610472027/21-prediktor-kategorik-dan-uji-di-regresi-logistik-pks5-2016-08-30-v.jpg)