Module 13: Normal Distributionsbiostatcourse.fiu.edu/PDFSlides/Module13.pdf · 13 - 1 Module 13:...
26
13 - 1 Module 13: Normal Distributions This module focuses on the normal distribution and how to use it. Reviewed 05 May 05/ MODULE 13
Transcript of Module 13: Normal Distributionsbiostatcourse.fiu.edu/PDFSlides/Module13.pdf · 13 - 1 Module 13:...
13 - 1
Module 13: Normal Distributions
This module focuses on the normal distribution and how to use it.
Reviewed 05 May 05/ MODULE 13
13 - 2
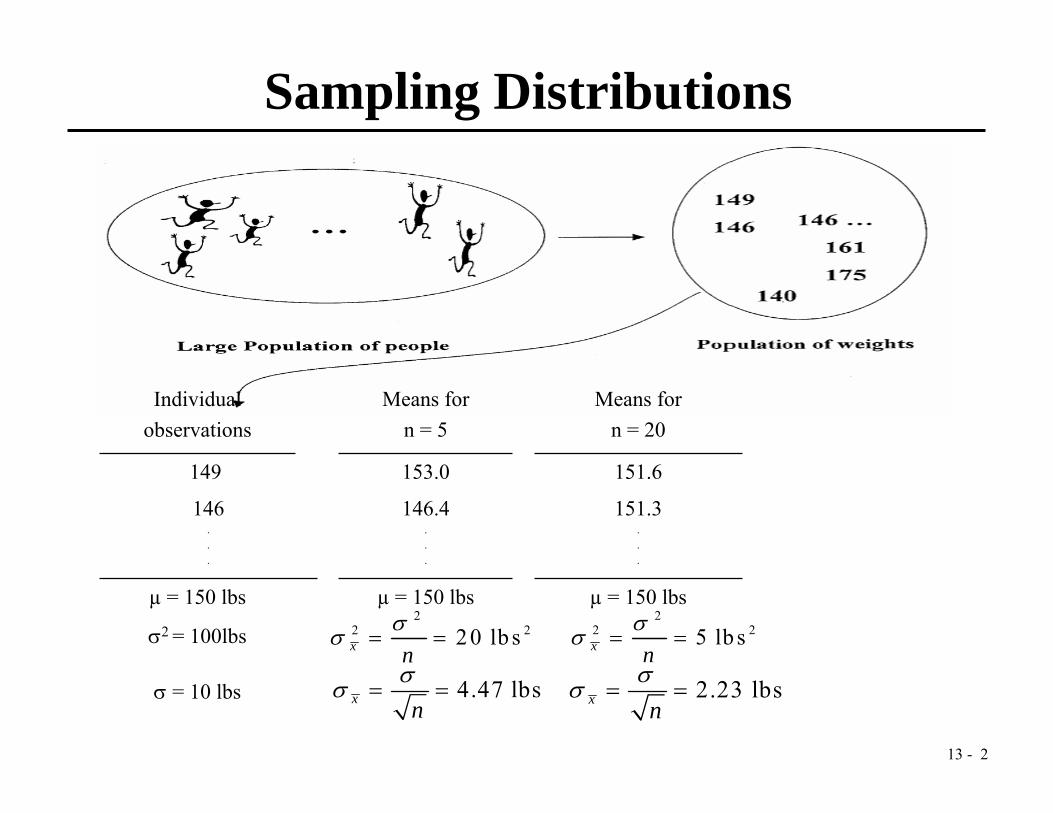
Sampling Distributions
σ = 10 lbs
σ2 = 100lbs
µ = 150 lbsµ = 150 lbsµ = 150 lbs
151.3...
146.4...
146...
151.6153.0149
Means for n = 20
Means forn = 5
Individual observations
22 220 lbsx n
σσ = =2
2 25 lb sx nσσ = =
4.47 lbsx nσσ = = 2.23 lbsx n
σσ = =
13 - 3
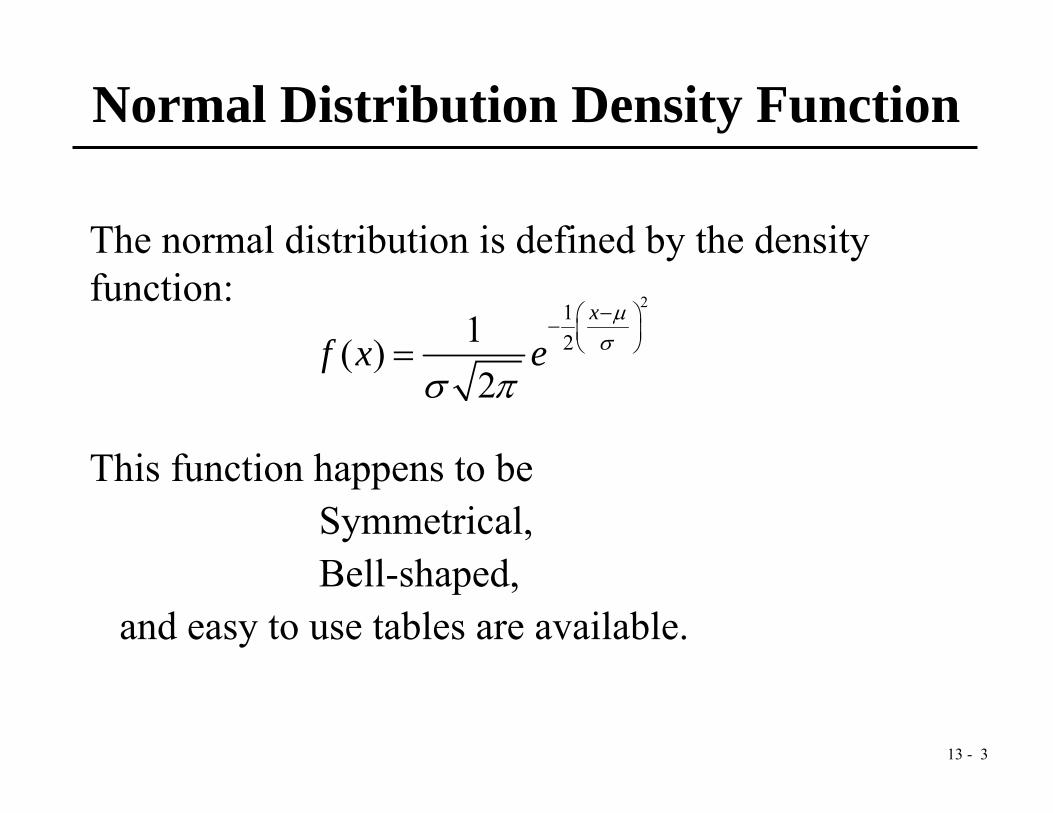
The normal distribution is defined by the density function:
This function happens to be Symmetrical, Bell-shaped,
and easy to use tables are available.
2121( )
2
x
f x eμ
σ
σ π
−⎛ ⎞− ⎜ ⎟⎝ ⎠=
Normal Distribution Density Function
13 - 4
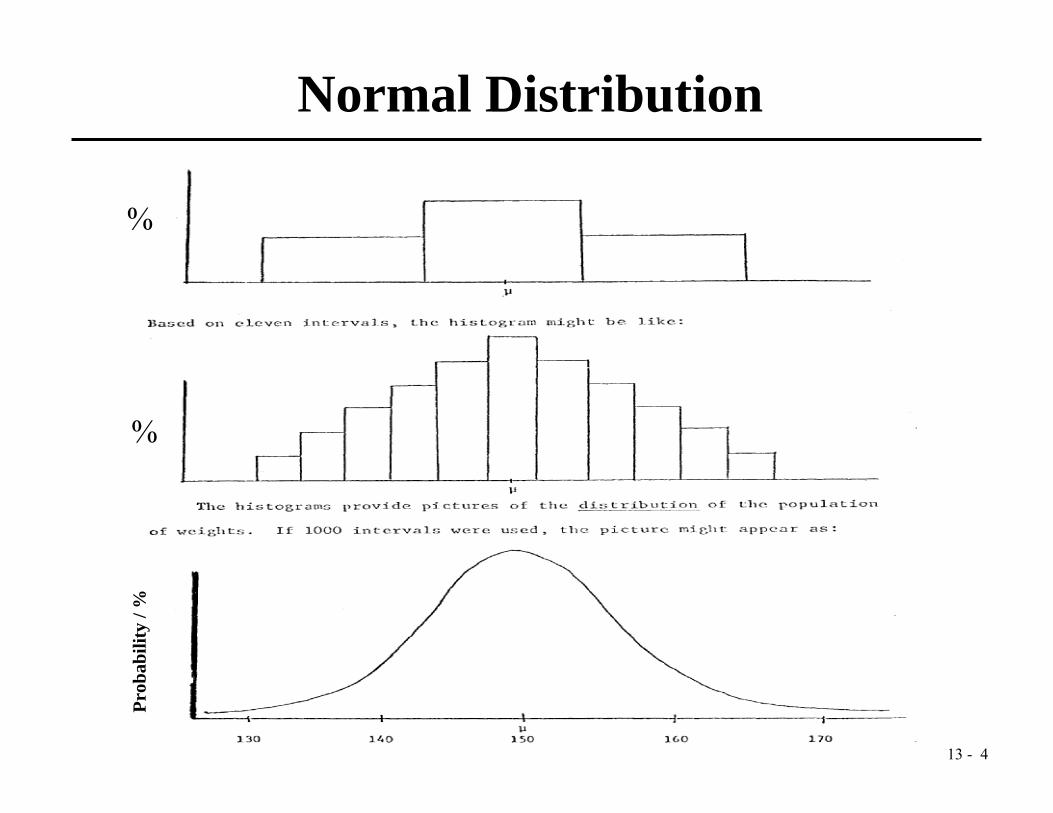
%
%
Prob
abili
ty /
%
Normal Distribution
13 - 5
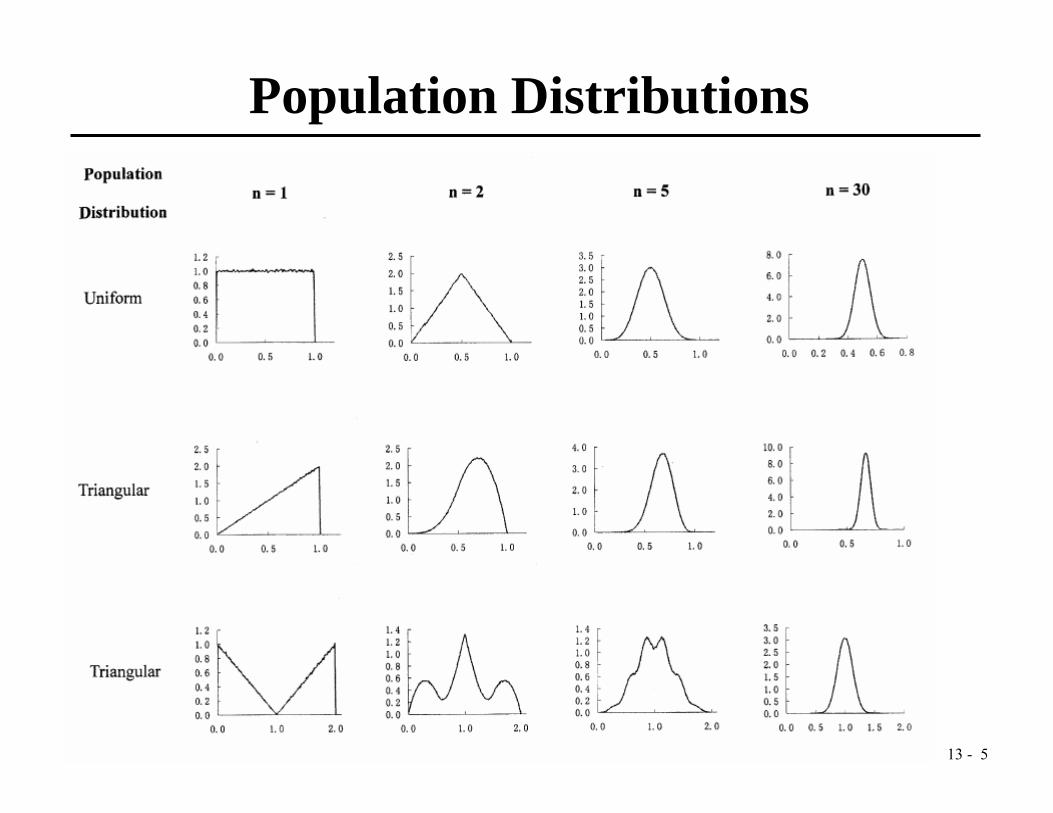
Population Distributions

13 - 6
Population Distributions
13 - 7
We can use the normal tables to obtain probabilities for measurements for which this frequency distribution is appropriate. For a reasonably complete set of probabilities, see TABLE MODULE 1: NORMAL TABLE.
This module provides most of the z-values and associated probabilities you are likely to use; however, it also provides instructions demonstrating how to calculate those not included directly in the table.
Using the Normal Tables
13 - 8
Normal Tables (contd.)
The table is a series of columns containing numbers for z and for P(z). The z represents the z-value for a normal distribution and P(z) represents the area under the normal curve to the left of that z-value for a normal distribution with mean µ = 0 and standard deviation σ = 1.
13 - 9
Using the Normal Tables
Z
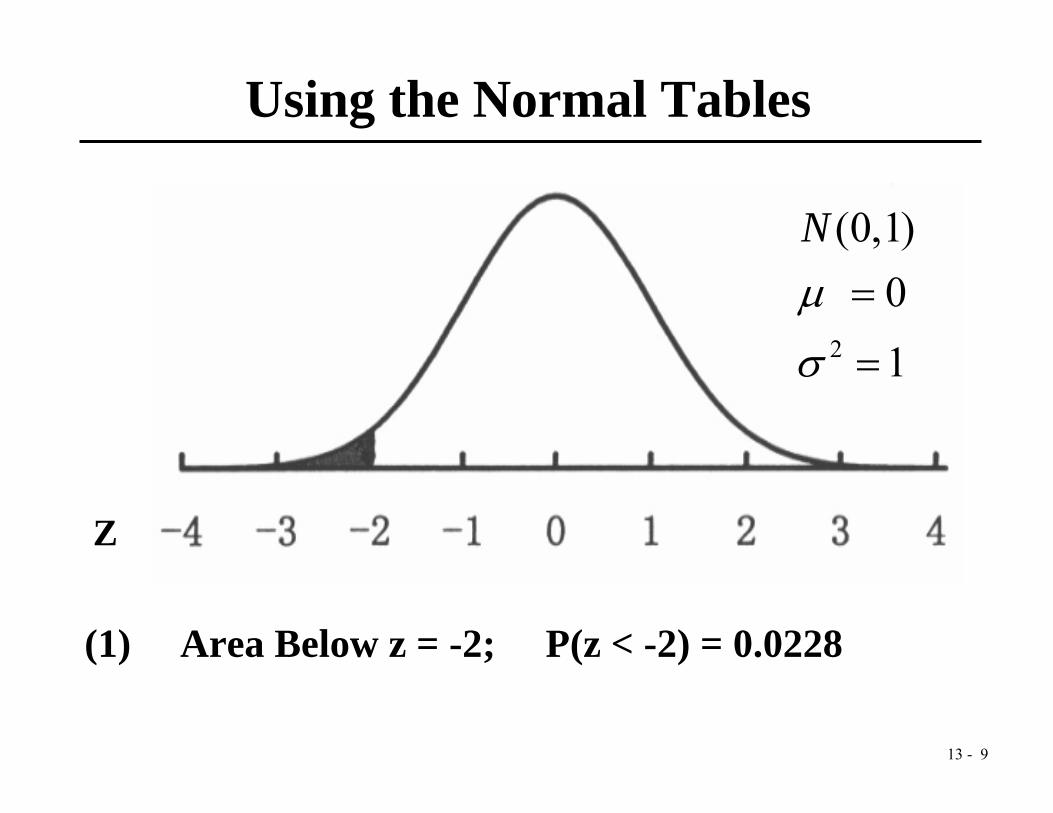
(1) Area Below z = -2; P(z < -2) = 0.0228
2
(0,1)01
Nμ
σ
=
=
13 - 10
Using the Normal Tables
Z
2
(0,1)01
Nμ
σ
=
=
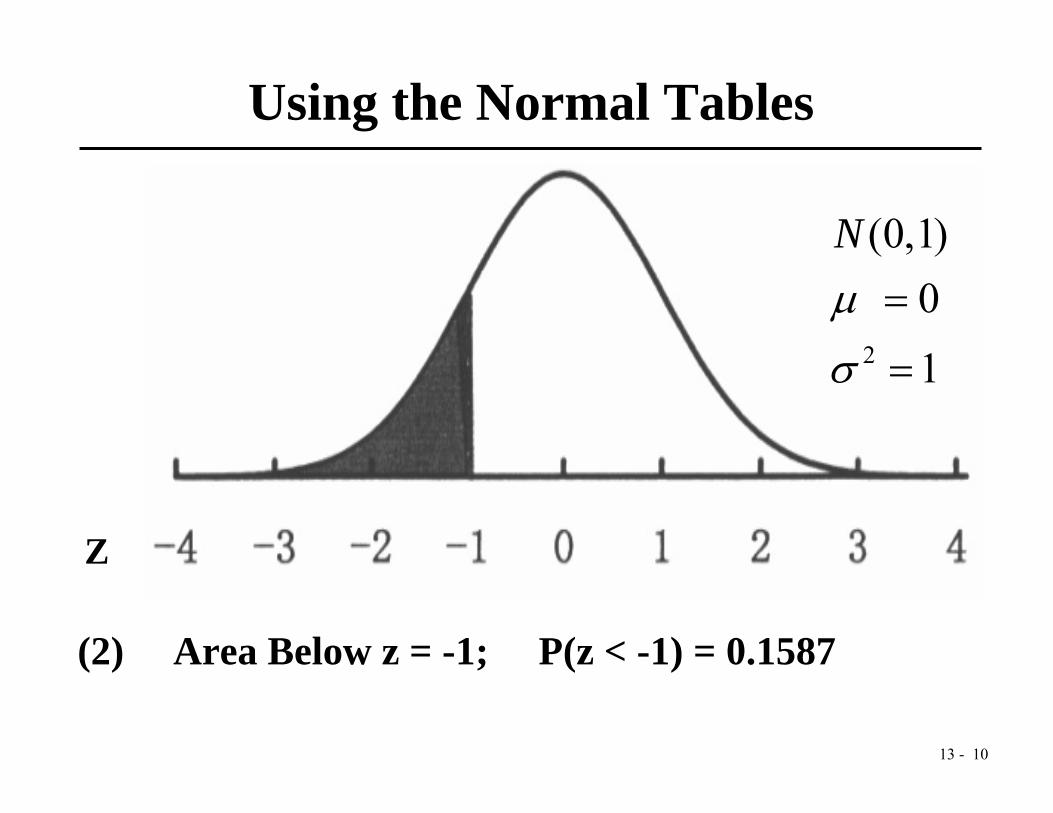
(2) Area Below z = -1; P(z < -1) = 0.1587
13 - 11
Using the Normal Tables
Z
2
(0,1)01
Nμ
σ
=
=
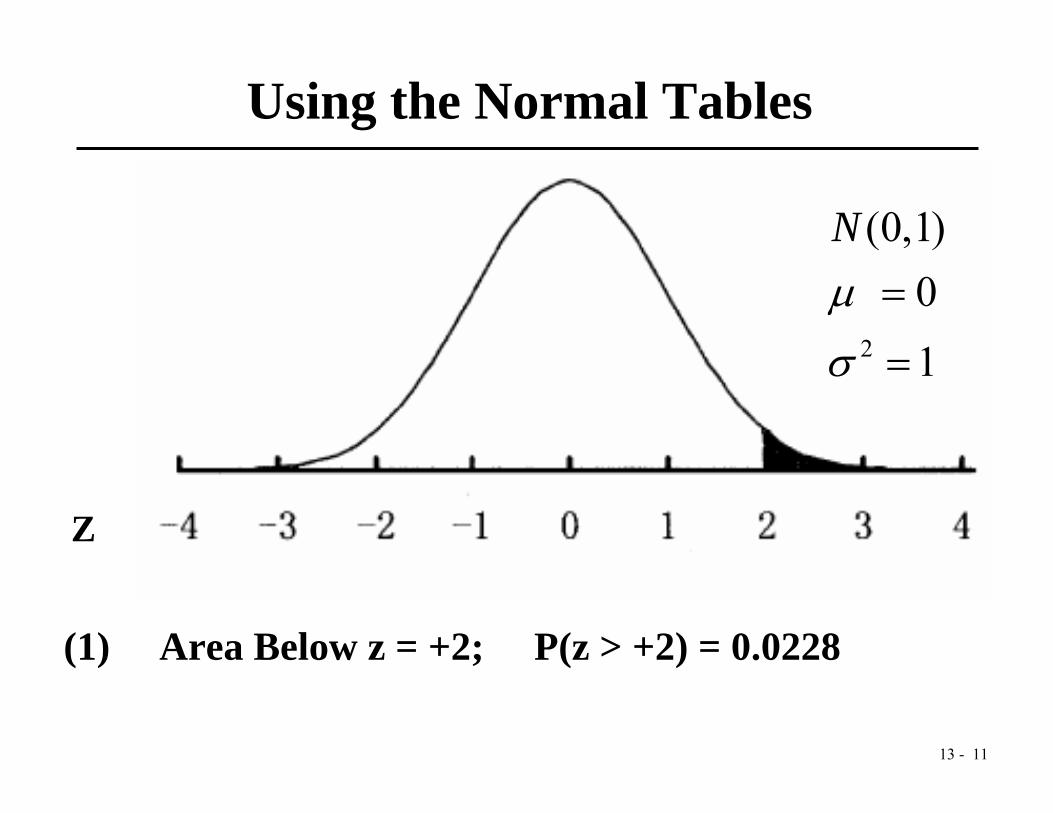
(1) Area Below z = +2; P(z > +2) = 0.0228
13 - 12
Using the Normal Tables
Z
2
(0,1)01
Nμ
σ
=
=
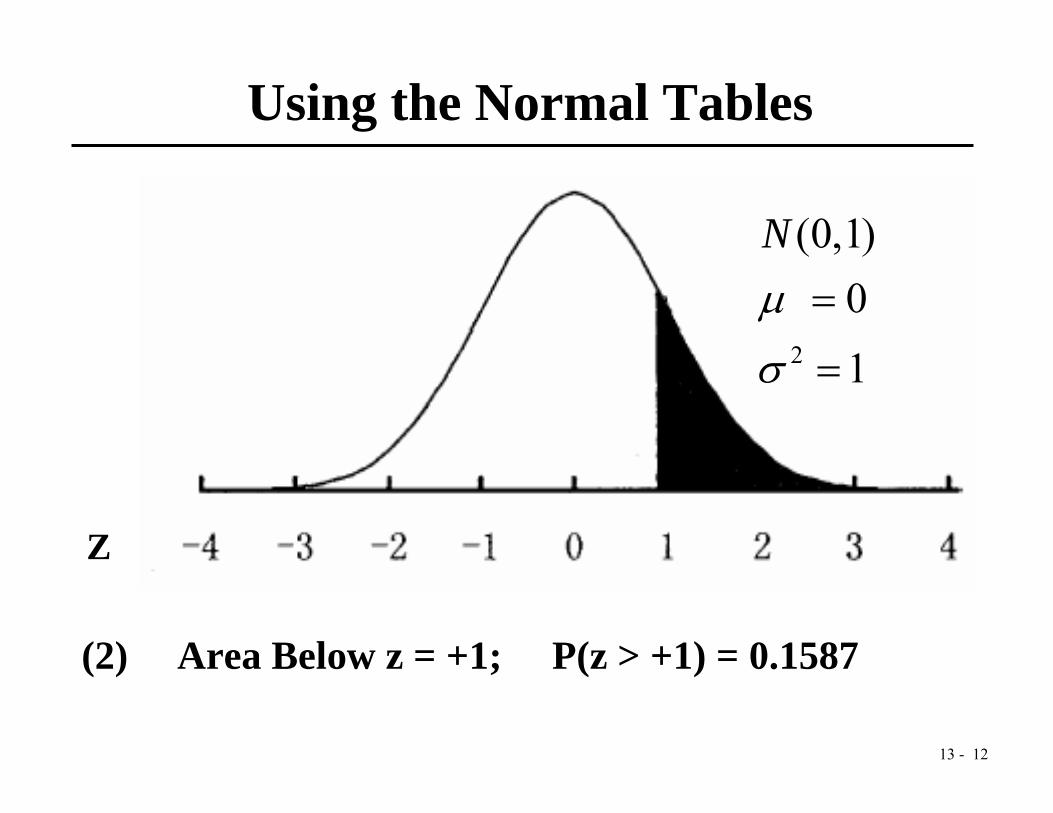
(2) Area Below z = +1; P(z > +1) = 0.1587
13 - 13
Using the Normal Tables
2
(0,1)01
Nμ
σ
=
=
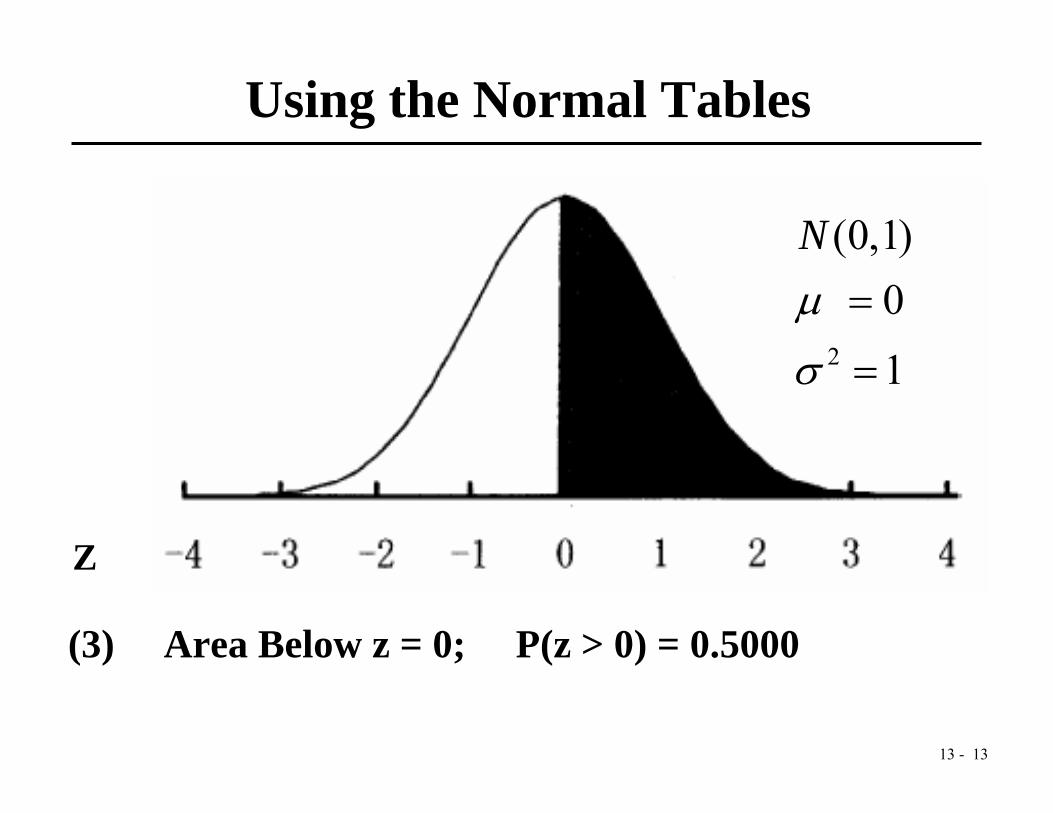
(3) Area Below z = 0; P(z > 0) = 0.5000
Z
13 - 14
Calculating the Area Under the Normal Curve
Z
2
(0,1)01
Nμ
σ
=
=
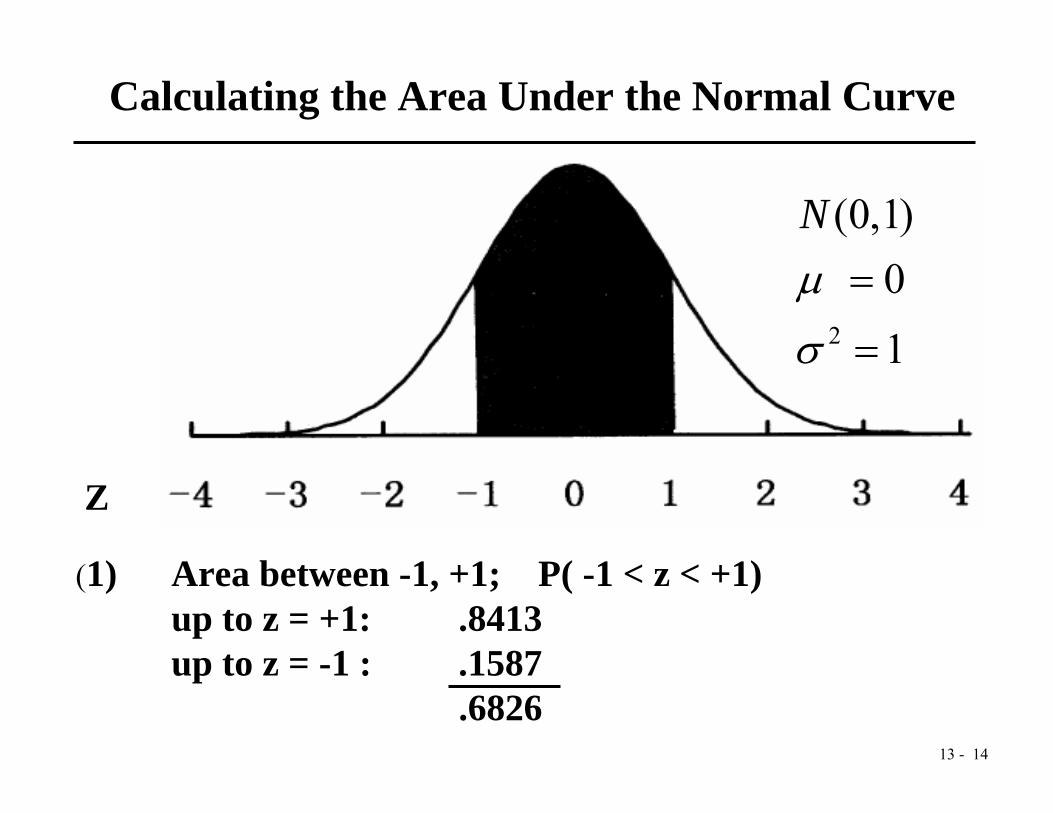
(1) Area between -1, +1; P( -1 < z < +1)up to z = +1: .8413up to z = -1 : .1587
.6826
13 - 15
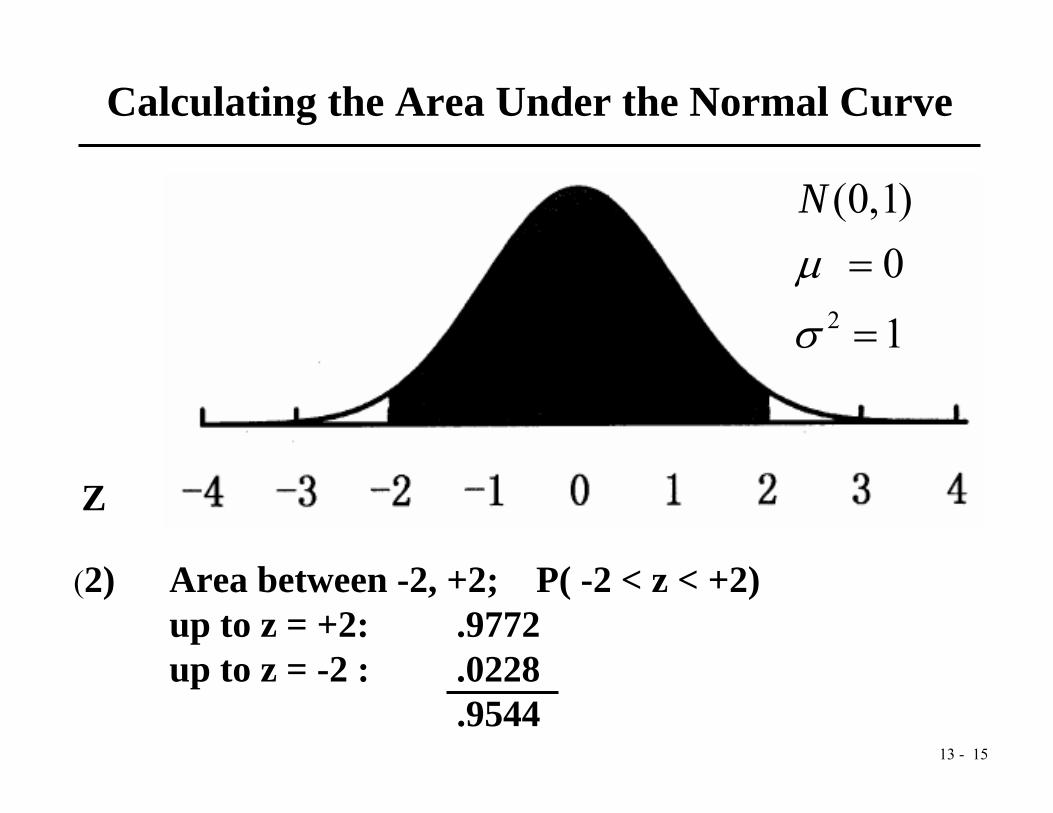
Calculating the Area Under the Normal Curve
Z
2
(0,1)01
Nμ
σ
=
=
(2) Area between -2, +2; P( -2 < z < +2)up to z = +2: .9772up to z = -2 : .0228
.9544
13 - 16
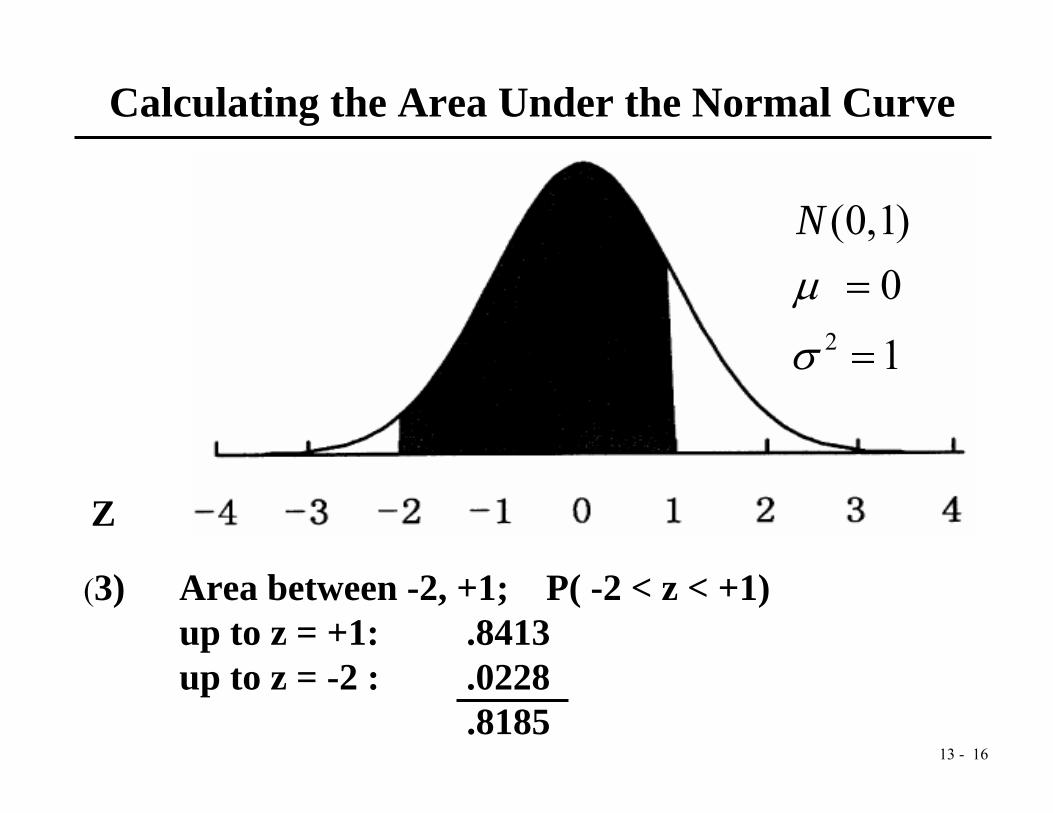
Calculating the Area Under the Normal Curve
2
(0,1)01
Nμ
σ
=
=
(3) Area between -2, +1; P( -2 < z < +1)up to z = +1: .8413up to z = -2 : .0228
.8185
Z
13 - 17
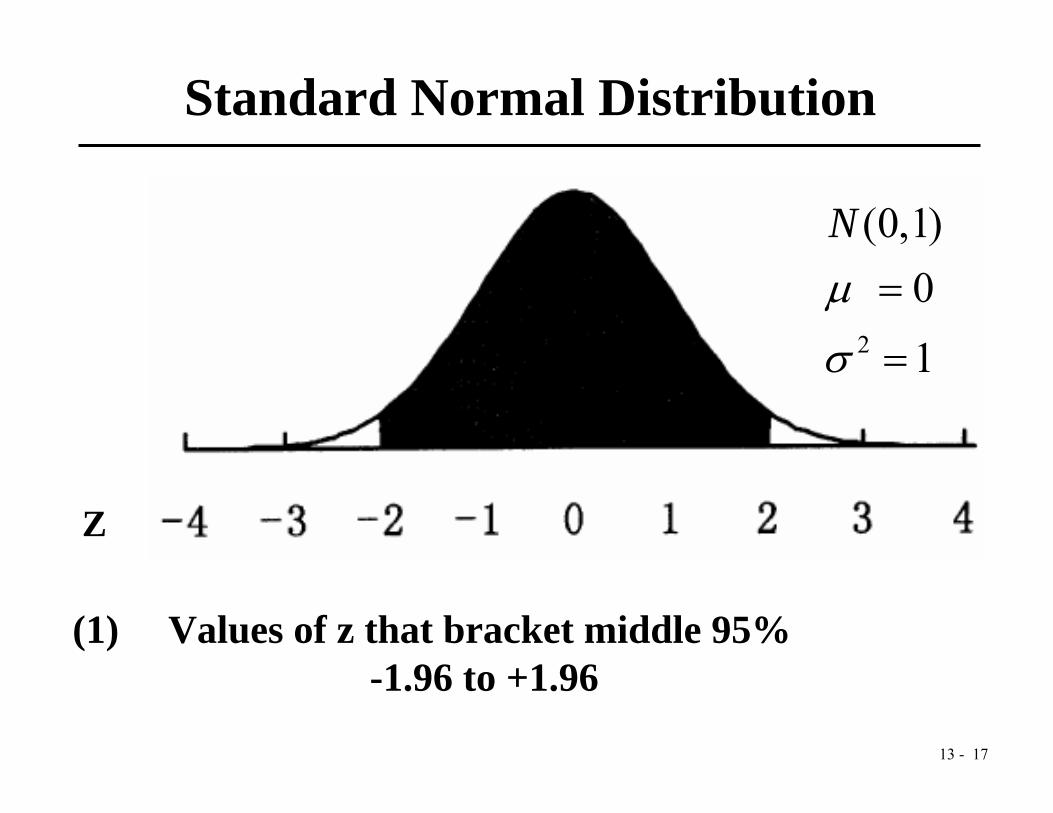
Standard Normal Distribution
2
(0,1)01
Nμ
σ
=
=
(1) Values of z that bracket middle 95% -1.96 to +1.96
Z
13 - 18
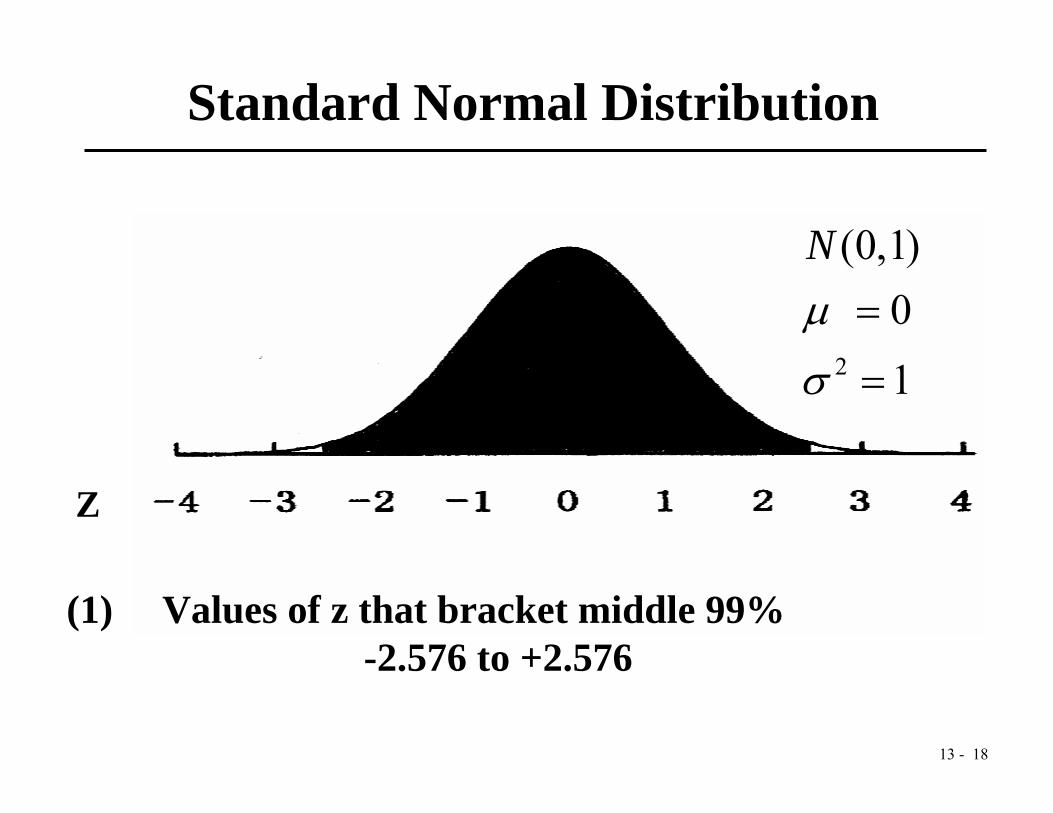
Standard Normal Distribution
2
(0,1)01
Nμ
σ
=
=
(1) Values of z that bracket middle 99% -2.576 to +2.576
Z
13 - 19
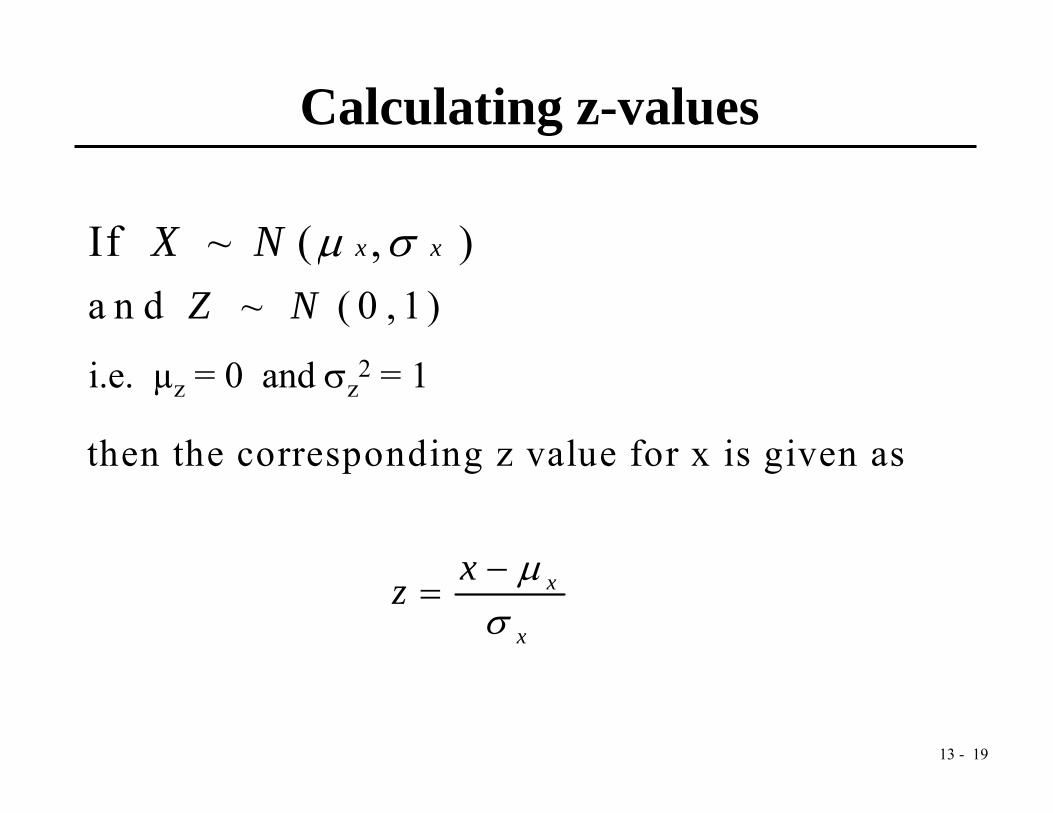
Calculating z-values
a n d ~ ( 0 , 1 )Z NIf ~ ( , )x xX N μ σ
then the corresponding z value for x is given as
x
x
xz μσ−
=
i.e. µz = 0 and σz2 = 1
13 - 20
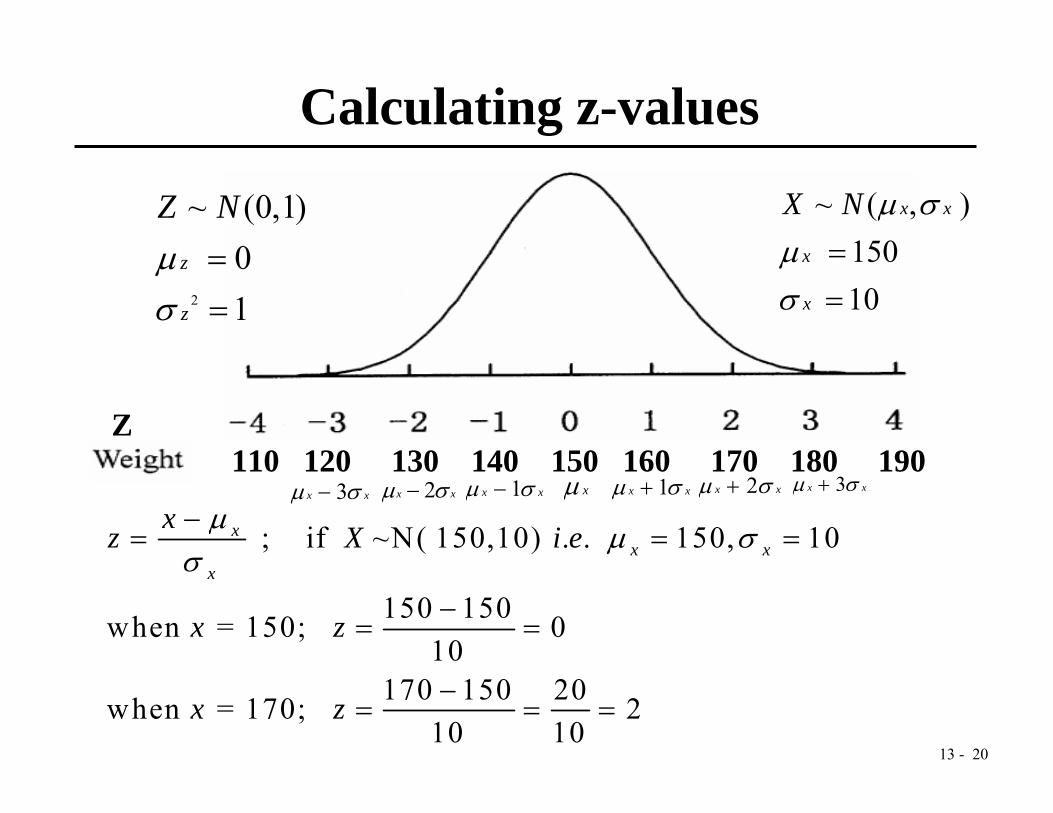
; if ~N( 150,10) . . 150, 10
150 150when = 150; 010
170 150 20when = 170; 210 10
xx x
x
xz X i e
x z
x z
μ μ σσ−
= = =
−= =
−= = =
Calculating z-values
2
~ (0,1) 0
1z
z
Z Nμσ
==
Z
~ ( , ) 150
10
x x
x
x
X N μ σμσ
==
110 120 130 140 150 160 170 180 190 2x xμ σ− 2x xμ σ+ 1x xμ σ− 3x xμ σ− 1x xμ σ+xμ 3x xμ σ+
13 - 21
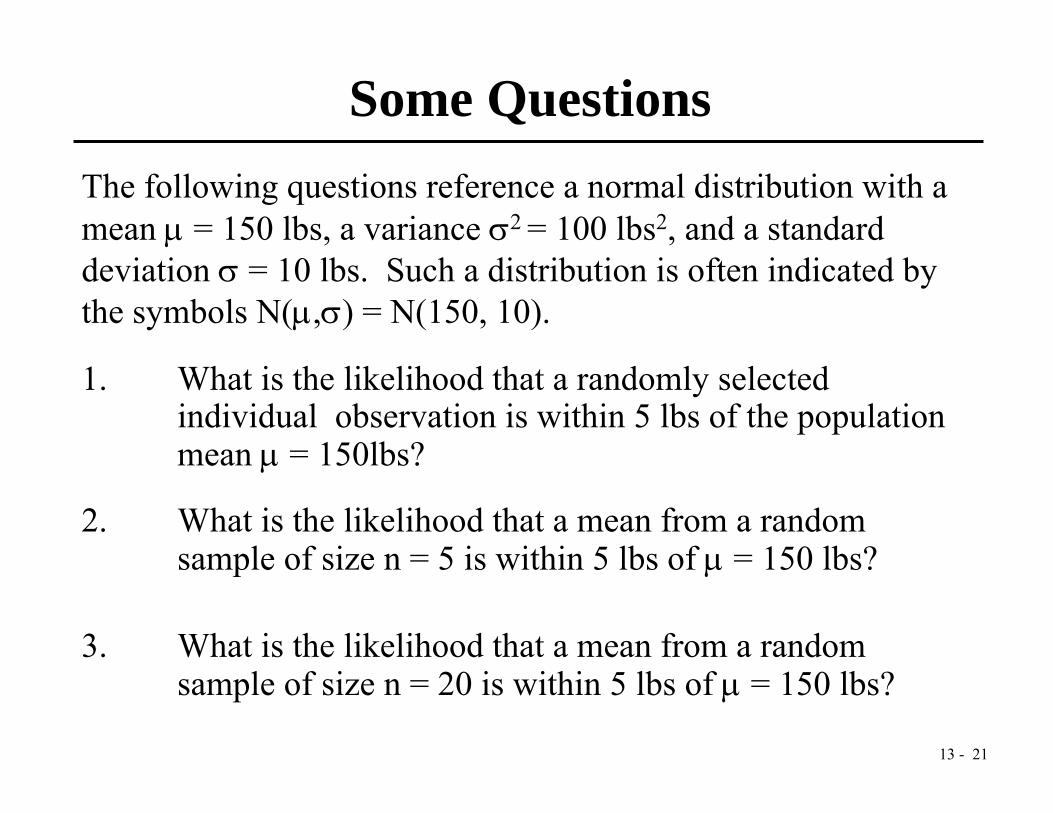
The following questions reference a normal distribution with a mean μ = 150 lbs, a variance σ2 = 100 lbs2, and a standard deviation σ = 10 lbs. Such a distribution is often indicated by the symbols N(μ,σ) = N(150, 10).
1. What is the likelihood that a randomly selected individual observation is within 5 lbs of the population mean μ = 150lbs?
2. What is the likelihood that a mean from a random sample of size n = 5 is within 5 lbs of μ = 150 lbs?
3. What is the likelihood that a mean from a random sample of size n = 20 is within 5 lbs of μ = 150 lbs?
Some Questions
13 - 22
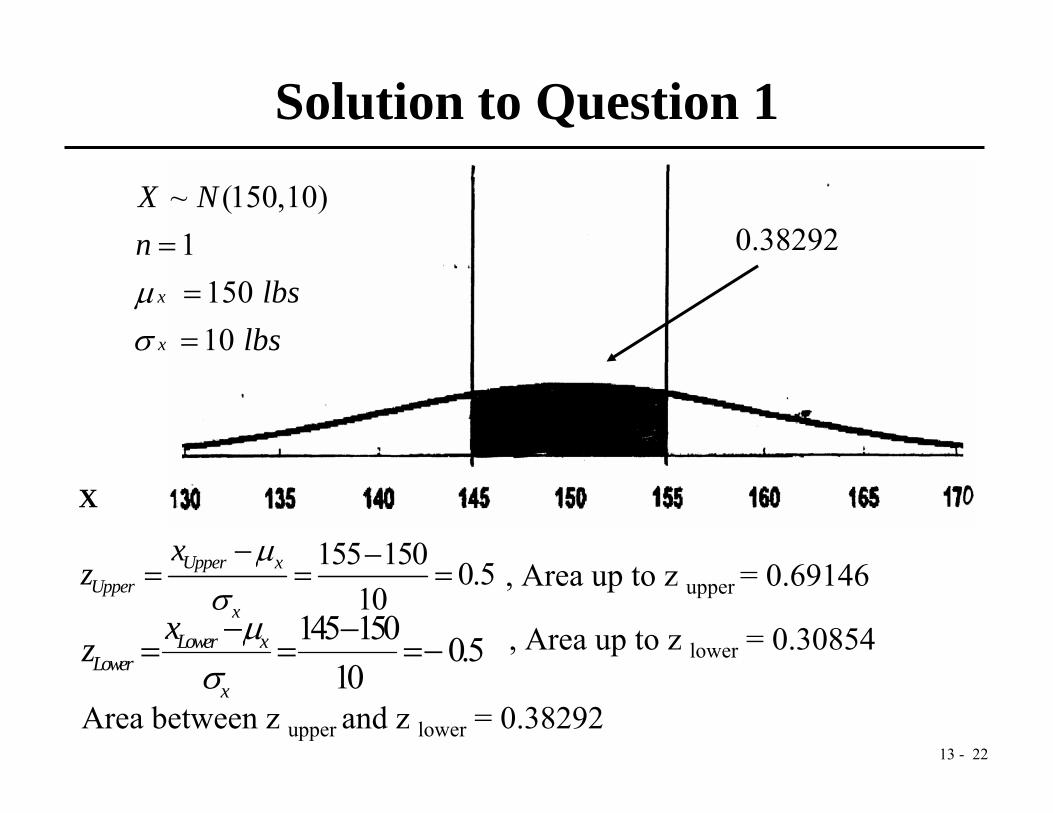
Solution to Question 1
0.38292
X
155 150 0.510
Upper xUpper
x
xz
μσ− −
= = =
Area between z upper and z lower = 0.38292
145 150 0.510
Lower xLower
x
xz μσ− −
= = =−
, Area up to z upper = 0.69146
, Area up to z lower = 0.30854
~ (150,10)1
150 10
x
x
X Nn
lbslbs
μσ
===
13 - 23
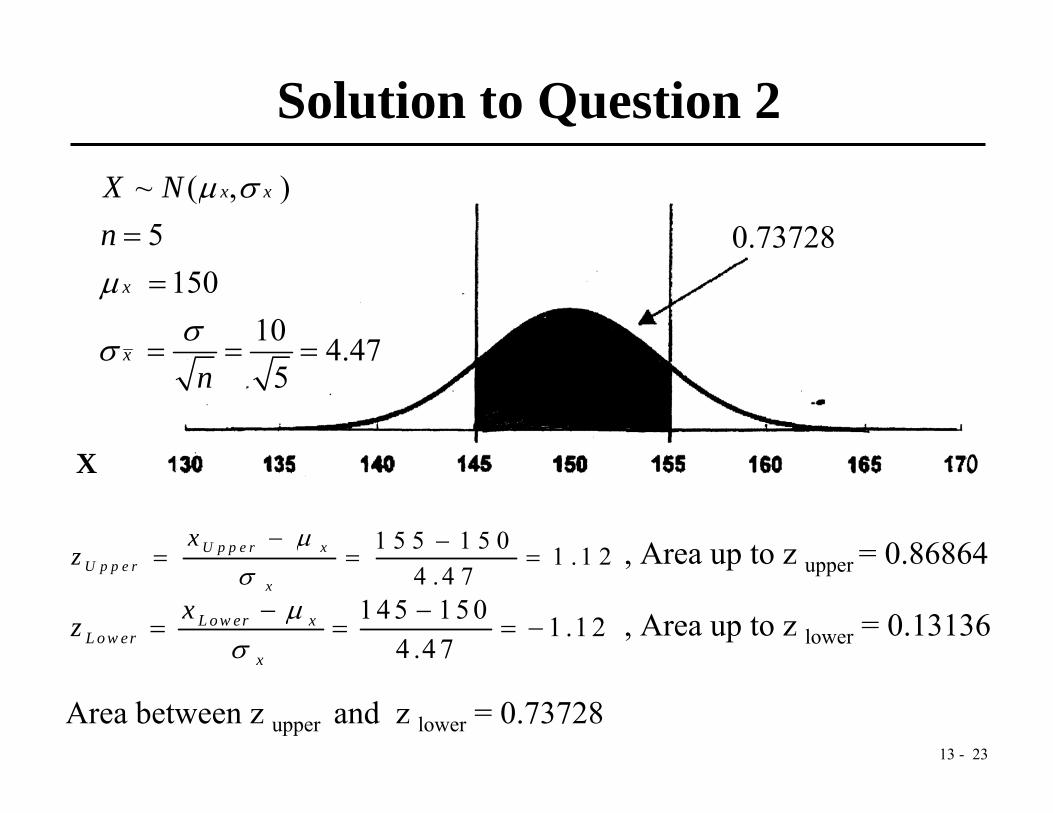
Solution to Question 2
Area between z upper and z lower = 0.73728
0.73728
1 5 5 1 5 0 1 .1 24 .4 7
U p p e r xU p p e r
x
xz
μσ
− −= = =
1 4 5 1 5 0 1 .1 24 .4 7
L ow er xL ow er
x
xz μσ− −
= = = −
, Area up to z upper = 0.86864
, Area up to z lower = 0.13136
~ ( , )5
15010 4.47
5
x x
x
x
X Nn
n
μ σ
μσσ
==
= = =
X
13 - 24
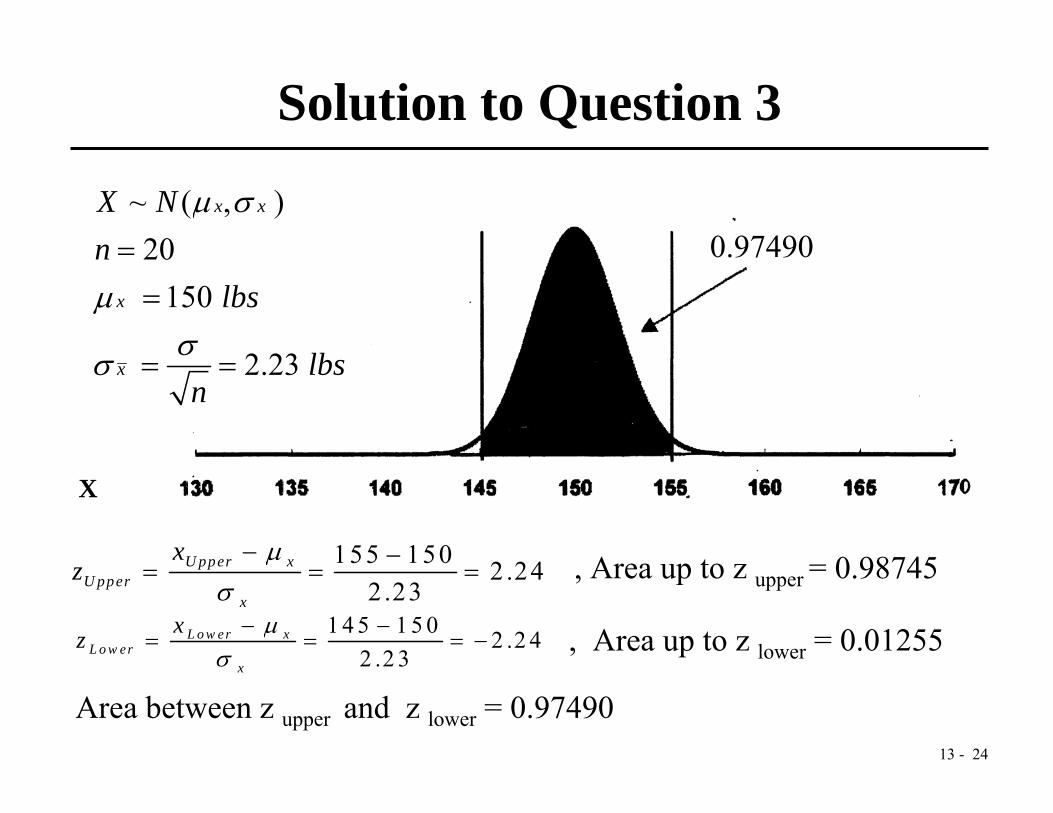
Solution to Question 3
0.97490
155 150 2 .242 .23
U pper xU pper
x
xz
μσ− −
= = =
1 4 5 1 5 0 2 .2 42 .2 3
L o w er xL o w er
x
xz μσ
− −= = = −
, Area up to z upper = 0.98745
, Area up to z lower = 0.01255
Area between z upper and z lower = 0.97490
~ ( , )20
150
2.23
x x
x
x
X Nn
lbs
lbsn
μ σ
μσσ
==
= =
X
13 - 25
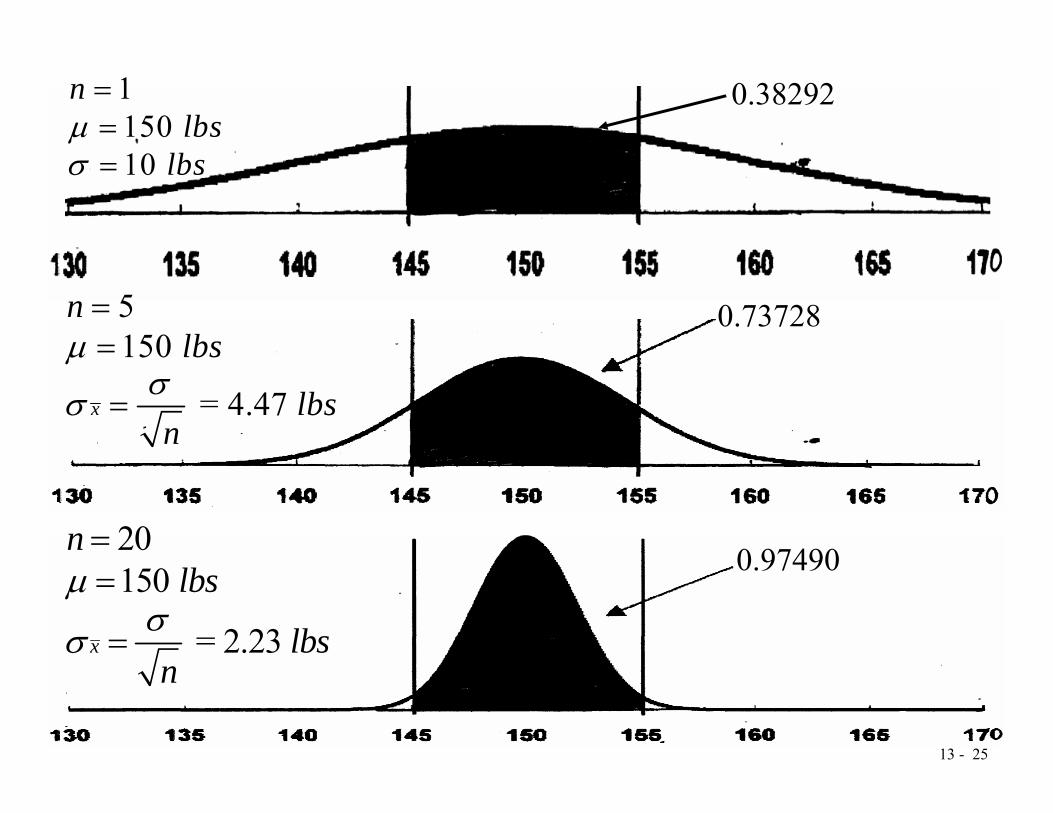
1150 10
nlbs
lbsμσ
===
0.38292
5150
= 4.47 x
nlbs
lbsn
μσσ
==
=
20150
= 2.23 x
nlbs
lbsn
μσσ
==
=
0.73728
0.97490
13 - 26
• When centered about μ = 150 lbs, what proportion of the total distribution does an interval of length 10 lbs cover?
• How many standard deviations long must an interval be to cover the middle 95% of the distribution?
• From μ - (??) standard deviations to μ + (??) standard deviations covers (??) % of the distribution?
All these questions require that the value for μ be known and that it be placed in the center of these “intervals”.
Some More Questions


![Distribuio Normal [Vprof.]](https://static.fdocument.org/doc/165x107/557200fe4979599169a0808b/distribuio-normal-vprof.jpg)