Module 1: Special Topics in Household Surveys...
50
Module 1: Special Topics in Household Surveys Georeferencing Siobhan Murray and Sydney Gourlay March 6, 2014
Transcript of Module 1: Special Topics in Household Surveys...
Module 1: Special Topics in
Household Surveys
Georeferencing
Siobhan Murray and Sydney Gourlay
March 6, 2014
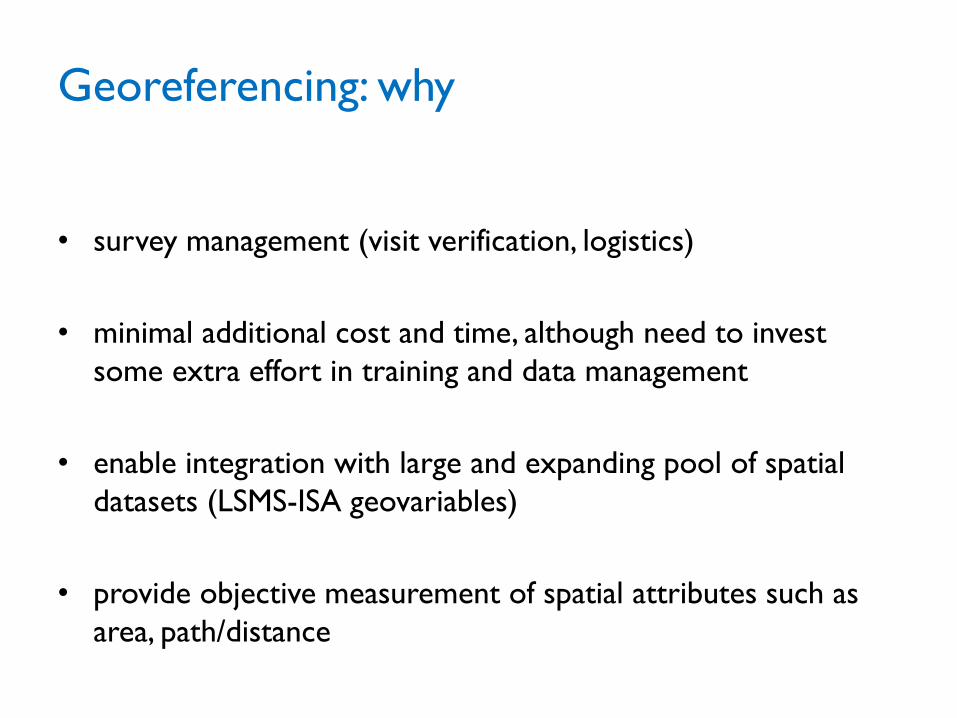
Georeferencing: why
• survey management (visit verification, logistics)
• minimal additional cost and time, although need to invest
some extra effort in training and data management
• enable integration with large and expanding pool of spatial
datasets (LSMS-ISA geovariables)
• provide objective measurement of spatial attributes such as
area, path/distance
Georeferencing: why
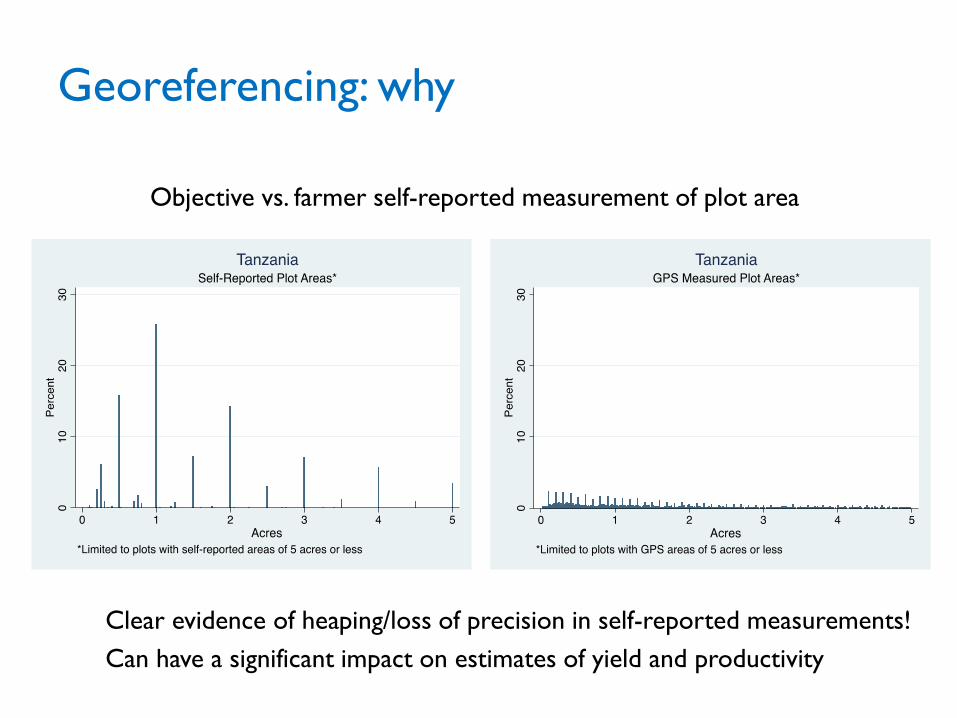
Objective vs. farmer self-reported measurement of plot area
Clear evidence of heaping/loss of precision in self-reported measurements!
Can have a significant impact on estimates of yield and productivity
Georeferencing: what
• Location variables (enumeration area, city, district, region..),
which can be linked to administrative level boundaries, even
EA in some cases.
• GPS position in specified coordinate system, defined by
1. cs type (spherical vs projected)
2. projection parameters (epsg.org)
3. units
4. datum
Georeferencing: what
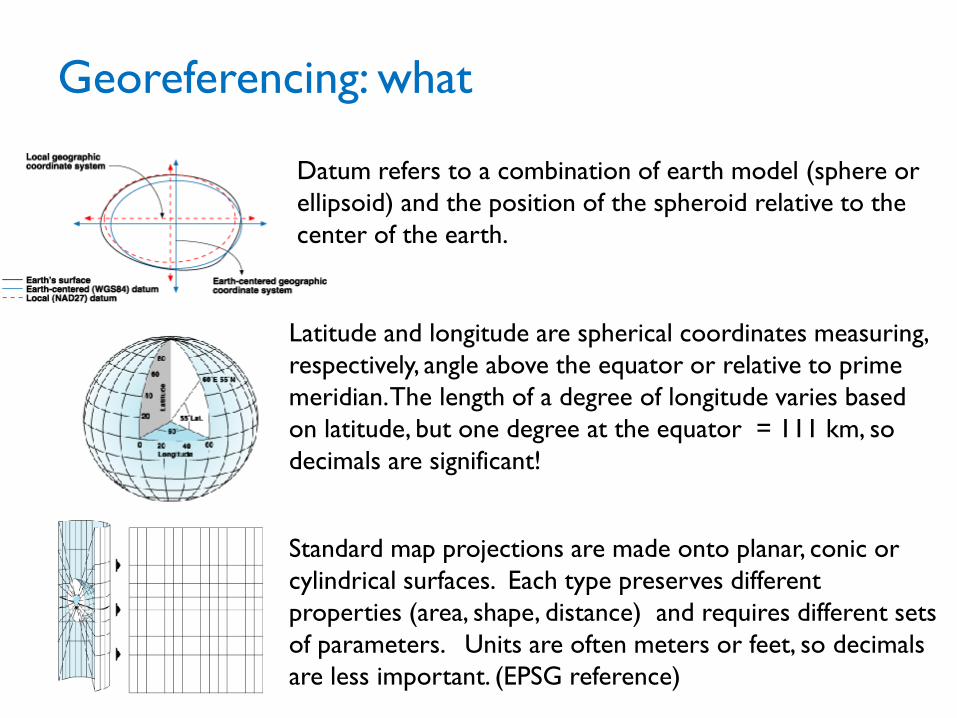
Latitude and longitude are spherical coordinates measuring,
respectively, angle above the equator or relative to prime
meridian. The length of a degree of longitude varies based
on latitude, but one degree at the equator = 111 km, so
decimals are significant!
Standard map projections are made onto planar, conic or
cylindrical surfaces. Each type preserves different
properties (area, shape, distance) and requires different sets
of parameters. Units are often meters or feet, so decimals
are less important. (EPSG reference)
Datum refers to a combination of earth model (sphere or
ellipsoid) and the position of the spheroid relative to the
center of the earth.
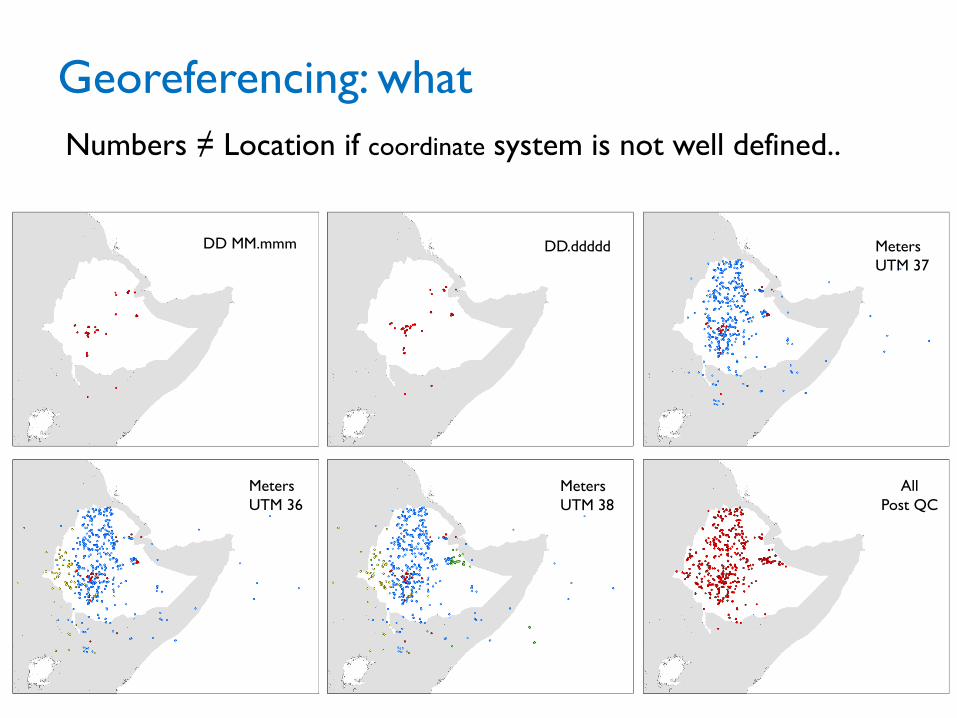
Georeferencing: what
Numbers ≠ Location if coordinate system is not well defined..
DD MM.mmm DD.ddddd Meters
UTM 37
Meters
UTM 36
Meters
UTM 38
All
Post QC
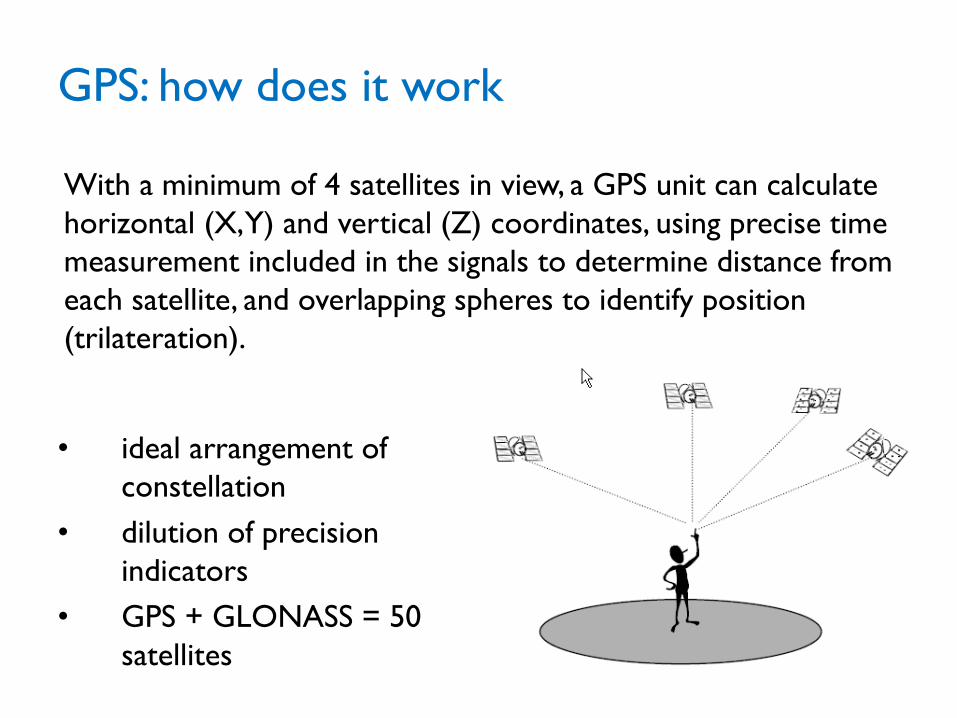
GPS: how does it work
• With a minimum of 4 satellites in view, a GPS unit can calculate
horizontal (X, Y) and vertical (Z) coordinates, using precise time
measurement included in the signals to determine distance from
each satellite, and overlapping spheres to identify position
(trilateration).
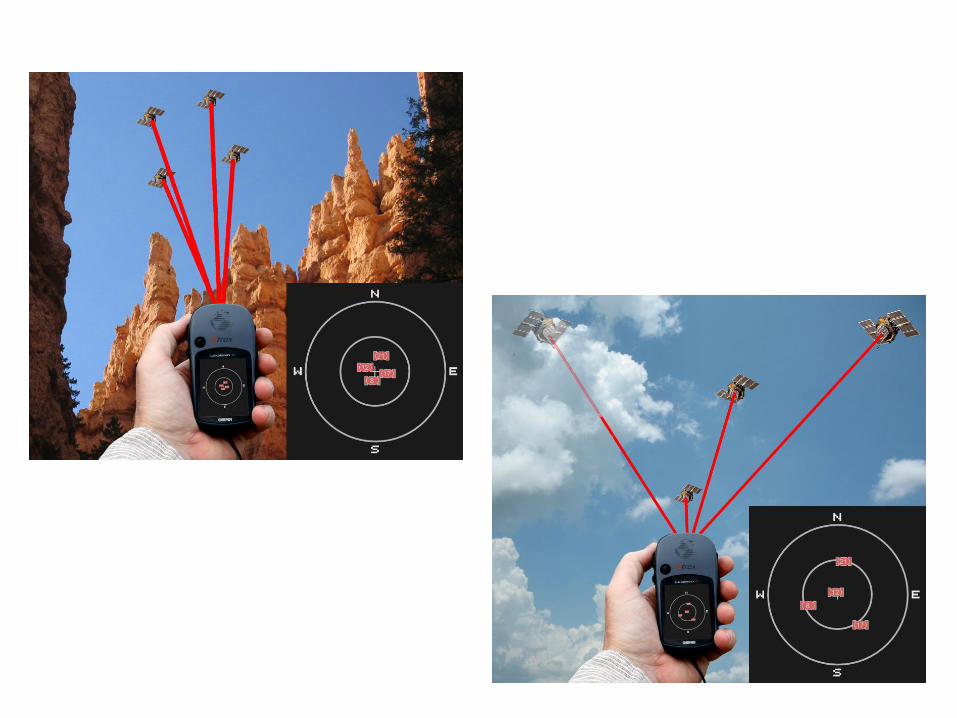
• ideal arrangement of
constellation
• dilution of precision
indicators
• GPS + GLONASS = 50
satellites
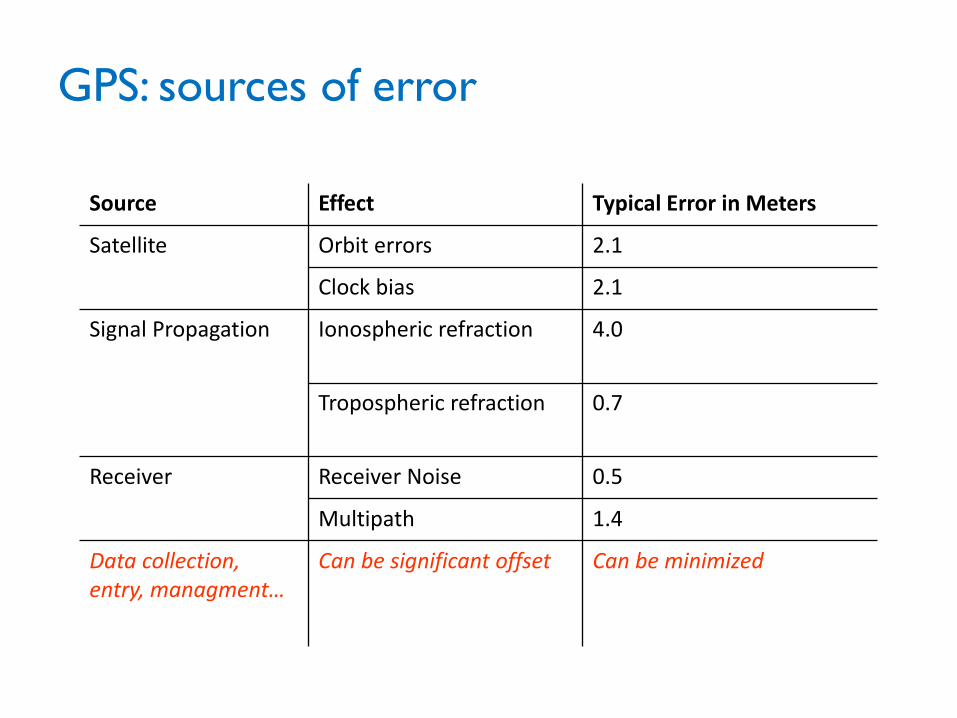
GPS: sources of error
Source Effect Typical Error in Meters
Satellite Orbit errors 2.1
Clock bias 2.1
Signal Propagation Ionospheric refraction 4.0
Tropospheric refraction 0.7
Receiver Receiver Noise 0.5
Multipath 1.4
Data collection, entry, managment…
Can be significant offset Can be minimized
GPS Implementation
1. Equipment
2. Questionnaire
3. Training
4. Data Management
• Data entry
• Review & cleaning
5. Final Preparation & Dissemination
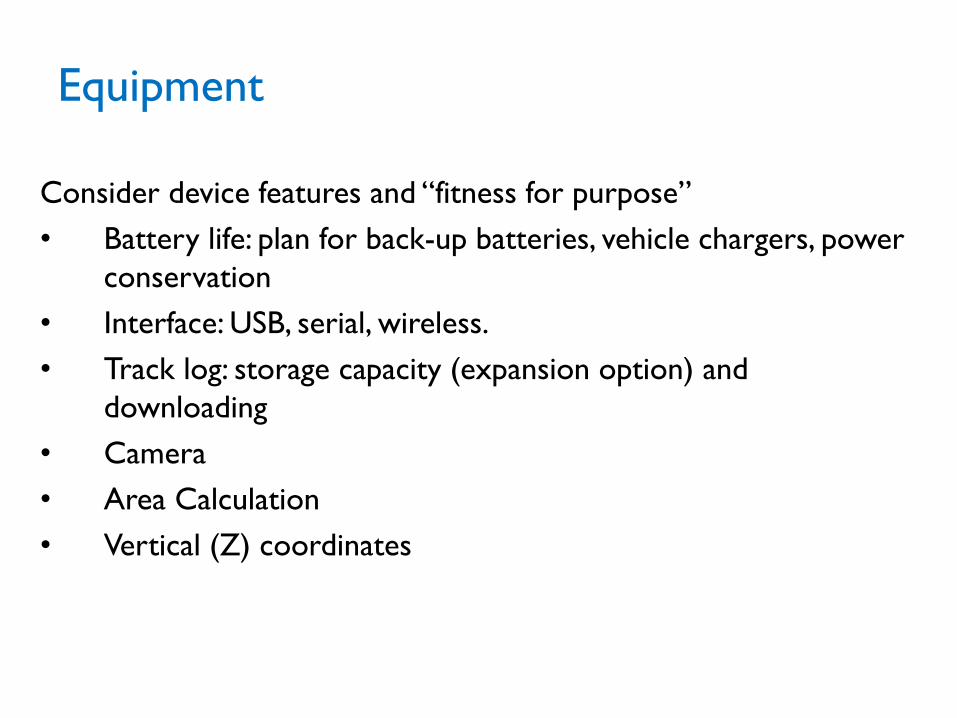
Equipment
Consider device features and “fitness for purpose”
• Battery life: plan for back-up batteries, vehicle chargers, power
conservation
• Interface: USB, serial, wireless.
• Track log: storage capacity (expansion option) and
downloading
• Camera
• Area Calculation
• Vertical (Z) coordinates
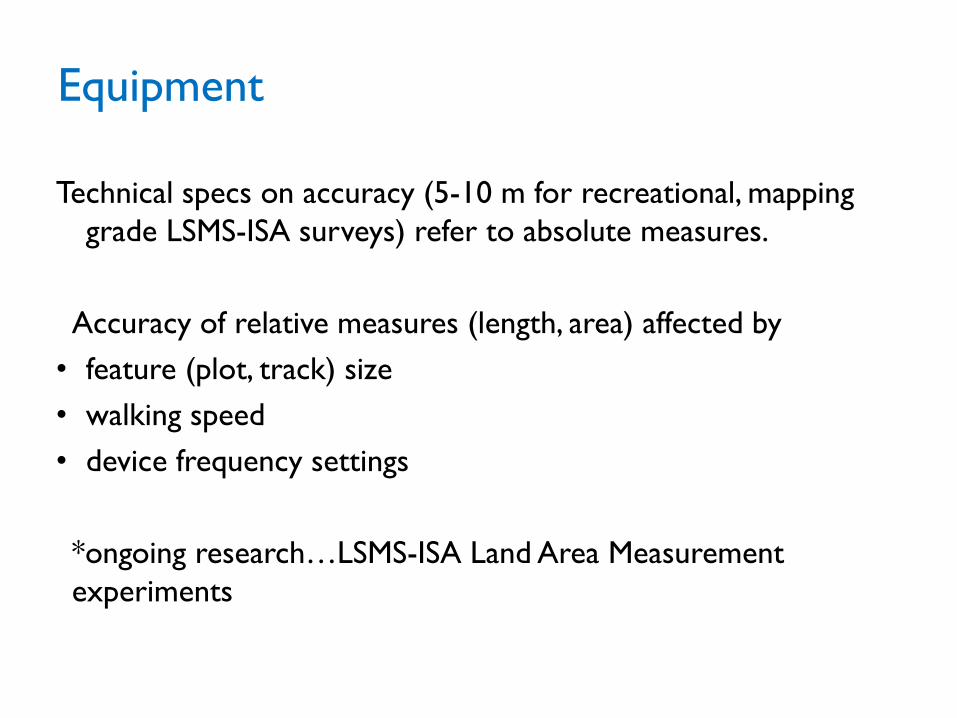
Equipment
Technical specs on accuracy (5-10 m for recreational, mapping
grade LSMS-ISA surveys) refer to absolute measures.
Accuracy of relative measures (length, area) affected by
• feature (plot, track) size
• walking speed
• device frequency settings
*ongoing research…LSMS-ISA Land Area Measurement
experiments
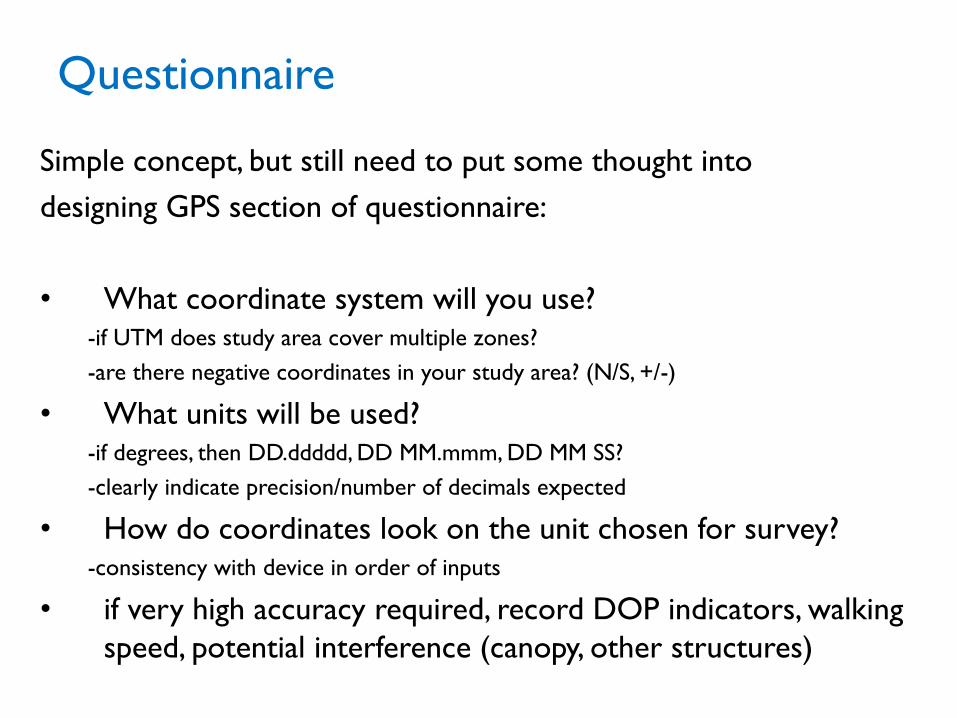
Simple concept, but still need to put some thought into
designing GPS section of questionnaire:
• What coordinate system will you use? -if UTM does study area cover multiple zones?
-are there negative coordinates in your study area? (N/S, +/-)
• What units will be used? -if degrees, then DD.ddddd, DD MM.mmm, DD MM SS?
-clearly indicate precision/number of decimals expected
• How do coordinates look on the unit chosen for survey? -consistency with device in order of inputs
• if very high accuracy required, record DOP indicators, walking
speed, potential interference (canopy, other structures)
Questionnaire
Questionnaire
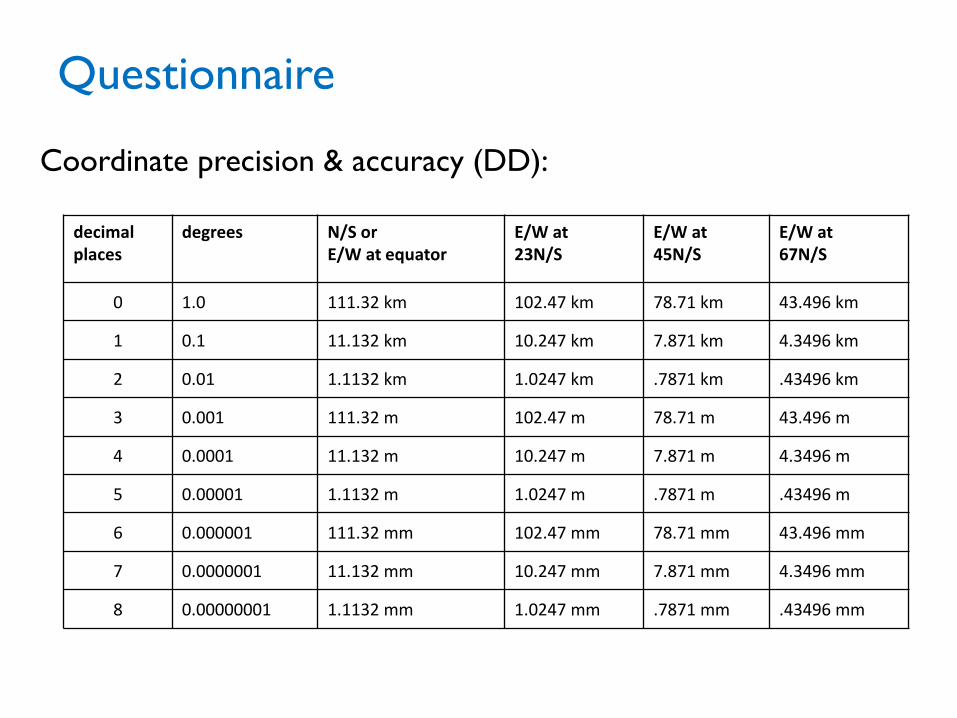
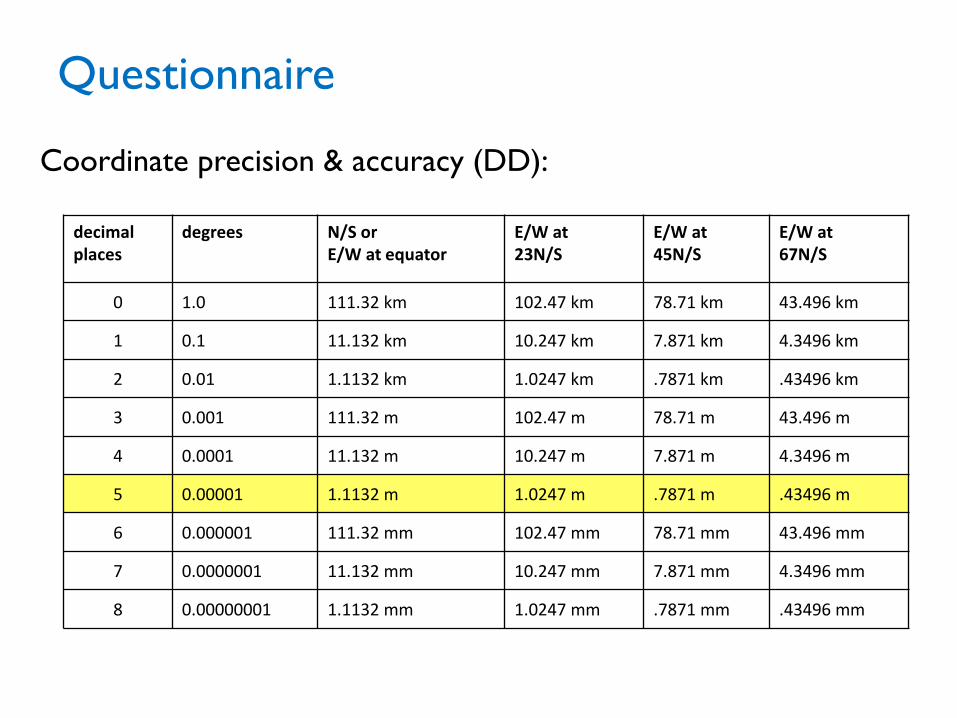
Coordinate precision & accuracy (DD):
decimal places
degrees N/S or E/W at equator
E/W at 23N/S
E/W at 45N/S
E/W at 67N/S
0 1.0 111.32 km 102.47 km 78.71 km 43.496 km
1 0.1 11.132 km 10.247 km 7.871 km 4.3496 km
2 0.01 1.1132 km 1.0247 km .7871 km .43496 km
3 0.001 111.32 m 102.47 m 78.71 m 43.496 m
4 0.0001 11.132 m 10.247 m 7.871 m 4.3496 m
5 0.00001 1.1132 m 1.0247 m .7871 m .43496 m
6 0.000001 111.32 mm 102.47 mm 78.71 mm 43.496 mm
7 0.0000001 11.132 mm 10.247 mm 7.871 mm 4.3496 mm
8 0.00000001 1.1132 mm 1.0247 mm .7871 mm .43496 mm
Questionnaire
Coordinate precision & accuracy (DD):
decimal places
degrees N/S or E/W at equator
E/W at 23N/S
E/W at 45N/S
E/W at 67N/S
0 1.0 111.32 km 102.47 km 78.71 km 43.496 km
1 0.1 11.132 km 10.247 km 7.871 km 4.3496 km
2 0.01 1.1132 km 1.0247 km .7871 km .43496 km
3 0.001 111.32 m 102.47 m 78.71 m 43.496 m
4 0.0001 11.132 m 10.247 m 7.871 m 4.3496 m
5 0.00001 1.1132 m 1.0247 m .7871 m .43496 m
6 0.000001 111.32 mm 102.47 mm 78.71 mm 43.496 mm
7 0.0000001 11.132 mm 10.247 mm 7.871 mm 4.3496 mm
8 0.00000001 1.1132 mm 1.0247 mm .7871 mm .43496 mm
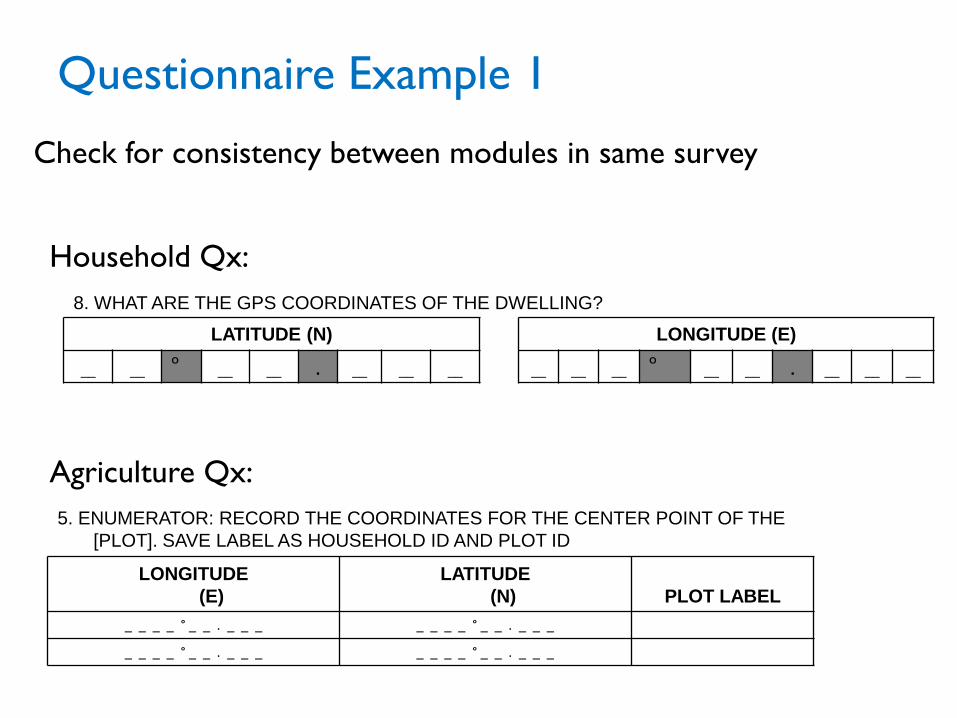
8. WHAT ARE THE GPS COORDINATES OF THE DWELLING?
LATITUDE (N) LONGITUDE (E)
__ __ O
__ __ . __ __ __ __ __ __ O
__ __ . __ __ __
5. ENUMERATOR: RECORD THE COORDINATES FOR THE CENTER POINT OF THE
[PLOT]. SAVE LABEL AS HOUSEHOLD ID AND PLOT ID
LONGITUDE
(E)
LATITUDE
(N) PLOT LABEL
_ _ _ _ ° _ _ . _ _ _ _ _ _ _ ° _ _ . _ _ _
_ _ _ _ ° _ _ . _ _ _ _ _ _ _ ° _ _ . _ _ _
Check for consistency between modules in same survey
Household Qx:
Agriculture Qx:
Questionnaire Example 1
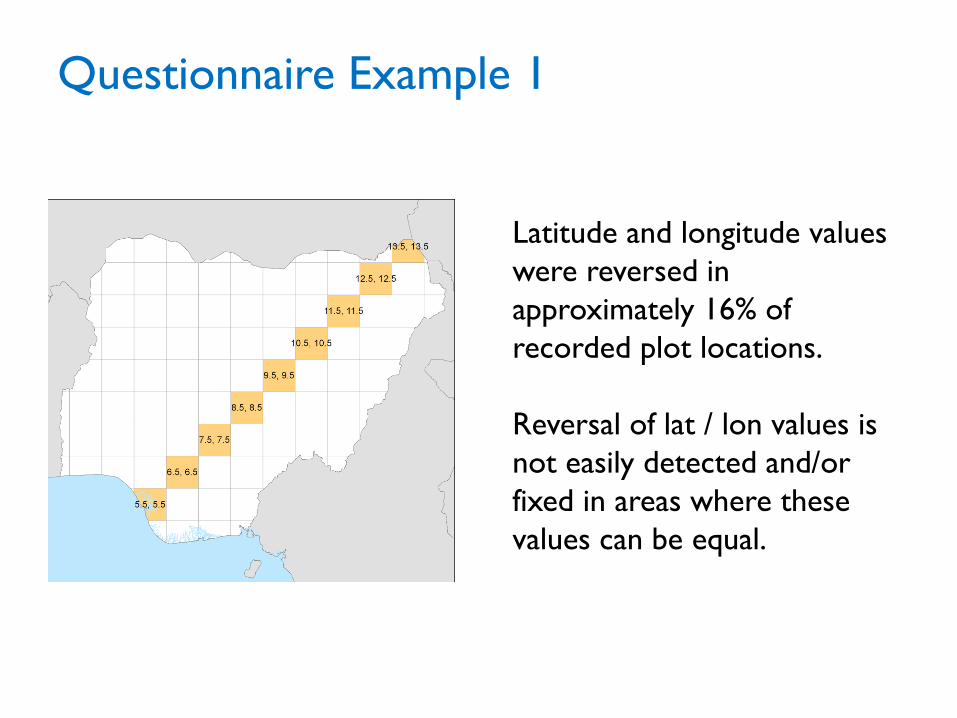
Latitude and longitude values
were reversed in
approximately 16% of
recorded plot locations.
Reversal of lat / lon values is
not easily detected and/or
fixed in areas where these
values can be equal.
Questionnaire Example 1
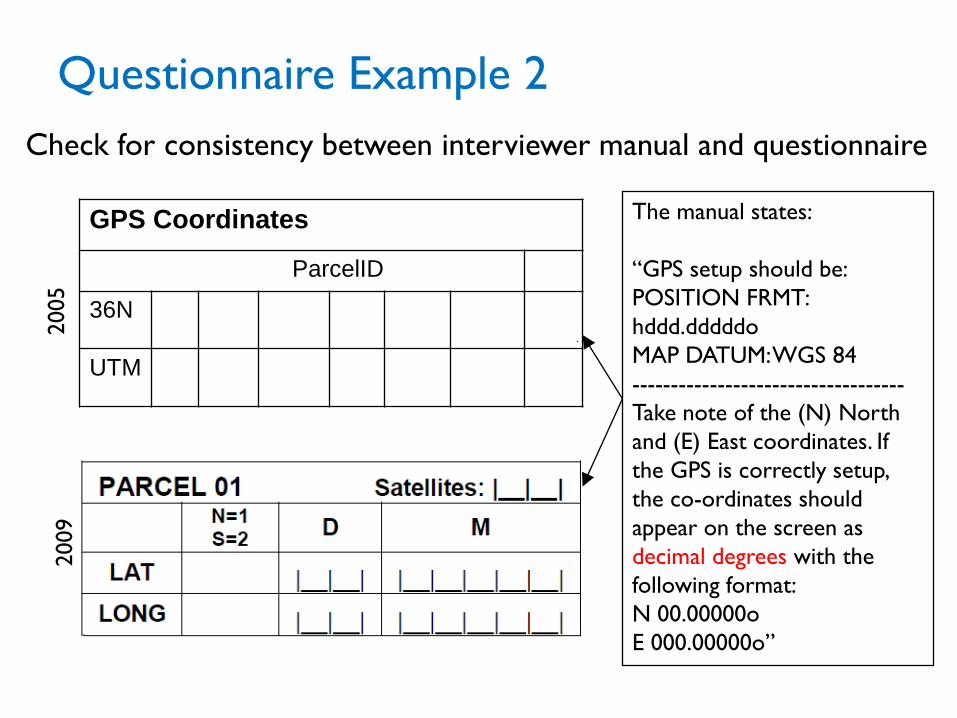
Check for consistency between interviewer manual and questionnaire
GPS Coordinates
ParcelID
36N
UTM
The manual states:
“GPS setup should be:
POSITION FRMT:
hddd.dddddo
MAP DATUM: WGS 84
-----------------------------------
Take note of the (N) North
and (E) East coordinates. If
the GPS is correctly setup,
the co-ordinates should
appear on the screen as
decimal degrees with the
following format:
N 00.00000o
E 000.00000o”
2005
2009
Questionnaire Example 2
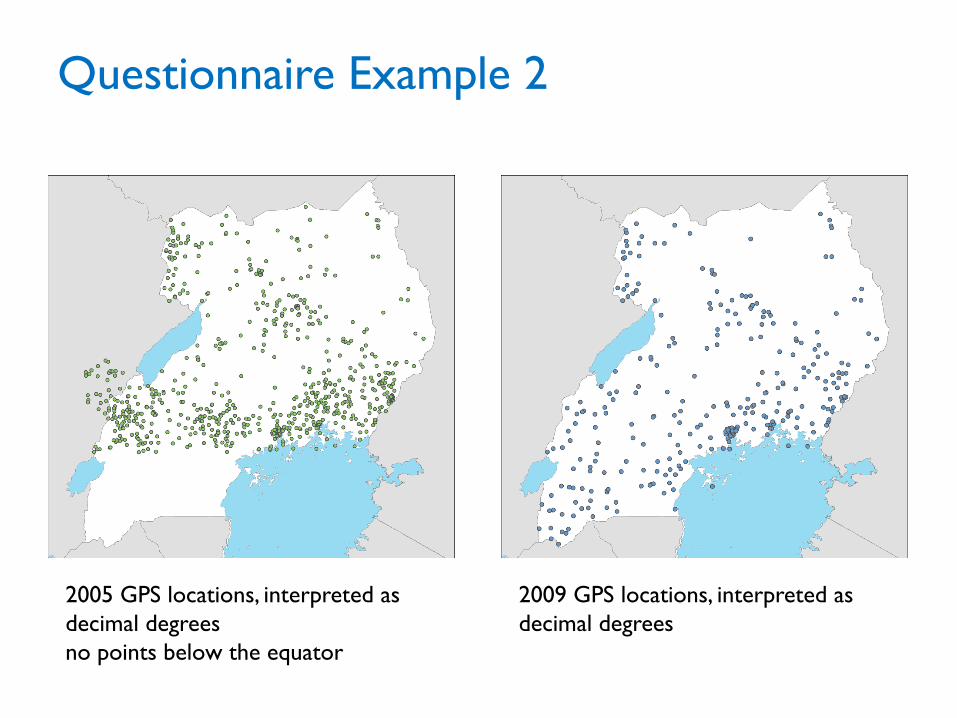
2005 GPS locations, interpreted as
decimal degrees
no points below the equator
2009 GPS locations, interpreted as
decimal degrees
Questionnaire Example 2
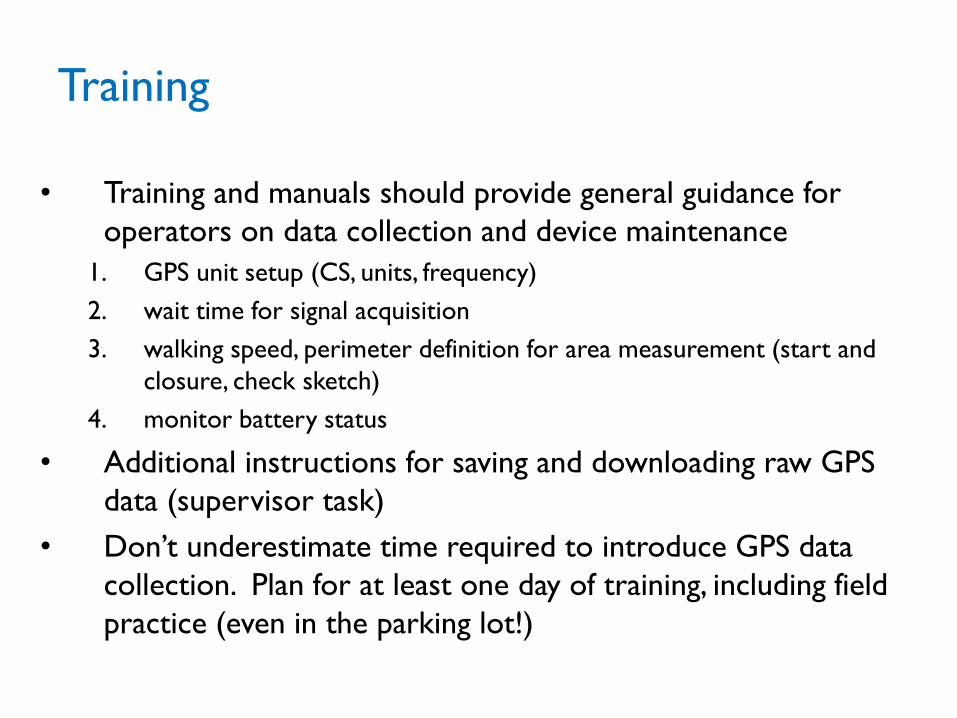
Training
• Training and manuals should provide general guidance for
operators on data collection and device maintenance
1. GPS unit setup (CS, units, frequency)
2. wait time for signal acquisition
3. walking speed, perimeter definition for area measurement (start and
closure, check sketch)
4. monitor battery status
• Additional instructions for saving and downloading raw GPS
data (supervisor task)
• Don’t underestimate time required to introduce GPS data
collection. Plan for at least one day of training, including field
practice (even in the parking lot!)
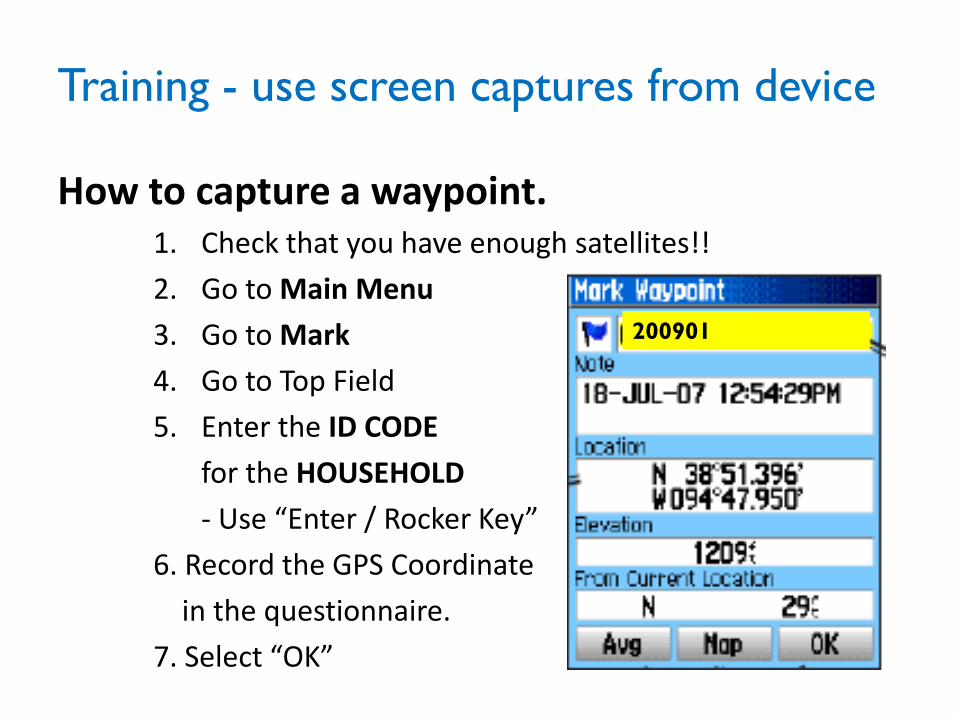
Training - use screen captures from device
How to capture a waypoint. 1. Check that you have enough satellites!!
2. Go to Main Menu
3. Go to Mark
4. Go to Top Field
5. Enter the ID CODE
for the HOUSEHOLD
- Use “Enter / Rocker Key”
6. Record the GPS Coordinate
in the questionnaire.
7. Select “OK”
200901
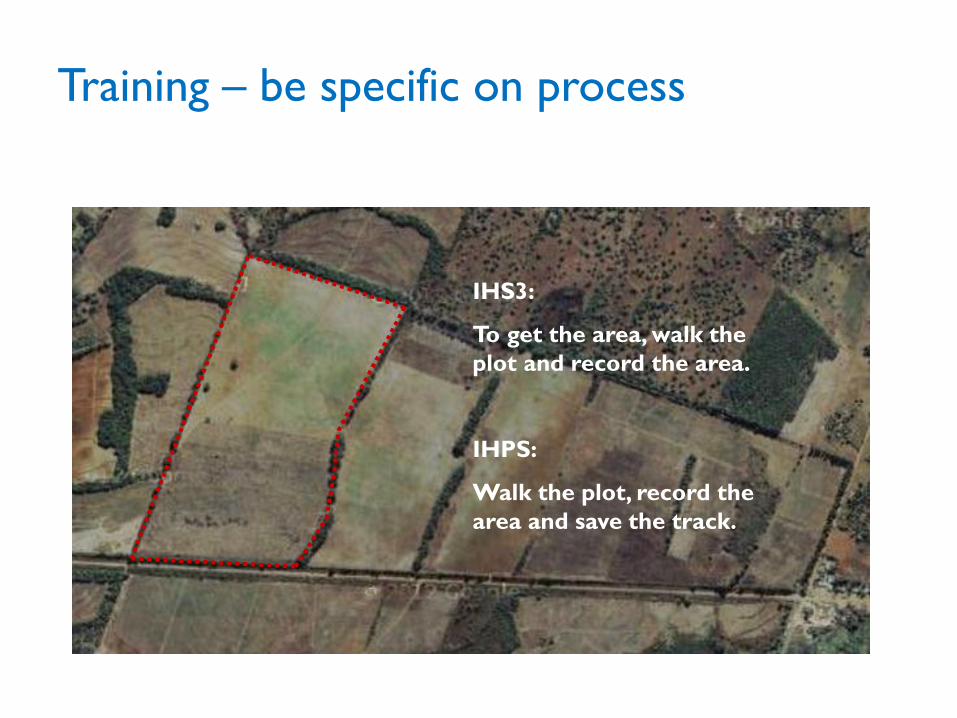
Training – be specific on process
IHS3:
To get the area, walk the
plot and record the area.
IHPS:
Walk the plot, record the
area and save the track.
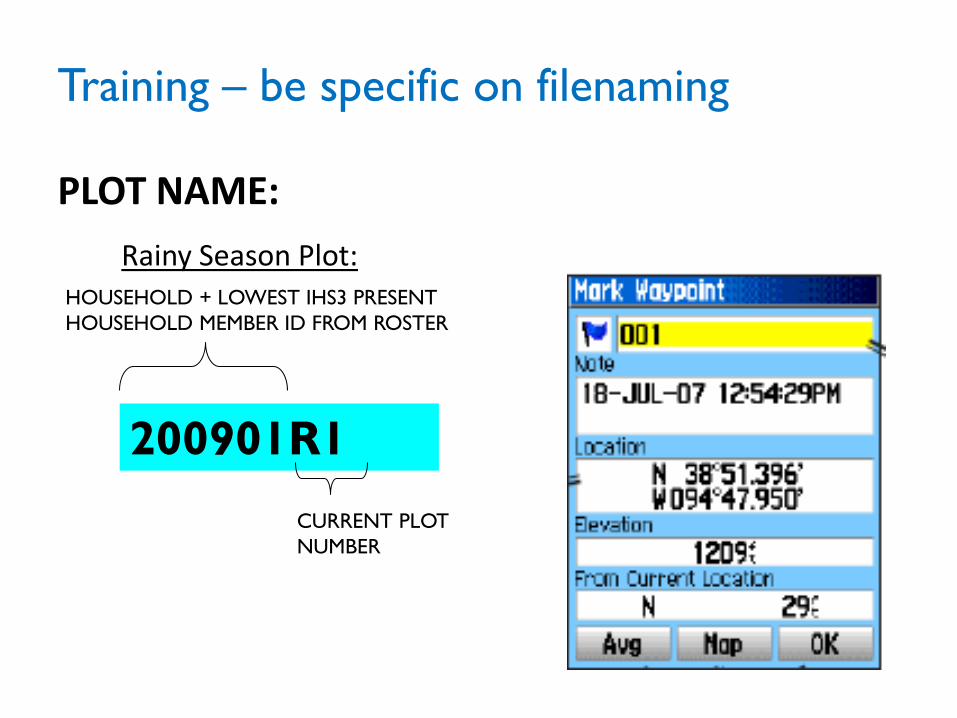
Training – be specific on filenaming
PLOT NAME:
Rainy Season Plot: HOUSEHOLD + LOWEST IHS3 PRESENT
HOUSEHOLD MEMBER ID FROM ROSTER
200901R1
CURRENT PLOT
NUMBER
Training – stress important messages
Important!
• GPS units must all be set up to measure location and area in the same format
Meters (not feet)
Acres (not Meters or Hectares)
• Once you set up the GPS unit, make sure never to change the settings
• Periodically check that the GPS unit is set up correctly
Data Management: Data entry
Different ways to record data:
1. Manual data-entry (paper) in field or at HQ
2. GPS raw data: avoids confusion associated with GPS settings,
as well as data-entry errors, but requires extra effort for
• track, waypoint naming convention that ensures link to household or
other survey records
• downloading protocol to account for limits in device storage
• conversion to standard format (open source tools GPS Babel, DNR
Garmin & GPSU, or proprietary TerraSync, Waypoint Manager)
3. Automatic import to CAPI from internal receiver or by USB
or wireless connection device
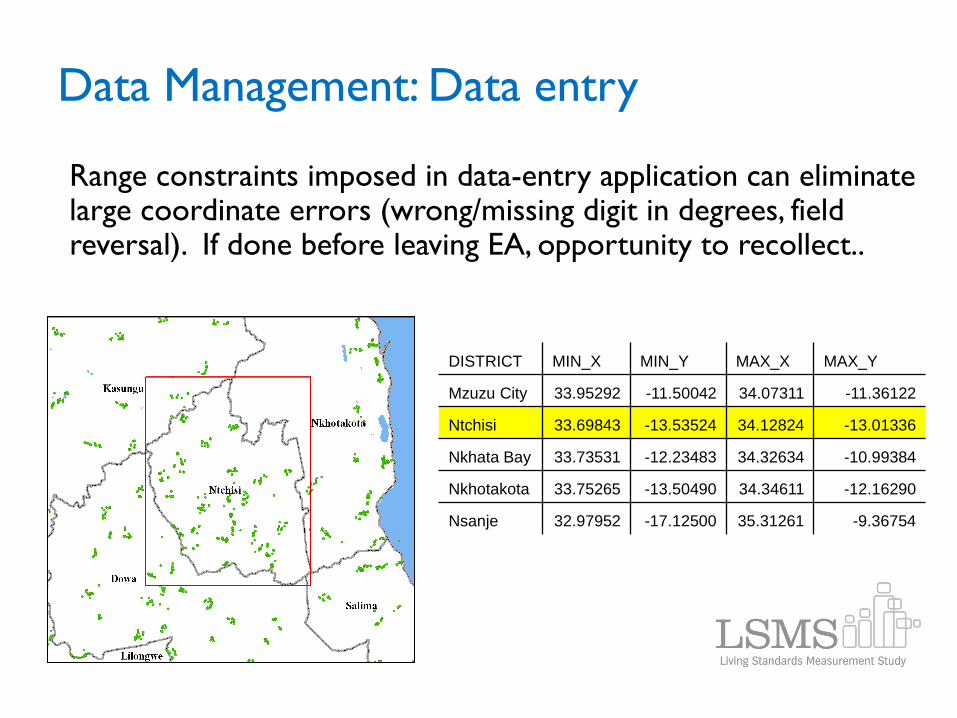
• Range constraints imposed in data-entry application can eliminate large coordinate errors (wrong/missing digit in degrees, field reversal). If done before leaving EA, opportunity to recollect..
DISTRICT MIN_X MIN_Y MAX_X MAX_Y
Mzuzu City 33.95292 -11.50042 34.07311 -11.36122
Ntchisi 33.69843 -13.53524 34.12824 -13.01336
Nkhata Bay 33.73531 -12.23483 34.32634 -10.99384
Nkhotakota 33.75265 -13.50490 34.34611 -12.16290
Nsanje 32.97952 -17.12500 35.31261 -9.36754
Data Management: Data entry
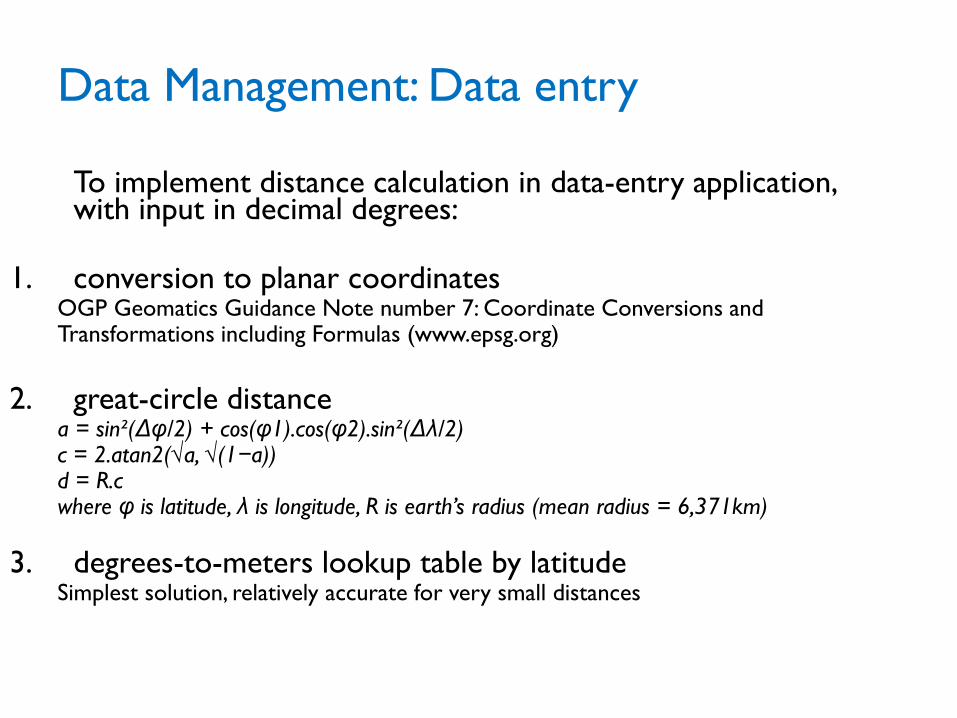
To implement distance calculation in data-entry application, with input in decimal degrees:
1. conversion to planar coordinates
OGP Geomatics Guidance Note number 7: Coordinate Conversions and Transformations including Formulas (www.epsg.org)
2. great-circle distance
a = sin²(Δφ/2) + cos(φ1).cos(φ2).sin²(Δλ/2) c = 2.atan2(√a, √(1−a)) d = R.c where φ is latitude, λ is longitude, R is earth’s radius (mean radius = 6,371km)
3. degrees-to-meters lookup table by latitude Simplest solution, relatively accurate for very small distances
Data Management: Data entry
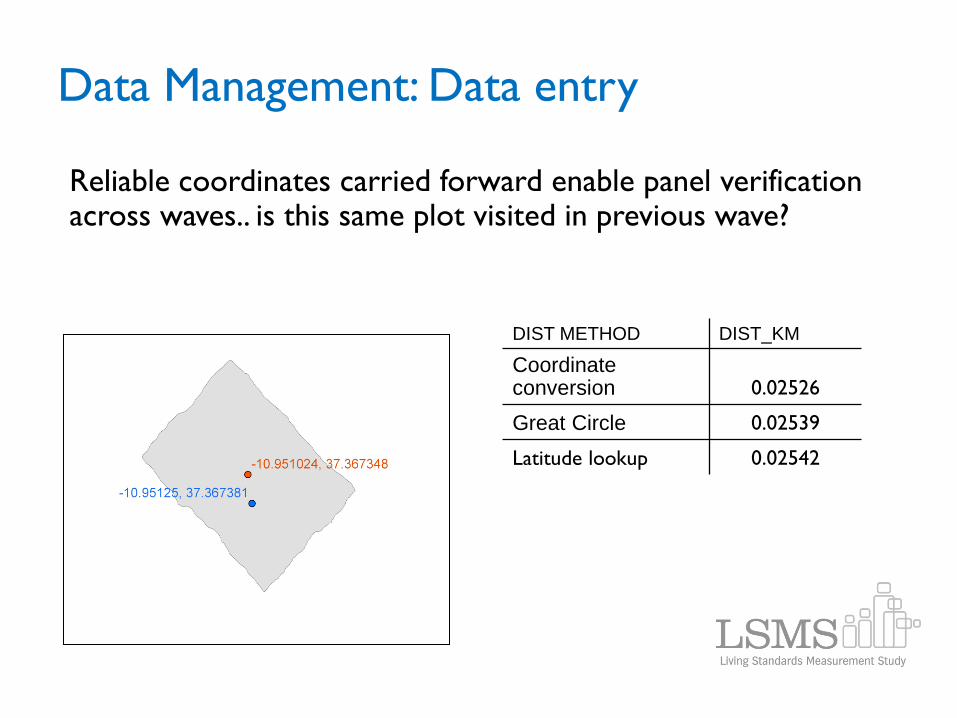
• Reliable coordinates carried forward enable panel verification across waves.. is this same plot visited in previous wave?
DIST METHOD DIST_KM
Coordinate conversion 0.02526
Great Circle 0.02539
Latitude lookup 0.02542
Data Management: Data entry
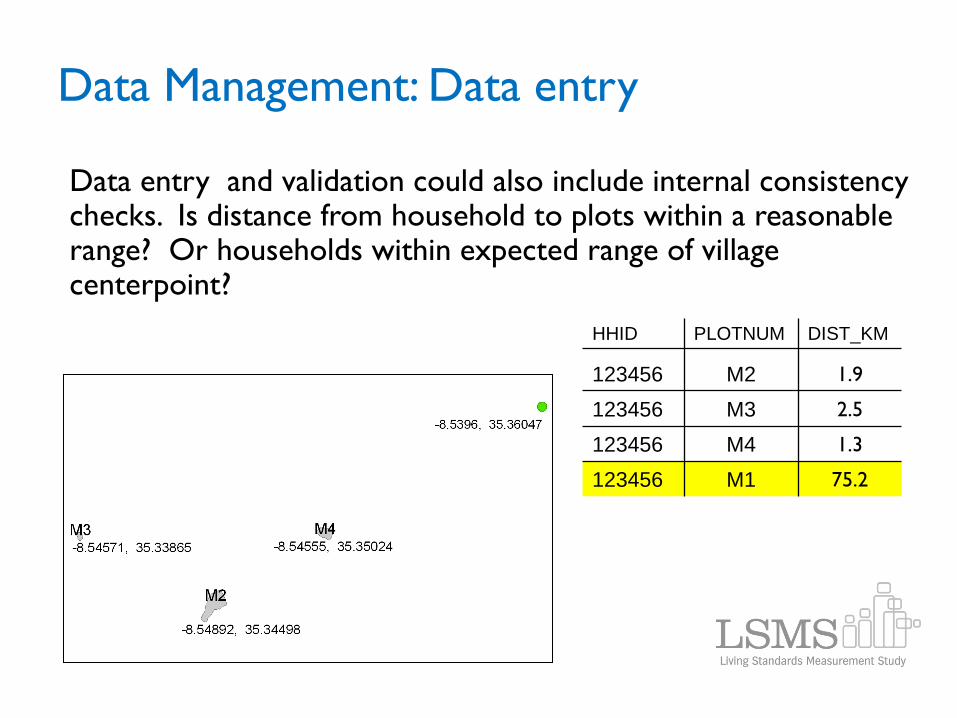
• Data entry and validation could also include internal consistency checks. Is distance from household to plots within a reasonable range? Or households within expected range of village centerpoint?
HHID PLOTNUM DIST_KM
123456 M2 1.9
123456 M3 2.5
123456 M4 1.3
123456 M1 75.2
Data Management: Data entry
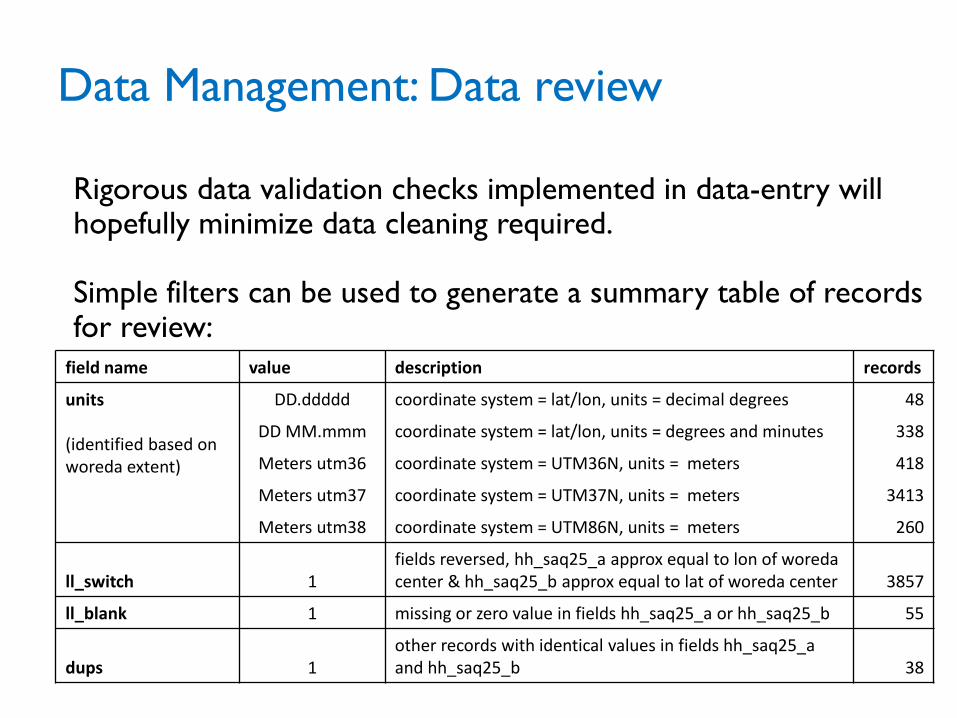
Rigorous data validation checks implemented in data-entry will hopefully minimize data cleaning required.
Simple filters can be used to generate a summary table of records
for review: field name value description records
units (identified based on woreda extent)
DD.ddddd coordinate system = lat/lon, units = decimal degrees 48
DD MM.mmm coordinate system = lat/lon, units = degrees and minutes 338
Meters utm36 coordinate system = UTM36N, units = meters 418
Meters utm37 coordinate system = UTM37N, units = meters 3413
Meters utm38 coordinate system = UTM86N, units = meters 260
ll_switch 1 fields reversed, hh_saq25_a approx equal to lon of woreda center & hh_saq25_b approx equal to lat of woreda center 3857
ll_blank 1 missing or zero value in fields hh_saq25_a or hh_saq25_b 55
dups 1 other records with identical values in fields hh_saq25_a and hh_saq25_b 38
Data Management: Data review
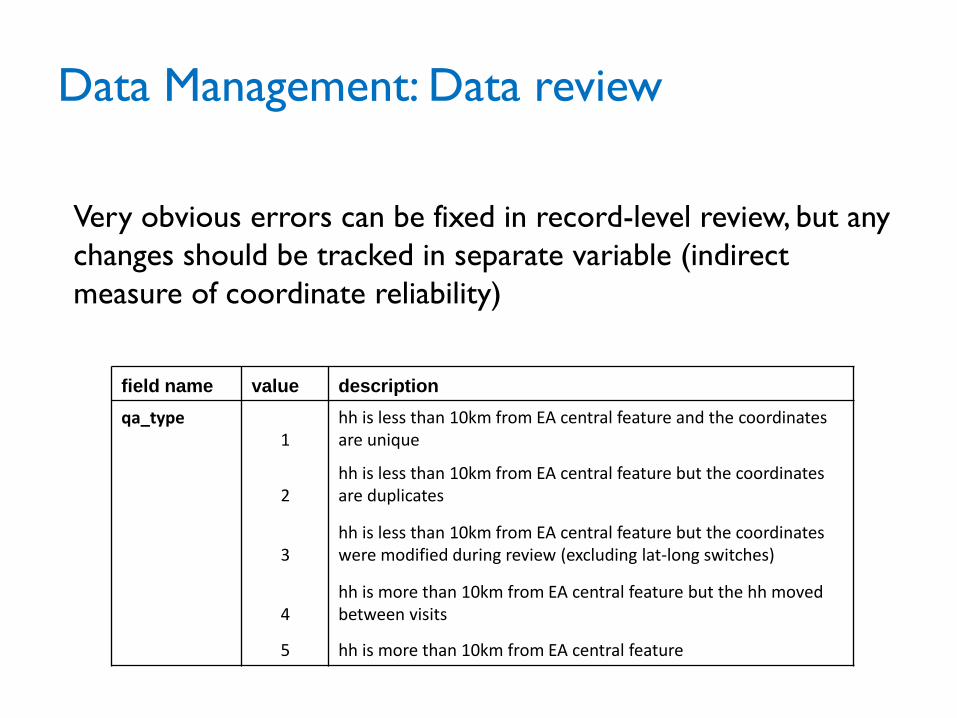
Very obvious errors can be fixed in record-level review, but any
changes should be tracked in separate variable (indirect
measure of coordinate reliability)
field name value description
qa_type 1
hh is less than 10km from EA central feature and the coordinates are unique
2 hh is less than 10km from EA central feature but the coordinates are duplicates
3 hh is less than 10km from EA central feature but the coordinates were modified during review (excluding lat-long switches)
4 hh is more than 10km from EA central feature but the hh moved between visits
5 hh is more than 10km from EA central feature
Data Management: Data review
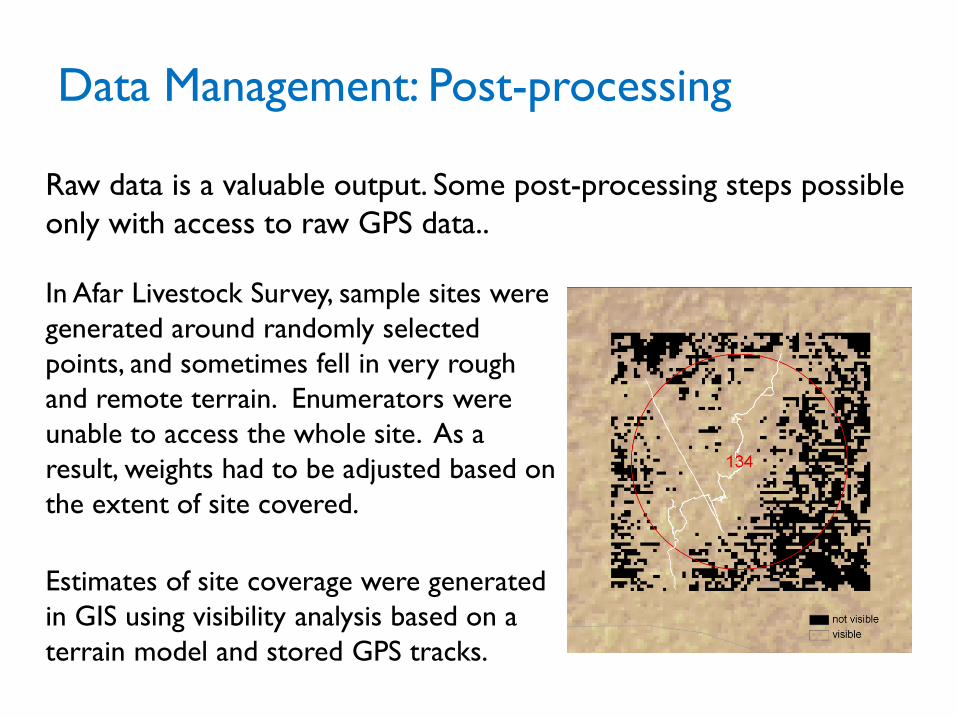
Raw data is a valuable output. Some post-processing steps possible
only with access to raw GPS data..
In Afar Livestock Survey, sample sites were
generated around randomly selected
points, and sometimes fell in very rough
and remote terrain. Enumerators were
unable to access the whole site. As a
result, weights had to be adjusted based on
the extent of site covered.
• Estimates of site coverage were generated
in GIS using visibility analysis based on a
terrain model and stored GPS tracks.
Data Management: Post-processing
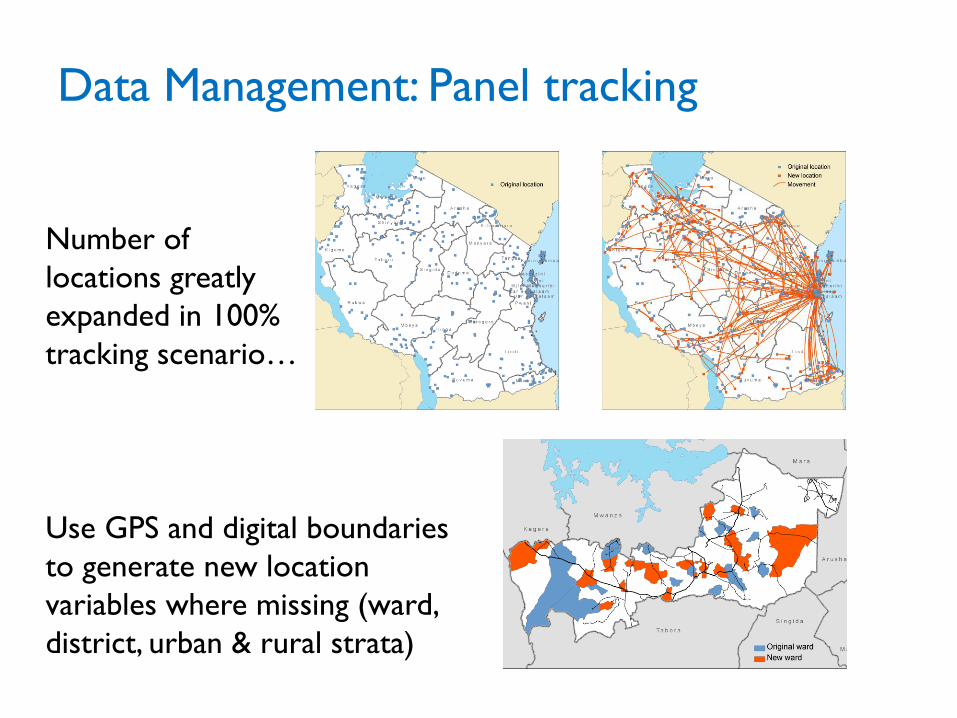
Number of
locations greatly
expanded in 100%
tracking scenario…
Use GPS and digital boundaries
to generate new location
variables where missing (ward,
district, urban & rural strata)
Data Management: Panel tracking
• Household GPS coordinates are confidential information, but
location information can be valuable for end-users
• For LSMS-ISA surveys we disseminate modified EA center-
points, offset to prevent identification of communities AND a
set of geovariables generated using the actual household
locations
• In order to preserve anonymity of households and individuals
we adopted method used by MeasureDHS progam, relies
primarily on random offset of cluster coordinates within a
specified range determined by population density
Dissemination

Household locations (red
squares) are averaged by EA (red
dot), and random displacement
applied to produce a public
version of the location (blue dot).
Blue circle represents
the known range of
uncertainty (5 km
radius of offset for 99%
of dataset).
Dissemination
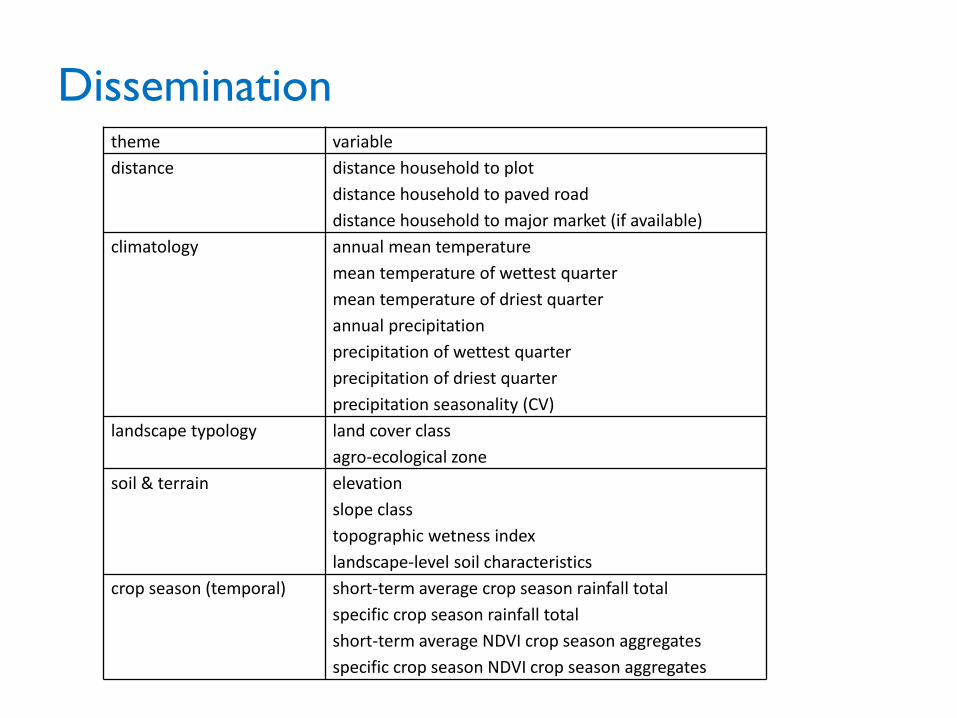
theme variable
distance distance household to plot
distance household to paved road
distance household to major market (if available)
climatology annual mean temperature
mean temperature of wettest quarter
mean temperature of driest quarter
annual precipitation
precipitation of wettest quarter
precipitation of driest quarter
precipitation seasonality (CV)
landscape typology land cover class
agro-ecological zone
soil & terrain elevation
slope class
topographic wetness index
landscape-level soil characteristics
crop season (temporal) short-term average crop season rainfall total
specific crop season rainfall total
short-term average NDVI crop season aggregates
specific crop season NDVI crop season aggregates
Dissemination
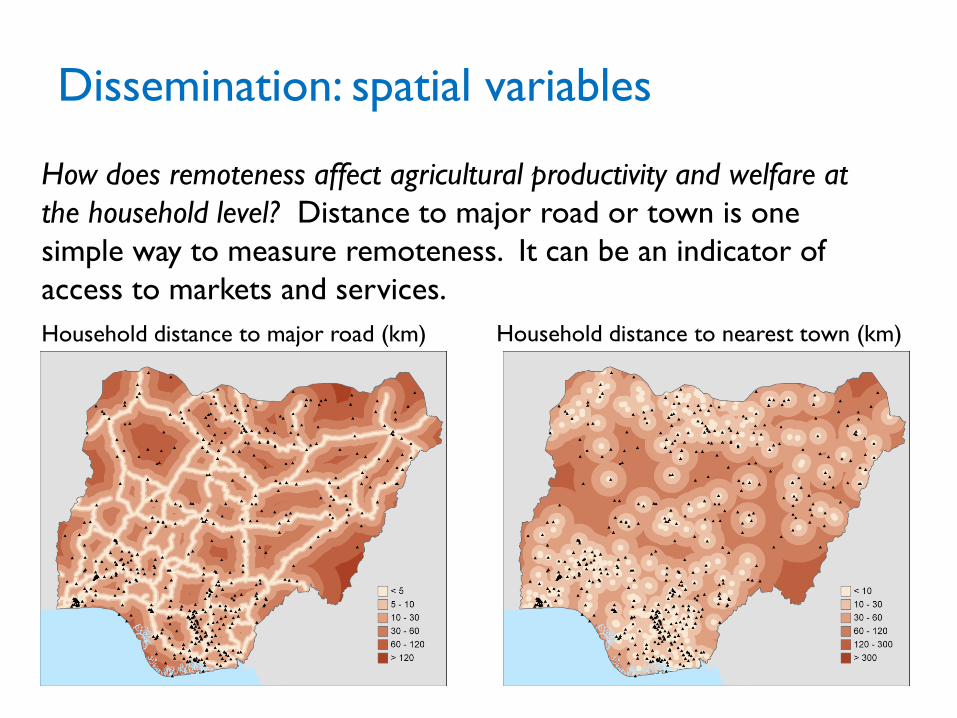
Dissemination: spatial variables
Household distance to major road (km)
How does remoteness affect agricultural productivity and welfare at
the household level? Distance to major road or town is one
simple way to measure remoteness. It can be an indicator of
access to markets and services.
Household distance to nearest town (km)
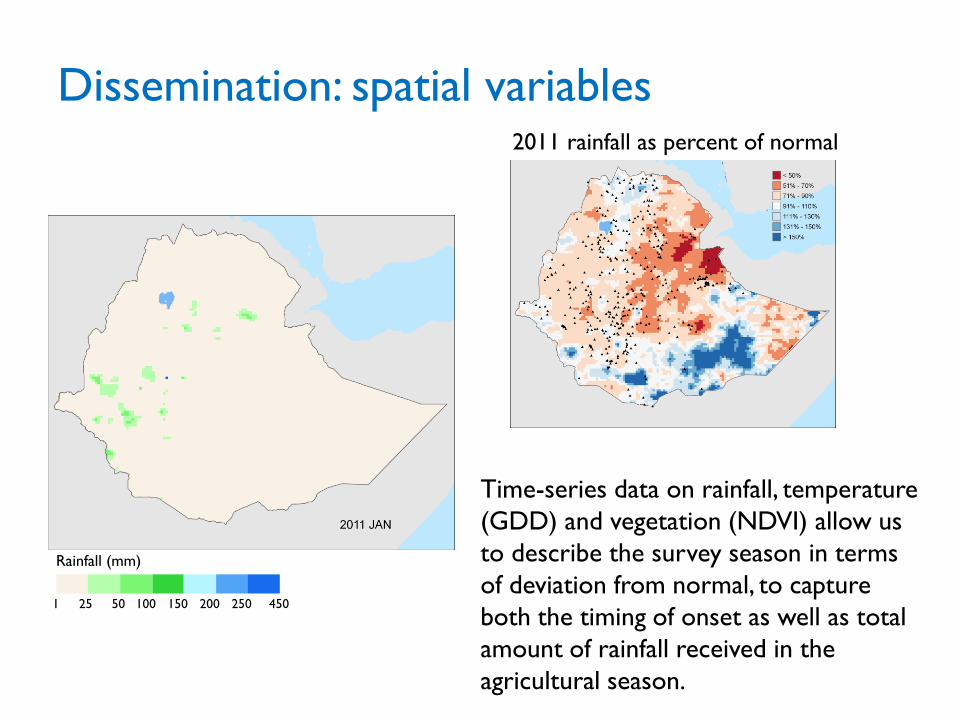
Dissemination: spatial variables 2011 rainfall as percent of normal
Rainfall (mm)
1 25 50 100 150 200 250 450
Time-series data on rainfall, temperature
(GDD) and vegetation (NDVI) allow us
to describe the survey season in terms
of deviation from normal, to capture
both the timing of onset as well as total
amount of rainfall received in the
agricultural season.
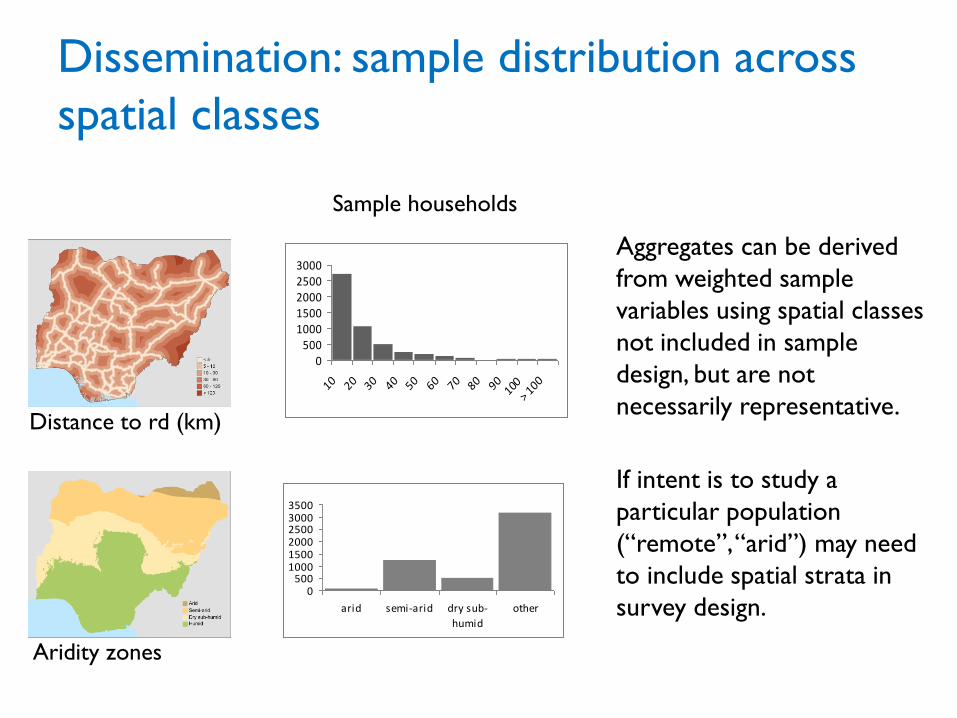
Dissemination: sample distribution across
spatial classes
Sample households
0500
10001500200025003000
10 20 30 40 50 60 70 80 90100
> 100
Distance to rd (km)
Aridity zones
Aggregates can be derived
from weighted sample
variables using spatial classes
not included in sample
design, but are not
necessarily representative.
If intent is to study a
particular population
(“remote”, “arid”) may need
to include spatial strata in
survey design.
0500
100015002000250030003500
arid semi-arid dry sub-
humid
other

Ethiopia Case Study
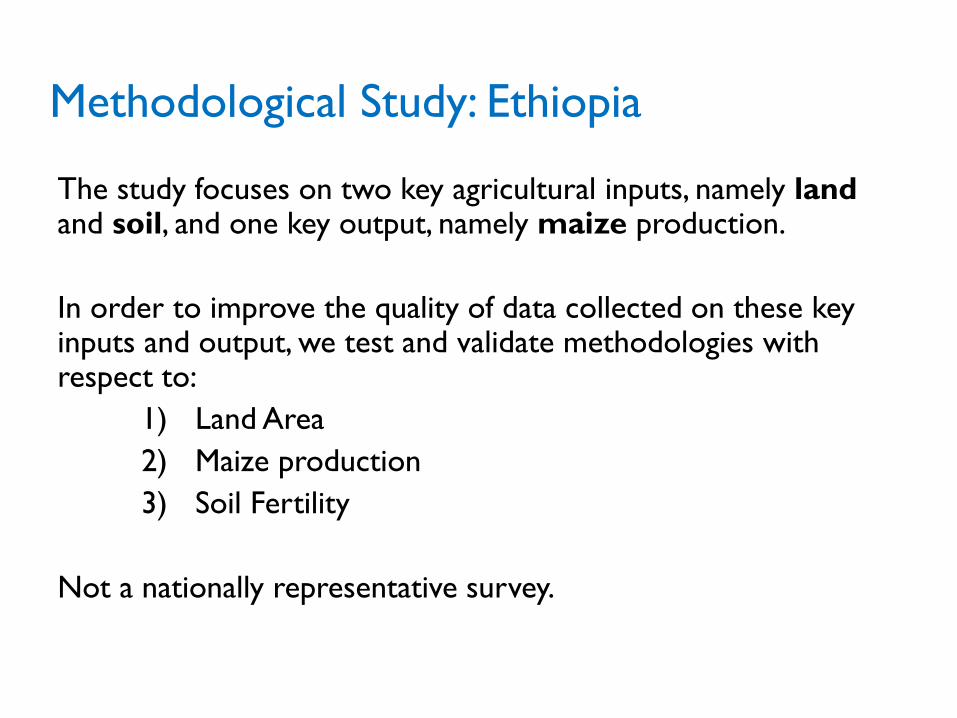
The study focuses on two key agricultural inputs, namely land and soil, and one key output, namely maize production.
In order to improve the quality of data collected on these key inputs and output, we test and validate methodologies with respect to:
1) Land Area
2) Maize production
3) Soil Fertility
Not a nationally representative survey.
Methodological Study: Ethiopia
GIS in Sampling: Ethiopia Site Selection
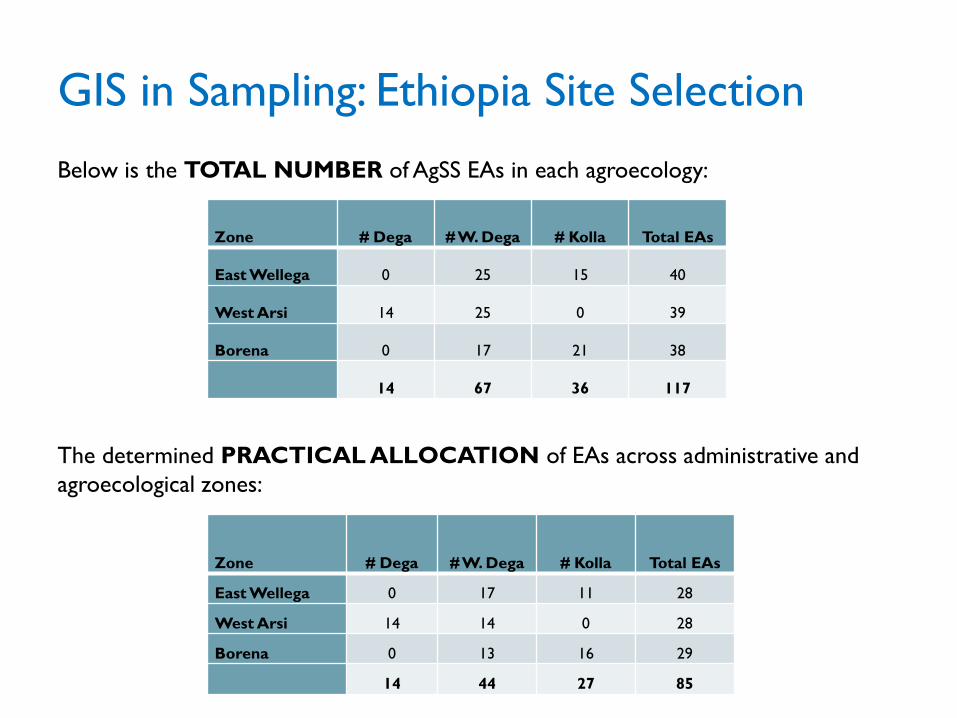
Zone # Dega # W. Dega # Kolla Total EAs
East Wellega 0 25 15 40
West Arsi 14 25 0 39
Borena 0 17 21 38
14 67 36 117
Below is the TOTAL NUMBER of AgSS EAs in each agroecology:
Zone # Dega # W. Dega # Kolla Total EAs
East Wellega 0 17 11 28
West Arsi 14 14 0 28
Borena 0 13 16 29
14 44 27 85
The determined PRACTICAL ALLOCATION of EAs across administrative and
agroecological zones:
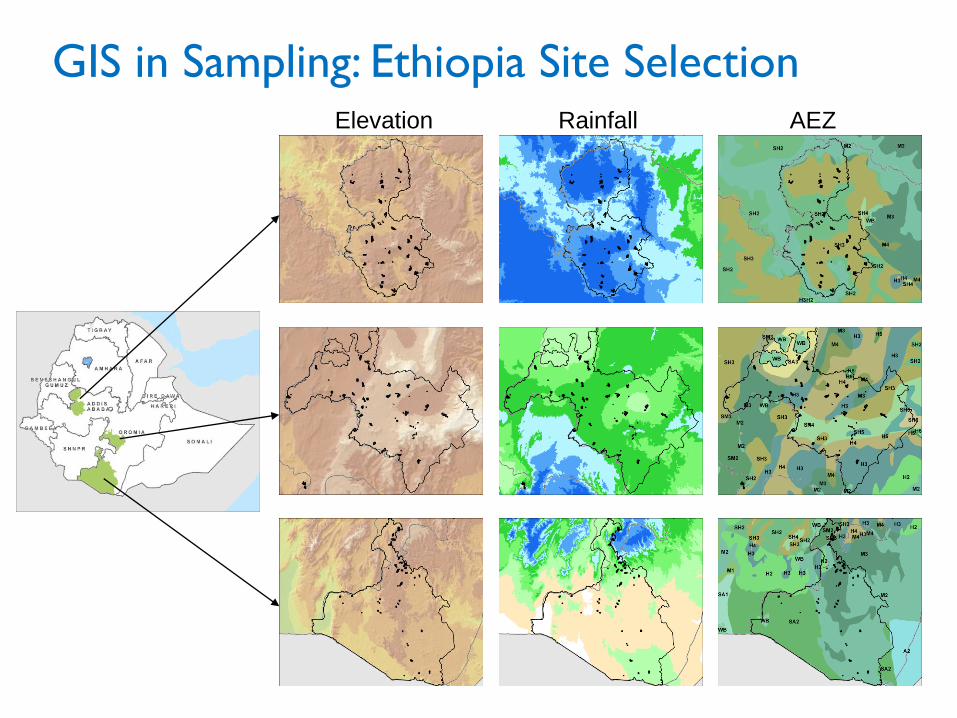
Elevation Rainfall AEZ
GIS in Sampling: Ethiopia Site Selection
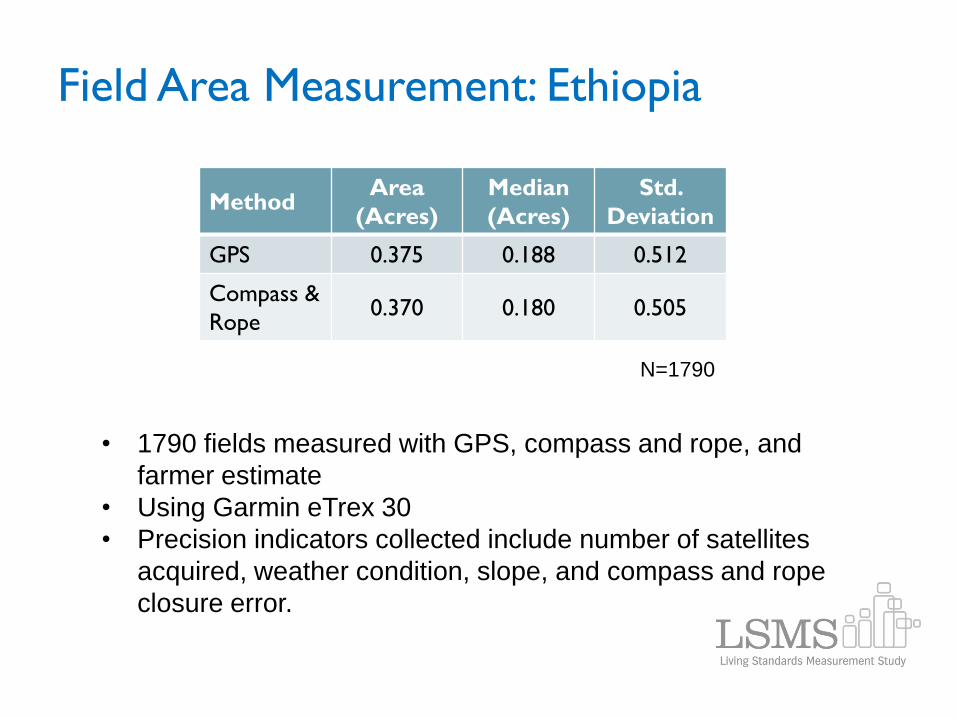
Field Area Measurement: Ethiopia
Method Area
(Acres)
Median
(Acres)
Std.
Deviation
GPS 0.375 0.188 0.512
Compass &
Rope 0.370 0.180 0.505
N=1790
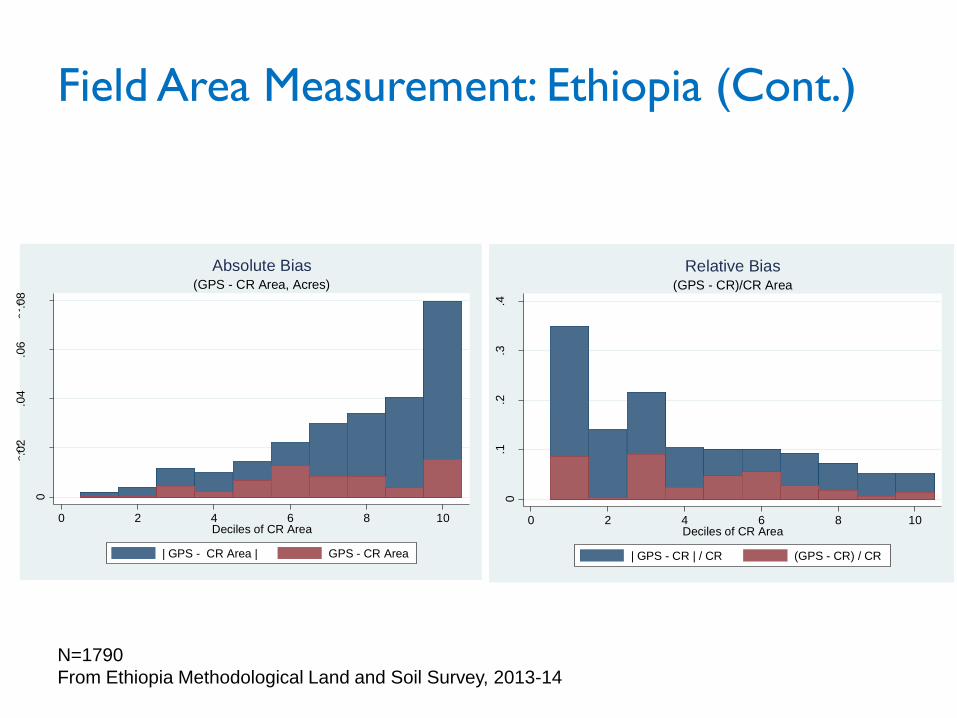
• 1790 fields measured with GPS, compass and rope, and
farmer estimate
• Using Garmin eTrex 30
• Precision indicators collected include number of satellites
acquired, weather condition, slope, and compass and rope
closure error.
0
.00
5.0
1.0
15
Ave
rag
e B
ias (
GP
S -
CR
)
0 2 4 6 8 10
Deciles of CR Area
(GPS - CR Area, Acres)
Absolute Bias
0
.02
.04
.06
.08
.1
Ave
rag
e R
ela
tive
Bia
s
0 2 4 6 8 10Deciles of CR Area
(GPS - CR)/CR Area
Relative Bias
0
.02
.04
.06
.08
0 2 4 6 8 10Deciles of CR Area
| GPS - CR Area | GPS - CR Area
(GPS - CR Area, Acres)
Absolute Bias
0.1
.2.3
.4
0 2 4 6 8 10Deciles of CR Area
| GPS - CR | / CR (GPS - CR) / CR
(GPS - CR)/CR Area
Relative Bias
Field Area Measurement: Ethiopia (Cont.)
N=1790
From Ethiopia Methodological Land and Soil Survey, 2013-14
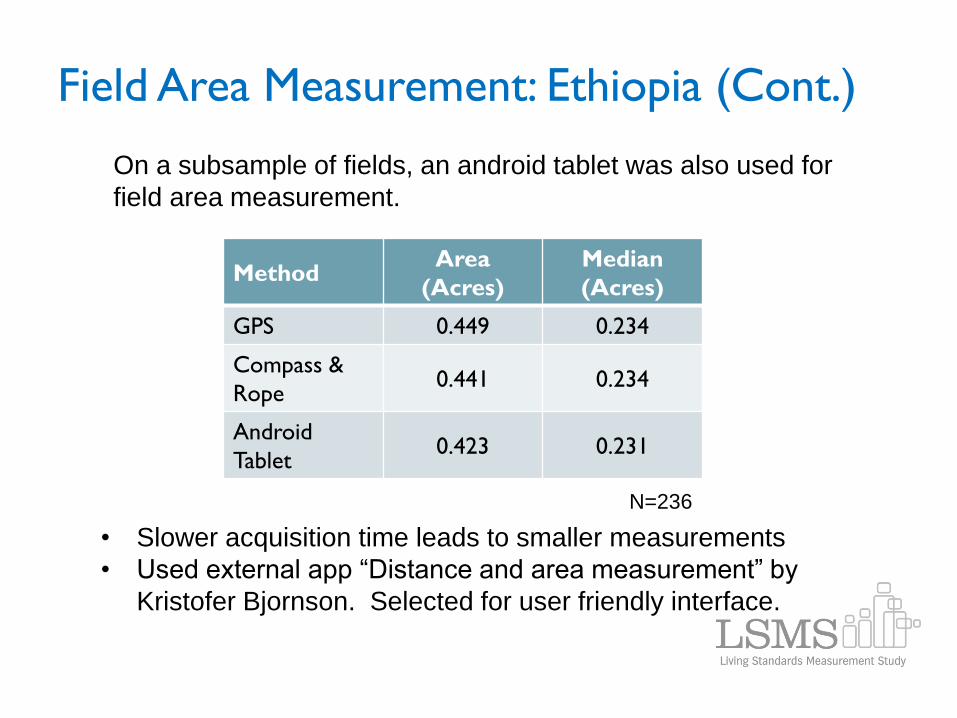
Field Area Measurement: Ethiopia (Cont.)
Method Area
(Acres)
Median
(Acres)
GPS 0.449 0.234
Compass &
Rope 0.441 0.234
Android
Tablet 0.423 0.231
N=236
• Slower acquisition time leads to smaller measurements
• Used external app “Distance and area measurement” by
Kristofer Bjornson. Selected for user friendly interface.
On a subsample of fields, an android tablet was also used for
field area measurement.
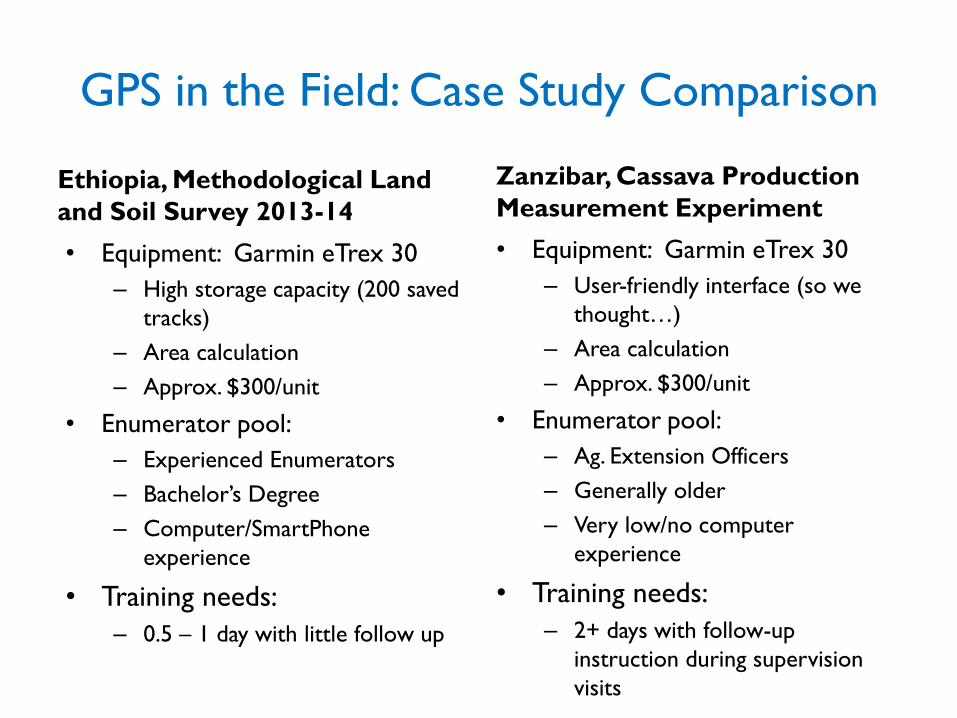
Ethiopia, Methodological Land
and Soil Survey 2013-14
• Equipment: Garmin eTrex 30
– High storage capacity (200 saved
tracks)
– Area calculation
– Approx. $300/unit
• Enumerator pool:
– Experienced Enumerators
– Bachelor’s Degree
– Computer/SmartPhone
experience
• Training needs:
– 0.5 – 1 day with little follow up
Zanzibar, Cassava Production
Measurement Experiment
• Equipment: Garmin eTrex 30
– User-friendly interface (so we
thought…)
– Area calculation
– Approx. $300/unit
• Enumerator pool:
– Ag. Extension Officers
– Generally older
– Very low/no computer
experience
• Training needs:
– 2+ days with follow-up
instruction during supervision
visits
GPS in the Field: Case Study Comparison
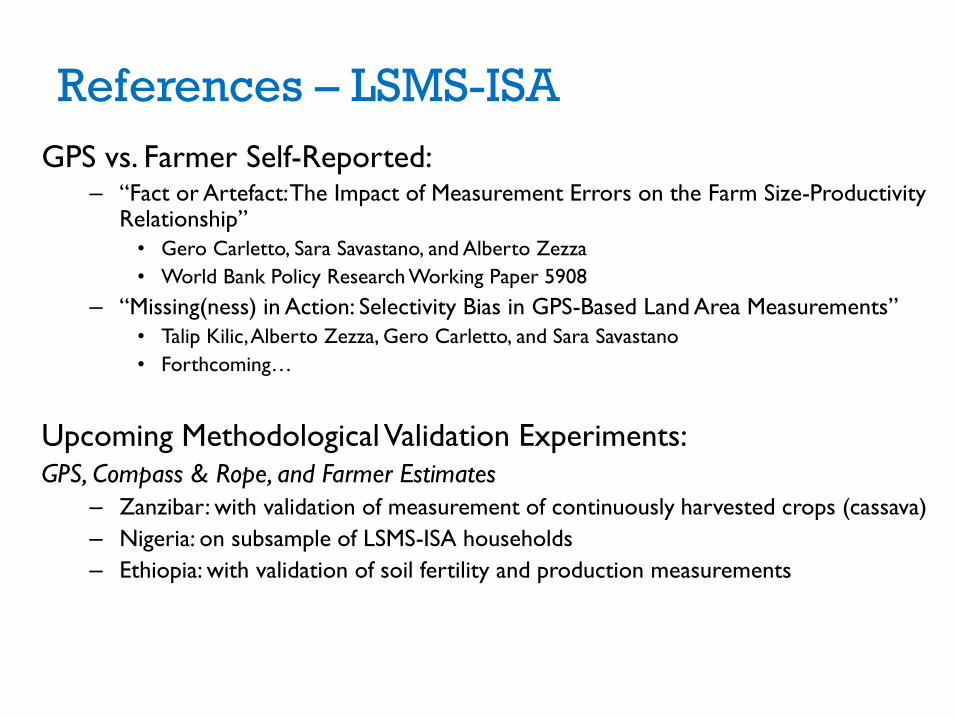
GPS vs. Farmer Self-Reported: – “Fact or Artefact: The Impact of Measurement Errors on the Farm Size-Productivity
Relationship”
• Gero Carletto, Sara Savastano, and Alberto Zezza
• World Bank Policy Research Working Paper 5908
– “Missing(ness) in Action: Selectivity Bias in GPS-Based Land Area Measurements”
• Talip Kilic, Alberto Zezza, Gero Carletto, and Sara Savastano
• Forthcoming…
Upcoming Methodological Validation Experiments: GPS, Compass & Rope, and Farmer Estimates
– Zanzibar: with validation of measurement of continuously harvested crops (cassava)
– Nigeria: on subsample of LSMS-ISA households
– Ethiopia: with validation of soil fertility and production measurements
References – LSMS-ISA
References
• "Using the global positioning system in household surveys for better economics and better policy," Policy Research Working Paper Series 4195, The World Bank. Gibson, John & McKenzie, David, 2007.
• Putting People on the Map: Protecting Confidentiality with Linked Social-Spatial Data. National Research Council. (2007).
• Incorporating Geographic Information Into Demographic and Health Surveys: A Field Guide to GPS Data Collection. MeasureDHS
• LSMS website – manuals and other survey documentation
GPS Resources
• GPS Babel (http://www.gpsbabel.org/)
• GPSU (http://www.gpsu.co.uk/)
• DNR Garmin
(http://www.dnr.state.mn.us/mis/gis/tools/arcview/extensions/
DNRGarmin/DNRGarmin.html)
• proprietary software:
GarminWaypoint Manager,
Trimble TerraSync, etc


![High Redshift - Rijksuniversiteit Groningennobels/presentation_high-z_Nobels.pdf · Weak lensing surveys: Subaru [Hamana et al., 2009] BAO and ELG: BigBOSS [Schlegel et al., 2011]](https://static.fdocument.org/doc/165x107/5f825d5a20277a31dd595250/high-redshift-rijksuniversiteit-nobelspresentationhigh-znobelspdf-weak-lensing.jpg)