
Modeling Visual Cognition
70
ΣΨ Modeling Visual Cognition – encoding, attention, and short-term memory Doctoral Dissertation in Psychology Søren Kyllingsbæk Department of Psychology University of Copenhagen
Transcript of Modeling Visual Cognition
ΣΨModeling Visual Cognition
– encoding, attention, and short-term memory
Doctoral Dissertation in Psychology
Søren Kyllingsbæk
Department of PsychologyUniversity of Copenhagen
Copyright c© 2013 by Søren Kyllingsbæk
Typeset by Søren Kyllingsbæk
Printed in Denmark at Grafisk – Københavns Univer-sitet, Copenhagen, Denmark
ISBN 978-87-996351-1-5

Philosophy is written in this grand book—I mean the universe—which stands continu-ally open to our gaze, but it cannot be under-stood unless one first learns to comprehendthe language and interpret the characters inwhich it is written. It is written in the lan-guage of mathematics, [...] without these,one is wandering around in a dark labyrinth.
Galileo
i

ii
Articles
1. Kyllingsbæk, S., Markussen, B., & Bundesen, C.(2012). Testing a Poisson counter model for vi-sual identification of briefly presented, mutuallyconfusable single stimuli in pure accuracy tasks.Journal of Experimental Psychology: Human Per-ception and Performance, 38, 628-642.
2. Kyllingsbæk, S., & Bundesen, C. (2007). Parallelprocessing in a multifeature whole-report paradigm.Journal of Experimental Psychology: Human Per-ception and Performance, 33, 64-82.
3. Kyllingsbæk, S., Valla, C., Vanrie, J., & Bunde-sen, C. (2007). Effects of spatial separation be-tween stimuli in whole report from brief visualdisplays. Perception & Psychophysics, 69, 1040-1050.
4. Bundesen, C., Habekost, T., & Kyllingsbæk, S.(2005). A neural theory of visual attention. Bridg-ing cognition and neurophysiology. PsychologicalReview, 112, 291-328.
5. Petersen, A. E., Kyllingsbæk, S., & Bundesen, C.(2012). Measuring and modeling attentional dwelltime. Psychonomic Bulletin & Review, 19, 1029-1046.
iii
6. Kyllingsbæk, S. (2006). Modeling visual atten-tion. Behavior Research Methods, 38, 123-133.
7. Kyllingsbæk, S., Sy, J. L., & Giesbrecht, B. (2011).Understanding the allocation of attention whenfaced with varying perceptual load in partial re-port: A computational approach. Neuropsycholo-gia, 49, 1487-1497.
8. Kyllingsbæk, S., & Bundesen, C. (2009). Chang-ing change detection: Improving the reliability ofmeasures of visual short-term memory capacity.Psychonomic Bulletin & Review, 16, 1000-1010.
9. Dyrholm, M., Kyllingsbæk, S., Espeseth, T., &Bundesen, C. (2011). Generalizing parametric mod-els by introducing trial-by-trial parameter vari-ability: the case of TVA. Journal of MathematicalPsychology, 55, 416-429.
Note: The experimental data presented in articles 2and 3 have been presented in a preliminary form inthe author’s PhD thesis published in 2001 (Kyllingsbæk,2001).
iv
Preface
This doctoral dissertation represents a collection of ex-perimental and theoretical studies by the author accom-plished in collaboration with colleagues, PhD students,and students at the Center for Visual Cognition, Depart-ment of Psychology, at the University of Copenhagen aswell as colleagues at other departments at the Univer-sity of Copenhagen and collaborators at the Universityof California, Santa Barbara, and the University of Oslo.The research was supported by the Carlsberg Founda-tion, the Danish Council for Strategic Research, theSapere Aude Program of the Danish Research Councilfor Independent Research, and the University of Copen-hagen.
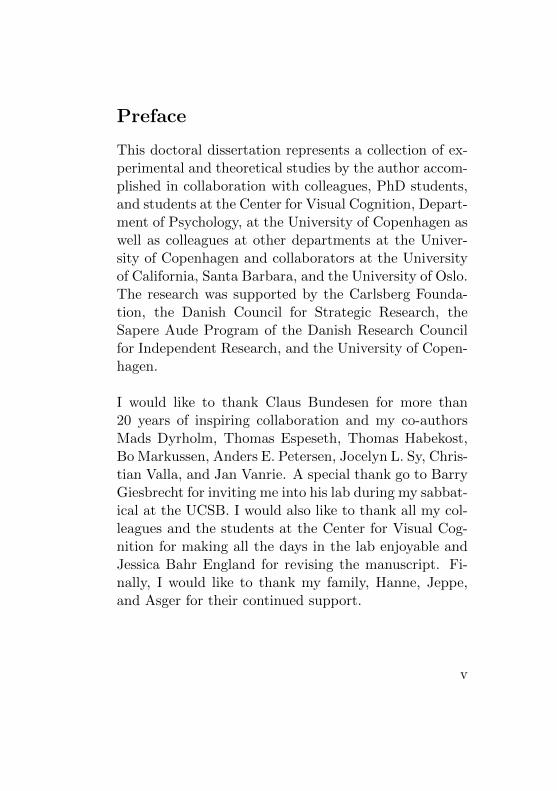
I would like to thank Claus Bundesen for more than20 years of inspiring collaboration and my co-authorsMads Dyrholm, Thomas Espeseth, Thomas Habekost,Bo Markussen, Anders E. Petersen, Jocelyn L. Sy, Chris-tian Valla, and Jan Vanrie. A special thank go to BarryGiesbrecht for inviting me into his lab during my sabbat-ical at the UCSB. I would also like to thank all my col-leagues and the students at the Center for Visual Cog-nition for making all the days in the lab enjoyable andJessica Bahr England for revising the manuscript. Fi-nally, I would like to thank my family, Hanne, Jeppe,and Asger for their continued support.
v

vi
Contents
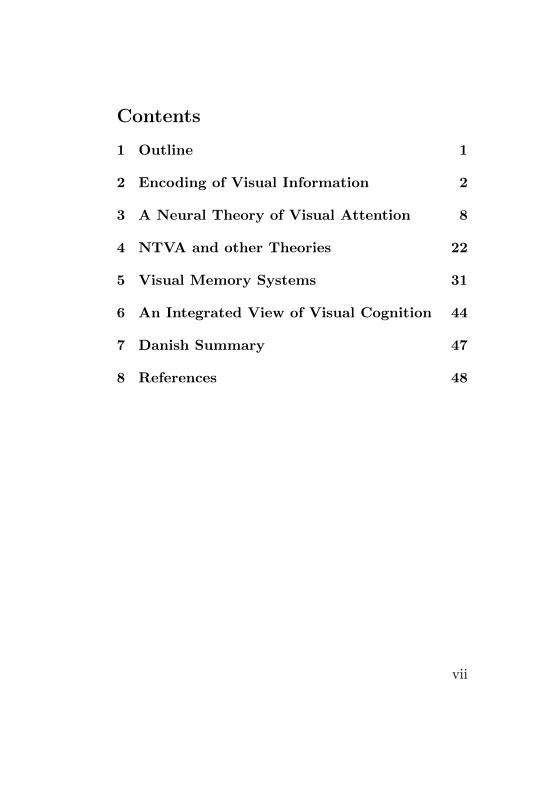
1 Outline 1
2 Encoding of Visual Information 2
3 A Neural Theory of Visual Attention 8
4 NTVA and other Theories 22
5 Visual Memory Systems 31
6 An Integrated View of Visual Cognition 44
7 Danish Summary 47
8 References 48
vii

1 Outline
The topic of the research presented in this dissertationis visual cognition in general, and more specifically thedevelopment of computational models of visual percep-tion, visual attention, and visual short-term memory(VSTM). The models were constructed with the aim ofbeing as parsimonious as possible, while exhibiting highvalidity in relation to both their structure and parame-ters. The latter determines whether the models are validin terms of their direct link to psychologically meaning-ful concepts such as the rate of encoding of stimulusinformation and the amount of information that can beretained in memory. An additional aim of the researchpresented in this dissertation was to extend these mod-els to explain the mechanism of the underlying neuralstructures, which form the biological basis of the cogni-tive processes.
The first part of the dissertation comprises a pre-sentation of experimental studies and theoretical workon the question of how visual information is encodedwhen one or more stimuli are identified. This leads toa presentation of the Neural Theory of Visual Atten-tion (NTVA; Bundesen, Habekost, & Kyllingsbæk, 2005,2011) followed by an integrated view of visual memorywhere the nature of and links between sensory memory,visual short-term memory, and visual long-term memoryare discussed.
1
2 Encoding of Visual Information
Visual identification of stimuli is achieved through a se-ries of processing steps, beginning with early sensoryprocessing in the retina and continuing in the lateralgeniculate nuclei of the thalamus and early visual ar-eas in the occipital cortex (e.g., Wandell, 1995). Duringthese early stages, visual object segmentation is per-formed whereby the visual scene is partitioned into can-didate regions that correspond to distinct objects in theworld (e.g., Logan, 1996; Marr, 1982). Eventually, theinformation from these segmented areas makes contactwith representations of different visual categories/featuresin visual long-term memory (VLTM). In the presentframework, it is assumed that this process of matchingthe stimulus information with representations in VLTMleads to computation of sensory evidence values, η(x, i).These values specify to what degree a given object xhas a certain visual feature i. The sensory evidence isthen weighted by the subjective perceptual response bias,βi, associated with each visual category i, so that ex-pectancy and utility may influence the resulting catego-rization of the stimulus. Theories of the perceptual deci-sion process that incorporate the basic notion of sensoryevidence and perceptual response bias were proposedearly on by Shepard (1957, 1958a, 1958b) and Luce(1963) in the famous Shepard-Luce bias-choice model.
After the visual stimuli have been categorized, thisinformation must be retained in order to influence sub-
2
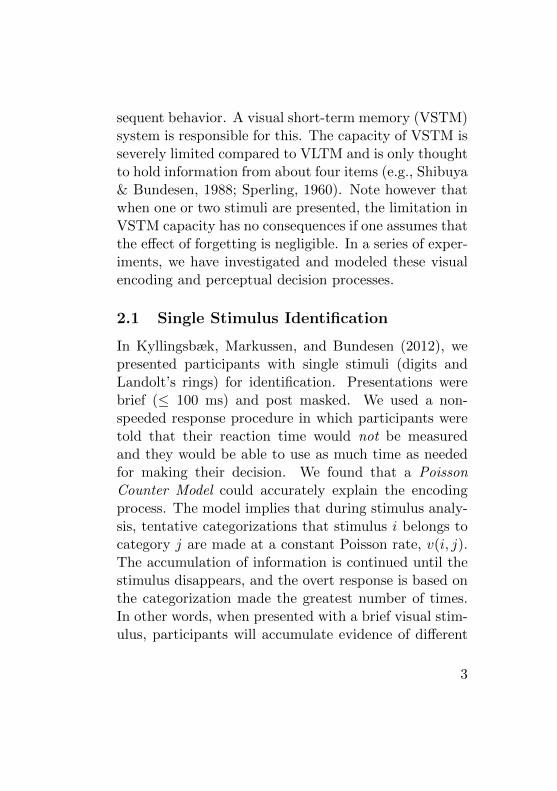
sequent behavior. A visual short-term memory (VSTM)system is responsible for this. The capacity of VSTM isseverely limited compared to VLTM and is only thoughtto hold information from about four items (e.g., Shibuya& Bundesen, 1988; Sperling, 1960). Note however thatwhen one or two stimuli are presented, the limitation inVSTM capacity has no consequences if one assumes thatthe effect of forgetting is negligible. In a series of exper-iments, we have investigated and modeled these visualencoding and perceptual decision processes.
2.1 Single Stimulus Identification
In Kyllingsbæk, Markussen, and Bundesen (2012), wepresented participants with single stimuli (digits andLandolt’s rings) for identification. Presentations werebrief (≤ 100 ms) and post masked. We used a non-speeded response procedure in which participants weretold that their reaction time would not be measuredand they would be able to use as much time as neededfor making their decision. We found that a PoissonCounter Model could accurately explain the encodingprocess. The model implies that during stimulus analy-sis, tentative categorizations that stimulus i belongs tocategory j are made at a constant Poisson rate, v(i, j).The accumulation of information is continued until thestimulus disappears, and the overt response is based onthe categorization made the greatest number of times.In other words, when presented with a brief visual stim-ulus, participants will accumulate evidence of different
3

possible categorizations of the stimulus while it is beingexposed. After the offset of the stimulus, the partic-ipant will reach a decision by comparing the evidenceand choosing the response for which most evidence hasbeen accumulated. Given these assumptions, the prob-ability, P (i, j), of reporting category j when presentedwith stimulus i and the counts accumulated for categoryj is higher than the counts for any other categories, maybe derived:
P (i, j) =∞∑n=1
v(i, j)n(t− t0)n
n!e−v(i,j)(t−t0) (1)
·∏
k∈R−{j}
n−1∑m=0
v(i, k)m(t− t0)m
m!e−v(i,k)(t−t0),
where n represents the number of counts for catego-rization j, R is the set of responses, k runs across theset of responses excluding j, m represents the numberof counts for these responses, and t0 is the perceptualthreshold so that P (i, j) = 0 for t0 > t.
Similarly, equations for the probability of reportingwhen ties between several counters occur or when noneof the categories accumulate any counts may also bederived (see Kyllingsbæk et al., 2012).
4
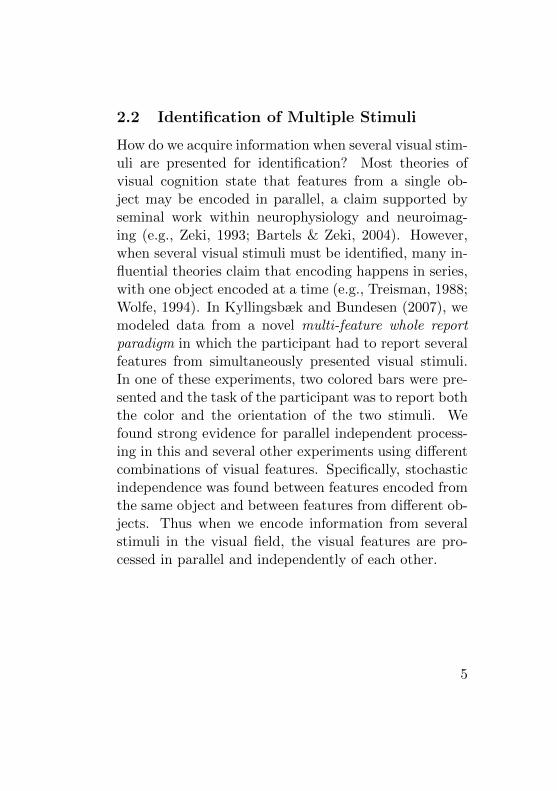
2.2 Identification of Multiple Stimuli
How do we acquire information when several visual stim-uli are presented for identification? Most theories ofvisual cognition state that features from a single ob-ject may be encoded in parallel, a claim supported byseminal work within neurophysiology and neuroimag-ing (e.g., Zeki, 1993; Bartels & Zeki, 2004). However,when several visual stimuli must be identified, many in-fluential theories claim that encoding happens in series,with one object encoded at a time (e.g., Treisman, 1988;Wolfe, 1994). In Kyllingsbæk and Bundesen (2007), wemodeled data from a novel multi-feature whole reportparadigm in which the participant had to report severalfeatures from simultaneously presented visual stimuli.In one of these experiments, two colored bars were pre-sented and the task of the participant was to report boththe color and the orientation of the two stimuli. Wefound strong evidence for parallel independent process-ing in this and several other experiments using differentcombinations of visual features. Specifically, stochasticindependence was found between features encoded fromthe same object and between features from different ob-jects. Thus when we encode information from severalstimuli in the visual field, the visual features are pro-cessed in parallel and independently of each other.
5
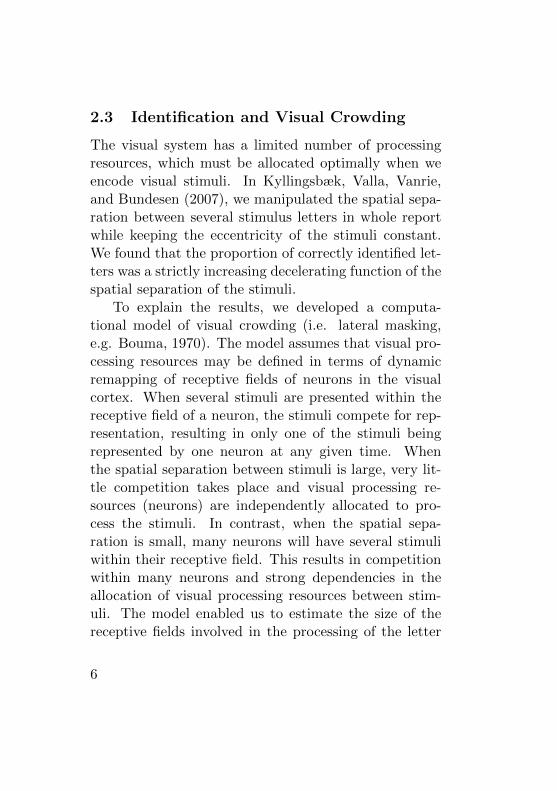
2.3 Identification and Visual Crowding
The visual system has a limited number of processingresources, which must be allocated optimally when weencode visual stimuli. In Kyllingsbæk, Valla, Vanrie,and Bundesen (2007), we manipulated the spatial sepa-ration between several stimulus letters in whole reportwhile keeping the eccentricity of the stimuli constant.We found that the proportion of correctly identified let-ters was a strictly increasing decelerating function of thespatial separation of the stimuli.
To explain the results, we developed a computa-tional model of visual crowding (i.e. lateral masking,e.g. Bouma, 1970). The model assumes that visual pro-cessing resources may be defined in terms of dynamicremapping of receptive fields of neurons in the visualcortex. When several stimuli are presented within thereceptive field of a neuron, the stimuli compete for rep-resentation, resulting in only one of the stimuli beingrepresented by one neuron at any given time. Whenthe spatial separation between stimuli is large, very lit-tle competition takes place and visual processing re-sources (neurons) are independently allocated to pro-cess the stimuli. In contrast, when the spatial sepa-ration is small, many neurons will have several stimuliwithin their receptive field. This results in competitionwithin many neurons and strong dependencies in theallocation of visual processing resources between stim-uli. The model enabled us to estimate the size of thereceptive fields involved in the processing of the letter
6
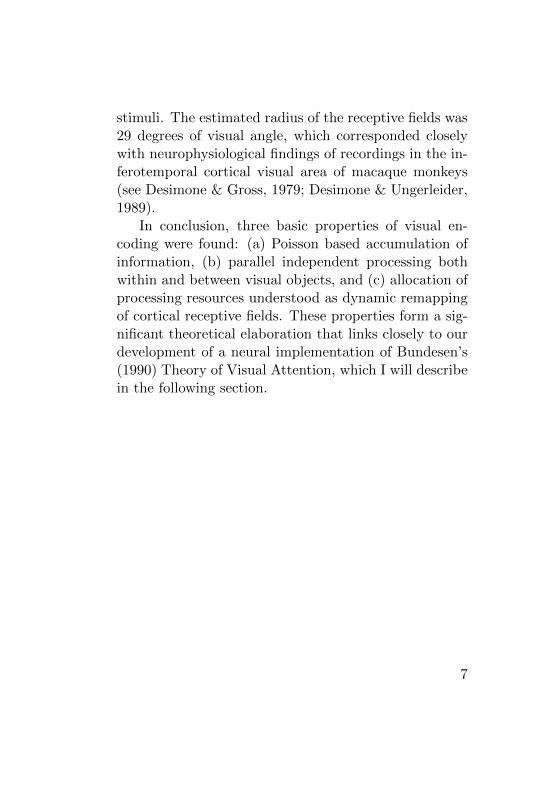
stimuli. The estimated radius of the receptive fields was29 degrees of visual angle, which corresponded closelywith neurophysiological findings of recordings in the in-ferotemporal cortical visual area of macaque monkeys(see Desimone & Gross, 1979; Desimone & Ungerleider,1989).
In conclusion, three basic properties of visual en-coding were found: (a) Poisson based accumulation ofinformation, (b) parallel independent processing bothwithin and between visual objects, and (c) allocation ofprocessing resources understood as dynamic remappingof cortical receptive fields. These properties form a sig-nificant theoretical elaboration that links closely to ourdevelopment of a neural implementation of Bundesen’s(1990) Theory of Visual Attention, which I will describein the following section.
7
3 A Neural Theory of Visual Atten-tion
3.1 Background
The Neural Theory of Visual Attention (NTVA) pre-sented in Bundesen et al. (2005) is based on the earlierTheory of Visual Attention (TVA) by Bundesen (1990).TVA is a combined theory of recognition and selection.Whereas many theories of visual attention separate thetwo processes both in time and in representation, TVAinstantiates the two processes in a unified mechanismimplemented as a race model of both selection and recog-nition. In other words, when an object in the visual fieldis recognized, it is also selected at the same time andvice versa. By the unification of selection and recog-nition TVA tries to resolve the long-standing debate ofearly versus late selection. The first position claims thatselection occurs prior to recognition (e.g., Broadbent,1958) while the second claims that recognition is theprecursor for selection (e.g., Deutsch & Deutsch, 1963).According to TVA, elements in the visual field are pro-cessed in parallel. Visual processing is a two-stage pro-cess comprised of (a) an initial match of the visual im-pression with VLTM representations followed by (b) aselection/recognition race for representation in VSTM.
8
3.2 The first stage: computation of η values
According to TVA, visual processing starts with a mas-sively parallel comparison (matching) between objectsin the visual field and representations in VLTM. Thisprocess has unlimited capacity in the sense that thetime it takes to process objects is independent of thenumber of objects in the visual field. The end resultof the matching process is the computation of sensoryevidence values, η(x, i), each measuring the degree of amatch between a given object x and a long-term mem-ory representation (category) i. η values are affected bythe visibility (e.g. contrast) of the visual stimuli as wellas the degrees of pattern match between the stimuli andthe representations in VLTM. The latter is affected bylearning, which may lead to change in or even devel-opment of new representations in VLTM. For example,one may learn to read one’s own name faster than otherfirst names (cf. Bundesen, Kyllingsbæk, Houmann, &Jensen, 1997). Altogether, η values are affected only by“objective” properties of the visual environment and theVLTM of the perceiver, not by “subjective” propertiessuch as the pertinence of certain objects or categoriza-tion bias.
3.3 The second stage: the race
Different categorizations of the objects in the visual fieldcompete for entrance into VSTM in a stochastic raceprocess. The capacity of VSTM is limited to K el-
9
ements, typically around four. Categorizations of thefirst K visual objects to finish processing are stored inVSTM (the first K winners of the race). Categorizationsfrom other elements are lost. Note that categorizationsfrom elements already represented by other categoriza-tions may freely enter VSTM even though it is full. ThusVSTM is limited with respect to the number of elementsof which categorizations may be stored, not the numberof categorizations of the elements represented (see Awh,Barton, & Vogel, 2007; Duncan, 1984; Luck & Vogel,1997, but see also Wheeler & Treisman, 2002)
As stated above, visual objects are processed in par-allel in TVA. Furthermore, the theory assumes indepen-dence between visual categorizations of different objectsand between different types of categorizations of thesame object. Consider a situation in which only twoobjects are present in the visual field and are judgedaccording to color and shape. Assuming that VSTMcapacity is larger than two, VSTM is not a limiting fac-tor. If attentional parameters are kept constant, TVApredicts that the probability of the first object beingcorrectly categorized with respect to color is indepen-dent of whether the object is correctly categorized withrespect to shape. The probability is also independent ofwhether the second object is correctly categorized withrespect to color or shape (as we found in Kyllingsbæk& Bundesen, 2007).
To determine the rate of processing of each catego-rization of an element, the η values are combined with
10
two types of “subjective” values, pertinence and bias.As suggested by Broadbent (1971), two different atten-tional mechanisms are necessary for adequate behavior:one for filtering (based on pertinence) and one for pi-geonholing (based on bias). For example, if participantsare instructed to report the identity of black target let-ters amongst white distractor letters, the white distrac-tors must be filtered out, and the black targets mustbe categorized with respect to letter identity. In TVAterms, pertinence should be high for black stimuli andlow for white stimuli and bias should be high for let-ter identities and low for all other categories. In otherwords, filtering is based on color and pigeonholing onthe letter identity. The rate of processing v(x, i) of acategorization in the race is given by two equations. Bythe rate equation,
v(x, i) = η(x, i)βiwx∑z∈S wz
, (2)
where η(x, i) is the strength of the sensory evidence thatelement x belongs to category i, βi is the perceptual biasassociated with i, S is the set of elements in the visualfield, and wx and wz are attentional weights for elementsx and z. Thus the rate of processing is determined bythe strength of the sensory evidence that object x is ofcategory i, weighted by the bias towards making cat-egorizations of type i, and by the relative attentionalweight of object x (given by the ratio of wx over thesum of the attentional weights of all objects in the vi-
11
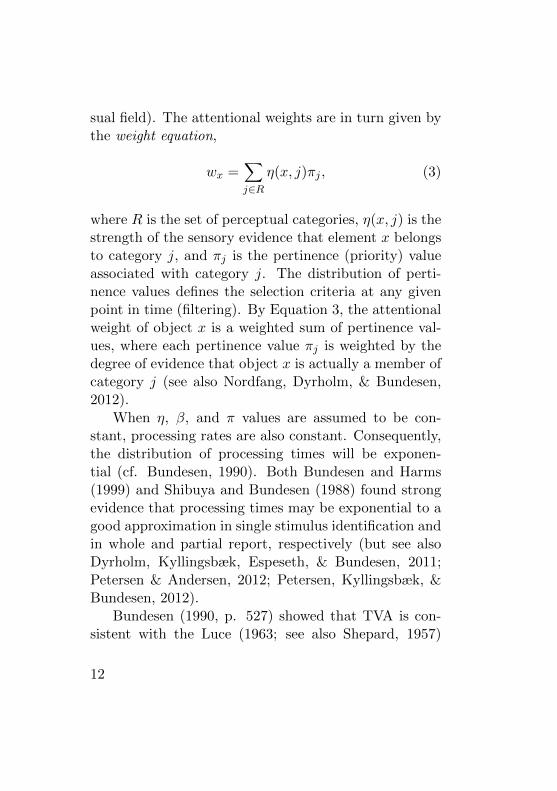
sual field). The attentional weights are in turn given bythe weight equation,
wx =∑j∈R
η(x, j)πj , (3)
where R is the set of perceptual categories, η(x, j) is thestrength of the sensory evidence that element x belongsto category j, and πj is the pertinence (priority) valueassociated with category j. The distribution of perti-nence values defines the selection criteria at any givenpoint in time (filtering). By Equation 3, the attentionalweight of object x is a weighted sum of pertinence val-ues, where each pertinence value πj is weighted by thedegree of evidence that object x is actually a member ofcategory j (see also Nordfang, Dyrholm, & Bundesen,2012).
When η, β, and π values are assumed to be con-stant, processing rates are also constant. Consequently,the distribution of processing times will be exponen-tial (cf. Bundesen, 1990). Both Bundesen and Harms(1999) and Shibuya and Bundesen (1988) found strongevidence that processing times may be exponential to agood approximation in single stimulus identification andin whole and partial report, respectively (but see alsoDyrholm, Kyllingsbæk, Espeseth, & Bundesen, 2011;Petersen & Andersen, 2012; Petersen, Kyllingsbæk, &Bundesen, 2012).
Bundesen (1990, p. 527) showed that TVA is con-sistent with the Luce (1963; see also Shepard, 1957)
12
biased choice rule when assuming that the participant’sresponse is based on the first categorization that com-pletes processing. That is, the first categorization thatfinishes processing is the one that is preserved in VSTM,while other conflicting categorizations are lost. Thissolution to mutually exclusive categorization will workwell when confusability between possible categorizationsis low. A more robust solution is attained through thePoisson Counter Model of identification that we pre-sented in Kyllingsbæk et al. (2012). As explained above,this model assumes that categorizations accumulate in-dependently during the exposure duration and that thecategorization with the highest number of counts is theone preserved in VSTM.
13
www.psy.ku.dk/cvc
Filtering (number of cells)
Pigeonholing (rate of firing)
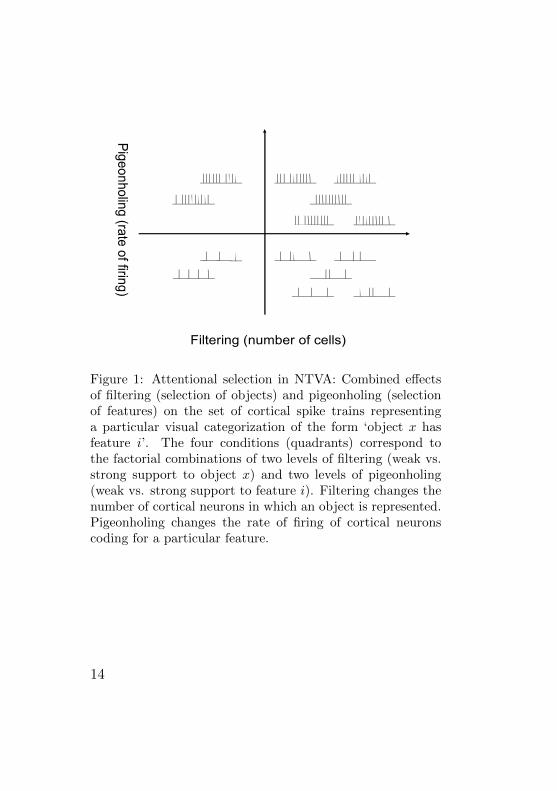
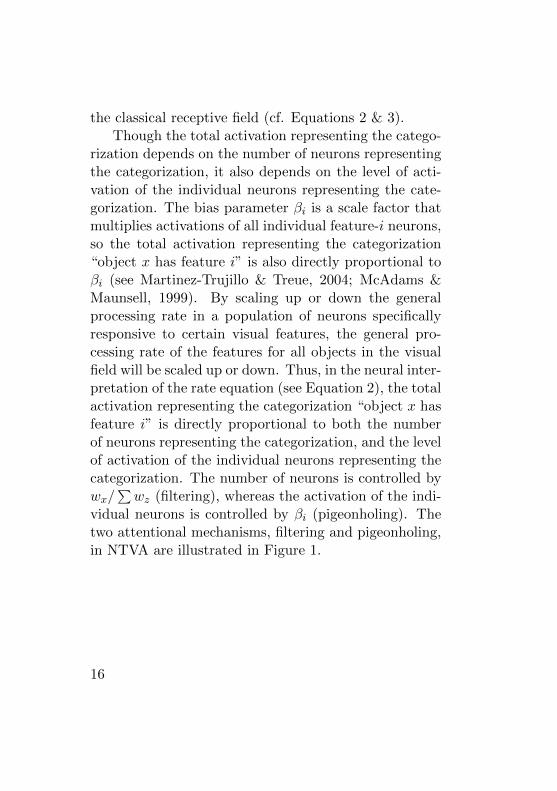
Figure 1: Attentional selection in NTVA: Combined effectsof filtering (selection of objects) and pigeonholing (selectionof features) on the set of cortical spike trains representinga particular visual categorization of the form ‘object x hasfeature i’. The four conditions (quadrants) correspond tothe factorial combinations of two levels of filtering (weak vs.strong support to object x) and two levels of pigeonholing(weak vs. strong support to feature i). Filtering changes thenumber of cortical neurons in which an object is represented.Pigeonholing changes the rate of firing of cortical neuronscoding for a particular feature.
14
3.4 A Neural Interpretation of TVA
In Bundesen et al. (2005, 2011), we proposed a Neu-ral Theory of Visual Attention (NTVA). The aim of thetheory is to bridge cognition and neurophysiology bygiving a unified mathematical interpretation of atten-tional behavior at both the level of the organism andsingle neurons.
A typical neuron in the visual system is assumed tobe specialized to represent a single feature and to re-spond to the properties of only one object at any giventime. That is, a neuron can represent different objectsat different times, but learning and development asideit always represents the same feature i. Neurons repre-senting feature i are called feature-i neurons. Featurei can be a more or less simple “physical feature”or a“microfeature” in a distributed representation (cf. Hin-ton, McClelland, & Rumelhart, 1986), and a feature-ineuron may be broadly sensitive to feature i’s degree ofpresence rather than sharply tuned to feature i.
The object selection of the neuron occurs by dynamicremapping of the cell’s receptive field so that the func-tional receptive field contracts around the selected ob-ject (cf. Moran & Desimone, 1985; Reynolds, Chelazzi,& Desimone, 1999; Chelazzi, Duncan, Miller, & Des-imone, 1998; Chelazzi, Miller, Duncan, & Desimone,1993). The remapping is done in such a way that theprobability that the neuron represents a particular ob-ject equals the attentional weight of the object dividedby the sum of the attentional weights of all objects in
15
the classical receptive field (cf. Equations 2 & 3).Though the total activation representing the catego-
rization depends on the number of neurons representingthe categorization, it also depends on the level of acti-vation of the individual neurons representing the cate-gorization. The bias parameter βi is a scale factor thatmultiplies activations of all individual feature-i neurons,so the total activation representing the categorization“object x has feature i” is also directly proportional toβi (see Martinez-Trujillo & Treue, 2004; McAdams &Maunsell, 1999). By scaling up or down the generalprocessing rate in a population of neurons specificallyresponsive to certain visual features, the general pro-cessing rate of the features for all objects in the visualfield will be scaled up or down. Thus, in the neural inter-pretation of the rate equation (see Equation 2), the totalactivation representing the categorization “object x hasfeature i” is directly proportional to both the numberof neurons representing the categorization, and the levelof activation of the individual neurons representing thecategorization. The number of neurons is controlled bywx/
∑wz (filtering), whereas the activation of the indi-
vidual neurons is controlled by βi (pigeonholing). Thetwo attentional mechanisms, filtering and pigeonholing,in NTVA are illustrated in Figure 1.
16
3.5 The Perceptual Cycle in NTVA
In NTVA, the perceptual cycle consists of two waves:A wave of unselective processing followed by a wave ofselective processing. During the first wave, cortical pro-cessing is unselective, implying that the processing ca-pacity is distributed at random (unselectively) acrossthe visual field. After the end of the first wave, an atten-tional weight has been computed for each object in thevisual field. The weights are found as levels of activationin a saliency map, which may be located in the pulvinarof the thalamus. The weights are used for redistributionof cortical processing capacity across the objects in thevisual field by dynamic remapping of receptive fields, sothat the expected number of cells allocated to a par-ticular object becomes proportional to the attentionalweight of the object.
During the second wave, cortical processing is selec-tive in the sense that the amount of processing resources(number of neurons) allocated to an object depends onthe attentional weight of the object. Because more pro-cessing resources are devoted to behaviorally importantobjects than less important ones, the important objectsare more likely to become encoded into VSTM. Further-more, attentional bias is applied in the second wave ofprocessing, thus scaling up or down firing rates of thecortical neurons, which represent the categorizations ofthe objects in the visual field. NTVA accounts for awide range of known attentional effects in human perfor-mance (reaction time and error rates) and a wide range
17
of effects observed in firing rates of single cells in theprimate visual system.
3.6 A Theory of Temporal Visual Attention
TVA and NTVA explain attentional behavior at boththe level of the organism and at the level of individualvisual neurons, but only when the stimuli are presentedsimultaneously (e.g. whole and partial report). In thenatural world however, visual stimuli appear and dis-appear asynchronously of each other, requiring atten-tion to be distributed not only across space, but also intime. Several different paradigms have been developedto explore allocation of attention in time, e.g. the at-tentional blink paradigm (Raymond, Shapiro, & Arnell,1992) and the attentional dwell time paradigm (Duncan,Ward, & Shapiro, 1994). In Petersen et al. (2012), wepresented an extension of NTVA—a Theory of Tempo-ral Visual Attention (TTVA). When visual stimuli arepresented at different points in time, TTVA conjecturesthat attentional resources are reallocated and a race to-wards VSTM is initiated each time a new stimulus ap-pears in the visual field. Thus when two target stimuli,T1 and T2, are presented in the attentional dwell timeparadigm, two calculations of attentional weights areinitiated, one when T1 is presented and another whenT2 is presented. After each calculation, the attentionalresources are redistributed followed by an attentionalrace for encoding into VSTM.
During the sequence of presentation, some of the
18
stimuli may be successfully encoded into VSTM. Whenthis happens, TTVA assumes that the processing re-sources (cortical visual neurons) that were allocated toprocess the stimuli are locked temporarily in VSTM.Consequently, the resources are unavailable for redistri-bution when a new stimulus appears. The locking ofresources is the main explanation for the strong imped-iment in reporting T2 when it follows T1 by less than500 ms in the attentional dwell time paradigm. Theprocess of locking resources is not instantaneous, butis assumed to be exponentially distributed with a rateparameter λl. Resources locked by stimuli encoded inVSTM are released again following a dwell-time period,also assumed to be exponentially distributed, but withrate parameter λd. When the dwell-time has passed, theneurons locked in VSTM can be redistributed to processnew objects, thereby explaining the equivalence in per-formance on T1 and T2 when presented more than 1000ms apart. In TTVA, allocation of attentional processingresources and VSTM are highly integrated mechanisms,which cannot be understood in isolation of one another(see further discussion in Sections 5 & 6).
3.7 Application of TVA in Studies of Neu-ropsychological Patients
During the last ten years, we have extended our effortof modeling behavioral data in normal healthy partic-ipants with TVA to modeling of attentional deficits inneuropsychological patients (e.g., Bublak et al., 2005;
19
Dubois et al., 2010; Duncan et al., 2003; Kyllingsbæk,2006). Using TVA has several advantages comparedto conventional neuropsychological tests of attention forwhich TVA measures corresponding functions (e.g., Finkeet al., 2005). TVA based testing is more sensitive and istherefore able to measure mild attentional deficits thatare not evident in standard pen and pencil based neu-ropsychological tests (e.g., Habekost & Bundesen, 2003).In addition, the test is specific because it gives puremeasures of the attentional mechanisms that may beaffected. Many neuropsychological tests contain com-plex motor components, which make it difficult to de-rive unconfounded measures of the attentional deficits.TVA based testing is also more reliable than standardneuropsychological test measures (Habekost & Starrfelt,2009). Using bootstrap methods (e.g., Efron & Tibshi-rani, 1993) it is possible to derive reliability estimates ofindividual parameters in the TVA model and from thesecalculate confidence intervals for the parameters of in-dividual patients (see Kyllingsbæk, 2006). Finally, thevalidity of TVA based testing is high, given the strongtheoretical foundation in basic research. TVA has beenapplied to a wide range of classic findings within ex-perimental psychology of visual attention and identifi-cation explaining a wide variety of experimental find-ings with a very limited set of meaningful parameters(Bundesen, 1990). Quantitative modeling of psycholog-ical data, such as modeling used in TVA based test-ing, is both technically and mathematically challeng-
20
ing. In Kyllingsbæk (2006), I presented an accessible,user friendly, and flexible program package that enablesquantitative fits of TVA to data from whole and partialreport experiments. In addition, new computational for-mulas that were more general than previous ones werepresented along with bootstrapping methods to deriveestimates of the reliability of the fitted parameters inthe model. Recently, Mads Dyrholm developed a moreextensive version of the software that can be found athttp://zappa.psy.ku.dk/libtva/ (see also Dyrholm et al.,2011).
21
4 NTVA and other Theories of Vi-sual Attention
4.1 Feature Integration Theory and the GuidedSearch Model
During the 80’s and early 90’s, the Feature IntegrationTheory (FIT) by Treisman and collaborators was veryinfluential within the field of visual attention (e.g., Treis-man & Gelade, 1980; Treisman, 1988, 1996). FIT waslater followed by the Guided Search (GS) model of Wolfe(e.g., Wolfe, 1994; Cave & Wolfe, 1990; Wolfe, Cave, &Franzel, 1989), which is now the dominant theory of vi-sual attention that assumes serial processing. In bothFIT and GS, simple stimulus features such as color andorientation are registered automatically, without atten-tion, and in parallel across the visual field. However,registration of objects (items that are defined by con-junctions of features) requires a further stage of pro-cessing during which spatial attention is directed to oneobject at a time. Spatial attention is analog to a spot-light, and the function of directing attention to a par-ticular location in space is to bind all features at theattended location to each other as well as binding themto their location. Thus, localizing a feature requiresspatial attention, and only one location can be attendedat a time. This contrasts strongly with the basic as-sumptions in TVA and NTVA of parallel processing atall stages; assumptions which were supported by our
22
findings in Kyllingsbæk and Bundesen (2007). Here wefound evidence that multiple features of two to threestimuli can be identified and localized in parallel. Inaddition, our findings in Petersen et al. (2012) of at-tentional dwell times around 500 ms speak against fastserial scanning in visual search assumed by many serialmodels of visual attention.
4.2 Load Theory
As stated in the beginning of this section, the locus ofattentional selection has been discussed intensively sincethe filter theory was proposed by Broadbent (1958). TheLoad Theory (LT) of Lavie (1995; see also Lavie & Tsal,1994) was proposed to reconcile this debate. Accord-ing to LT, perception is capacity-limited and all stimuliare processed in an automatic fashion until this capac-ity is exhausted (e.g., Lavie, 2005, p. 75). Further-more, allocation of visual processing capacity happensin two steps: (a) Initial allocation of resources to task-relevant stimuli, followed by (b) automatic allocation(‘spill over’) of the remaining capacity to task-irrelevantstimuli. Two key predictions follow from these premises.First, in situations of high perceptual load (e.g. whenmany stimuli must be processed), full perceptual capac-ity will be engaged at the task-relevant stimuli, leavingno spare capacity to process task-irrelevant distractors.Second, in situations of low load (e.g. when few stim-uli must be processed and processing is easy), excesscapacity not used to process task-relevant stimuli will
23
automatically ‘spill over’, leading to perception of task-irrelevant distractors. In contrast to LT, both TVA andNTVA assume that attentional resources are allocatedin a single step after an attentional weight has been com-puted for each object in accordance with Equation 3. InKyllingsbæk, Sy, and Giesbrecht (2011), we presentedthe results of two experiments that tested the assump-tions made by LT and TVA. In both experiments, partic-ipants reported targets presented around the perimeterof an imaginary circle centered at fixation while ignor-ing peripheral distracting flankers. The flankers werepresented at two irrelevant locations to the far left andright where no targets appeared. In the first experiment,four targets were shown in every display together withone or two flankers at the irrelevant locations. In ad-dition, we varied the discriminability of the flankers byvarying their color (either identical or different from thecolor of the target letters). In the second experiment,the number of targets and thus the perceptual load wasvaried systematically. LT predicts that the number andcharacteristics of flanker stimuli presented at locationsknown by the observer to always be irrelevant, will notaffect performance of the first allocation step in whichprocessing resources are allocated only to stimuli at pos-sible target locations. Contrary to this, TVA predictsonly a single allocation step and consequently a system-atic effect of both the number and discriminability of theflanker stimuli. TVA accurately fitted the data of thetwo experiments, thus favoring the simple explanation
24
with a single step of capacity allocation. In the secondexperiment, we also showed that the effects of varyingperceptual load can only be explained by a combined ef-fect of allocation of processing capacity as well as limitsin VSTM as predicted by TVA.
4.3 Biased Competition
TVA bears strong relations to the Biased Competition(BC) models of Desimone and Duncan (1995); Desimone(1999); Duncan (1996, 1998); Duncan, Humphreys, andWard (1997). In fact, TVA may be viewed as one of sev-eral different implementations of BC. In BC, attentionis thought to operate in parallel across objects in the vi-sual field. In some implementations of BC, activation ofa neural unit representing that a given object has a par-ticular feature (e.g., object x is red) facilitates activationof units representing other, unrelated categorizations ofthe same object (e.g., object x moves upward) and in-hibits activation of units representing (related or unre-lated) categorizations of objects other than x. This isthe integrated competition hypothesis of Duncan (1996);units which represent categorizations of the same objectreinforce each other while competing against units whichrepresent categorizations of other objects. The formu-lation suggests that trial-to-trial variations in whetheror not a certain feature of a given object is reportableshould be (a) positively correlated with whether otherfeatures of the same object are reportable and (b) nega-tively correlated with whether features of other objects
25
are reportable. This strong version of the biased compe-tition was not supported by our results in Kyllingsbækand Bundesen (2007). Here we found strong evidenceof stochastic independence of encoding of features bothwithin and between several stimuli. Thus, trial-to-trialvariations in whether or not a particular feature wascorrectly reported showed little or no dependence onwhether (a) the other feature of the same object wascorrectly reported or (b) features of the other objectwere correctly reported.
4.4 The Normalization Model of Attention
In Reynolds and Heeger (2009), the Normalization Modelof Attention (NMA) was proposed to reconcile alterna-tive theories of attention—theories mainly based on neu-rophysiological experiments (see also Reynolds et al.,1999). NMA is based on BC and is thus akin to NTVA.With its strong foundation in both BC and neurophys-iological data, NMA is particularly interesting to com-pare with NTVA. In neurophysiological studies of visualattention, the contrast of the stimulus is often system-atically manipulated complementary to the systematicvariations in exposure duration that have been a ma-jor focus in research on TVA/NTVA. Therefore, NMAfocuses on effects of attention as modeled by a fixed re-sponse gain factor or a change in contrast gain. In addi-tion to this, several neurophysiological studies have im-plicated an attentional sharping of neural tuning, whichNMA also addresses.
26
NMA consists of three basic components: A stimula-tion field, an attention field, and a suppressive field. Thestimulation field of a neuron characterizes its selectiv-ity both in terms of spatial position and visual features(e.g. orientation, color, or more complex features). Thestimulation drive represents the activation of the neu-ron to the stimuli, varying on these dimensions in theabsence of attention and suppression. The definitionof the stimulation drive of a neuron is thus analog tothe definition of sensory evidence in NTVA, except it islinked to positions rather than objects. The attentionfield is specified in terms of its gain for each neuron inthe population, that is in terms of its spatial and fea-tural extension, and is thus similar to the pertinencevalues in NTVA. The suppressive field characterizes thespatial locations and visual features that contribute tosuppression of the activity in visual neurons. For ex-ample, the response of a neuron to a preferred stimuluscan be suppressed by the simultaneous presentation ofa non-preferred stimulus. The suppressive drive is com-puted from the product of the stimulus drive and theattention field that is then pooled over space and visualfeatures in accordance with the suppressive field. Thiscorresponds to computation of the denominator of theratio in the rate equation of TVA (see Equation 2). Tocompute what corresponds to the nominator in the rateequation, the stimulus drive is again multiplied by theattentional field, but without pooling across space andfeatures. Finally, the mechanism of suppression is im-
27
plemented by dividing (normalizing) the activity givenby the product of the stimulation drive and the atten-tion field with the suppressive drive.
The mechanisms of attention in NMA are thus simi-lar in nature to the corresponding mechanisms in NTVA,although the suppressive field provides the NMA witha more flexible mechanism than what is given in theweight ratio in the rate equation of NTVA (but see alsoNordfang et al., 2012). There are two other differencesbetween NMA and NTVA that should be emphasized.The first originate in the fact that the attention field isdefined in terms of space in NMA, rather than in termsof visual objects, as in NTVA. This enables NMA toexplain differences in attentional modulation when theattended stimulus covers the whole receptive field of theneuron recorded in comparison to situations where thestimulus is smaller than the receptive field.
The second is a difference in how NMA and NTVAassume that input is attentionally gated to feature se-lective neurons—neurons that show effects of attentionwhen several stimuli are presented within its receptivefield (e.g., Moran & Desimone, 1985). In NMA, the ac-tivity of a neuron is a weighted sum of the input fromneurons at earlier stages in the visual system coding forthe dominant features of the stimuli within their recep-tive field (see Reynolds et al., 1999). Thus, the neuronresponds simultaneously to input from several visual ob-jects. In contrast, in NTVA the input to the neuron isgated so that the input originates from a single object at
28
any moment in time. Thus the response of the neurononly codes for features of a single object. This criti-cal difference between NMA and NTVA is due to theirrespective focus on representation of locations and ob-jects. Mixing information from several objects in thefiring rates of cortical neurons as assumed in NMA hasa notable weakness. It is not clear how neurons later inthe processing chain should use this mixed informationfrom several objects (possibly both targets and distrac-tors) when appropriate actions towards attended objectsmust be selected (Bundesen et al., 2005, p. 308). Theinterpretation of firing rates given by NTVA, gives asimpler solution to this problem—a solution where cat-egorizations from attended objects may be forwardedunambiguously to neurons in cortical areas responsiblefor action selection and execution, while irrelevant in-formation from distractors are efficiently filtered out.
29
Classic Model of Perception
Iconic Memory VSTM VLTM
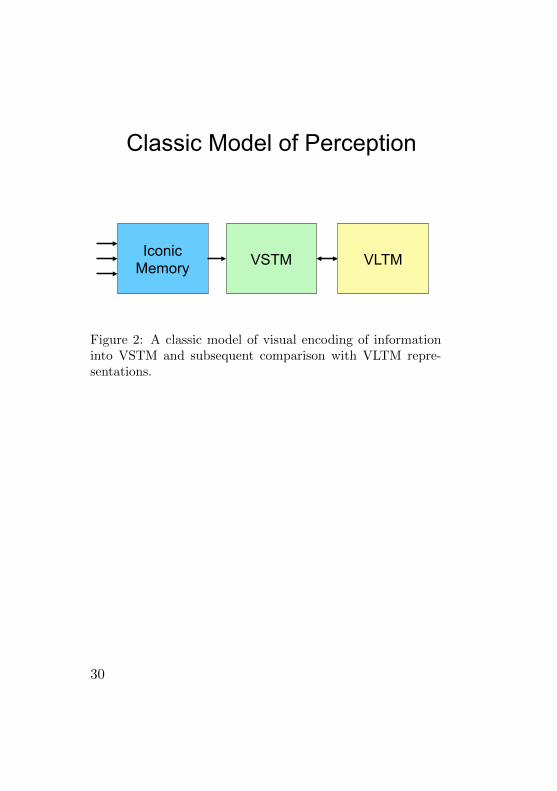
Figure 2: A classic model of visual encoding of informationinto VSTM and subsequent comparison with VLTM repre-sentations.
30
5 Visual Memory Systems
In many classic models of visual cognition, perceptionis divided into three distinct stages (see Figure 2). Thethree stages are: (a) Iconic memory, (b) visual short-term memory (VSTM), and (c) visual long-term mem-ory (VLTM). First, visual information from the eyes istransmitted to iconic memory before it reaches VSTMand VLTM. This temporary store is virtually unlimitedin processing and storage capacity, but severely limitedin time as it only retains the information for a fractionof a second. Thus, iconic memory represents our imme-diate sensory impression that vanishes almost instantlywhen we close our eyes. Iconic memory is the basis forthe partial report superiority that Sperling (1960) in-vestigated. The information in iconic memory is thentransferred to VSTM through a severely limited pro-cessing channel. This channel is directed by attentionalprocesses, such as those indicated in the classic filteringtheory by Broadbent (1958). In VSTM, object repre-sentations are formed that may then be compared toVLTM representations in order to recognize the iden-tity of the objects. Access to representations in VLTMmay only happen through the limited attentional chan-nel and VSTM. Access to these representations happensonly one item at time, i.e. in a serial manner (e.g., Treis-man & Gelade, 1980).
31
5.1 Measuring Visual Short-Term MemoryCapacity
Traditionally, VSTM capacity has been measured usingthe whole-report paradigm, in which participants are re-quired to report as many items as possible from a set ofbriefly presented objects (Cattell, 1885). Sperling (1960,1963, 1967) used letters as stimuli and found that VSTMcapacity was limited to approximately four or five in-dependent items (see also Bundesen, 1990; Bundesenet al., 2005; Kyllingsbæk & Bundesen, 2009; Shibuya& Bundesen, 1988). When familiar, nameable stimuliare used, whole report gives a reliable and easily inter-pretable measure of VSTM capacity. However, severalinvestigators have objected that the very use of stimulithat can be verbalized may contaminate the estimate ofVSTM capacity due to contributions from verbal work-ing memory (Olsson & Poom, 2005; Vogel, Woodman,& Luck, 2001). Moreover, whole report is not feasiblefor measuring VSTM capacity for unfamiliar stimulusmaterial. For these reasons, the bulk of recent stud-ies of VSTM capacity have used the change detectionparadigm (Phillips, 1974). In this paradigm, a mem-ory display containing a varying number of stimuli arepresented briefly (< 500 ms) followed by a retentionperiod of 1-3 s where the participant retains the iden-tity and most often the location of the stimuli. Then aprobe display is presented containing either all the stim-uli from the memory display (Pashler, 1988) or only oneof them (Cowan, 2001). In half of the trials one of the
32
items in the probe display has changed its identity (orthe single probe in the paradigm of Cowan, 2001). Thetask of the participant is to decide whether the probedisplay is identical to the memory display or a changehas occurred. When observing the hits and false alarmrates in the change detection task, an estimate of theVSTM capacity, K, may be obtained. In Kyllingsbækand Bundesen (2009), we investigated the reliability ofthe estimated value of K both through repeated exper-imental measures in the same individual and by math-ematical derivation of the predicted variance of the ca-pacity estimates. We first compared the theoreticallyderived variance to the empirically estimated varianceand found close correspondence between predicted andobserved variances. Then we showed how the two relia-bility estimates depended on the number of items to beremembered and the guessing strategy of the observer.The reliability was highest when participants adopted aconservative guessing strategy and lowest when partici-pants guessed ‘change’ and ‘no change’ with equal prob-abilities (probability matching). Finally, we proposed anew version of the two-alternative choice change detec-tion paradigm, in which the choice is unforced. This newparadigm reduces the variance of the capacity estimateK substantially.
33
TVA
VLTM VSTM Iconic Memory
The Race
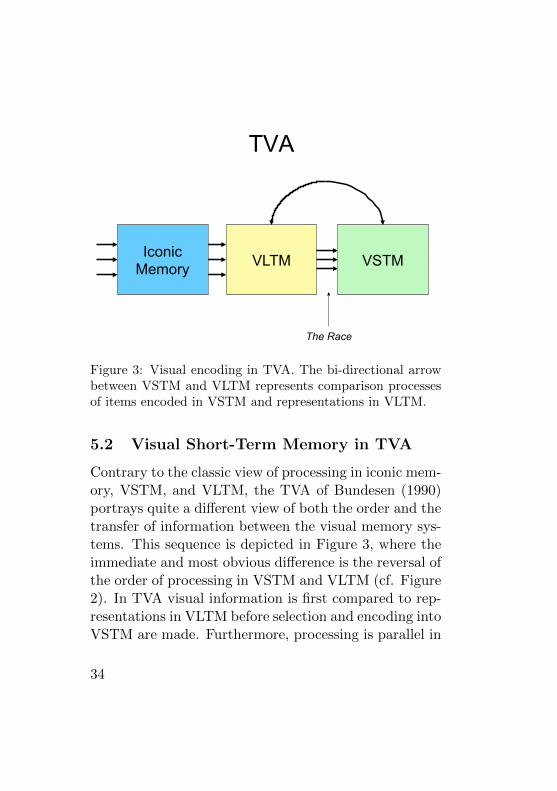
Figure 3: Visual encoding in TVA. The bi-directional arrowbetween VSTM and VLTM represents comparison processesof items encoded in VSTM and representations in VLTM.
5.2 Visual Short-Term Memory in TVA
Contrary to the classic view of processing in iconic mem-ory, VSTM, and VLTM, the TVA of Bundesen (1990)portrays quite a different view of both the order and thetransfer of information between the visual memory sys-tems. This sequence is depicted in Figure 3, where theimmediate and most obvious difference is the reversal ofthe order of processing in VSTM and VLTM (cf. Figure2). In TVA visual information is first compared to rep-resentations in VLTM before selection and encoding intoVSTM are made. Furthermore, processing is parallel in
34
all stages. From iconic memory to VLTM, processing iscapacity unlimited, but processing capacity becomes amajor limiting factor in the race for storage in VSTM.The core of TVA is this race towards the limited VSTMafter the visual impression in iconic memory has beencompared to VLTM presentations.
In TVA, VSTM is understood in the classic formas a passive store containing a very limited number ofdistinct objects. The capacity is not constant over time,but may vary somewhat from moment to moment. Specif-ically, the capacity is estimated as a probability mix-ture of two neighboring integer values. Therefore, if theVSTM capacity, K, is estimated at a value of 3.74, itrepresents the probability mixture that VSTM capacityis three 26% of the time and four 74% of the time. Usu-ally VSTM capacity is approximately four visual objectsin normal healthy control participants, but may varyconsiderably within the normal population, resulting inestimates between two and five objects (see Dyrholm etal., 2011). In Equations 2 and 3 described in the pre-vious section, TVA explains in quantitative details howinformation is selected into VSTM from where it may in-fluence behavior. More specifically TVA can explain theconsequences of both limits in processing capacity andstorage capacity simultaneously, thus effectively sepa-rating the contribution of these two otherwise entangledeffects in the data (cf. Bundesen, 1990; Kyllingsbæk etal., 2011; Shibuya & Bundesen, 1988).
35
NTVA
Iconic Memory VLTM
VSTM
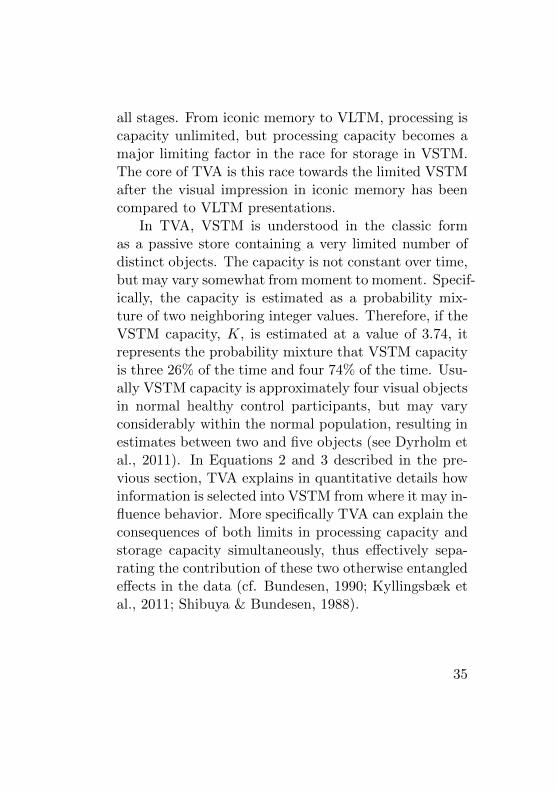
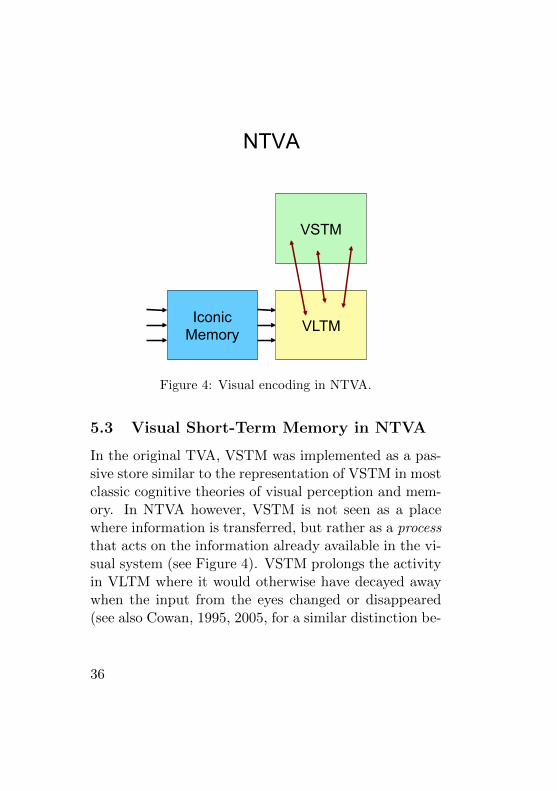
Figure 4: Visual encoding in NTVA.
5.3 Visual Short-Term Memory in NTVA
In the original TVA, VSTM was implemented as a pas-sive store similar to the representation of VSTM in mostclassic cognitive theories of visual perception and mem-ory. In NTVA however, VSTM is not seen as a placewhere information is transferred, but rather as a processthat acts on the information already available in the vi-sual system (see Figure 4). VSTM prolongs the activityin VLTM where it would otherwise have decayed awaywhen the input from the eyes changed or disappeared(see also Cowan, 1995, 2005, for a similar distinction be-
36
tween VSTM and VLTM). Thus, VSTM is not a passivestore of information, but rather a process that enablesthe visual system to hold on to activity, so that it mayassociate to other systems in the brain and thus havea global effect leading to coherent overt behavior (e.g.,Baars, 2002; Dehaene, Kerszberg, & Changeux, 1998).
The capacity of VSTM in NTVA is also severely lim-ited. However, where the capacity limit in classic mod-els of VSTM is defined in terms of the number of slots,the limit of VSTM in NTVA is in the number of feed-back loops established between nodes in the store andactivated representations of features in VLTM. Thus,following the ideas of Donald Hebb (1949), NTVA im-plements VSTM as reverberating circuits between nodesin the store and representations in VLTM.
37
Activated VLTM representation
Feedback Loop
Self Excitation
VSTM Node
Inhibition
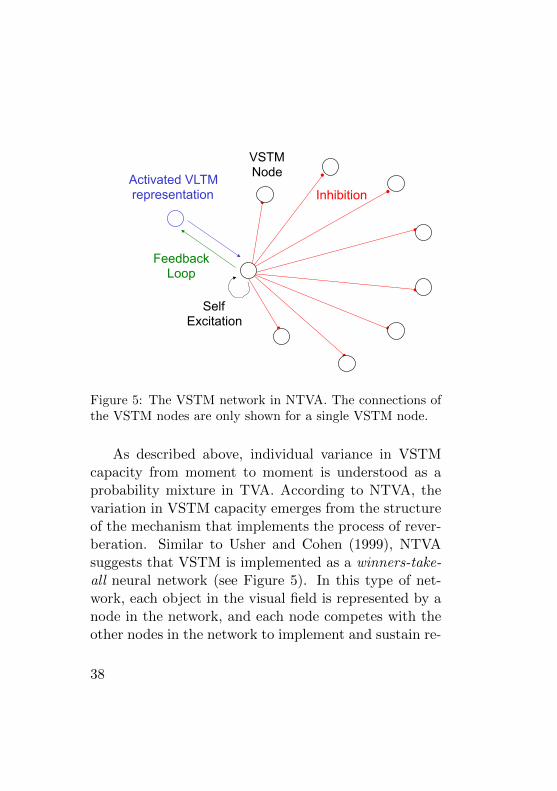
Figure 5: The VSTM network in NTVA. The connections ofthe VSTM nodes are only shown for a single VSTM node.
As described above, individual variance in VSTMcapacity from moment to moment is understood as aprobability mixture in TVA. According to NTVA, thevariation in VSTM capacity emerges from the structureof the mechanism that implements the process of rever-beration. Similar to Usher and Cohen (1999), NTVAsuggests that VSTM is implemented as a winners-take-all neural network (see Figure 5). In this type of net-work, each object in the visual field is represented by anode in the network, and each node competes with theother nodes in the network to implement and sustain re-
38
verberating feedback loops between itself and activatedrepresentations in VLTM. Each node in the network hasan excitatory connection to itself and inhibitory connec-tion to every other node in the network.
Imagine the situation of whole report, in which anumber of letters are presented briefly to a participantwho must then report as many of the letters as possi-ble. The letters will activate representations in VLTMthat then participate in the attentional processing racein which the representations compete for entrance intoVSTM. In NTVA, this means that the categorizationsfinishing the race will activate nodes in the VSTM net-work. These nodes will then start establishing feedbackloops to the activated representations of the objects inVLTM. At the same time the nodes will increase theirown activity by self-excitation as well as inhibit activ-ity of the other nodes in the network. The competitionwill result in an equilibrium state where only a certainnumber of nodes are activated, having eliminated theactivity in the remaining nodes in the VSTM network.
The number of activated nodes after this consol-idation process represents the momentary capacity ofVSTM. As in the original TVA model, the capacity willvary from moment to moment, but contrary to the prob-ability mixture involving only two neighboring integervalues in TVA, the neural network implementation ofVSTM in NTVA results in a broader distribution of thecapacity. In most cases the capacity of the VSTM willbe centered around two neighboring values, but the net-
39
work implementation of VSTM predicts both lower andhigher values for the capacity, although the probabil-ity for such events will be smaller (see Dyrholm et al.,2011).
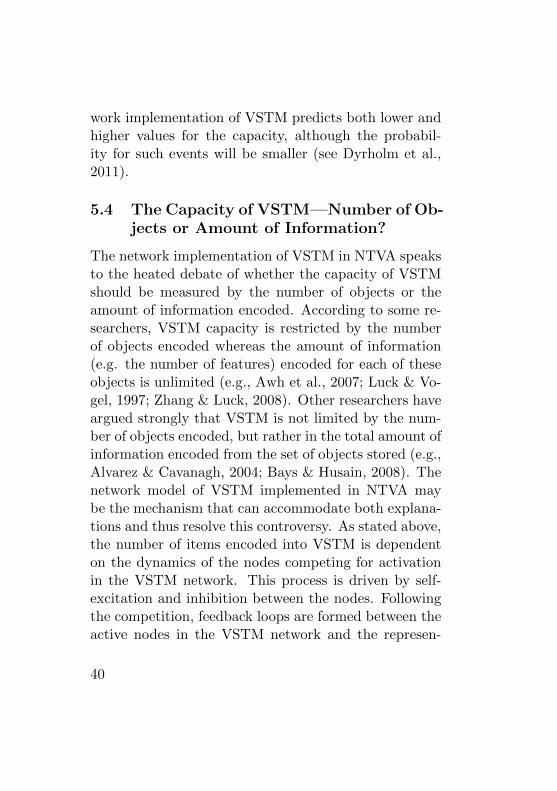
5.4 The Capacity of VSTM—Number of Ob-jects or Amount of Information?
The network implementation of VSTM in NTVA speaksto the heated debate of whether the capacity of VSTMshould be measured by the number of objects or theamount of information encoded. According to some re-searchers, VSTM capacity is restricted by the numberof objects encoded whereas the amount of information(e.g. the number of features) encoded for each of theseobjects is unlimited (e.g., Awh et al., 2007; Luck & Vo-gel, 1997; Zhang & Luck, 2008). Other researchers haveargued strongly that VSTM is not limited by the num-ber of objects encoded, but rather in the total amount ofinformation encoded from the set of objects stored (e.g.,Alvarez & Cavanagh, 2004; Bays & Husain, 2008). Thenetwork model of VSTM implemented in NTVA maybe the mechanism that can accommodate both explana-tions and thus resolve this controversy. As stated above,the number of items encoded into VSTM is dependenton the dynamics of the nodes competing for activationin the VSTM network. This process is driven by self-excitation and inhibition between the nodes. Followingthe competition, feedback loops are formed between theactive nodes in the VSTM network and the represen-
40
tations in VLTM that they were initially activated by.This enables activity in the VSTM network and VLTMrepresentations to be sustained once sensory activationof the VLTM representations ceases. However, the re-verberating activation of VSTM-VLTM loops is also de-pendent on the strength and quality of the activationfrom the VLTM representations that are participatingin the initial race for selection, and later encoded as thecontent in VSTM (i.e. the visual features of the objects).When the stimuli to be remembered are highly similaror when VLTM representations are sparse in number,the feedback loops between these representations andnodes in the VSTM network will be weak. For example,Olsson and Poom (2005) argued that VSTM capacity fornovel, highly similar visual shapes and colors was only asingle item—significantly below the capacity of VSTMusually found in change detection. Thus the quality andthe number of representations in VLTM becomes an in-direct but strong determining factor for the capacity ofVSTM. Consequently, NTVA predicts that VSTM ca-pacity will be high for familiar well-practiced stimulusmaterials compared to novel stimuli, stimuli with highcomplexity, or stimuli that are highly confusable (seeSørensen & Kyllingsbæk, 2012). This may explain whythe capacity for distinct primary colors or well-knownletters from the Roman alphabet are larger than the ca-pacity for unknown Chinese characters (in participantsfrom a Western population) or highly similar 3D shapes(Alvarez & Cavanagh, 2004).
41
Iconic Memory / VLTM
VSTM
NTVA
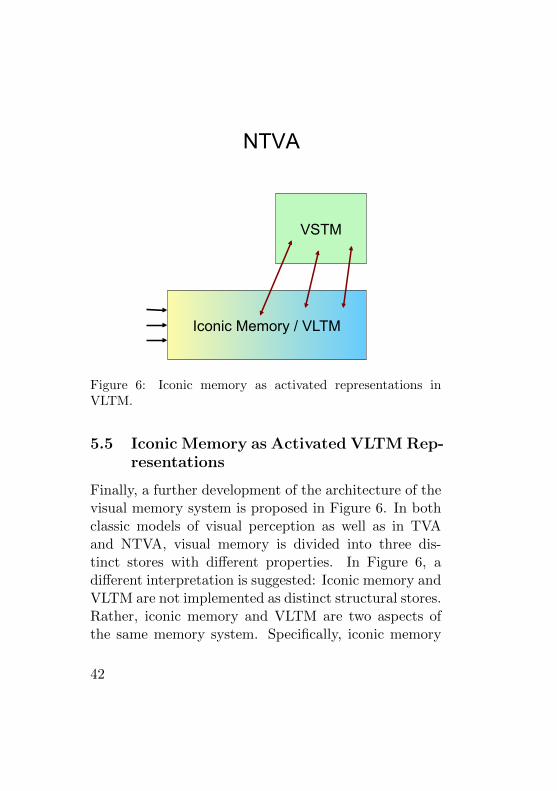
Figure 6: Iconic memory as activated representations inVLTM.
5.5 Iconic Memory as Activated VLTM Rep-resentations
Finally, a further development of the architecture of thevisual memory system is proposed in Figure 6. In bothclassic models of visual perception as well as in TVAand NTVA, visual memory is divided into three dis-tinct stores with different properties. In Figure 6, adifferent interpretation is suggested: Iconic memory andVLTM are not implemented as distinct structural stores.Rather, iconic memory and VLTM are two aspects ofthe same memory system. Specifically, iconic memory
42
is the activated subset of representations in VLTM—thestructure where processing is taking place. In terms ofthe rate and weight equations (see Equations 2 & 3) ofTVA/NTVA, the total set of η(x, i) values represents thecontent of iconic memory. In this interpretation, VLTMshould be understood in broad terms. This includes verysimple visual features, such as representations of orienta-tion and spatial frequency in the primary visual cortex,as well as high-level visual representations of complexforms in the inferotemporal cortex. If iconic memory isour visual impression of the outside world, the conjec-ture is that we see the world through the representa-tions in our VLTM. Some of these representations arevery simple and implemented genetically or formed veryearly in life, yet at higher levels the representations aremainly formed by visual experiences and may be influ-enced, changed, or developed anew over relatively shortperiods of time (e.g., Kobatake, Wang, & Tanaka, 1998).
43
6 An Integrated View of Visual Cog-nition
The previous sections outlined components of a generaltheoretical framework for understanding visual encod-ing, attention, and short-term memory. In this frame-work, the encoding of visual information happens in-dependently and in parallel across both features andobjects in the visual field (Kyllingsbæk & Bundesen,2007). Allocation of visual processing resources is un-derstood in terms of dynamic remapping of the receptivefields of cortical neurons tuned to different visual cate-gories/features (Bundesen et al., 2005). When severalstimuli are presented within the same receptive field,competition for processing resources will be strong. Onother hand, when only a single stimulus is presentedwithin each receptive field, allocation of processing re-sources will be independent of the number of stimulithat are being processed (Kyllingsbæk et al., 2007). En-coding and identification of a stimulus is a cumulativePoisson process in which evidence for different possi-ble categorizations of the stimulus is collected while thestimulus is physically available to the visual system. Ev-idence for each of the categories will be aggregated in acounter and the categorization accumulating the highestnumber of counts will be selected for the final choice ofcategorization (Kyllingsbæk et al., 2012).
When encoding information from a complex visualscene, attending to the important stimuli and ignoring
44
irrelevant distractors is vital. Thus the outlines of ba-sic encoding principles must be embraced in a broadertheoretical framework for understanding visual process-ing when both relevant and irrelevant information ispresent. In NTVA, we developed a computational the-ory of visual attention whereby processing resources arerepresented as the total firing rate in the population ofcortical neurons in the visual system (Bundesen et al.,2005). These processing resources may be allocated bydynamic remapping of the cortical neurons and scaledup or down by multiplicative scaling of the firing ratesvia adjustment of perceptual bias for different catego-rizations. The three characteristics of the encoding pro-cess described above follow naturally from the basic as-sumptions in NTVA.
According to NTVA, visual information is encodedinto a VSTM store. However, in contrast to most clas-sic theories of visual attention, VSTM in NTVA is not astatic storage mechanism where the result of the encod-ing processes is retained temporarily. In NTVA, VSTMis implemented as a winners-take-all network. A com-petitive process implemented by self-excitation and mu-tual inhibition leads to equilibrium states in which asmall number of visual objects are represented in thestore. In addition, the VSTM network consists onlyof feedback loops that sustain activated VLTM repre-sentations by reverberation—representations that wereactivated by the encoding process. Thus, the content ofVSTM is not stored in the VSTM network as such, but
45
as activated representations in VLTM.In combination with the theoretical interpretations
of encoding and attention, realizing VSTM as a pro-cess in interaction with representations in VLTM ratherthan a passive storage mechanism, offers a fundamentalchange in our understanding of how visual information isprocessed. Visual encoding, attention, and short-termmemory are not isolated stages in a processing chainwhere information is handed over from one mechanismto the next in sequential order. Rather, the presenttheoretical position conjectures that encoding, atten-tion and short-term memory are all processes working inconcert on representations in VLTM by activation, at-tentional remapping of receptive fields, feature specificbiasing of cortical populations of neurons, and rever-beration to sustain activated representations when thestimulus changes or is not physically present any more.
46
7 Danish Summary
Emnet for nærværende afhandling er visuel kognitiongenerelt og specifikt udviklingen af matematiske mod-eller for visuel perception, opmærksomhed og korttids-hukommelse. De matematiske modeller blev konstrueretmed den hensigt, at de skulle være sa simple som muligeog stadig have en høj grad af validitet givet ved deresstruktur og parametre. Sidstnævnte bestemmes af for-bindelsen mellem parametrene og psykologisk menings-fulde begreber, som fx indkodningshastighed og hukom-melseskapacitet. Ydermere var formalet med min forsk-ning at udvide modellerne, saledes at de kan forklare deneurale mekanismer, som danner det biologiske grundlagfor de nævnte kognitive processer.
Den første del af afhandlingen giver en præsenta-tion af eksperimentelle og teoretisk studier vedrørendeindkodning af visuel information, nar en eller flere sti-muli identificeres. Dette efterfølges af en gennemgangaf en neural teori for visuel opmærksomhed. Endeligdiskuteres et integreret syn pa visuel hukommelse, hvorforbindelserne mellem sensorisk hukommelse, visuel kort-tidshukommelse og visuel langtidshukommelse nytænkes.
47
8 References
Alvarez, G. A., & Cavanagh, P. (2004). The capacityof visual short-term memory is set both by visual infor-mation load and by number of objects. PsychologicalScience, 15 , 106–111.
Awh, E., Barton, B., & Vogel, E. K. (2007). Visualworking memory represents a fixed number of itemsregardless of complexity. Psychological Science, 18 ,622–628.
Baars, B. J. (2002). The conscious access hypothe-sis: origins and recent evidence. Trends in CognitiveSciences, 6 , 47–52.
Bartels, A., & Zeki, S. (2004). Functional brain map-ping during free viewing of natural scenes. HumanBrain Mapping , 21 , 75–85.
Bays, P. M., & Husain, M. (2008). Dynamic shiftsof limited working memory resources in human vision.Science, 321 , 851–854.
Bouma, H. (1970). Interaction effects in parafovealletter recognition. Nature, 226 , 177–178.
Broadbent, D. E. (1958). Perception and communica-tion. London, UK: Pergamon press.
Broadbent, D. E. (1971). Decision and stress. London,UK: Academic Press.
48
Bublak, P., Finke, K., Krummenacher, J., Preger, R.,Kyllingsbæk, S., Muller, H. J., et al. (2005). Usabil-ity of a theory of visual attention (tva) for parameter-based measurement of attention ii: Evidence from twopatients with frontal or parietal damage. Journal ofthe International Neuropsychological Society , 11 , 843–854.
Bundesen, C. (1990). A theory of visual attention.Psychological Review , 97 , 523–547.
Bundesen, C., Habekost, T., & Kyllingsbæk, S. (2005).A neural theory of visual attention: bridging cognitionand neurophysiology. Psychological Review , 112 , 291–328.
Bundesen, C., Habekost, T., & Kyllingsbæk, S. (2011).A neural theory of visual attention and short-termmemory (ntva). Neuropsychologia, 49 , 1446–1457.
Bundesen, C., & Harms, L. (1999). Single-letter recog-nition as a function of exposure duration. PsychologicalResearch, 62 , 275–279.
Bundesen, C., Kyllingsbæk, S., Houmann, K. J., &Jensen, R. M. (1997). Is visual attention automati-cally attracted by ones own name? Perception & Psy-chophysics, 59 , 714–720.
Cattell, J. M. (1885). Uber die zeit der erken-nung und benennung schriftzeichen, bildern und far-ben. Philosophische Studien, 2 , 635–650.
49
Cave, K. R., & Wolfe, J. M. (1990). Modeling therole of parallel processing in visual search. CognitivePsychology , 22 , 225–271.
Chelazzi, L., Duncan, J., Miller, E. K., & Desimone,R. (1998). Responses of neurons in inferior temporalcortex during memory-guided visual search. Journal ofNeurophysiology , 80 , 2918–2940.
Chelazzi, L., Miller, E. K., Duncan, J., & Desimone,R. (1993). A neural basis for visual search in inferiortemporal cortex. Nature, 363 , 345–347.
Cowan, N. (1995). Attention and memory: An inte-grated framework. New York, NY: Oxford UniversityPress.
Cowan, N. (2001). The magical number 4 in short-termmemory: A reconsideration of mental storage capacity.Behavioral and Brain Sciences, 24 , 87–185.
Cowan, N. (2005). Working memory capacity. NewYork, NY: Psychology Press.
Dehaene, S., Kerszberg, M., & Changeux, J.-P. (1998).A neuronal model of a global workspace in effortfulcognitive tasks. Proceedings of the National Academyof Sciences, 95 , 14529–14534.
Desimone, R. (1999). Visual attention mediatedby biased competition in extrastriate cortex. InG. W. Humphreys, J. Duncan, & A. Treisman (Eds.),
50
Attention, space, and action (pp. 13–31). Oxford, UK:Oxford University Press.
Desimone, R., & Duncan, J. (1995). Neural mecha-nisms of selective visual attention. Annual Review ofNeuroscience, 18 , 193–222.
Desimone, R., & Gross, C. G. (1979). Visual areas inthe temporal cortex of the macaque. Brain Research,178 , 363–380.
Desimone, R., & Ungerleider, L. G. (1989). Neu-ral mechanisms of visual perception in monkeys. InF. Boller & J. Grafman (Eds.), Handbook of neuropsy-chology (Vol. 2, pp. 267–299). Amsterdam, Nether-lands: Elsevier.
Deutsch, J. A., & Deutsch, D. (1963). Attention: Sometheoretical considerations. Psychological Review , 70 ,80–90.
Dubois, M., Kyllingsbæk, S., Prado, C., Musca, S. C.,Peiffer, E., Lassus-Sangosse, D., et al. (2010). Frac-tionating the multi-character processing deficit in de-velopmental dyslexia: Evidence from two case studies.Cortex , 46 , 717–738.
Duncan, J. (1984). Selective attention and the organi-zation of visual information. Journal of ExperimentalPsychology: General , 113 , 501–517.
51
Duncan, J. (1996). Cooperating brain systems in selec-tive perception and action. In T. Inui & J. L. McClel-land (Eds.), Attention and performance xvi: Informa-tion integration in perception and communication (pp.549–578). Cambridge, MA: MIT Press.
Duncan, J. (1998). Converging levels of analysis in thecognitive neuroscience of visual attention. Philosophi-cal Transactions of the Royal Society of London. SeriesB: Biological Sciences, 353 , 1307–1317.
Duncan, J., Bundesen, C., Olson, A., Humphreys, G.,Ward, R., Kyllingsbæk, S., et al. (2003). Attentionalfunctions in dorsal and ventral simultanagnosia. Cog-nitive Neuropsychology , 20 , 675–701.
Duncan, J., Humphreys, G., & Ward, R. (1997). Com-petitive brain activity in visual attention. CurrentOpinion in Neurobiology , 7 , 255–261.
Duncan, J., Ward, R., & Shapiro, K. (1994). Directmeasurement of attentional dwell time in human vision.Nature, 369 , 313–315.
Dyrholm, M., Kyllingsbæk, S., Espeseth, T., & Bunde-sen, C. (2011). Generalizing parametric models by in-troducing trial-by-trial parameter variability: The caseof tva. Journal of Mathematical Psychology , 55 , 416–429.
52
Efron, B., & Tibshirani, R. (1993). An introduction tothe bootstrap (Vol. 57). New York, NY: Chapman &Hall/CRC.
Finke, K., Bublak, P., Krummenacher, J., Kyllings-bæk, S., Muller, H. J., & Schneider, W. X. (2005).Usability of a theory of visual attention (tva) forparameter-based measurement of attention i: Evidencefrom normal subjects. Journal of the InternationalNeuropsychological Society , 11 , 832–842.
Habekost, T., & Bundesen, C. (2003). Patient as-sessment based on a theory of visual attention (tva):Subtle deficits after a right frontal-subcortical lesion.Neuropsychologia, 41 , 1171–1188.
Habekost, T., & Starrfelt, R. (2009). Visual atten-tion capacity: A review of tva-based patient studies.Scandinavian Journal of Psychology , 50 , 23–32.
Hebb, D. O. (1949). The organization of behavior: Aneuropsychological theory. New York, NY: Wiley.
Hinton, G. E., McClelland, J. L., & Rumelhart, D. E.(1986). Distributed representations. In D. E. Rumel-hart & J. L. McClelland (Eds.), Parallel distributedprocessing (Vol. 1, pp. 77–109). Cambridge, MA: MITPress.
Kobatake, E., Wang, G., & Tanaka, K. (1998). Ef-fects of shape-discrimination training on the selectiv-
53
ity of inferotemporal cells in adult monkeys. Journalof Neurophysiology , 80 , 324–330.
Kyllingsbæk, S. (2001). Parallel and serial selectiveprocessing in vision. Unpublished doctoral dissertation,University of Copenhagen, Copenhagen, Denmark.
Kyllingsbæk, S. (2006). Modeling visual attention.Behavior Research Methods, 38 , 123–133.
Kyllingsbæk, S., & Bundesen, C. (2007). Parallelprocessing in a multifeature whole-report paradigm.Journal of Experimental Psychology: Human Percep-tion and Performance, 33 , 64–82.
Kyllingsbæk, S., & Bundesen, C. (2009). Changingchange detection: Improving the reliability of measuresof visual short-term memory capacity. PsychonomicBulletin & Review , 16 , 1000–1010.
Kyllingsbæk, S., Markussen, B., & Bundesen, C.(2012). Testing a poisson counter model for visualidentification of briefly presented, mutually confusablesingle stimuli in pure accuracy tasks. Journal of Ex-perimental Psychology: Human Perception and Perfor-mance, 38 , 628–642.
Kyllingsbæk, S., Sy, J. L., & Giesbrecht, B. (2011). Un-derstanding the allocation of attention when faced withvarying perceptual load in partial report: A computa-tional approach. Neuropsychologia, 49 , 1487–1497.
54
Kyllingsbæk, S., Valla, C., Vanrie, J., & Bundesen, C.(2007). Effects of spatial separation between stimuli inwhole report from brief visual displays. Perception &Psychophysics, 69 , 1040–1050.
Lavie, N. (1995). Perceptual load as a necessary con-dition for selective attention. Journal of ExperimentalPsychology: Human Perception and Performance, 21 ,451–468.
Lavie, N. (2005). Distracted and confused?: Selectiveattention under load. Trends in Cognitive Sciences, 9 ,75–82.
Lavie, N., & Tsal, Y. (1994). Perceptual load as amajor determinant of the locus of selection in visualattention. Perception & Psychophysics, 56 , 183–197.
Logan, G. D. (1996). The code theory of visual atten-tion: An integration of space-based and object-basedattention. Psychological Review , 103 , 603–649.
Luce, R. D. (1963). Detection and recognition. InR. D. Luce, R. R. Bush, & E. Galanter (Eds.), Hand-book of mathematical psychology (pp. 103–189). NewYork, NY: Wiley.
Luck, S. J., & Vogel, E. K. (1997). The capacity ofvisual working memory for features and conjunctions.Nature, 390 , 279–281.
Marr, D. (1982). Vision. San Francisco, CA: W.H.Freeman and Company.
55
Martinez-Trujillo, J. C., & Treue, S. (2004). Feature-based attention increases the selectivity of populationresponses in primate visual cortex. Current Biology ,14 , 744–751.
McAdams, C. J., & Maunsell, J. H. (1999). Effectsof attention on orientation-tuning functions of singleneurons in macaque cortical area v4. The Journal ofNeuroscience, 19 , 431–441.
Moran, J., & Desimone, R. (1985). Selective atten-tion gates visual processing in the extrastriate cortex.Science, 229 , 782–784.
Nordfang, M., Dyrholm, M., & Bundesen, C. (2012).Identifying bottom-up and top-down components of at-tentional weight by experimental analysis and compu-tational modeling. Journal of Experimental Psychol-ogy: General .
Olsson, H., & Poom, L. (2005). Visual memory needscategories. Proceedings of the National Academy of Sci-ences of the United States of America, 102 , 8776–8780.
Pashler, H. (1988). Familiarity and visual change de-tection. Perception & Psychophysics, 44 , 369–378.
Petersen, A., & Andersen, T. S. (2012). The effectof exposure duration on visual character identificationin single, whole, and partial report. Journal of ex-perimental psychology. Human perception and perfor-mance, 38 , 498–514.
56
Petersen, A., Kyllingsbæk, S., & Bundesen, C. (2012).Measuring and modeling attentional dwell time. Psy-chonomic Bulletin & Review , 19 , 1029–1046.
Phillips, W. (1974). On the distinction between sensorystorage and short-term visual memory. Perception &Psychophysics, 16 , 283–290.
Raymond, J. E., Shapiro, K. L., & Arnell, K. M.(1992). Temporary suppression of visual processingin an rsvp task: An attentional blink. Journal of Ex-perimental Psychology: Human Perception and Perfor-mance, 18 , 849–860.
Reynolds, J. H., Chelazzi, L., & Desimone, R.(1999). Competitive mechanisms subserve attentionin macaque areas v2 and v4. The Journal of Neuro-science, 19 , 1736–1753.
Reynolds, J. H., & Heeger, D. J. (2009). The normal-ization model of attention. Neuron, 61 , 168–185.
Shepard, R. N. (1957). Stimulus and response gen-eralization: A stochastic model relating generalizationto distance in psychological space. Psychometrika, 22 ,325–345.
Shepard, R. N. (1958a). Stimulus and response general-ization: Deduction of the generalization gradient froma trace model. Psychological Review , 65 , 242-256.
57
Shepard, R. N. (1958b). Stimulus and response gen-eralization: Tests of a model relating generalization todistance in psychological space. Journal of Experimen-tal Psychology , 55 , 509–523.
Shibuya, H., & Bundesen, C. (1988). Visual selectionfrom multielement displays: measuring and modelingeffects of exposure duration. Journal of ExperimentalPsychology: Human Perception and Performance, 14 ,591-600.
Sørensen, T. A., & Kyllingsbæk, S. (2012). Short-term storage capacity for visual objects depends onexpertise. Acta Psychologica, 140 , 158–163.
Sperling, G. (1960). The information available in briefvisual presentations. Psychological Monographs: Gen-eral and Applied , 74 , 1–29.
Sperling, G. (1963). A model for visual memory tasks.Human Factors: The Journal of the Human Factorsand Ergonomics Society , 5 , 19–31.
Sperling, G. (1967). Successive approximations to amodel for short term memory. Acta Psychologica, 27 ,285–292.
Treisman, A. (1988). Features and objects: The four-teenth bartlett memorial lecture. The Quarterly Jour-nal of Experimental Psychology , 40 , 201–237.
Treisman, A. (1996). The binding problem. CurrentOpinion in Neurobiology , 6 , 171–178.
58
Treisman, A., & Gelade, G. (1980). A feature-integration theory of attention. Cognitive Psychology ,12 , 97–136.
Usher, M., & Cohen, J. D. (1999). Short term mem-ory and selection processes in a frontal-lobe model. InD. Heinke, G. W. Humphreys, & A. Olson (Eds.), Con-nectionist models in cognitive neuroscience (pp. 78–91). Berlin, Germany: Springer Verlag.
Vogel, E. K., Woodman, G. F., & Luck, S. J. (2001).Storage of features, conjunctions, and objects in visualworking memory. Journal of Experimental PsychologyHuman Perception and Performance, 27 , 92–114.
Wandell, B. A. (1995). Foundations of vision. Sunder-land, MA: Sinauer Associates.
Wheeler, M., & Treisman, A. (2002). Binding in visualshort term memory. Journal of Experimental Psychol-ogy: General , 131 , 48–64.
Wolfe, J. M. (1994). Guided search 2.0 a revised modelof visual search. Psychonomic Bulletin & Review , 1 ,202–238.
Wolfe, J. M., Cave, K. R., & Franzel, S. L. (1989).Guided search: An alternative to the feature integra-tion model for visual search. Journal of ExperimentalPsychology: Human perception and Performance, 15 ,419–433.
59
Zeki, S. (1993). A vision of the brain. Oxford, UK:Blackwell Scientific Publications.
Zhang, W., & Luck, S. J. (2008). Discrete fixed-resolution representations in visual working memory.Nature, 453 , 233–235.
60