Modeling Friction Stir Welding Process of Aluminum...
12
METALS AND MATERIALS International, Vol. 14, No. 2 (2008), pp. 247~258 Modeling Friction Stir Welding Process of Aluminum Alloys J.-H. Cho 1,* , S. H. Kang 2 , H. N. Han 2 , and K. H. Oh 2 1 Korea Institute of Materials Science, 66, Sangnam-dong, Changwon-si, Gyeongnam 641-010, Korea 2 School of Material Science and Engineering, Seoul National University, San 56-1, Sillim-dong, Gwanak-gu, Seoul 151-744, Korea The friction stir welding (FSW) process of aluminum alloys has been modeled using a two-dimensional Eulerian formulation. Velocity field and temperature distribution are strongly coupled and solved together using a stan- dard finite element scheme. A scalar state variable for hardening is also integrated using a streamline integration method along streamlines. A viscoplastic constitutive equation to consider plastic flow and strength variations was implemented for the process modeling. Precipitates inside AA6061 alloys are sensitive to elevated tem- peratures and affect strength evolution with temperature. The overall effects of the precipitate variations with temperature on strength were reflected using temperature-dependent material parameters. The material param- eters of constitutive equations were obtained from isothermal compression tests of various temperatures and strain rates. The effects of FSW process conditions on heating and hardening were investigated mainly near the tool pin. The microhardness distribution of the weld zone was compared with the prediction of strength. In addition, crystallographic texture evolutions were also predicted and compared with the experimental results. Keywords: friction stir welding, finite element, aluminum alloys, hardness, crystallographic texture 1. INTRODUCTION Friction stir welding (FSW) is a solid-state joining tech- nique effective for joining metallic and nonmetallic materi- als or materials which are difficult for fusion welding [1]. Its advantages include fewer defects, no filler materials, no shrinkage, and no toxic fumes. The process is also easily applied to milling machines and lowers set-up and training costs. Both the tool pin and shoulder jointly create a compli- cated material flow pattern. Various modeling approaches have been reported to help understand the thermal and kinematic behaviors of the FSW process. Combined two boundary value problems (BVP) were considered for the heat transfer of the FSW process. A steady state BVP was applied for the tool, and a transient BVP for the workpiece. To quantify the physical values of the process, temperatures in the workpiece and the tool were measured during FSW [2]. A combined experimental and predicted analysis showed that around 95% of the total heat generation during FSW flows into the workpiece and that the fraction of the rate of the plastic work dissipated as heat is about 80%. Colegrove et al. [3] investigated the material flow and temperature around the threaded tool pin. To over- come excessive heat generation, a viscosity relationship was used to include material softening. An analytical thermal model was presented to allow simulation of the asymmetric heat field under the tool shoulder due to viscous and interfa- cial friction dissipation in [4]. Another analytical model based on Coulomb’s law was also proposed in [5]. A contact variable was used to define the contact condition of stick, sliding, and partial stick/sliding in this model. A coupled thermo-mechanical FE model using the arbitrary Lagrangian Eulerian (ALE) of ABAQUS/explicit code was presented, and void formation was addressed in [6]. The model sug- gested that the development of the sticking contact condition at the tool pin and matrix interface is important for the suc- cess of the deposition process and prevention of the void during FSW. Most of the previous studies focused on temperature and velocity distributions in the model domains of interest. In addition to thermal and kinematic analyses, strength evolu- tion was carried out by Cho et al. [7-9]. Two- and three- dimensional models of the FSW process using a viscoplastic constitutive model for stainless steel have been discussed. Although modeling FSW processes requires three-dimen- sional formulations to better understand the complicated material flow, a two-dimensional approach has been still useful to validate material models of interest and to capture features of the process. A constitutive equation with strength evolution for AA6061 *Corresponding author: [email protected] doi: 10.3365/met.mat.2008.04.247 Published 26 April 2008
Transcript of Modeling Friction Stir Welding Process of Aluminum...
METALS AND MATERIALS International, Vol. 14, No. 2 (2008), pp. 247~258
Modeling Friction Stir Welding Process of Aluminum Alloys
J.-H. Cho1,*, S. H. Kang
2, H. N. Han
2, and K. H. Oh
2
1Korea Institute of Materials Science,
66, Sangnam-dong, Changwon-si, Gyeongnam 641-010, Korea2School of Material Science and Engineering, Seoul National University,
San 56-1, Sillim-dong, Gwanak-gu, Seoul 151-744, Korea
The friction stir welding (FSW) process of aluminum alloys has been modeled using a two-dimensional Eulerianformulation. Velocity field and temperature distribution are strongly coupled and solved together using a stan-dard finite element scheme. A scalar state variable for hardening is also integrated using a streamline integrationmethod along streamlines. A viscoplastic constitutive equation to consider plastic flow and strength variationswas implemented for the process modeling. Precipitates inside AA6061 alloys are sensitive to elevated tem-peratures and affect strength evolution with temperature. The overall effects of the precipitate variations withtemperature on strength were reflected using temperature-dependent material parameters. The material param-eters of constitutive equations were obtained from isothermal compression tests of various temperatures andstrain rates. The effects of FSW process conditions on heating and hardening were investigated mainly nearthe tool pin. The microhardness distribution of the weld zone was compared with the prediction of strength.In addition, crystallographic texture evolutions were also predicted and compared with the experimental results.
Keywords: friction stir welding, finite element, aluminum alloys, hardness, crystallographic texture
1. INTRODUCTION
Friction stir welding (FSW) is a solid-state joining tech-
nique effective for joining metallic and nonmetallic materi-
als or materials which are difficult for fusion welding [1]. Its
advantages include fewer defects, no filler materials, no
shrinkage, and no toxic fumes. The process is also easily
applied to milling machines and lowers set-up and training
costs. Both the tool pin and shoulder jointly create a compli-
cated material flow pattern.
Various modeling approaches have been reported to help
understand the thermal and kinematic behaviors of the FSW
process. Combined two boundary value problems (BVP)
were considered for the heat transfer of the FSW process. A
steady state BVP was applied for the tool, and a transient
BVP for the workpiece. To quantify the physical values of
the process, temperatures in the workpiece and the tool were
measured during FSW [2]. A combined experimental and
predicted analysis showed that around 95% of the total heat
generation during FSW flows into the workpiece and that the
fraction of the rate of the plastic work dissipated as heat is
about 80%. Colegrove et al. [3] investigated the material
flow and temperature around the threaded tool pin. To over-
come excessive heat generation, a viscosity relationship was
used to include material softening. An analytical thermal
model was presented to allow simulation of the asymmetric
heat field under the tool shoulder due to viscous and interfa-
cial friction dissipation in [4]. Another analytical model
based on Coulomb’s law was also proposed in [5]. A contact
variable was used to define the contact condition of stick,
sliding, and partial stick/sliding in this model. A coupled
thermo-mechanical FE model using the arbitrary Lagrangian
Eulerian (ALE) of ABAQUS/explicit code was presented,
and void formation was addressed in [6]. The model sug-
gested that the development of the sticking contact condition
at the tool pin and matrix interface is important for the suc-
cess of the deposition process and prevention of the void
during FSW.
Most of the previous studies focused on temperature and
velocity distributions in the model domains of interest. In
addition to thermal and kinematic analyses, strength evolu-
tion was carried out by Cho et al. [7-9]. Two- and three-
dimensional models of the FSW process using a viscoplastic
constitutive model for stainless steel have been discussed.
Although modeling FSW processes requires three-dimen-
sional formulations to better understand the complicated
material flow, a two-dimensional approach has been still
useful to validate material models of interest and to capture
features of the process.
A constitutive equation with strength evolution for AA6061*Corresponding author: [email protected]
doi: 10.3365/met.mat.2008.04.247 Published 26 April 2008
248 J.-H. Cho et al.
alloys is presented in this paper. Age hardening materials,
such as AA6xxx, contain various precipitates and their
strength evolutions are closely related to variations of the
precipitate size, density, and shape (or microstructural evolu-
tions). Heating by shearing can vary with position during
FSW, and the precipitates can dissolve or coarsen in the
regions with elevated temperatures. In that case, strength
changes with temperature significantly. The measured hard-
ness of stainless steel usually showed increased values after
FSW because of strain hardening [10,11]. In previous exper-
iments, aluminum alloys, however, displayed more variable
hardness distributions with welded position than stainless
steel [12-16]. The hardness usually dropped in the weld zone
of AA6061. To reflect the temperature dependence of strength,
previous modeling work on stainless steel was modified for
AA6061 alloys.
The strength in the viscoplastic model for AA6061 alloys
can decrease or increase with welding conditions. Material
parameters have been calculated from the reported experi-
mental data for aluminum 6061 alloys. Various data from
isothermal compression tests, which cover a temperature
range of 298 K to 773 K and a strain rate of 0.001 s-1
to 20s-1,
were used. The effects of variational precipitates with tem-
perature on strength were indirectly reflected by tempera-
ture-dependent material parameters. The computed strength
values were compared to the measured hardness. Texture
evolution during FSW was also discussed in this paper.
Shear deformation was dominant in both experiments and
predictions.
2. NUMERICAL MODELING OF THE FORMING
PROCESS
2.1. Balance law
The motion and temperature of the workpieces are gov-
erned by balance laws for mass, momentum, and energy [17]
and are given as follows:
conservation of mass (1)
balance of linear momentum (2)
conservation of energy (1)
where ρ is the density, u is the velocity, σ is the Cauchy
stress, b is the body force, e is the internal energy, q is the
heat flux, and is the volumetric heat source. Inertia has
been neglected, and the heat generation includes a contribu-
tion from viscous dissipation. Boundary conditions are speci-
fied for the motion and energy of the workpiece. For the
motion, either known tractions or velocities are imposed on
the surface:
on ST (4)
on Su (5)
where η is the surface normal vector, is a known traction
vector, and is a known velocity vector. ST and Su are por-
tions of the total surface, S. In the case of sliding friction over
a portion of the boundary, the tangential component of the
surface traction may be due to the frictional contact with the
forming equipment, such as a tool pin or die. In this case the
traction vector is written as,
(6)
where β is a coefficient that can depend on the temperature
and traction, especially its normal component, and the sub-
script, t, indicates the tangential component.
2.2. Thermal and mechanical responses
The thermal and plastic behaviors of materials are charac-
terized implementing constitutive equations. The internal
energy and heat flux for thermal behaviors are written as
functions of the rate of deformation, temperature, and state
variables of the materials. For thermal behavior, internal
energy, e, and heat flux, q, are assumed to represent the
material approximately,
(7)
and
(8)
The specific heat, cp, and conductivity, k, are often specified
as functions of temperature.
For viscoplastic behavior, the constitutive equations are
also required to describe the plastic flow of the metal work-
piece. The state variable model originally proposed by Hart
[18] was applied to solid-state welding process [19,20]. The
modified isotropic model for the flow stress and strength
was successfully applied to stainless steel in [7]. The flow
stress of the constitutive equations depends on the tempera-
ture, the rate of deformation, and state variables. The flow
stress varies with the difference between the hardening and
recovery, which are related to the accumulation and annihila-
tion of crystal defects (i.e. dislocation), respectively. The
simplified Hart’s model incorporates two contributions to
the flow stress: one called a plastic contribution and the other
a viscous contribution.
(9)
where is the effective Cauchy stress and τP and τV are the
DρDt------- ρdivu+ 0=
divσT
b+ 0=
ρDe
Dt------- divq Q
·–+ 0=
Q·
σ η⋅ T=
u u=
T
u
Tt β utool u–( )t=
D
Dt------ e( ) cp
D
Dt------ θ( )=
q k– gradθ=
σ τ τP τV+= =
σ
Modeling Friction Stir Welding Process of Aluminum Alloys 249
plastic and viscous contributions to the rate and temperature
dependent flow stress, τ. These contributions are written as
where
(10)
(11)
and
(12)
(13)
where D is the effective value of the deformation rate, D, and
k is the strength. The viscous term is small compared to the
plastic part. This term, however, plays an important role in
total stress at relatively low temperatures or very high defor-
mation rates. The material model parameters, G, Q, Q', M, N,
λ, b0, and a0 for AA6061 have been determined using com-
pression test data [21] and are listed in Table 1.
The rate of the strength change in the Hart model is
approximately proportional to the deformation rate at low
temperatures or at a high deformation rate. The FSW process
is expected to have the highest deformation rate and heating
around the tool pin. A limited saturation value for the
strength was successfully applied to these severe deforma-
tion conditions in the FSW of stainless steel. A Voce-like sat-
uration limit for the strength was introduced:
(14)
The saturation limit for the strength varies with both temper-
ature and deformation rate via the Fisher factor. The Fisher
factor [22], ϕ, is given:
(15)
τV GD
a----⎝ ⎠⎛ ⎞
1
M-----
=
a a0expQ′Rθ-------–⎝ ⎠
⎛ ⎞=
τP κexpb
D----–⎝ ⎠
⎛ ⎞–λ
=
b b0
κG----⎝ ⎠⎛ ⎞
N
expQ
Rθ-------–⎝ ⎠
⎛ ⎞=
κsat C
ϕ----⎝ ⎠⎛ ⎞
m0
=
ϕ θlnD0
D------⎝ ⎠⎛ ⎞=
Table 1. Material parameters for the simplified Hart’s model for AA6061
a0[s-1] b0[s
-1] G[GPa] κ0[MPa] Q [kcal/mole]
1.30×1045
1.03×10²³
70.0 100.0 37.5
Q' [kcal/mole] λ M N
37.5 0.15 7.8 5.0
Table 2. Material parameters for the strength evolution of AA6061
h0 [GPa] n0 D0 [s-1] κss [MPa]
5 9 10×1010
50
m0 (θ)
2.84-0.015×θ+2.14×θ2
C(θ)[MPa]
180-0.42×θ+2.66×θ2
Note: θ in the table represents temperature. m0 and C are temperature-dependent and are assumed to remain constant below 298 K.
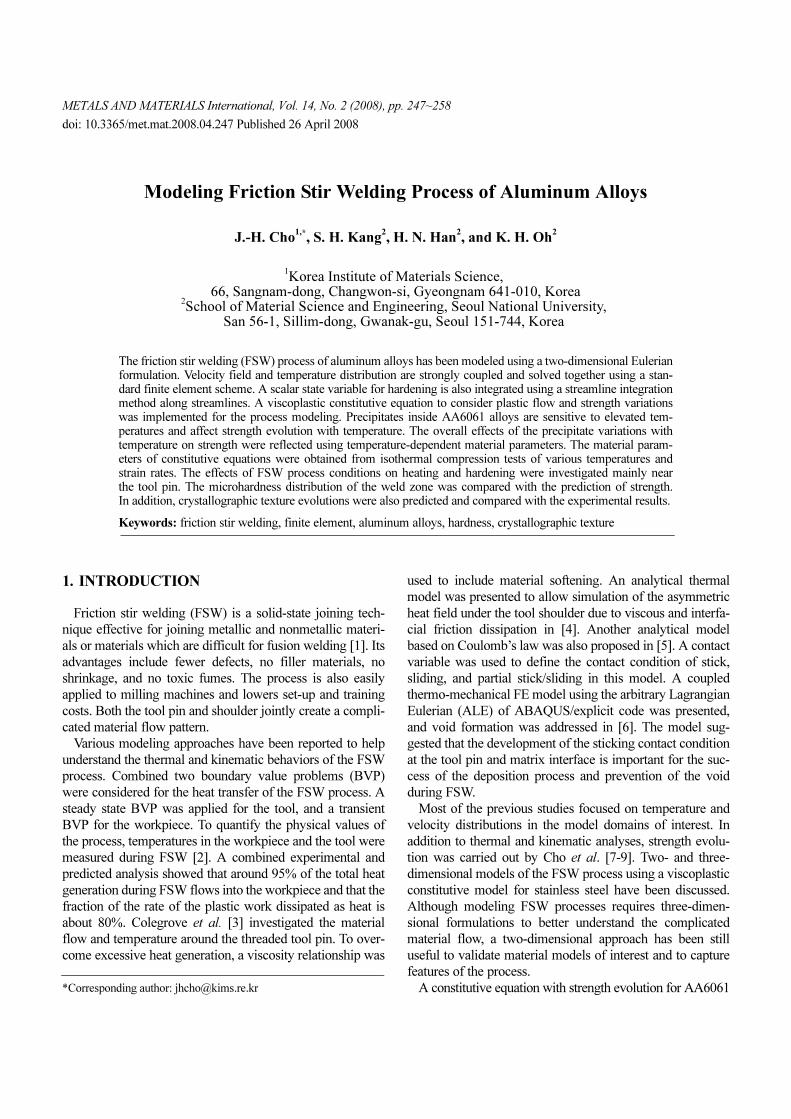
Fig. 1. Linear regression between the Fisher factor and the saturated stress estimation at given temperatures of (a) 473 K, (b) 573 K, (c) 673 K,and (d) 773 K.
250 J.-H. Cho et al.
In addition to saturation limit of the strength, the temperature-
dependent material parameters of C and m0(θ) in Eq. 14 were
introduced to reflect the strength distribution sensitive to tem-
perature. The evolution is then written as
(16)
where h0 and n0 are experimentally-determined model param-
eters.
Table 2 lists the material parameters of AA6061 for
strength evolution. Figure 1 shows the estimated saturation
stress levels for AA6061 as a function of the Fisher factor
during compression at various temperatures [21]. Aluminum
alloys usually have higher specific heat capacities and heat
conduction coefficients than stainless steel. The specific heat
capacity and heat conductivity of aluminum are about twice
and ten times higher than those of stainless steel, respec-
tively. Thus, temperature distributions were different from
those of stainless steel during the thermo-mechanical pro-
cesses.
The relationship between the Fisher factor and strength
was considered under the conditions of various deformation
rates at a constant temperature. At the given temperature,
ln(1/ϕ) and lnκ have a linear relationship according to the
deformation rate approximately. Using linear regression, m0
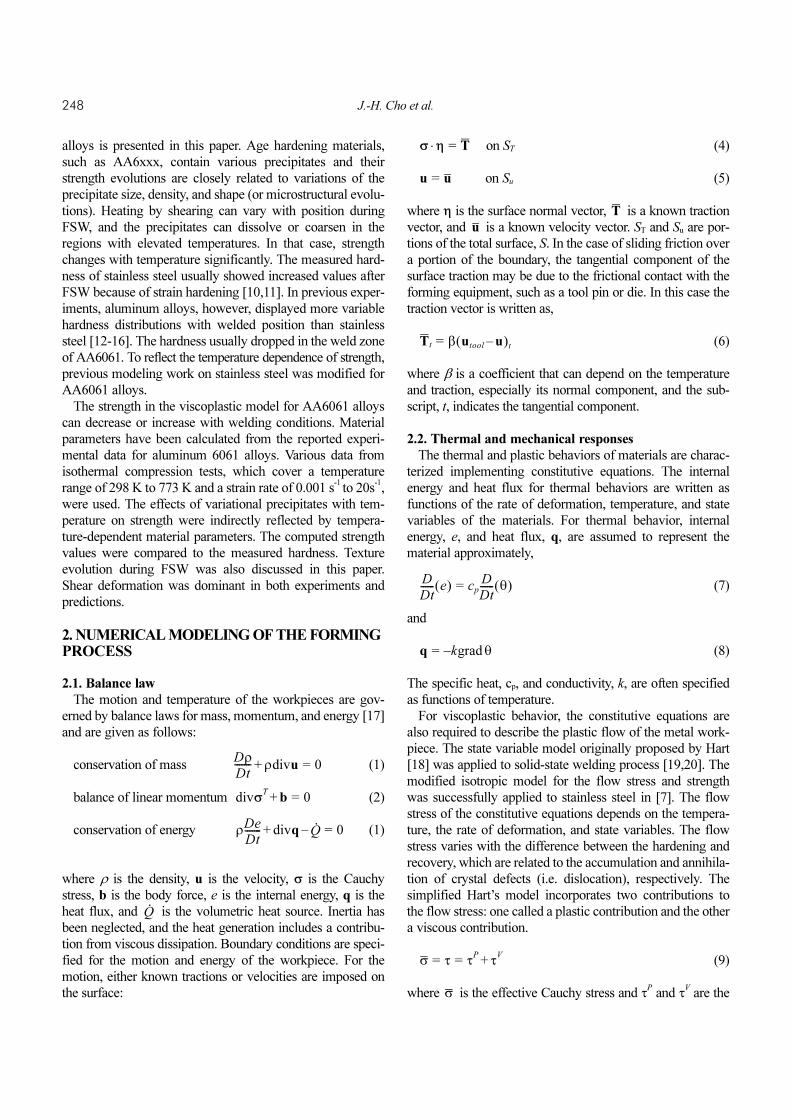
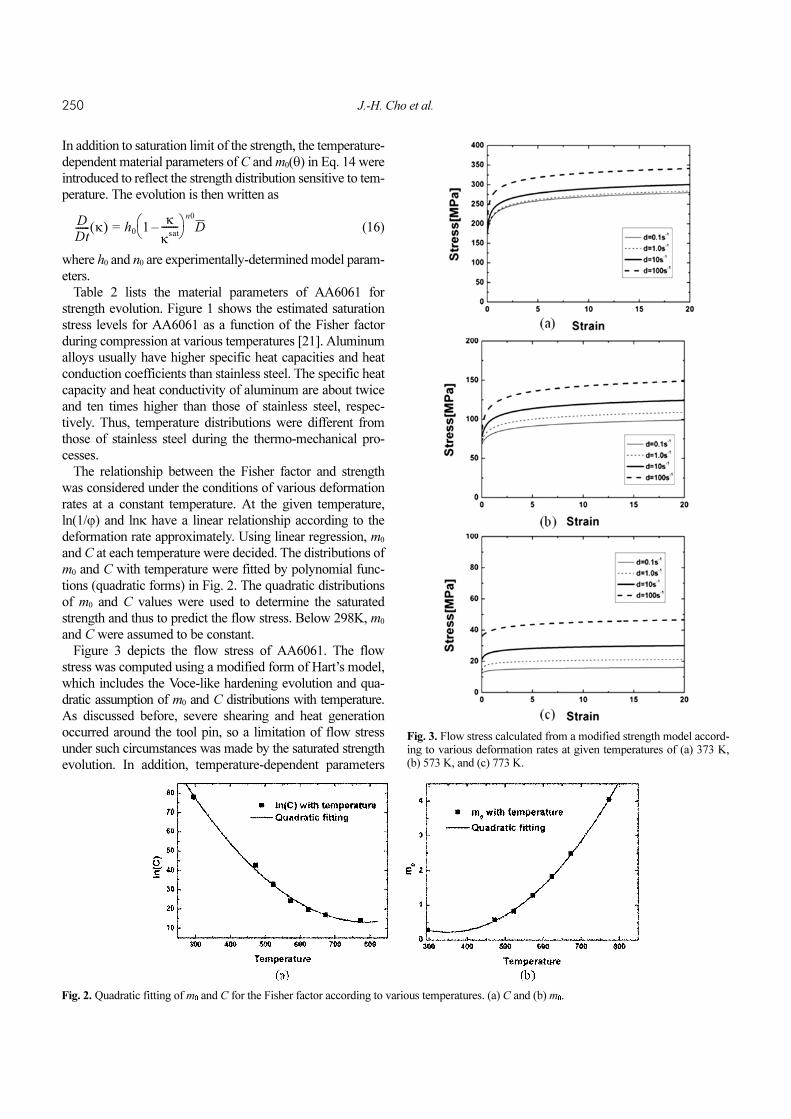
and C at each temperature were decided. The distributions of
m0 and C with temperature were fitted by polynomial func-
tions (quadratic forms) in Fig. 2. The quadratic distributions
of m0 and C values were used to determine the saturated
strength and thus to predict the flow stress. Below 298K, m0
and C were assumed to be constant.
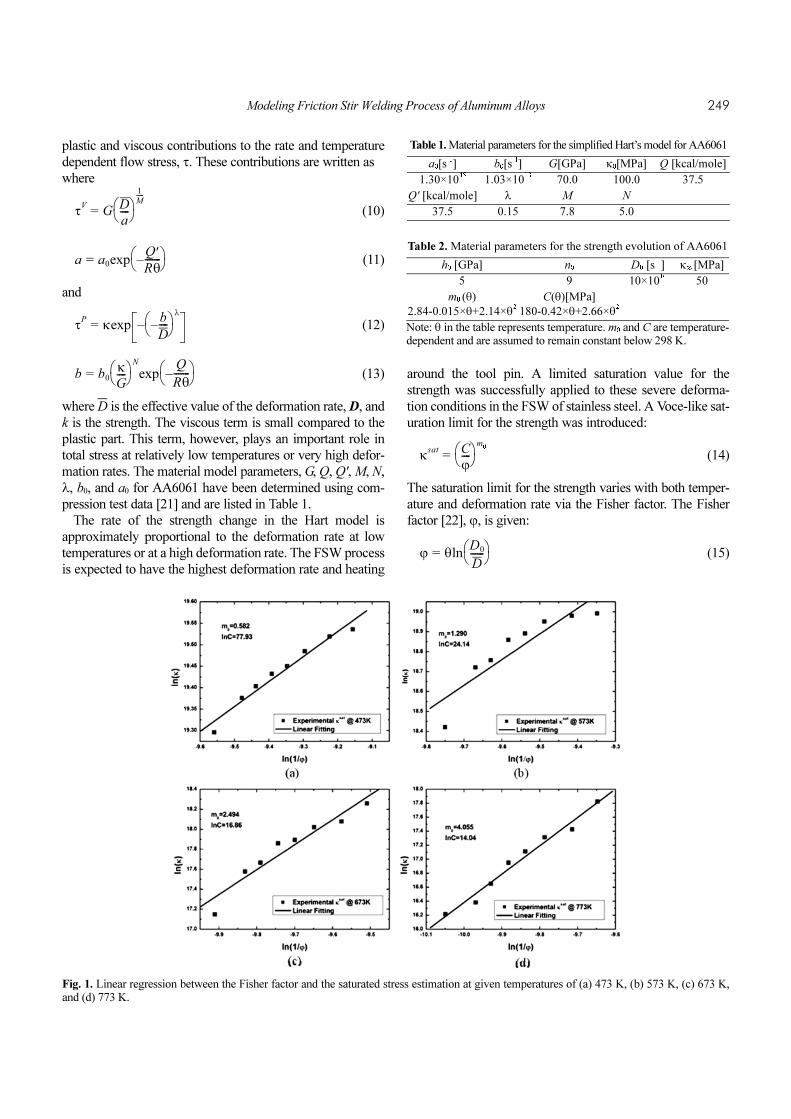
Figure 3 depicts the flow stress of AA6061. The flow
stress was computed using a modified form of Hart’s model,
which includes the Voce-like hardening evolution and qua-
dratic assumption of m0 and C distributions with temperature.
As discussed before, severe shearing and heat generation
occurred around the tool pin, so a limitation of flow stress
under such circumstances was made by the saturated strength
evolution. In addition, temperature-dependent parameters
D
Dt------ κ( ) h0 1
κκsat-------–⎝ ⎠
⎛ ⎞n0D=
Fig. 2. Quadratic fitting of m0 and C for the Fisher factor according to various temperatures. (a) C and (b) m0.
Fig. 3. Flow stress calculated from a modified strength model accord-ing to various deformation rates at given temperatures of (a) 373 K,(b) 573 K, and (c) 773 K.
Modeling Friction Stir Welding Process of Aluminum Alloys 251
were introduced. At 373 K, the saturated flow stress of
AA6061 was in the range of 250 MPa to 350 MPa according
to various deformation rates. The saturated stress values at
an elevated temperature of 773 K decreased, and the flow
stress varied from 20 MPa to 50 MPa. The saturation values
of the computed stress matched those of the flow stress
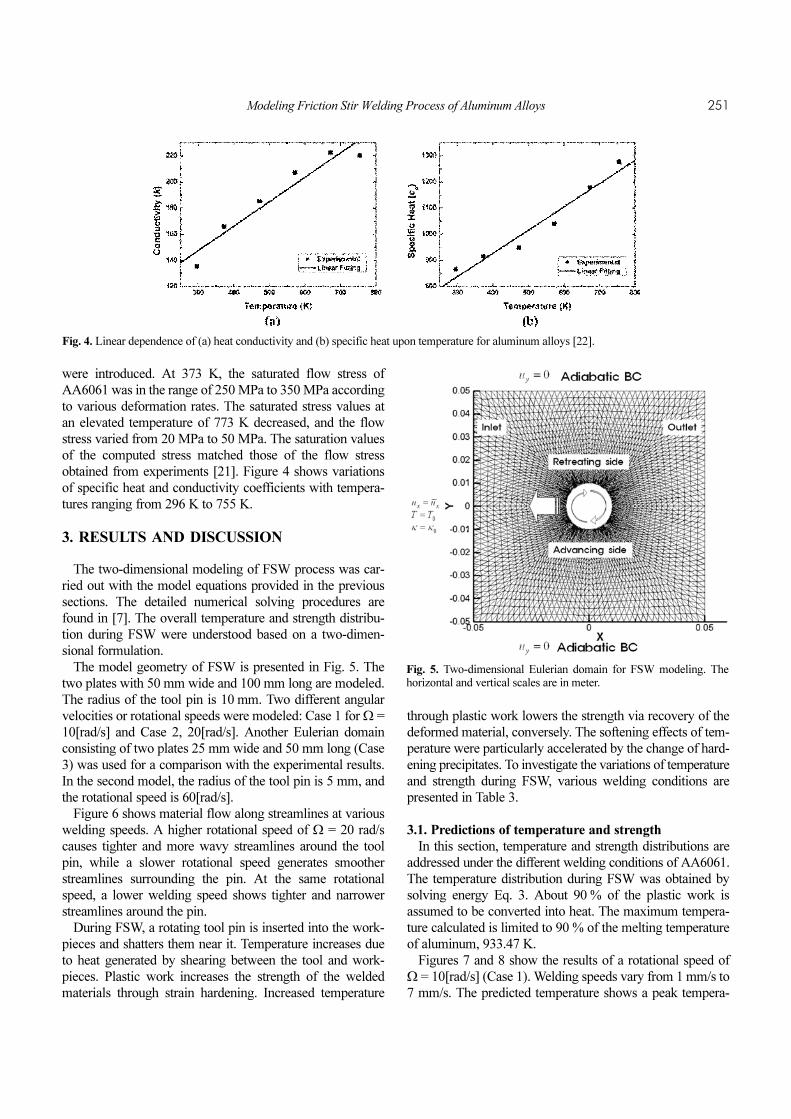
obtained from experiments [21]. Figure 4 shows variations
of specific heat and conductivity coefficients with tempera-
tures ranging from 296 K to 755 K.
3. RESULTS AND DISCUSSION
The two-dimensional modeling of FSW process was car-
ried out with the model equations provided in the previous
sections. The detailed numerical solving procedures are
found in [7]. The overall temperature and strength distribu-
tion during FSW were understood based on a two-dimen-
sional formulation.
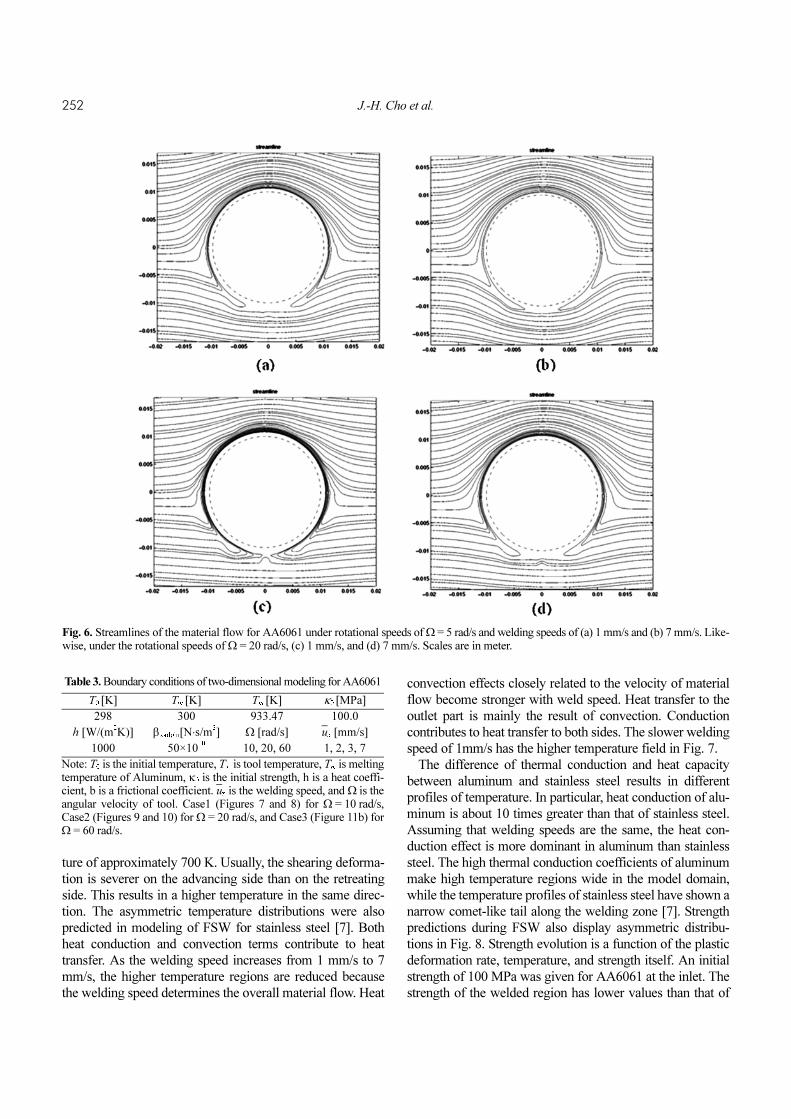
The model geometry of FSW is presented in Fig. 5. The
two plates with 50 mm wide and 100 mm long are modeled.
The radius of the tool pin is 10 mm. Two different angular
velocities or rotational speeds were modeled: Case 1 for Ω =
10[rad/s] and Case 2, 20[rad/s]. Another Eulerian domain
consisting of two plates 25 mm wide and 50 mm long (Case
3) was used for a comparison with the experimental results.
In the second model, the radius of the tool pin is 5 mm, and
the rotational speed is 60[rad/s].
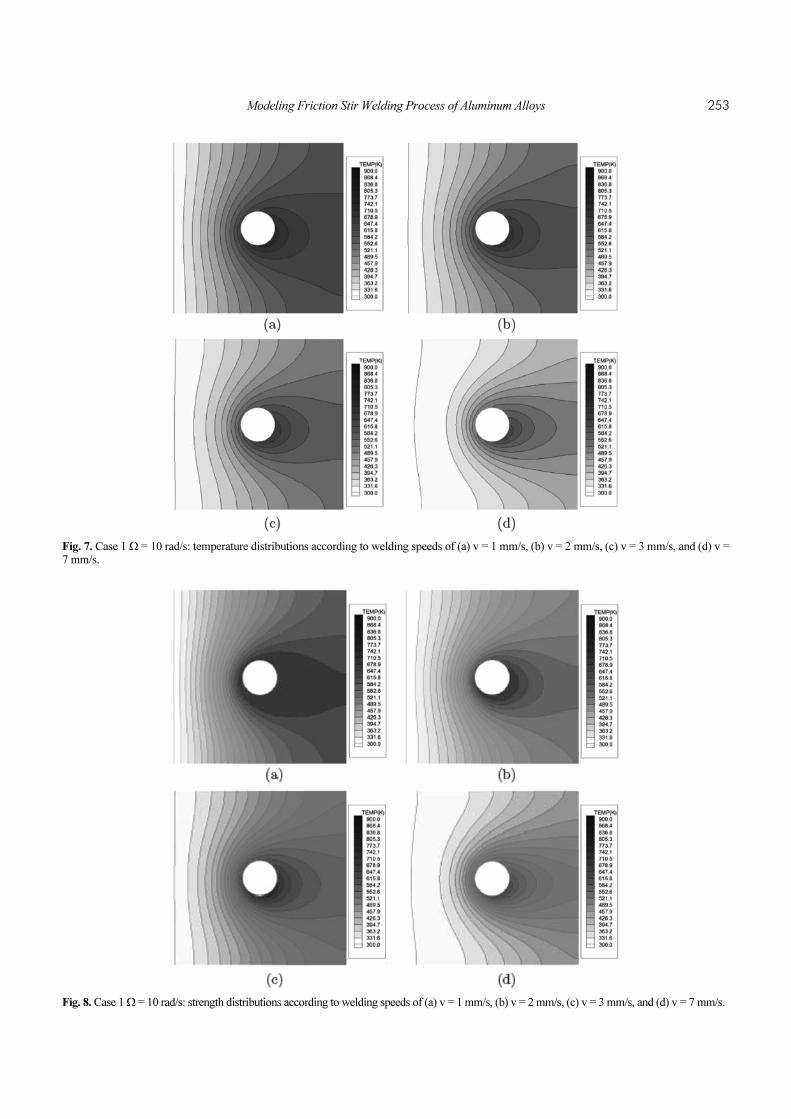
Figure 6 shows material flow along streamlines at various
welding speeds. A higher rotational speed of Ω = 20 rad/s
causes tighter and more wavy streamlines around the tool
pin, while a slower rotational speed generates smoother
streamlines surrounding the pin. At the same rotational
speed, a lower welding speed shows tighter and narrower
streamlines around the pin.
During FSW, a rotating tool pin is inserted into the work-
pieces and shatters them near it. Temperature increases due
to heat generated by shearing between the tool and work-
pieces. Plastic work increases the strength of the welded
materials through strain hardening. Increased temperature
through plastic work lowers the strength via recovery of the
deformed material, conversely. The softening effects of tem-
perature were particularly accelerated by the change of hard-
ening precipitates. To investigate the variations of temperature
and strength during FSW, various welding conditions are
presented in Table 3.
3.1. Predictions of temperature and strength
In this section, temperature and strength distributions are
addressed under the different welding conditions of AA6061.
The temperature distribution during FSW was obtained by
solving energy Eq. 3. About 90 % of the plastic work is
assumed to be converted into heat. The maximum tempera-
ture calculated is limited to 90 % of the melting temperature
of aluminum, 933.47 K.
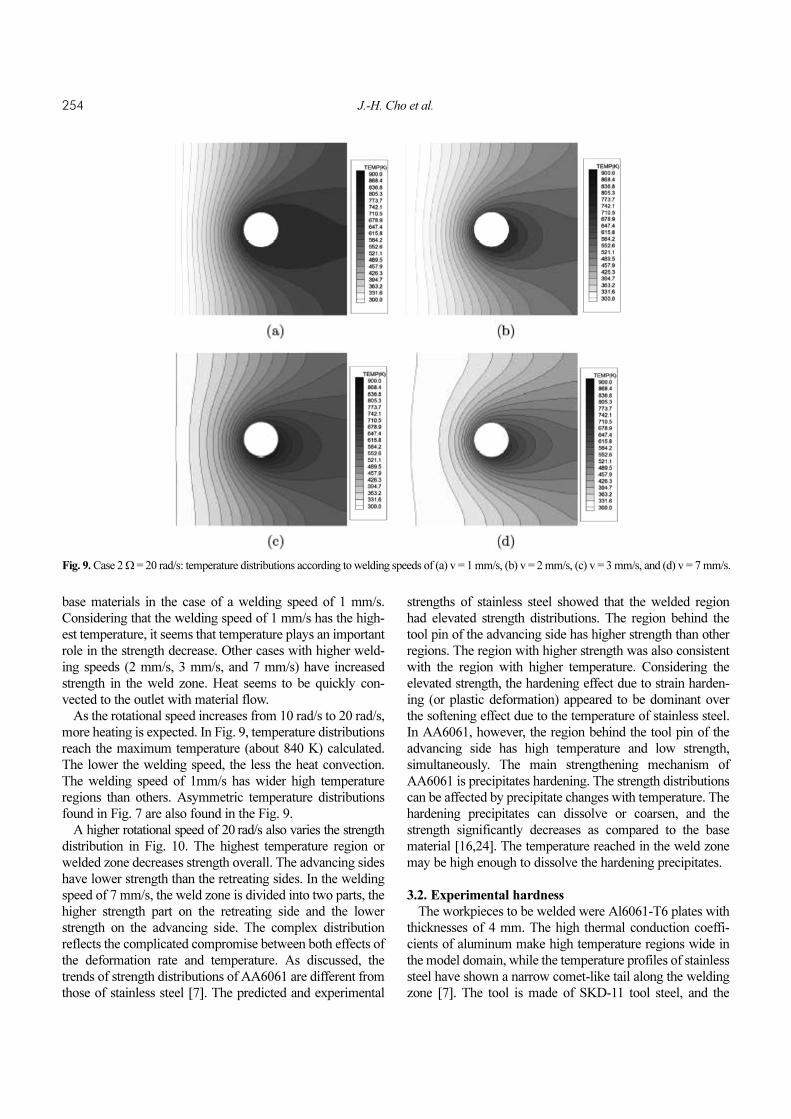
Figures 7 and 8 show the results of a rotational speed of
Ω = 10[rad/s] (Case 1). Welding speeds vary from 1 mm/s to
7 mm/s. The predicted temperature shows a peak tempera-
Fig. 4. Linear dependence of (a) heat conductivity and (b) specific heat upon temperature for aluminum alloys [22].
Fig. 5. Two-dimensional Eulerian domain for FSW modeling. Thehorizontal and vertical scales are in meter.
252 J.-H. Cho et al.
ture of approximately 700 K. Usually, the shearing deforma-
tion is severer on the advancing side than on the retreating
side. This results in a higher temperature in the same direc-
tion. The asymmetric temperature distributions were also
predicted in modeling of FSW for stainless steel [7]. Both
heat conduction and convection terms contribute to heat
transfer. As the welding speed increases from 1 mm/s to 7
mm/s, the higher temperature regions are reduced because
the welding speed determines the overall material flow. Heat
convection effects closely related to the velocity of material
flow become stronger with weld speed. Heat transfer to the
outlet part is mainly the result of convection. Conduction
contributes to heat transfer to both sides. The slower welding
speed of 1mm/s has the higher temperature field in Fig. 7.
The difference of thermal conduction and heat capacity
between aluminum and stainless steel results in different
profiles of temperature. In particular, heat conduction of alu-
minum is about 10 times greater than that of stainless steel.
Assuming that welding speeds are the same, the heat con-
duction effect is more dominant in aluminum than stainless
steel. The high thermal conduction coefficients of aluminum
make high temperature regions wide in the model domain,
while the temperature profiles of stainless steel have shown a
narrow comet-like tail along the welding zone [7]. Strength
predictions during FSW also display asymmetric distribu-
tions in Fig. 8. Strength evolution is a function of the plastic
deformation rate, temperature, and strength itself. An initial
strength of 100 MPa was given for AA6061 at the inlet. The
strength of the welded region has lower values than that of
Fig. 6. Streamlines of the material flow for AA6061 under rotational speeds of Ω = 5 rad/s and welding speeds of (a) 1 mm/s and (b) 7 mm/s. Like-wise, under the rotational speeds of Ω = 20 rad/s, (c) 1 mm/s, and (d) 7 mm/s. Scales are in meter.
Table 3. Boundary conditions of two-dimensional modeling for AA6061
T0 [K] T∞ [K] Tm [K] κ0 [MPa]
298 300 933.47 100.0
h [W/(m2K)] βtoolpin[N⋅s/m
3] Ω [rad/s] ux [mm/s]
1000 50×1010
10, 20, 60 1, 2, 3, 7
Note: T0 is the initial temperature, T∞ is tool temperature, Tm is meltingtemperature of Aluminum, κ0 is the initial strength, h is a heat coeffi-cient, b is a frictional coefficient. ux is the welding speed, and Ω is theangular velocity of tool. Case1 (Figures 7 and 8) for Ω = 10 rad/s,Case2 (Figures 9 and 10) for Ω = 20 rad/s, and Case3 (Figure 11b) forΩ = 60 rad/s.
Modeling Friction Stir Welding Process of Aluminum Alloys 253
Fig. 7. Case 1 Ω = 10 rad/s: temperature distributions according to welding speeds of (a) v = 1 mm/s, (b) v = 2 mm/s, (c) v = 3 mm/s, and (d) v =7 mm/s.
Fig. 8. Case 1 Ω = 10 rad/s: strength distributions according to welding speeds of (a) v = 1 mm/s, (b) v = 2 mm/s, (c) v = 3 mm/s, and (d) v = 7 mm/s.
254 J.-H. Cho et al.
base materials in the case of a welding speed of 1 mm/s.
Considering that the welding speed of 1 mm/s has the high-
est temperature, it seems that temperature plays an important
role in the strength decrease. Other cases with higher weld-
ing speeds (2 mm/s, 3 mm/s, and 7 mm/s) have increased
strength in the weld zone. Heat seems to be quickly con-
vected to the outlet with material flow.
As the rotational speed increases from 10 rad/s to 20 rad/s,
more heating is expected. In Fig. 9, temperature distributions
reach the maximum temperature (about 840 K) calculated.
The lower the welding speed, the less the heat convection.
The welding speed of 1mm/s has wider high temperature
regions than others. Asymmetric temperature distributions
found in Fig. 7 are also found in the Fig. 9.
A higher rotational speed of 20 rad/s also varies the strength
distribution in Fig. 10. The highest temperature region or
welded zone decreases strength overall. The advancing sides
have lower strength than the retreating sides. In the welding
speed of 7 mm/s, the weld zone is divided into two parts, the
higher strength part on the retreating side and the lower
strength on the advancing side. The complex distribution
reflects the complicated compromise between both effects of
the deformation rate and temperature. As discussed, the
trends of strength distributions of AA6061 are different from
those of stainless steel [7]. The predicted and experimental
strengths of stainless steel showed that the welded region
had elevated strength distributions. The region behind the
tool pin of the advancing side has higher strength than other
regions. The region with higher strength was also consistent
with the region with higher temperature. Considering the
elevated strength, the hardening effect due to strain harden-
ing (or plastic deformation) appeared to be dominant over
the softening effect due to the temperature of stainless steel.
In AA6061, however, the region behind the tool pin of the
advancing side has high temperature and low strength,
simultaneously. The main strengthening mechanism of
AA6061 is precipitates hardening. The strength distributions
can be affected by precipitate changes with temperature. The
hardening precipitates can dissolve or coarsen, and the
strength significantly decreases as compared to the base
material [16,24]. The temperature reached in the weld zone
may be high enough to dissolve the hardening precipitates.
3.2. Experimental hardness
The workpieces to be welded were Al6061-T6 plates with
thicknesses of 4 mm. The high thermal conduction coeffi-
cients of aluminum make high temperature regions wide in
the model domain, while the temperature profiles of stainless
steel have shown a narrow comet-like tail along the welding
zone [7]. The tool is made of SKD-11 tool steel, and the
Fig. 9. Case 2 Ω = 20 rad/s: temperature distributions according to welding speeds of (a) v = 1 mm/s, (b) v = 2 mm/s, (c) v = 3 mm/s, and (d) v = 7 mm/s.
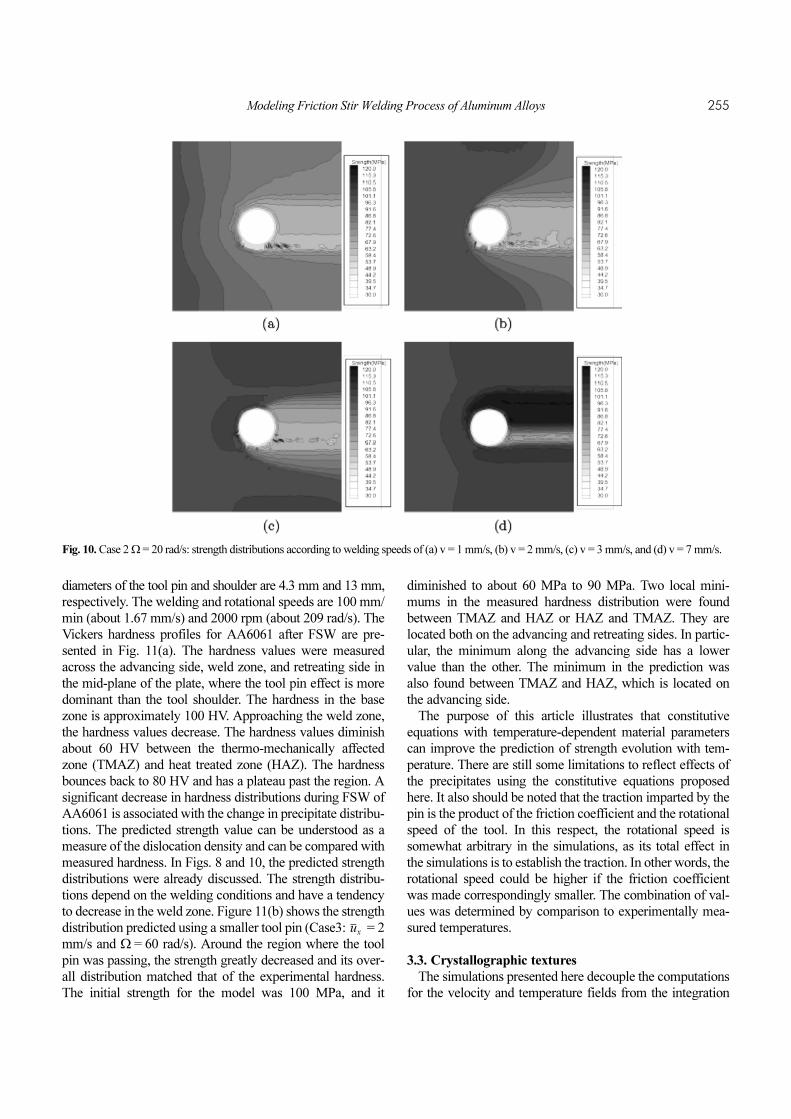
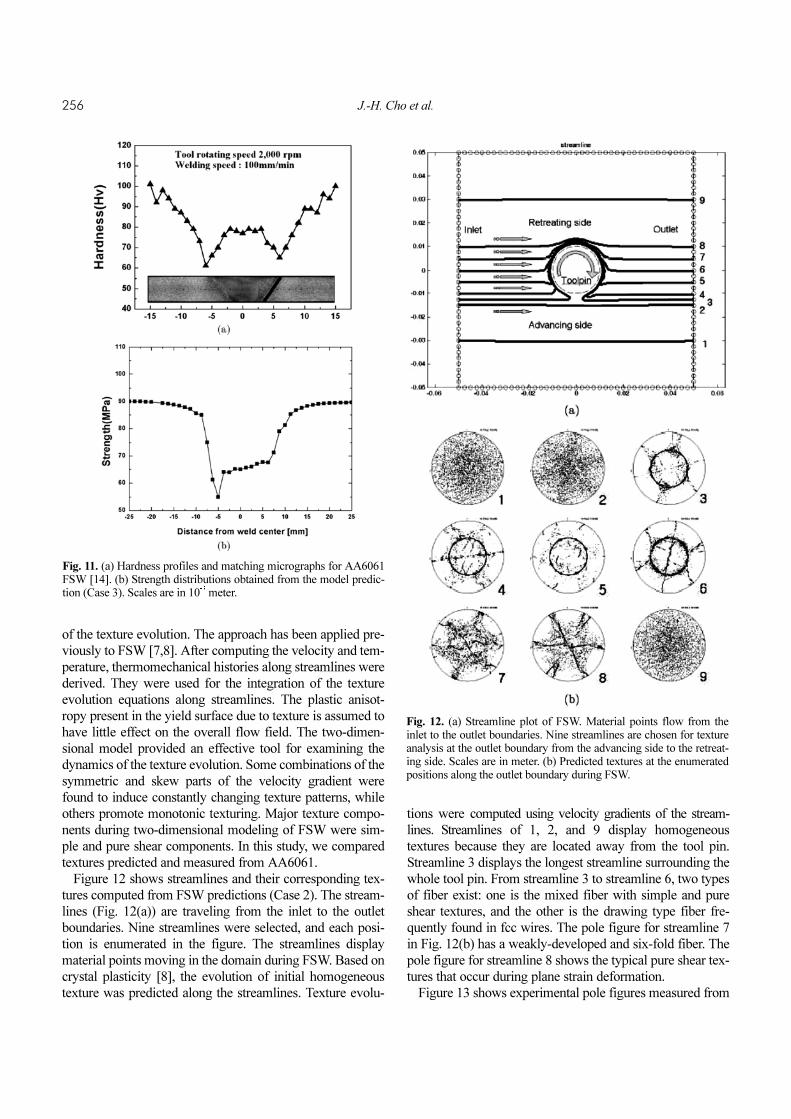
Modeling Friction Stir Welding Process of Aluminum Alloys 255
diameters of the tool pin and shoulder are 4.3 mm and 13 mm,
respectively. The welding and rotational speeds are 100 mm/
min (about 1.67 mm/s) and 2000 rpm (about 209 rad/s). The
Vickers hardness profiles for AA6061 after FSW are pre-
sented in Fig. 11(a). The hardness values were measured
across the advancing side, weld zone, and retreating side in
the mid-plane of the plate, where the tool pin effect is more
dominant than the tool shoulder. The hardness in the base
zone is approximately 100 HV. Approaching the weld zone,
the hardness values decrease. The hardness values diminish
about 60 HV between the thermo-mechanically affected
zone (TMAZ) and heat treated zone (HAZ). The hardness
bounces back to 80 HV and has a plateau past the region. A
significant decrease in hardness distributions during FSW of
AA6061 is associated with the change in precipitate distribu-
tions. The predicted strength value can be understood as a
measure of the dislocation density and can be compared with
measured hardness. In Figs. 8 and 10, the predicted strength
distributions were already discussed. The strength distribu-
tions depend on the welding conditions and have a tendency
to decrease in the weld zone. Figure 11(b) shows the strength
distribution predicted using a smaller tool pin (Case3: = 2
mm/s and Ω = 60 rad/s). Around the region where the tool
pin was passing, the strength greatly decreased and its over-
all distribution matched that of the experimental hardness.
The initial strength for the model was 100 MPa, and it
diminished to about 60 MPa to 90 MPa. Two local mini-
mums in the measured hardness distribution were found
between TMAZ and HAZ or HAZ and TMAZ. They are
located both on the advancing and retreating sides. In partic-
ular, the minimum along the advancing side has a lower
value than the other. The minimum in the prediction was
also found between TMAZ and HAZ, which is located on
the advancing side.
The purpose of this article illustrates that constitutive
equations with temperature-dependent material parameters
can improve the prediction of strength evolution with tem-
perature. There are still some limitations to reflect effects of
the precipitates using the constitutive equations proposed
here. It also should be noted that the traction imparted by the
pin is the product of the friction coefficient and the rotational
speed of the tool. In this respect, the rotational speed is
somewhat arbitrary in the simulations, as its total effect in
the simulations is to establish the traction. In other words, the
rotational speed could be higher if the friction coefficient
was made correspondingly smaller. The combination of val-
ues was determined by comparison to experimentally mea-
sured temperatures.
3.3. Crystallographic textures
The simulations presented here decouple the computations
for the velocity and temperature fields from the integration
ux
Fig. 10. Case 2 Ω = 20 rad/s: strength distributions according to welding speeds of (a) v = 1 mm/s, (b) v = 2 mm/s, (c) v = 3 mm/s, and (d) v = 7 mm/s.
256 J.-H. Cho et al.
of the texture evolution. The approach has been applied pre-
viously to FSW [7,8]. After computing the velocity and tem-
perature, thermomechanical histories along streamlines were
derived. They were used for the integration of the texture
evolution equations along streamlines. The plastic anisot-
ropy present in the yield surface due to texture is assumed to
have little effect on the overall flow field. The two-dimen-
sional model provided an effective tool for examining the
dynamics of the texture evolution. Some combinations of the
symmetric and skew parts of the velocity gradient were
found to induce constantly changing texture patterns, while
others promote monotonic texturing. Major texture compo-
nents during two-dimensional modeling of FSW were sim-
ple and pure shear components. In this study, we compared
textures predicted and measured from AA6061.
Figure 12 shows streamlines and their corresponding tex-
tures computed from FSW predictions (Case 2). The stream-
lines (Fig. 12(a)) are traveling from the inlet to the outlet
boundaries. Nine streamlines were selected, and each posi-
tion is enumerated in the figure. The streamlines display
material points moving in the domain during FSW. Based on
crystal plasticity [8], the evolution of initial homogeneous
texture was predicted along the streamlines. Texture evolu-
tions were computed using velocity gradients of the stream-
lines. Streamlines of 1, 2, and 9 display homogeneous
textures because they are located away from the tool pin.
Streamline 3 displays the longest streamline surrounding the
whole tool pin. From streamline 3 to streamline 6, two types
of fiber exist: one is the mixed fiber with simple and pure
shear textures, and the other is the drawing type fiber fre-
quently found in fcc wires. The pole figure for streamline 7
in Fig. 12(b) has a weakly-developed and six-fold fiber. The
pole figure for streamline 8 shows the typical pure shear tex-
tures that occur during plane strain deformation.
Figure 13 shows experimental pole figures measured from
Fig. 11. (a) Hardness profiles and matching micrographs for AA6061FSW [14]. (b) Strength distributions obtained from the model predic-tion (Case 3). Scales are in 10
-3 meter.
Fig. 12. (a) Streamline plot of FSW. Material points flow from theinlet to the outlet boundaries. Nine streamlines are chosen for textureanalysis at the outlet boundary from the advancing side to the retreat-ing side. Scales are in meter. (b) Predicted textures at the enumeratedpositions along the outlet boundary during FSW.
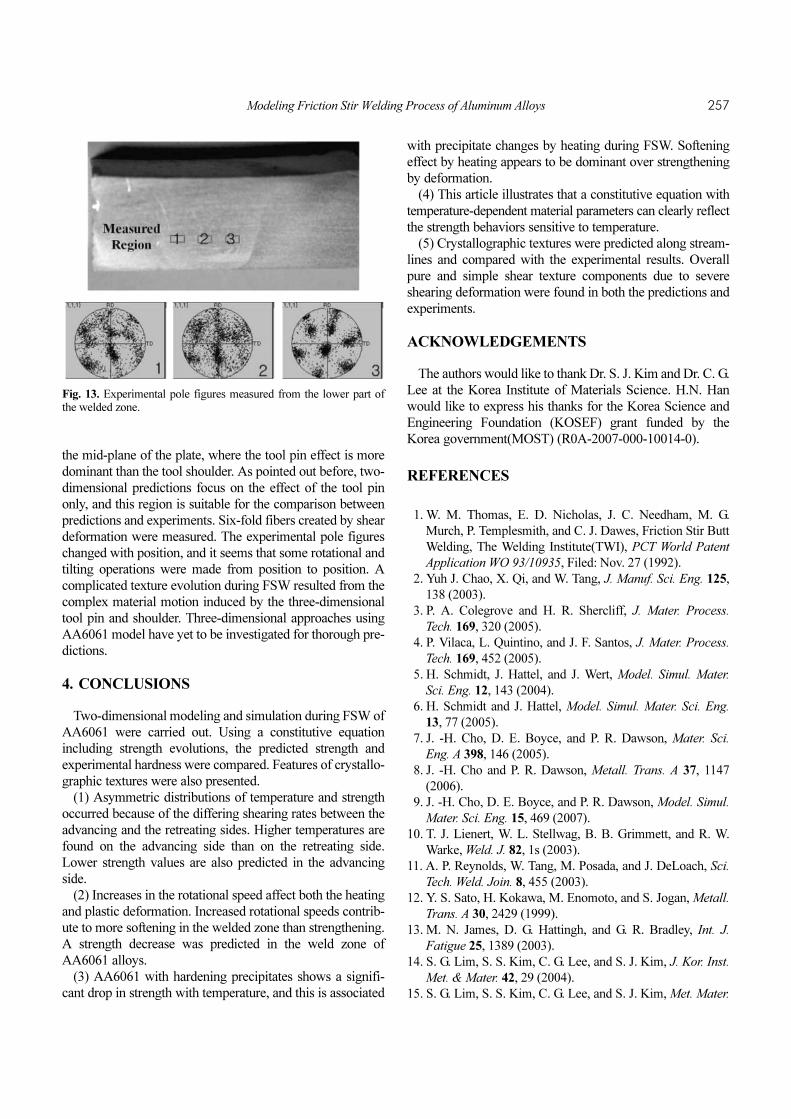
Modeling Friction Stir Welding Process of Aluminum Alloys 257
the mid-plane of the plate, where the tool pin effect is more
dominant than the tool shoulder. As pointed out before, two-
dimensional predictions focus on the effect of the tool pin
only, and this region is suitable for the comparison between
predictions and experiments. Six-fold fibers created by shear
deformation were measured. The experimental pole figures
changed with position, and it seems that some rotational and
tilting operations were made from position to position. A
complicated texture evolution during FSW resulted from the
complex material motion induced by the three-dimensional
tool pin and shoulder. Three-dimensional approaches using
AA6061 model have yet to be investigated for thorough pre-
dictions.
4. CONCLUSIONS
Two-dimensional modeling and simulation during FSW of
AA6061 were carried out. Using a constitutive equation
including strength evolutions, the predicted strength and
experimental hardness were compared. Features of crystallo-
graphic textures were also presented.
(1) Asymmetric distributions of temperature and strength
occurred because of the differing shearing rates between the
advancing and the retreating sides. Higher temperatures are
found on the advancing side than on the retreating side.
Lower strength values are also predicted in the advancing
side.
(2) Increases in the rotational speed affect both the heating
and plastic deformation. Increased rotational speeds contrib-
ute to more softening in the welded zone than strengthening.
A strength decrease was predicted in the weld zone of
AA6061 alloys.
(3) AA6061 with hardening precipitates shows a signifi-
cant drop in strength with temperature, and this is associated
with precipitate changes by heating during FSW. Softening
effect by heating appears to be dominant over strengthening
by deformation.
(4) This article illustrates that a constitutive equation with
temperature-dependent material parameters can clearly reflect
the strength behaviors sensitive to temperature.
(5) Crystallographic textures were predicted along stream-
lines and compared with the experimental results. Overall
pure and simple shear texture components due to severe
shearing deformation were found in both the predictions and
experiments.
ACKNOWLEDGEMENTS
The authors would like to thank Dr. S. J. Kim and Dr. C. G.
Lee at the Korea Institute of Materials Science. H.N. Han
would like to express his thanks for the Korea Science and
Engineering Foundation (KOSEF) grant funded by the
Korea government(MOST) (R0A-2007-000-10014-0).
REFERENCES
1. W. M. Thomas, E. D. Nicholas, J. C. Needham, M. G.
Murch, P. Templesmith, and C. J. Dawes, Friction Stir Butt
Welding, The Welding Institute(TWI), PCT World Patent
Application WO 93/10935, Filed: Nov. 27 (1992).
2. Yuh J. Chao, X. Qi, and W. Tang, J. Manuf. Sci. Eng. 125,
138 (2003).
3. P. A. Colegrove and H. R. Shercliff, J. Mater. Process.
Tech. 169, 320 (2005).
4. P. Vilaca, L. Quintino, and J. F. Santos, J. Mater. Process.
Tech. 169, 452 (2005).
5. H. Schmidt, J. Hattel, and J. Wert, Model. Simul. Mater.
Sci. Eng. 12, 143 (2004).
6. H. Schmidt and J. Hattel, Model. Simul. Mater. Sci. Eng.
13, 77 (2005).
7. J. -H. Cho, D. E. Boyce, and P. R. Dawson, Mater. Sci.
Eng. A 398, 146 (2005).
8. J. -H. Cho and P. R. Dawson, Metall. Trans. A 37, 1147
(2006).
9. J. -H. Cho, D. E. Boyce, and P. R. Dawson, Model. Simul.
Mater. Sci. Eng. 15, 469 (2007).
10. T. J. Lienert, W. L. Stellwag, B. B. Grimmett, and R. W.
Warke, Weld. J. 82, 1s (2003).
11. A. P. Reynolds, W. Tang, M. Posada, and J. DeLoach, Sci.
Tech. Weld. Join. 8, 455 (2003).
12. Y. S. Sato, H. Kokawa, M. Enomoto, and S. Jogan, Metall.
Trans. A 30, 2429 (1999).
13. M. N. James, D. G. Hattingh, and G. R. Bradley, Int. J.
Fatigue 25, 1389 (2003).
14. S. G. Lim, S. S. Kim, C. G. Lee, and S. J. Kim, J. Kor. Inst.
Met. & Mater. 42, 29 (2004).
15. S. G. Lim, S. S. Kim, C. G. Lee, and S. J. Kim, Met. Mater.
Fig. 13. Experimental pole figures measured from the lower part ofthe welded zone.

258 J.-H. Cho et al.
–Int. 11, 113 (2005).
16. M. Dixit, J. W. Newkirk, and R. S. Mishra, Scripta mater.
56, 541 (2007).
17. J. Bonet and R. D. Wood, Cambridge University Press (1997).
18. E. W. Hart, J. Eng. Mater. Tech. 98, 193 (1976).
19. G. M. Eggert and P. R. Dawson, Int. J. Mech. Sci. 29, 95
(1987).
20. G. M. Eggert and P. R. Dawson, Comput. Method. Appl.
Mech. Eng. 70, 165 (1988).
21. National Center for Excellence in Metalworking Technol-
ogy, Atlas of Formability, Aluminum 6061, Wrought (1994).
22. P. Ulysse, Int. J. Mach. Tool. Manu. 42, 1549 (2002).
23. E. S. Fisher, J. Nucl. Mater. 18, 39 (1966).
24. C. Genevois, A. Deschamps, A. Denquin, and B. Doisneau-
cottignies, Acta mater. 53, 2447 (2005).