Mitigation and Black Carbon V Ramanathan EPA Black … Ram_Talk-piblic... · 399 σΤ4 G=131 268 F...
42
Mitigation and Black Carbon V Ramanathan EPA Black Carbon Workshop Chapel Hill March 04 2010 Chapel Hill, March 04, 2010
Transcript of Mitigation and Black Carbon V Ramanathan EPA Black … Ram_Talk-piblic... · 399 σΤ4 G=131 268 F...
Mitigation and Black CarbongV Ramanathan
EPA Black Carbon WorkshopChapel Hill March 04 2010Chapel Hill, March 04, 2010
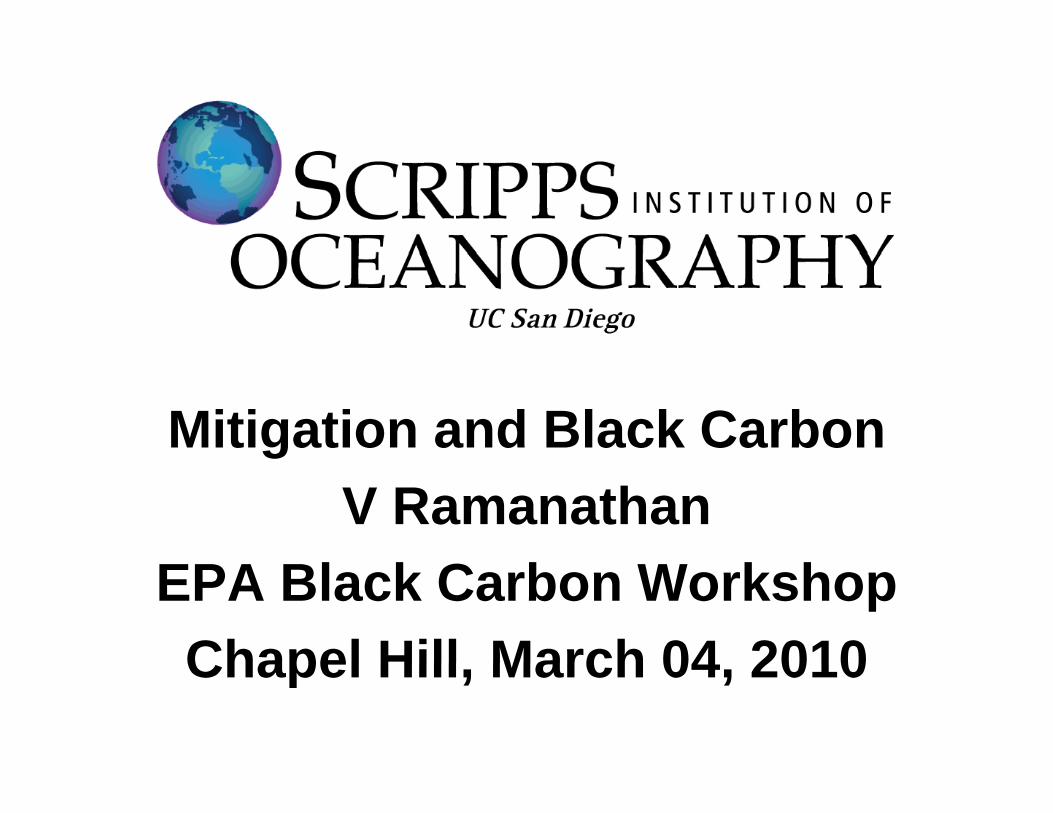
19801980
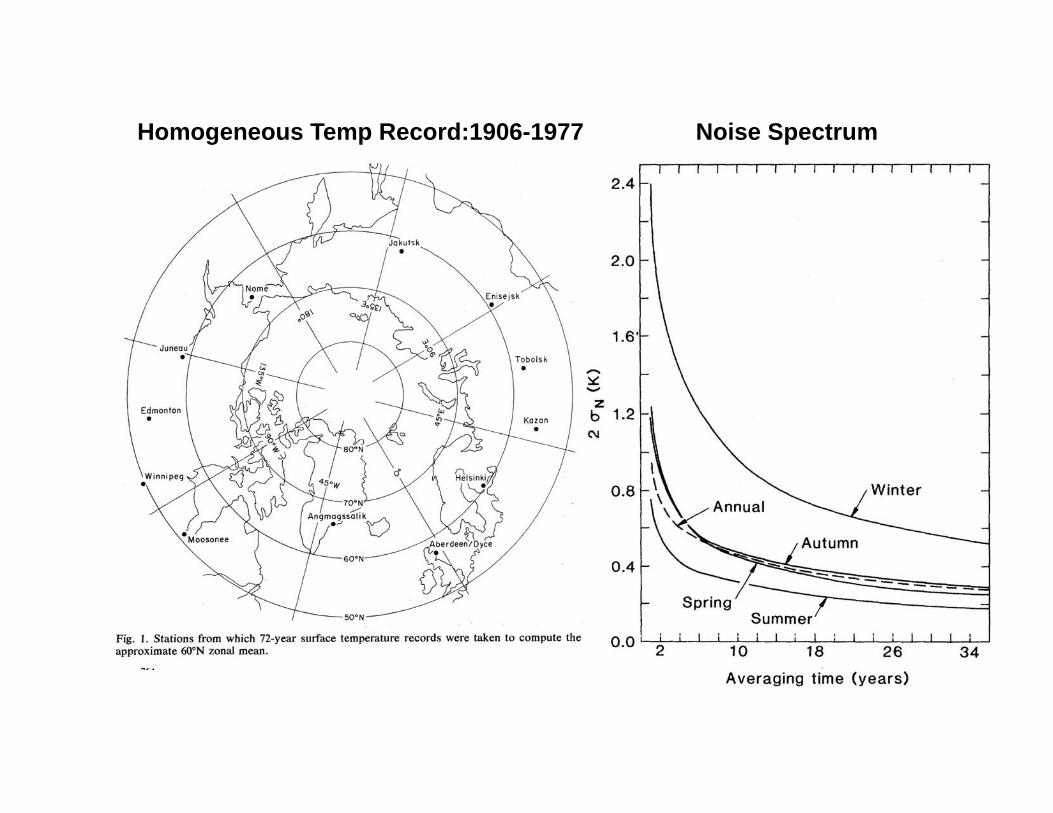
Homogeneous Temp Record:1906-1977 Noise Spectrum
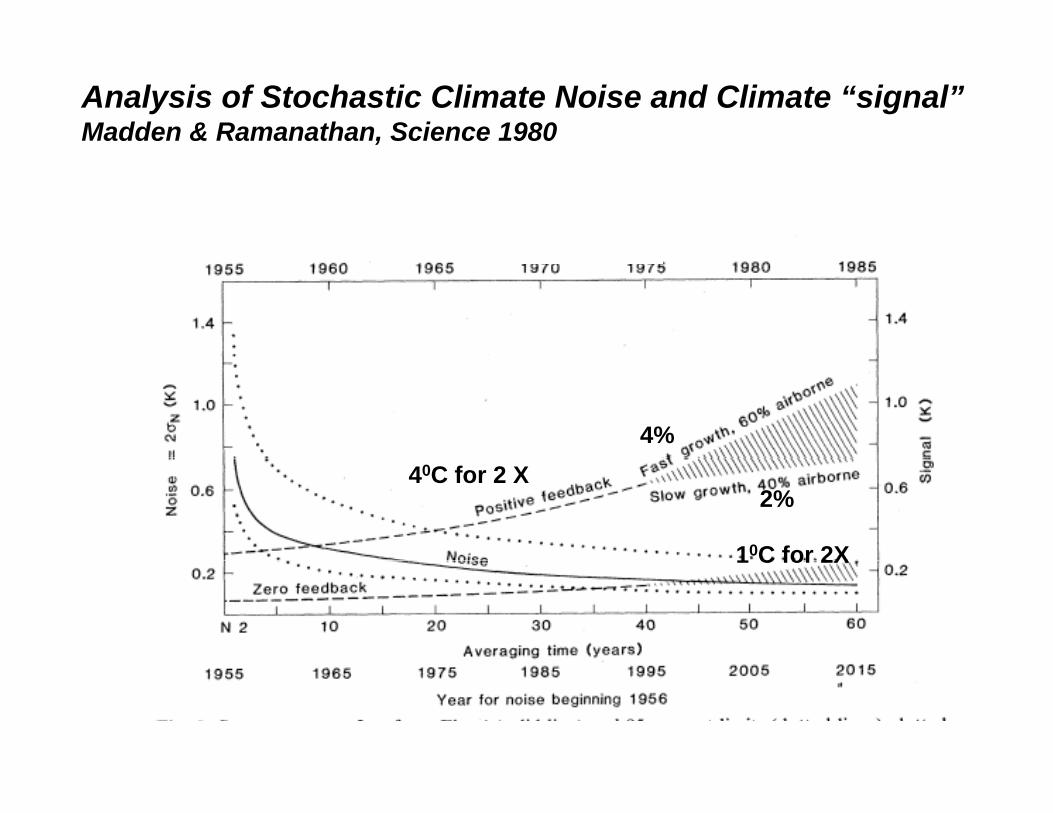
Analysis of Stochastic Climate Noise and Climate “signal”Madden & Ramanathan, Science 1980
4%40C for 2 X
10C for 2X
2%
1 C for 2X
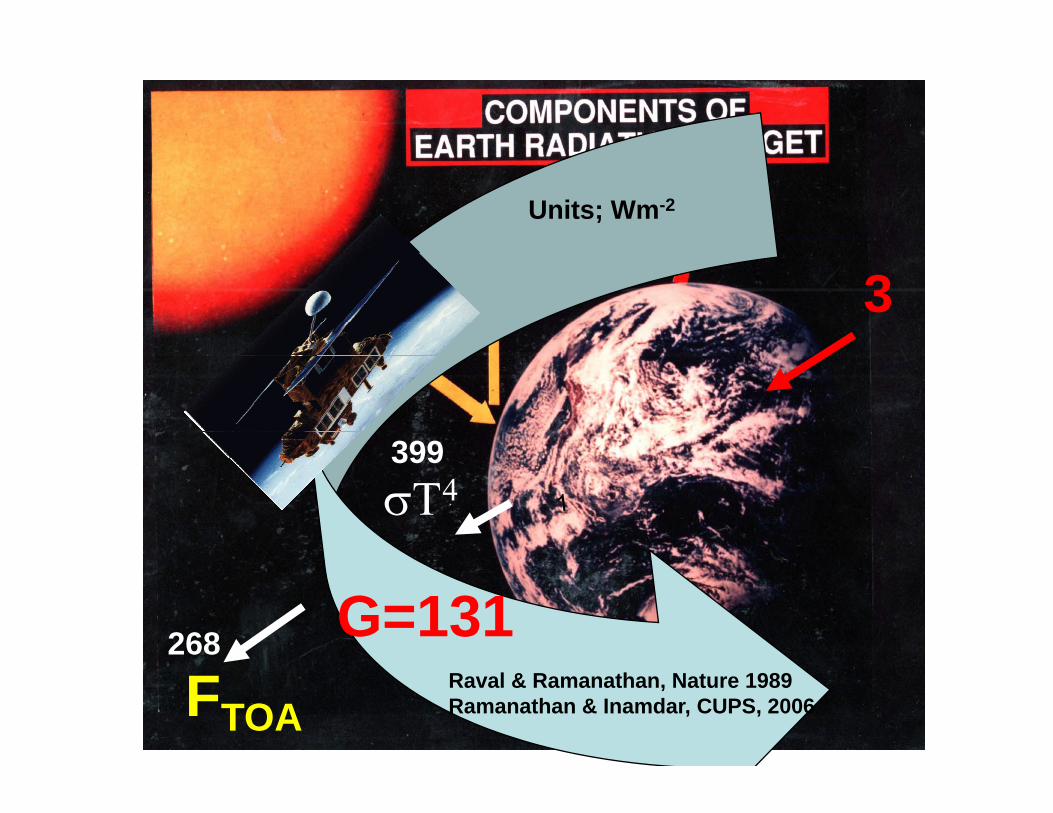
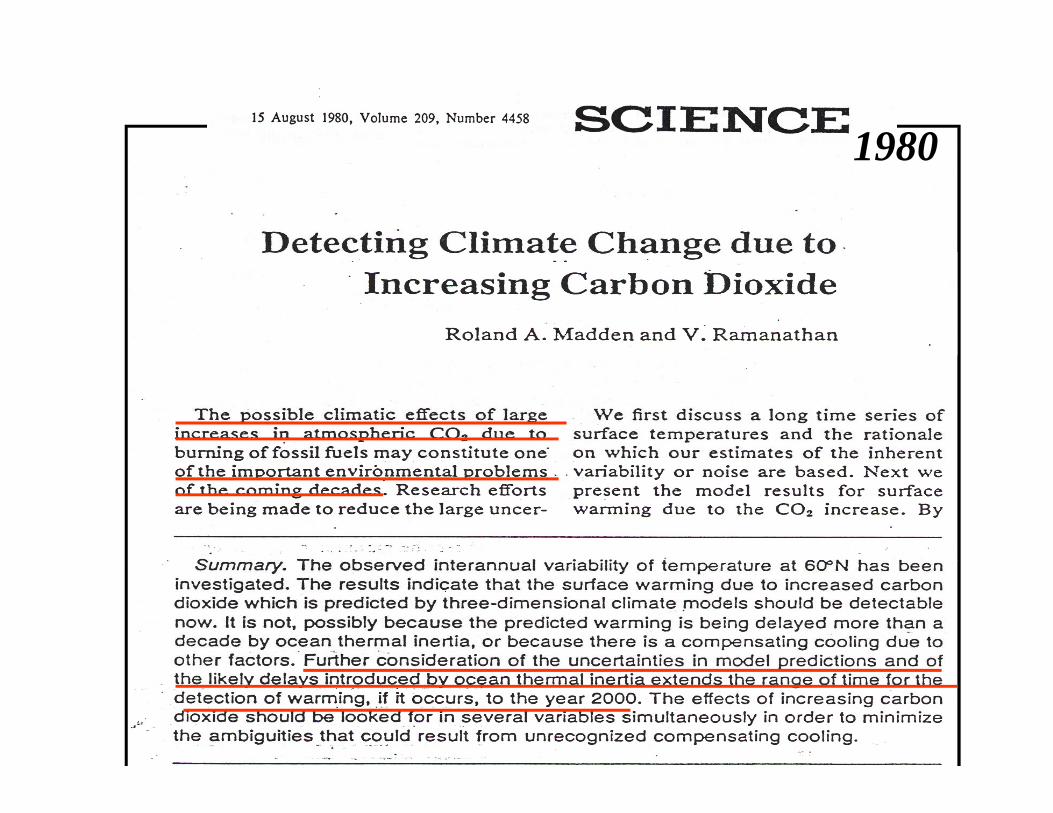
Units; Wm-2
3
G399σΤ4399
G=131268
FTOARaval & Ramanathan, Nature 1989Ramanathan & Inamdar, CUPS, 2006
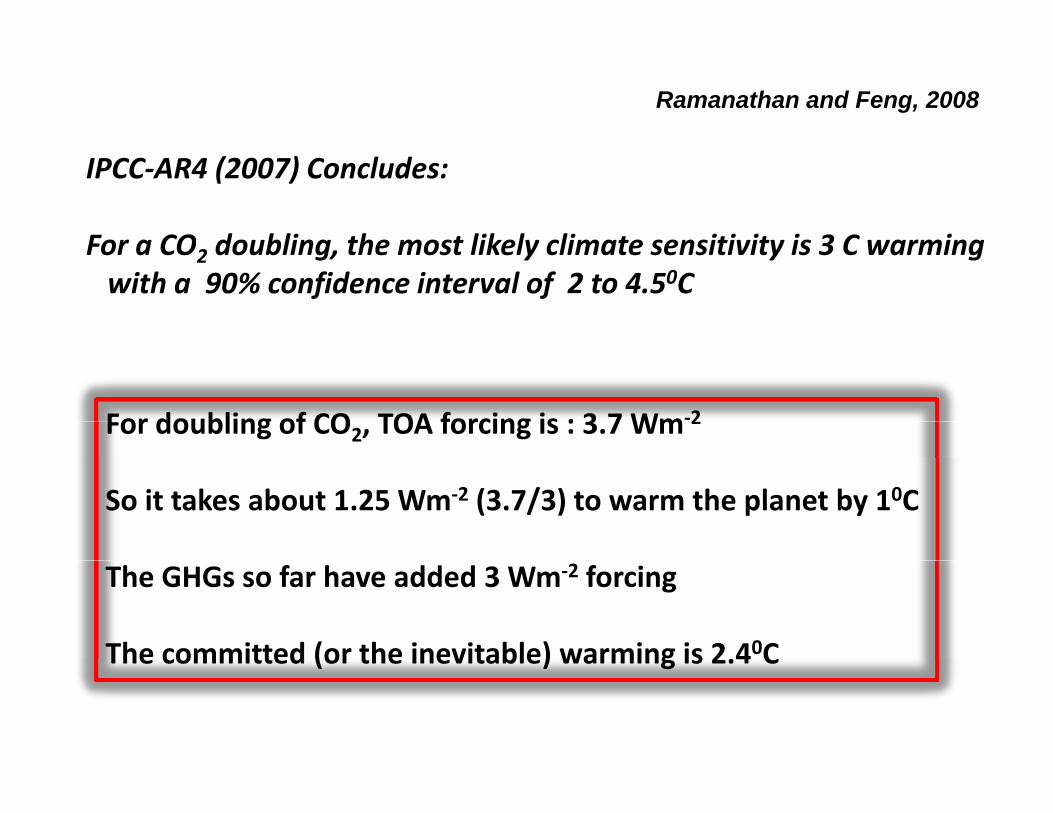
Ramanathan and Feng, 2008
IPCC‐AR4 (2007) Concludes:
For a CO2 doubling, the most likely climate sensitivity is 3 C warmingFor a CO2 doubling, the most likely climate sensitivity is 3 C warmingwith a 90% confidence interval of 2 to 4.50C
For doubling of CO2, TOA forcing is : 3.7 Wm‐2
So it takes about 1.25 Wm‐2 (3.7/3) to warm the planet by 10C
The GHGs so far have added 3 Wm‐2 forcing
The committed (or the inevitable) warming is 2.40CThe committed (or the inevitable) warming is 2.4 C
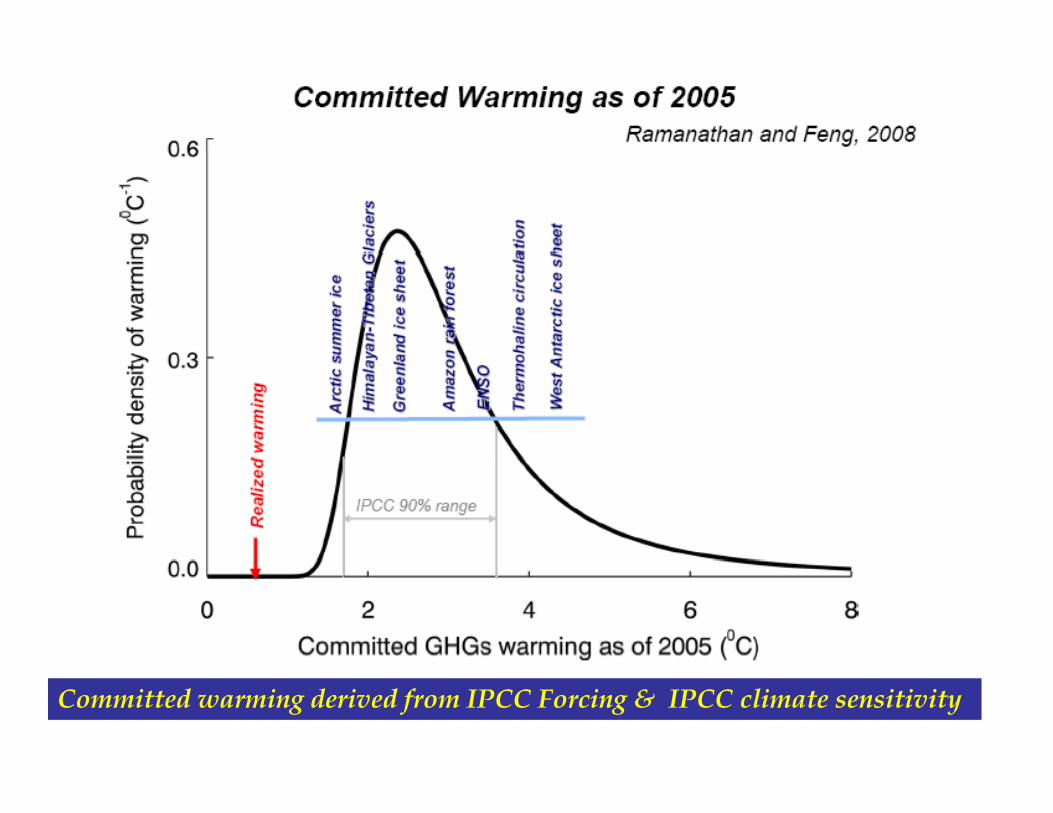
Committed warming derived from IPCC Forcing & IPCC climate sensitivity
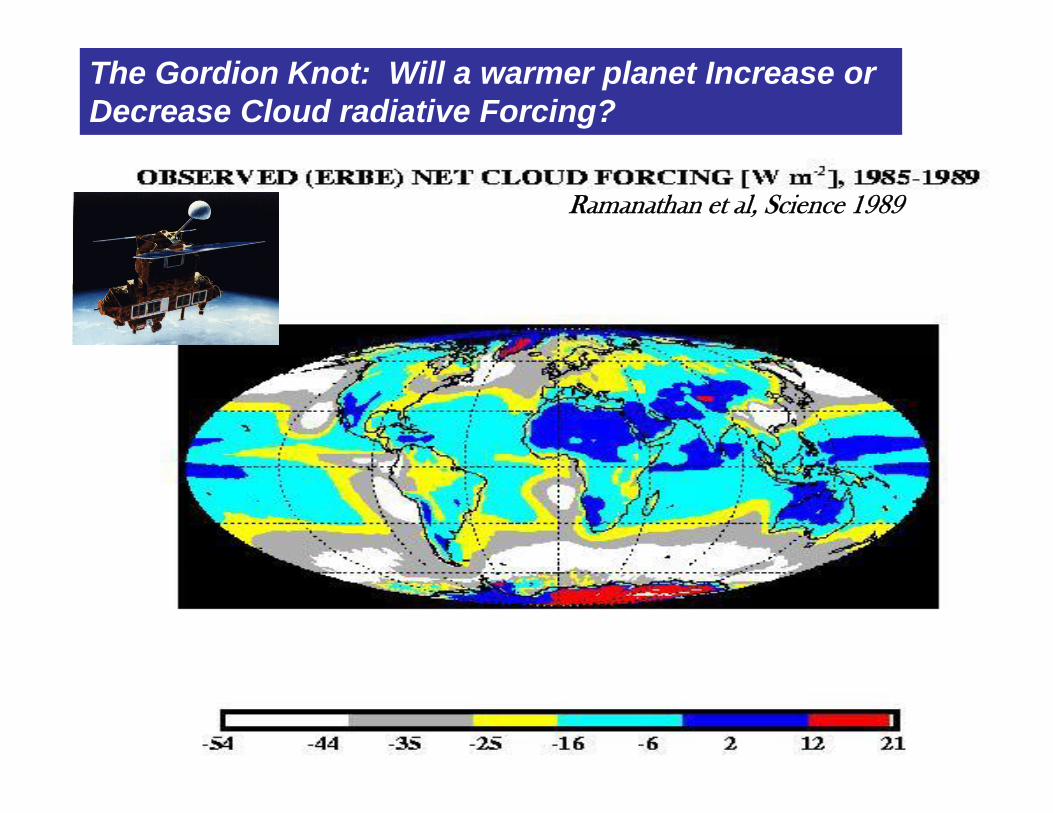
The Gordion Knot: Will a warmer planet Increase or Decrease Cloud radiative Forcing?
Ramanathan et al, Science 1989
1.5
2W
/m2)
CO2 forcing
0.2
0.25
0.3
0.35
W/m
2)
halocarbon forcing
CFC0.6
0.7
0.8
W/m
2)
BC
1900 1920 1940 1960 1980 20000
0.5
1
forc
ing(
W
1900 1920 1940 1960 1980 20000
0.05
0.1
0.15
forc
ing(
W
HCFCOKG
1900 1920 1940 1960 1980 2000
0.4
0.5
forc
ing(
W
1900 1920 1940 1960 1980 2000year
year year
-0.1
-0.05NOX
-0.2
0SO4
-0.2
-0.15aerosol other than BC,SO4,NOx (scaled from OC)
-0.25
-0.2
-0.15
forc
ing(
W/m
2)
-1
-0.8
-0.6
-0.4fo
rcin
g(W
/m2)
-0.4
-0.35
-0.3
-0.25
forc
ing(
W/m
2)
1900 1920 1940 1960 1980 2000-0.3
year1900 1920 1940 1960 1980 2000
-1.4
-1.2
year1900 1920 1940 1960 1980 2000
-0.5
-0.45
year
Methane &VOCs
O3NOx CO
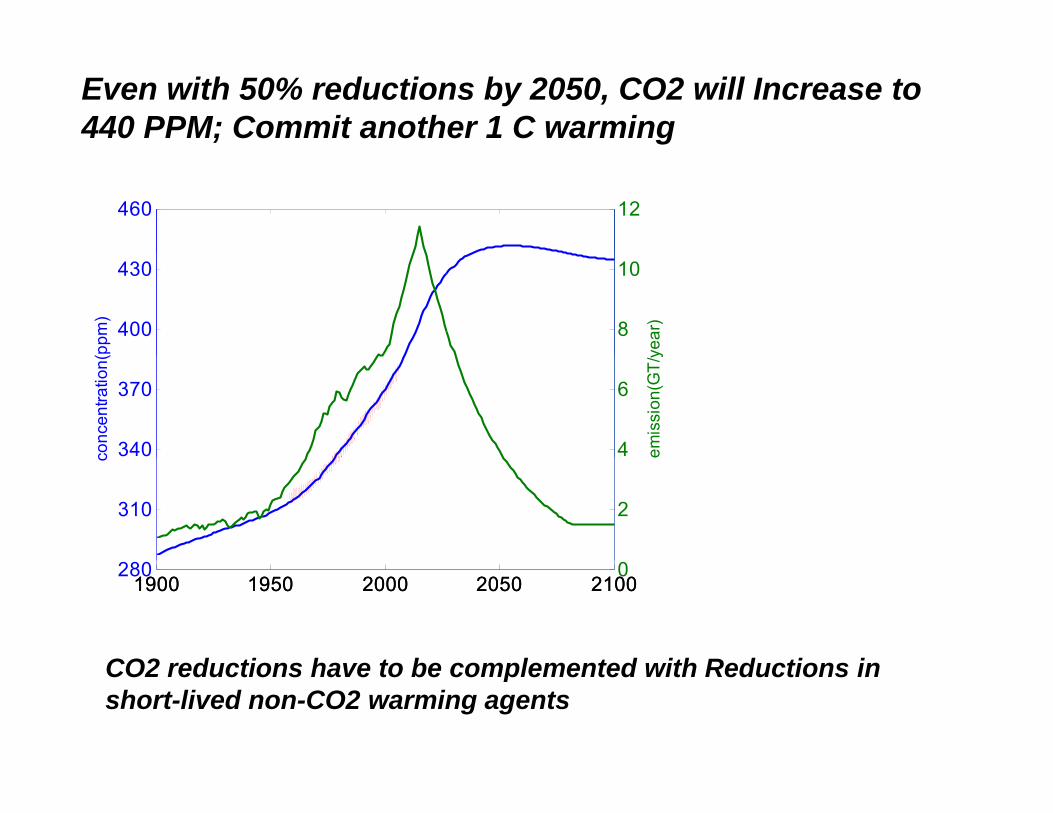
Even with 50% reductions by 2050, CO2 will Increase to 440 PPM; Commit another 1 C warming
460 12
400
430
(ppm
)
8
10
year
)
340
370
conc
entra
tion(
4
6
emis
sion
(GT/
y
310
c
2
CO2 red ctions ha e to be complemented ith Red ctions in
1900 1950 2000 2050 2100280
1900 1950 2000 2050 21000
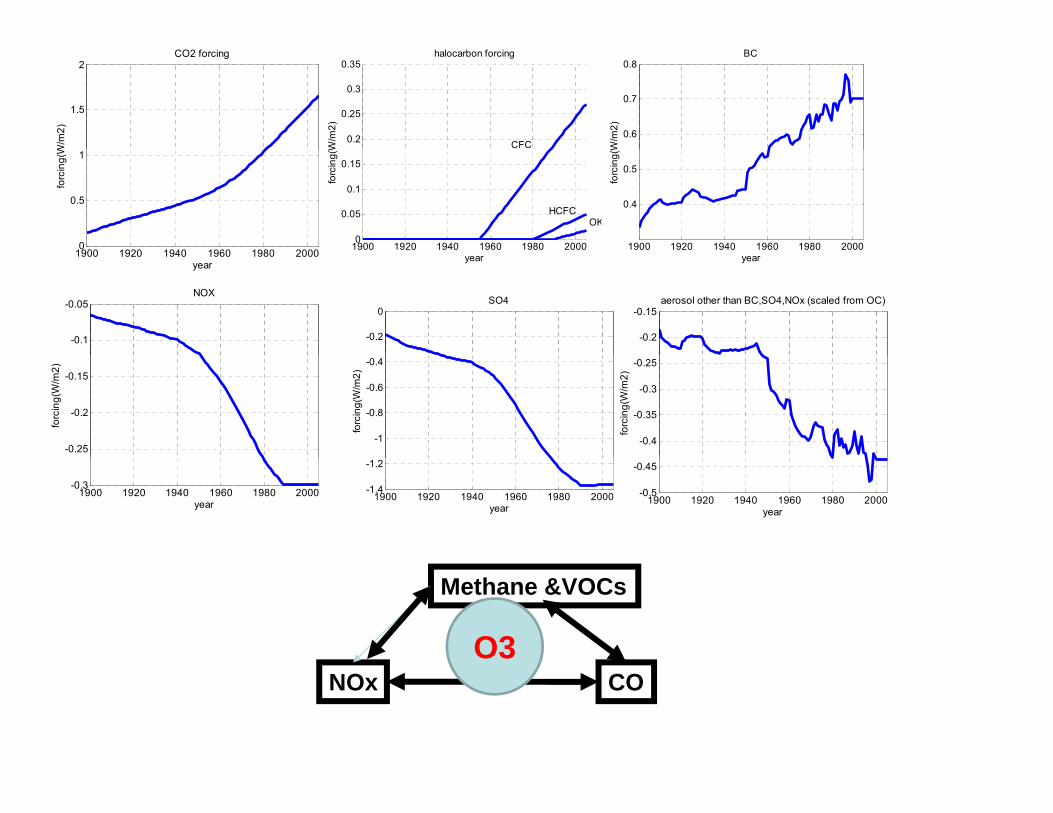
CO2 reductions have to be complemented with Reductions in short-lived non-CO2 warming agents
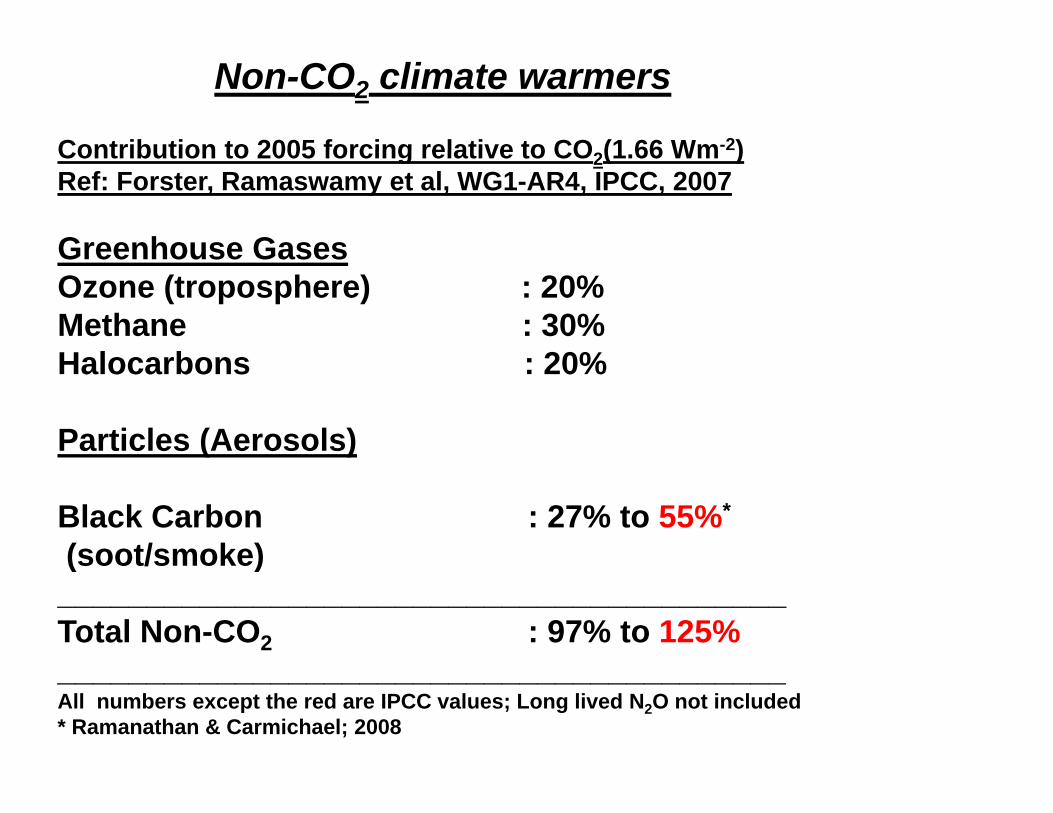
Non-CO2 climate warmers
Contribution to 2005 forcing relative to CO (1 66 Wm-2)Contribution to 2005 forcing relative to CO2(1.66 Wm )Ref: Forster, Ramaswamy et al, WG1-AR4, IPCC, 2007
Greenhouse GasesGreenhouse GasesOzone (troposphere) : 20% Methane : 30% H l b 20%Halocarbons : 20%
Particles (Aerosols)
Black Carbon : 27% to 55%*
(soot/smoke)(soot/smoke)_________________________________________Total Non-CO2 : 97% to 125%_________________________________________All numbers except the red are IPCC values; Long lived N2O not included* Ramanathan & Carmichael; 2008
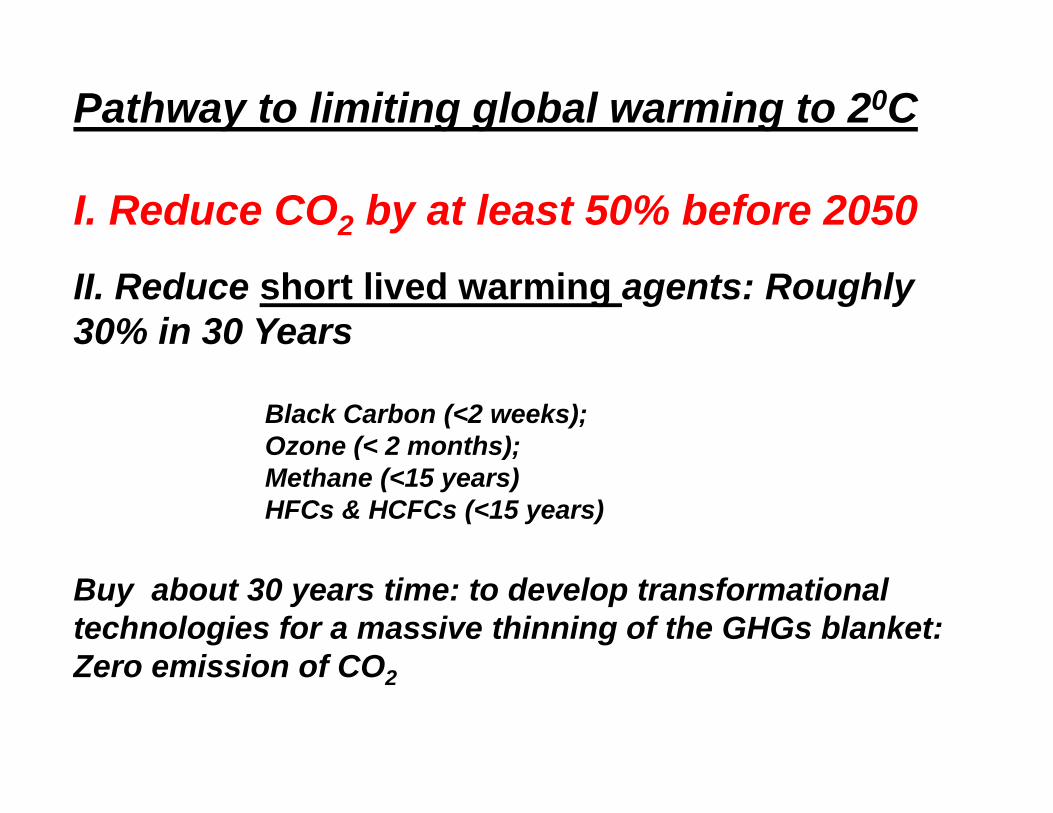
Pathway to limiting global warming to 20C
I. Reduce CO2 by at least 50% before 2050
II. Reduce short lived warming agents: Roughly 30% in 30 Years
Black Carbon (<2 weeks); Ozone (< 2 months); ( );Methane (<15 years)HFCs & HCFCs (<15 years)
Buy about 30 years time: to develop transformational technologies for a massive thinning of the GHGs blanket: Zero emission of COZero emission of CO2
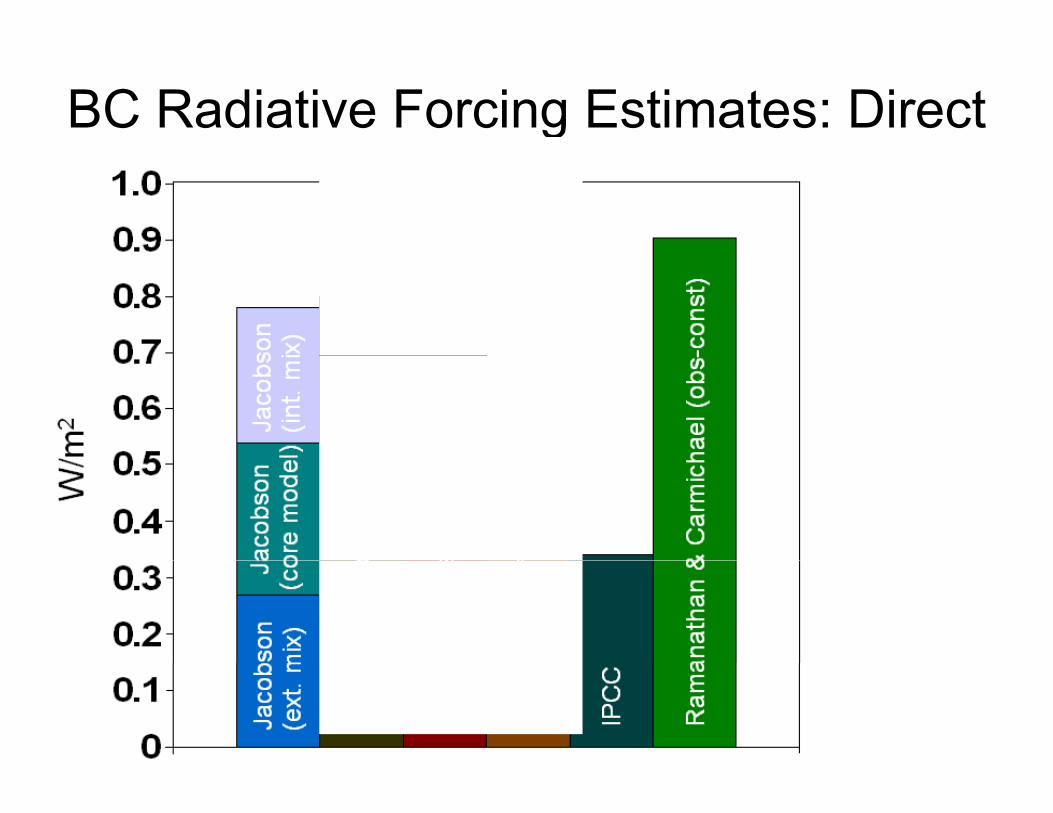
BC Radiative Forcing Estimates: Direct
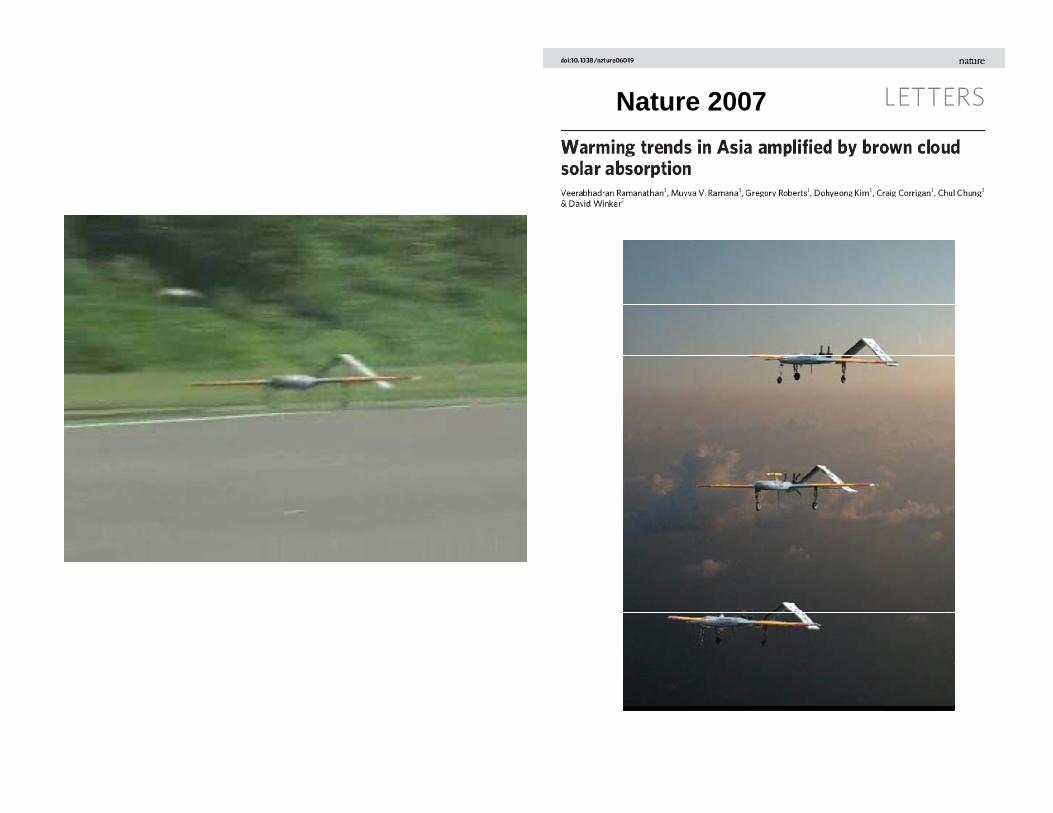
Nature 2007
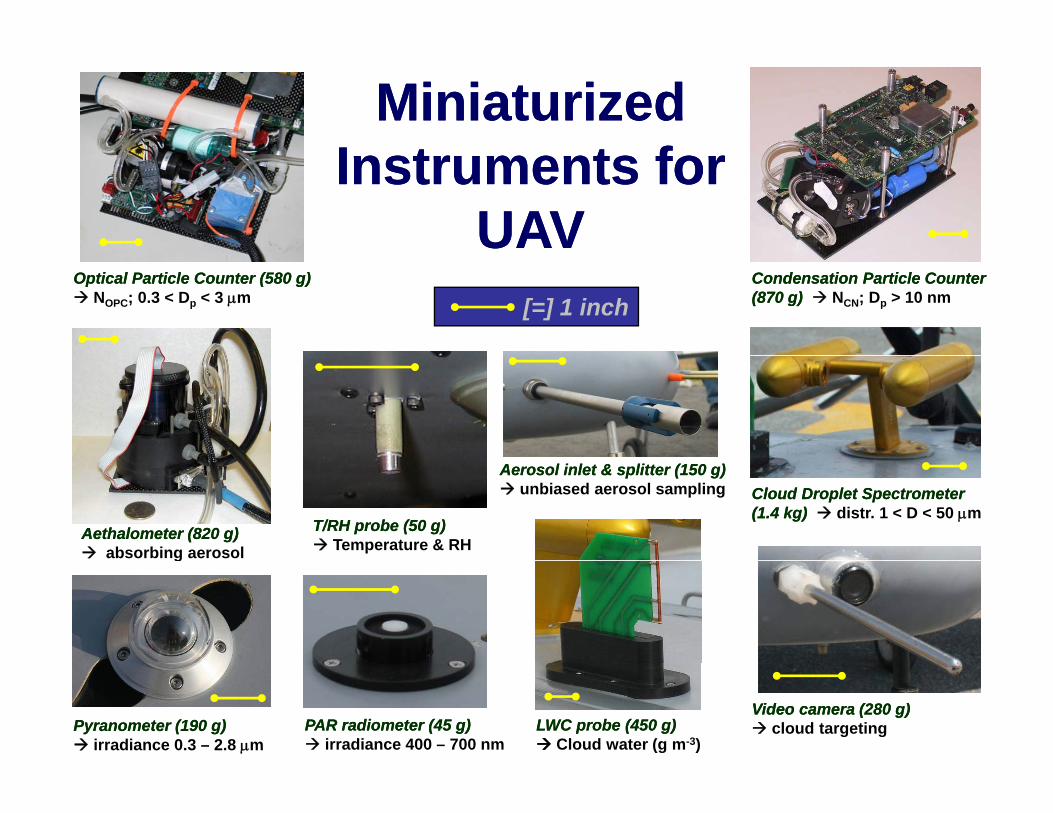
Miniaturized Miniaturized I t t fI t t fInstruments for Instruments for
UAVUAVOptical Particle Counter (580 g)Optical Particle Counter (580 g)
NOPC; 0.3 < Dp < 3 μmCondensation Particle Counter Condensation Particle Counter (870 g)(870 g) NCN; Dp > 10 nm[=] 1 inch
Cloud Droplet Spectrometer Cloud Droplet Spectrometer (1.4 kg)(1.4 kg) distr. 1 < D < 50 μm
Aerosol inlet & splitter (150 g)Aerosol inlet & splitter (150 g)unbiased aerosol sampling
AethalometerAethalometer (820 g)(820 g)absorbing aerosol
T/RH probe (50 g)T/RH probe (50 g)Temperature & RHg
PyranometerPyranometer (190 g)(190 g)irradiance 0.3 – 2.8 μm
PAR radiometer (45 g)PAR radiometer (45 g)irradiance 400 – 700 nm
Video camera (280 g)Video camera (280 g)cloud targetingLWC probe (450 g)LWC probe (450 g)
Cloud water (g m-3)
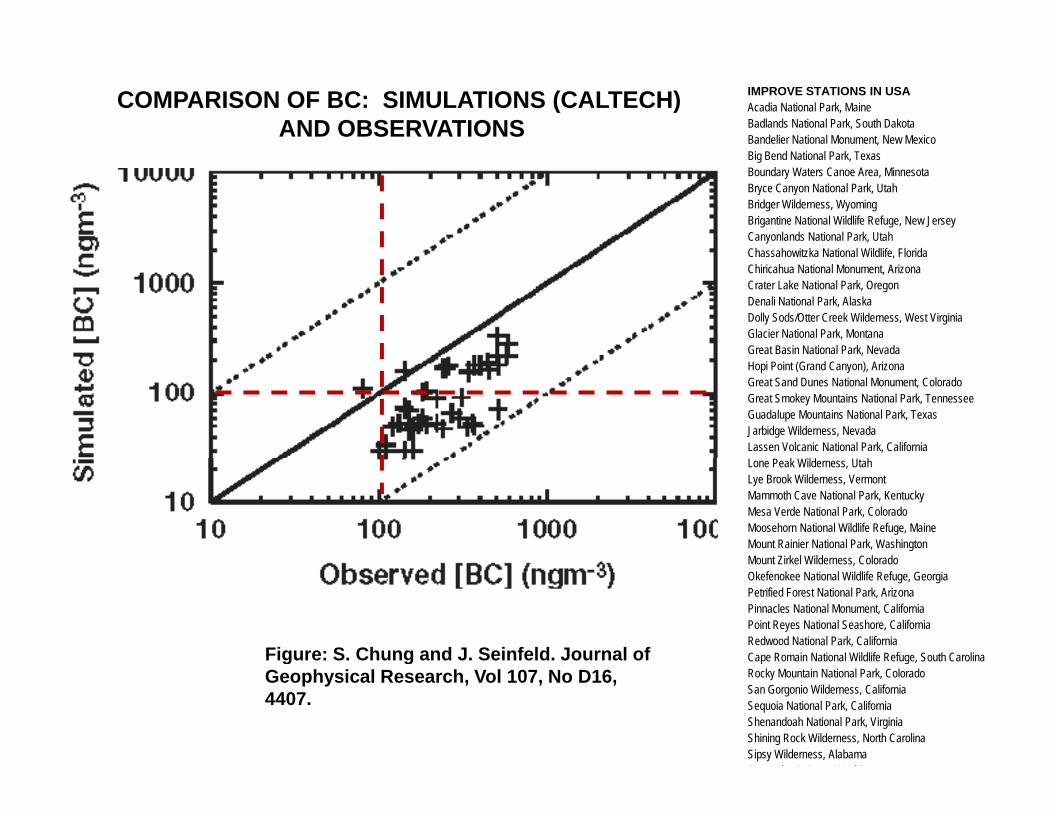
COMPARISON OF BC: SIMULATIONS (CALTECH)AND OBSERVATIONS
IMPROVE STATIONS IN USAAcadia National Park, Maine Badlands National Park, South Dakota Bandelier National Monument, New MexicoBig Bend National Park, TexasBoundary Waters Canoe Area, MinnesotaBryce Canyon National Park, Utah Bridger Wilderness, Wyoming Brigantine National Wildlife Refuge, New Jersey Canyonlands National Park, Utah Chassahowitzka National Wildlife Florida Chassahowitzka National Wildlife, Florida Chiricahua National Monument, Arizona Crater Lake National Park, Oregon Denali National Park, Alaska Dolly Sods/Otter Creek Wilderness, West Virginia Glacier National Park, Montana Great Basin National Park, Nevada ,Hopi Point (Grand Canyon), Arizona Great Sand Dunes National Monument, Colorado Great Smokey Mountains National Park, TennesseeGuadalupe Mountains National Park, TexasJarbidge Wilderness, Nevada Lassen Volcanic National Park, California Lone Peak Wilderness, Utah Lye Brook Wilderness, VermontMammoth Cave National Park, Kentucky Mesa Verde National Park, Colorado Moosehorn National Wildlife Refuge, Maine Mount Rainier National Park, Washington Mount Zirkel Wilderness Colorado Mount Zirkel Wilderness, Colorado Okefenokee National Wildlife Refuge, Georgia Petrified Forest National Park, Arizona Pinnacles National Monument, California Point Reyes National Seashore, California Redwood National Park, California Cape Romain National Wildlife Refuge, South Carolina Figure: S. Chung and J. Seinfeld. Journal of p gRocky Mountain National Park, Colorado San Gorgonio Wilderness, California Sequoia National Park, California Shenandoah National Park, Virginia Shining Rock Wilderness, North Carolina Sipsy Wilderness, Alabama S l i P W hi
g gGeophysical Research, Vol 107, No D16, 4407.
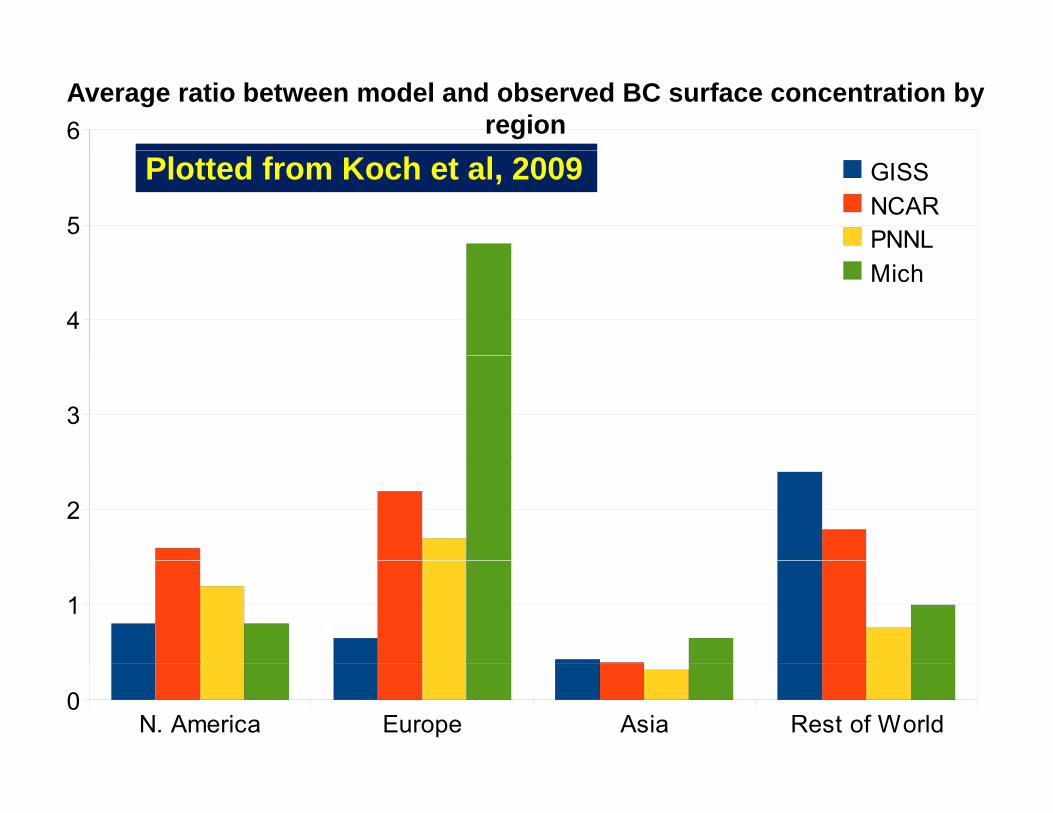
6Average ratio between model and observed BC surface concentration by
region
5
GISSNCARPNNL
Plotted from Koch et al, 2009
4
Mich
3
2
1
N. America Europe Asia Rest of World0
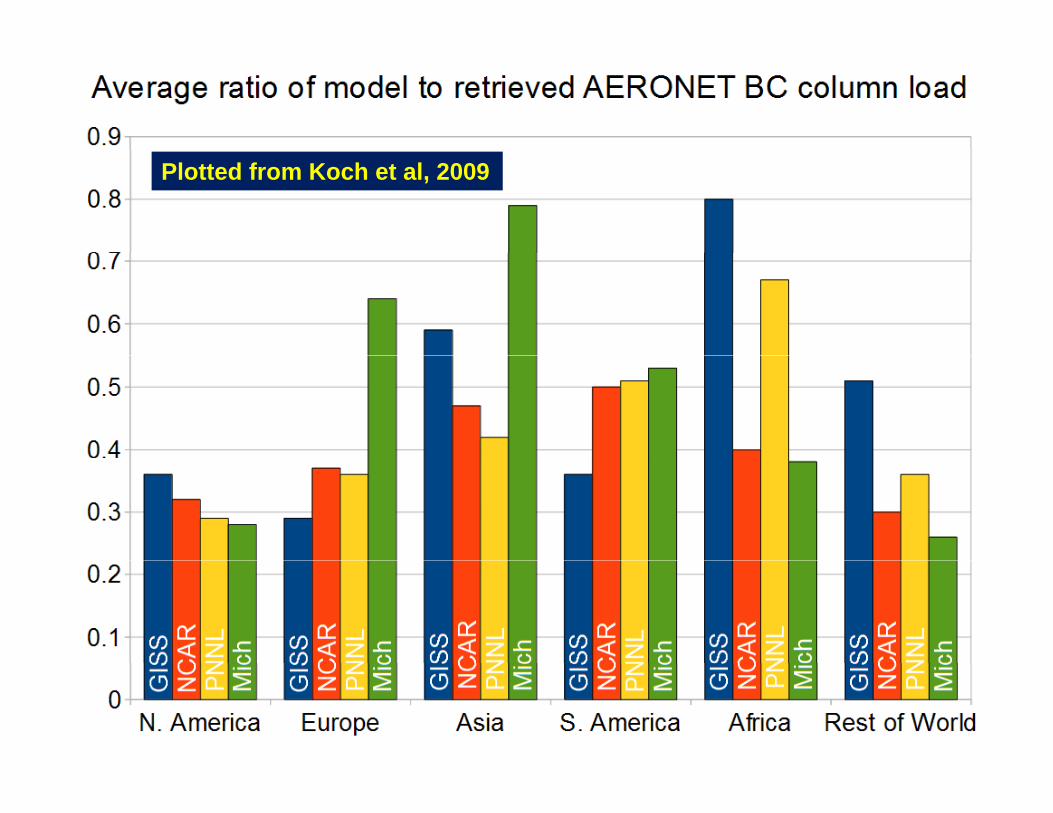
Plotted from Koch et al, 2009
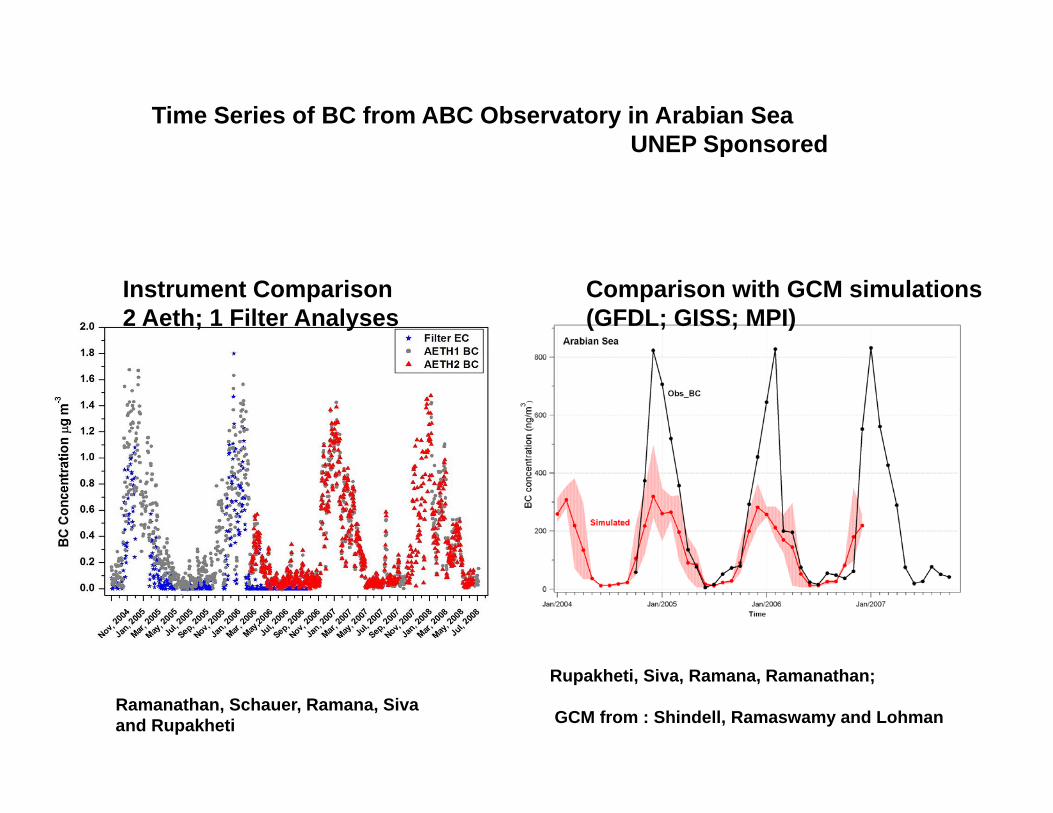
Time Series of BC from ABC Observatory in Arabian SeaUNEP SponsoredUNEP Sponsored
Instrument Comparison2 Aeth; 1 Filter Analyses
Comparison with GCM simulations(GFDL; GISS; MPI)
Ramanathan, Schauer, Ramana, Siva and Rupakheti
Rupakheti, Siva, Ramana, Ramanathan;
GCM from : Shindell, Ramaswamy and Lohman
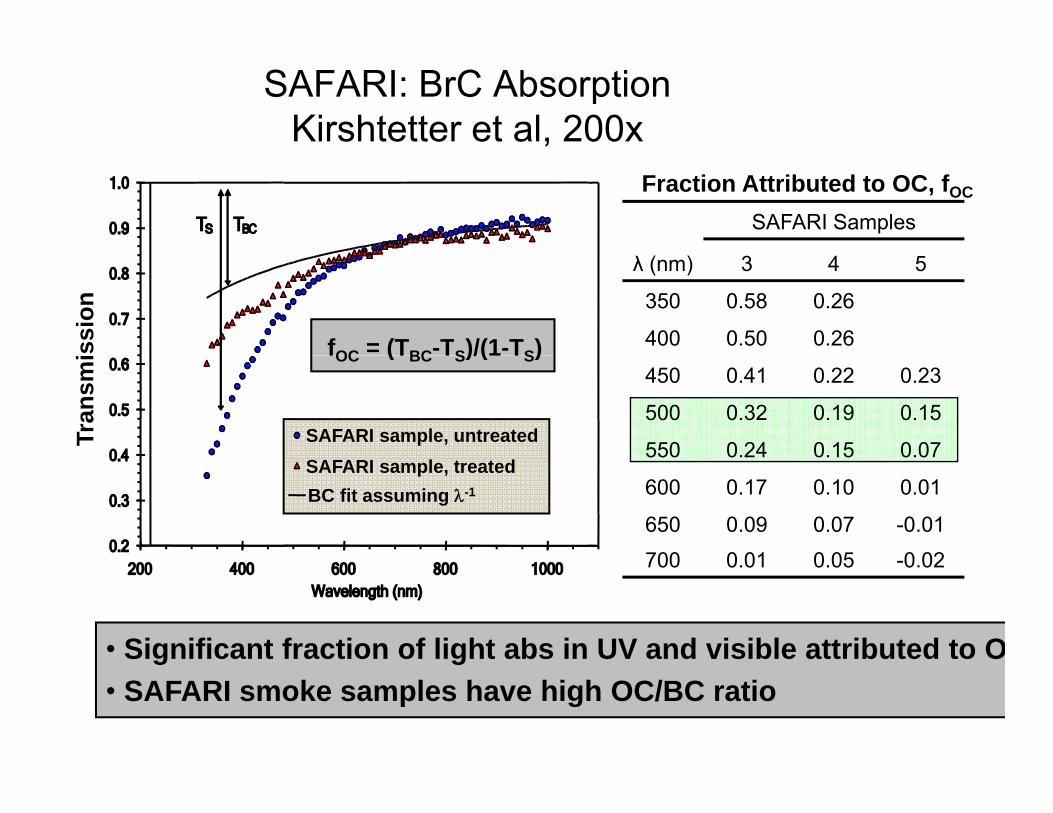
SAFARI: BrC AbsorptionKirshtetter et al, 200x
SAFARI Samples
Fraction Attributed to OC, fOC
λ (nm) 3 4 5
350 0.58 0.26
400 0.50 0.26fOC = (TBC-TS)/(1-TS)ssio
n
450 0.41 0.22 0.23
500 0.32 0.19 0.15
550 0.24 0.15 0.07
fOC (TBC TS)/(1 TS)
SAFARI sample, untreatedTran
smi
600 0.17 0.10 0.01
650 0.09 0.07 -0.01
700 0 01 0 05 0 02
SAFARI sample, treatedBC fit assuming λ-1
700 0.01 0.05 -0.02
• Significant fraction of light abs in UV and visible attributed to Og g• SAFARI smoke samples have high OC/BC ratio
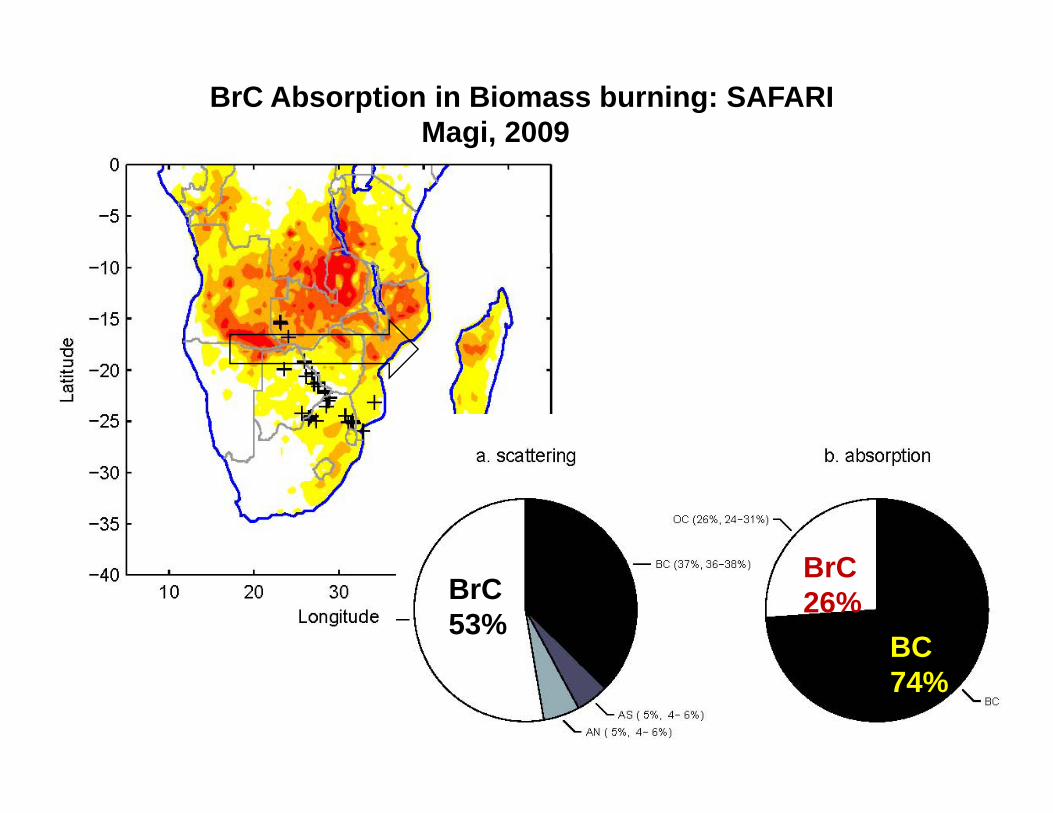
BrC Absorption in Biomass burning: SAFARIMagi, 2009
B C
BC
BrC26%BrC
53%
74%
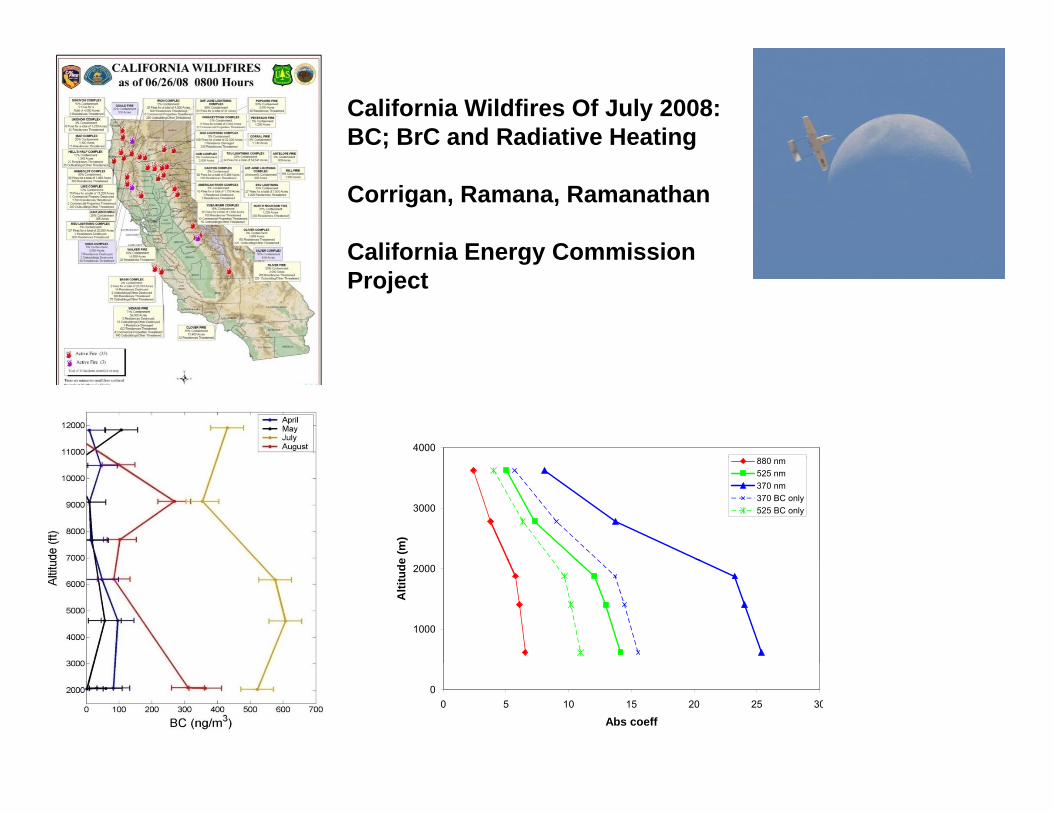
California Wildfires Of July 2008:BC; BrC and Radiative Heating
Corrigan, Ramana, Ramanathan
California Energy CommissionCalifornia Energy Commission Project
4000880
3000
e (m
)
880 nm525 nm370 nm370 BC only525 BC only
1000
2000
Alti
tude
00 5 10 15 20 25 30
Abs coeff
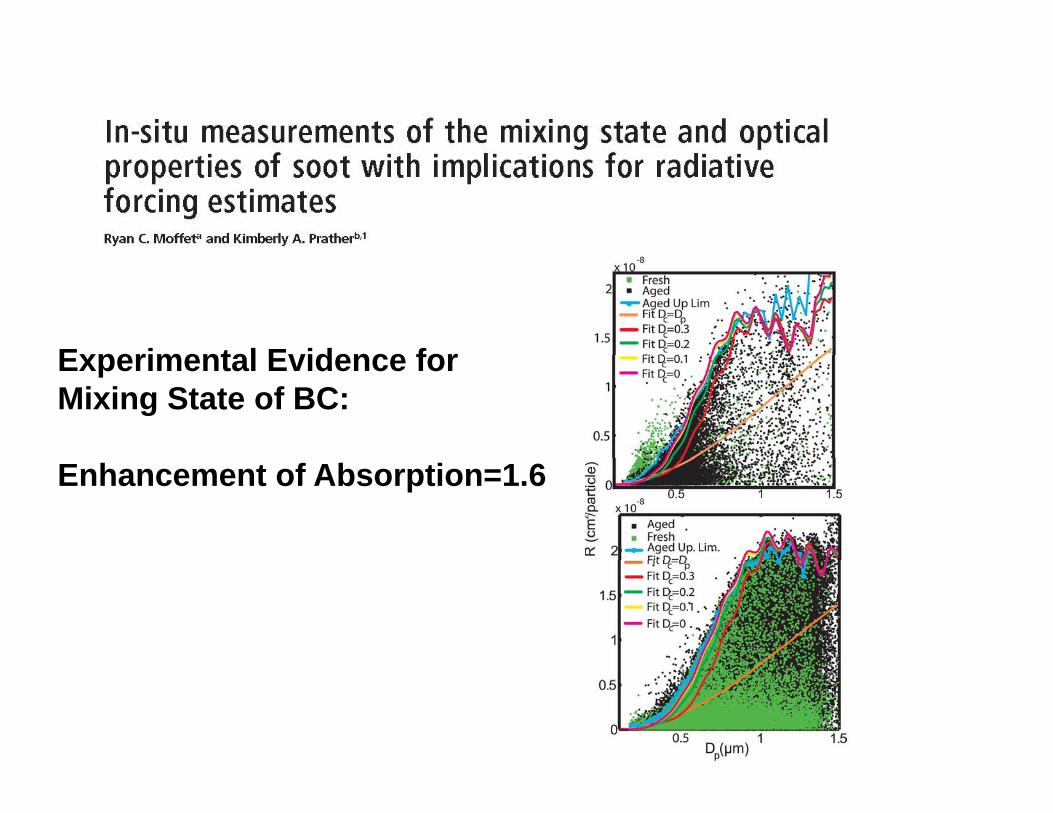
Experimental Evidence forExperimental Evidence forMixing State of BC:
Enhancement of Absorption=1.6
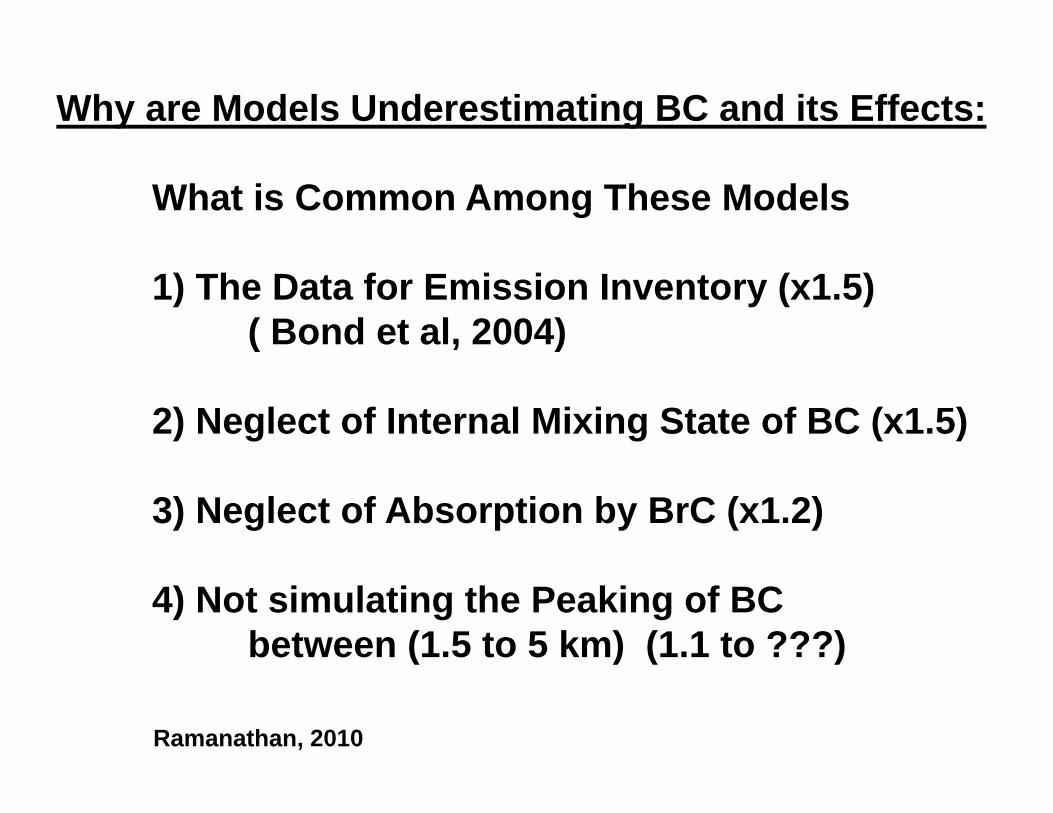
Why are Models Underestimating BC and its Effects:
What is Common Among These Models
1) The Data for Emission Inventory (x1.5)( Bond et al, 2004)
2) Neglect of Internal Mixing State of BC (x1.5)
3) Neglect of Absorption by BrC (x1.2)
4) Not simulating the Peaking of BC between (1.5 to 5 km) (1.1 to ???)( ) ( )
Ramanathan, 2010
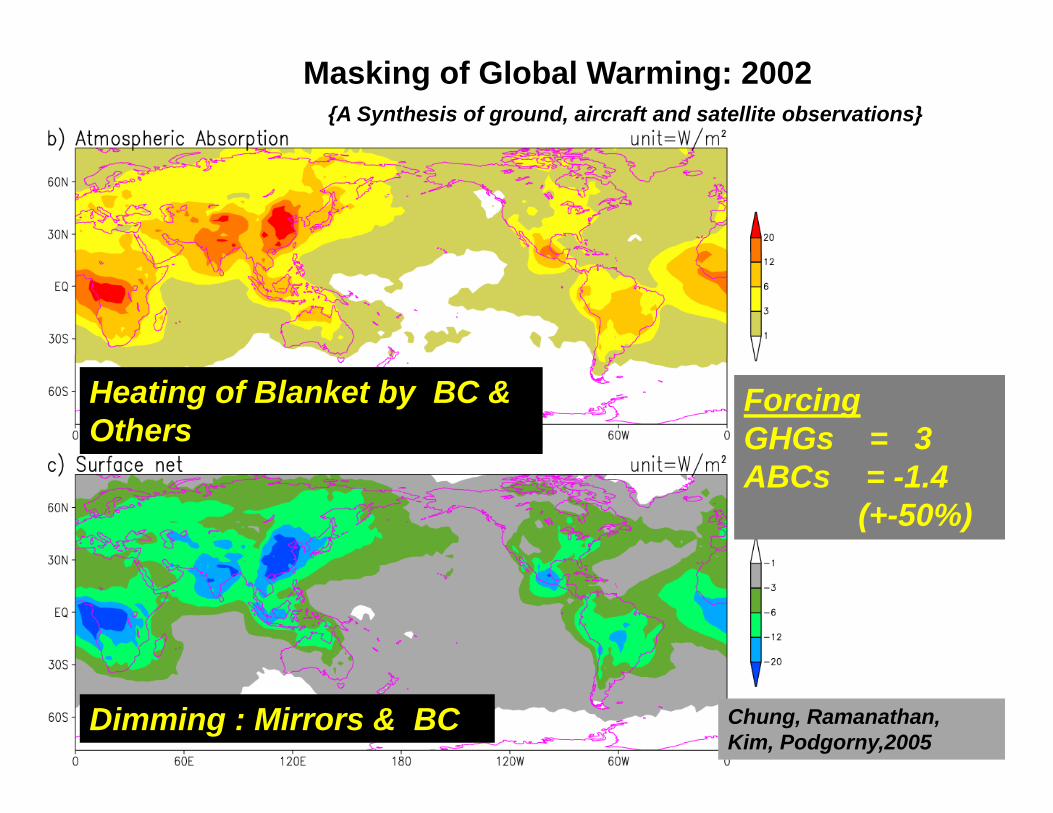
Masking of Global Warming: 2002{A Synthesis of ground, aircraft and satellite observations}
ForcingGHGs = 3
Heating of Blanket by BC & Others
ABCs = -1.4 (+-50%)
Chung, Ramanathan, Kim, Podgorny,2005
Dimming : Mirrors & BC
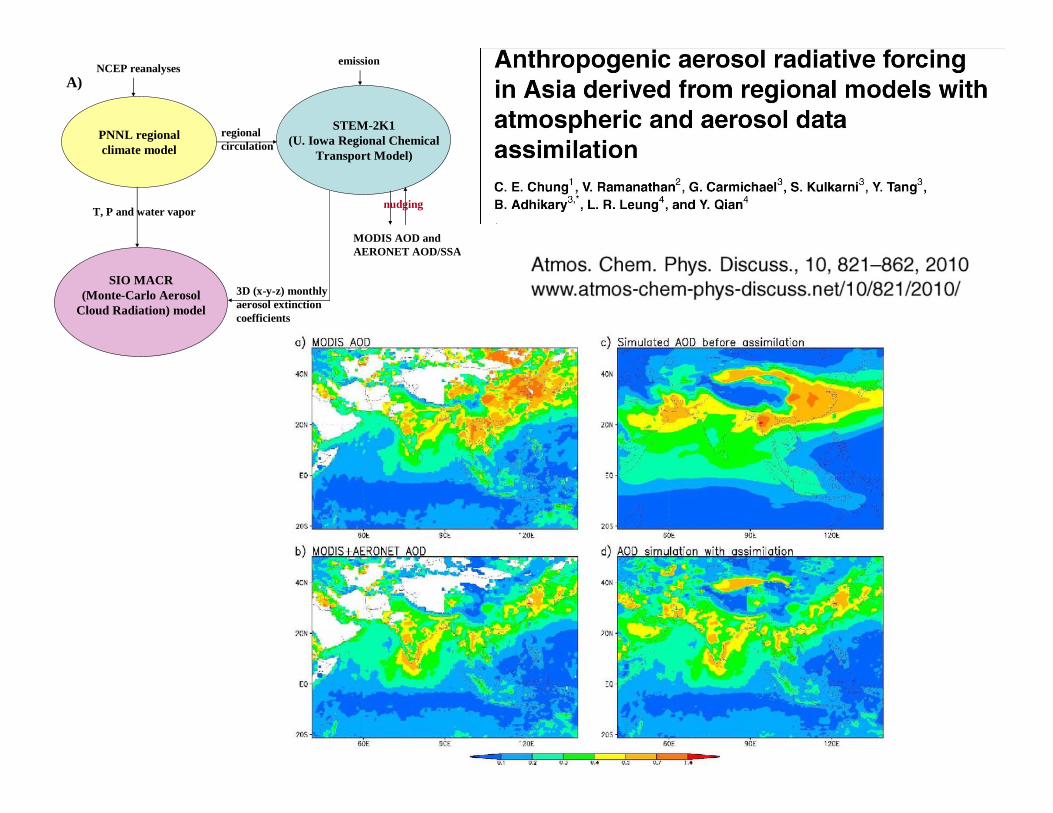
PNNL regionalclimate model
STEM-2K1(U. Iowa Regional Chemical
NCEP reanalyses
regionalcirculation
emission
A)
climate model Transport Model)
nudging
MODIS AOD andAERONET AOD/SSA
T, P and water vapor
AERONET AOD/SSA
3D (x-y-z) monthlyaerosol extinctioncoefficients
SIO MACR(Monte-Carlo Aerosol
Cloud Radiation) model
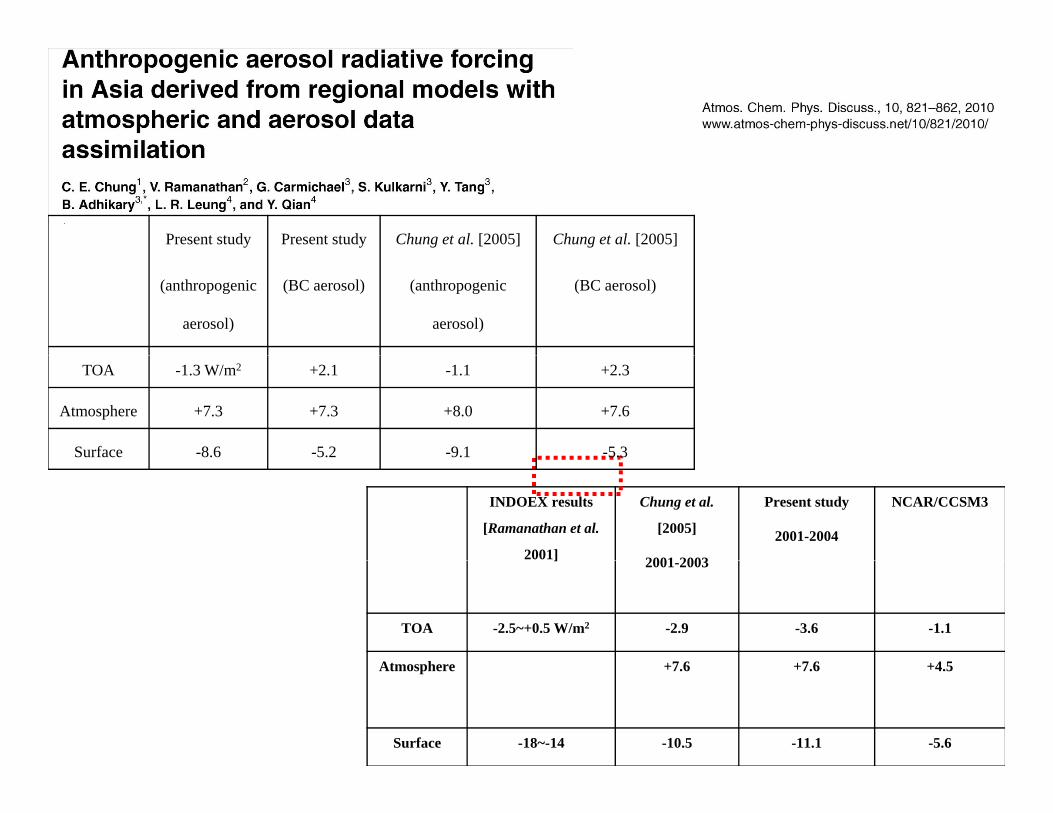
Present study Present study Chung et al. [2005] Chung et al. [2005]
(anthropogenic
aerosol)
(BC aerosol) (anthropogenic
aerosol)
(BC aerosol)
TOA -1.3 W/m2 +2.1 -1.1 +2.3
Atmosphere +7.3 +7.3 +8.0 +7.6
Surface -8.6 -5.2 -9.1 -5.3
INDOEX results
[Ramanathan et al.
2001]
Chung et al.
[2005]
2001 2003
Present study
2001-2004
NCAR/CCSM3
] 2001-2003
TOA -2.5~+0.5 W/m2 -2.9 -3.6 -1.1
At h +7 6 +7 6 +4 5Atmosphere +7.6 +7.6 +4.5
Surface -18~-14 -10.5 -11.1 -5.6
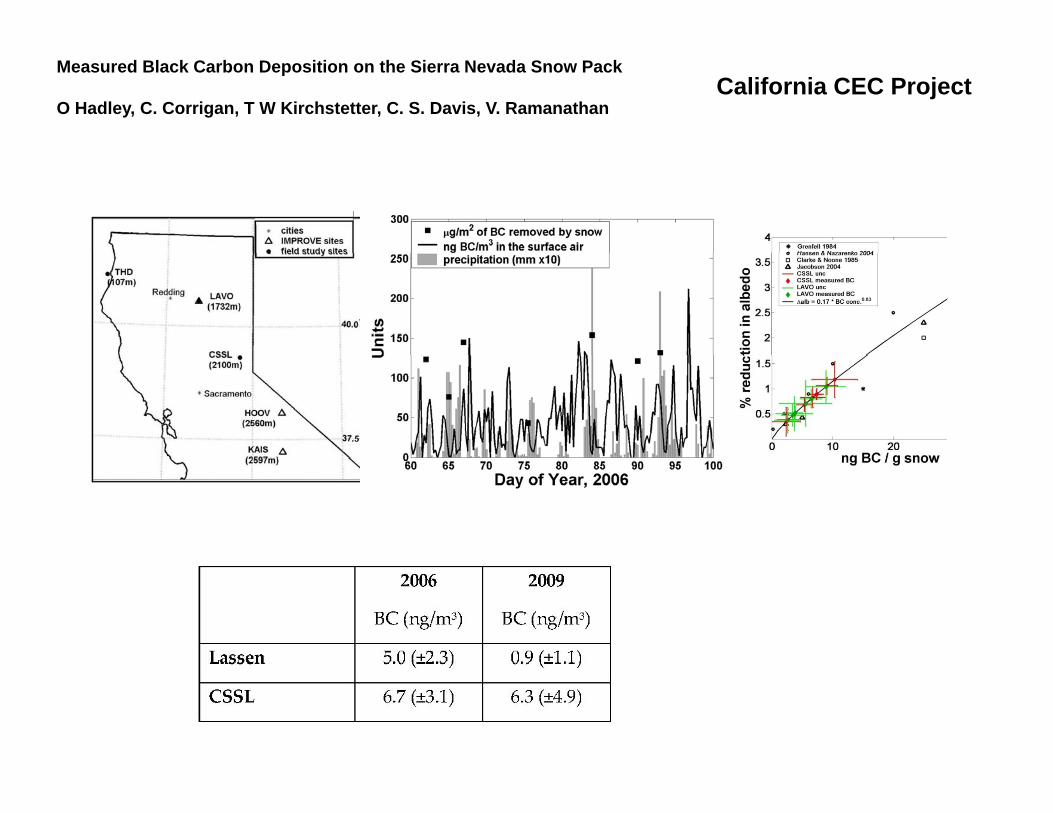
Measured Black Carbon Deposition on the Sierra Nevada Snow Pack
O Hadley, C. Corrigan, T W Kirchstetter, C. S. Davis, V. Ramanathan California CEC Project
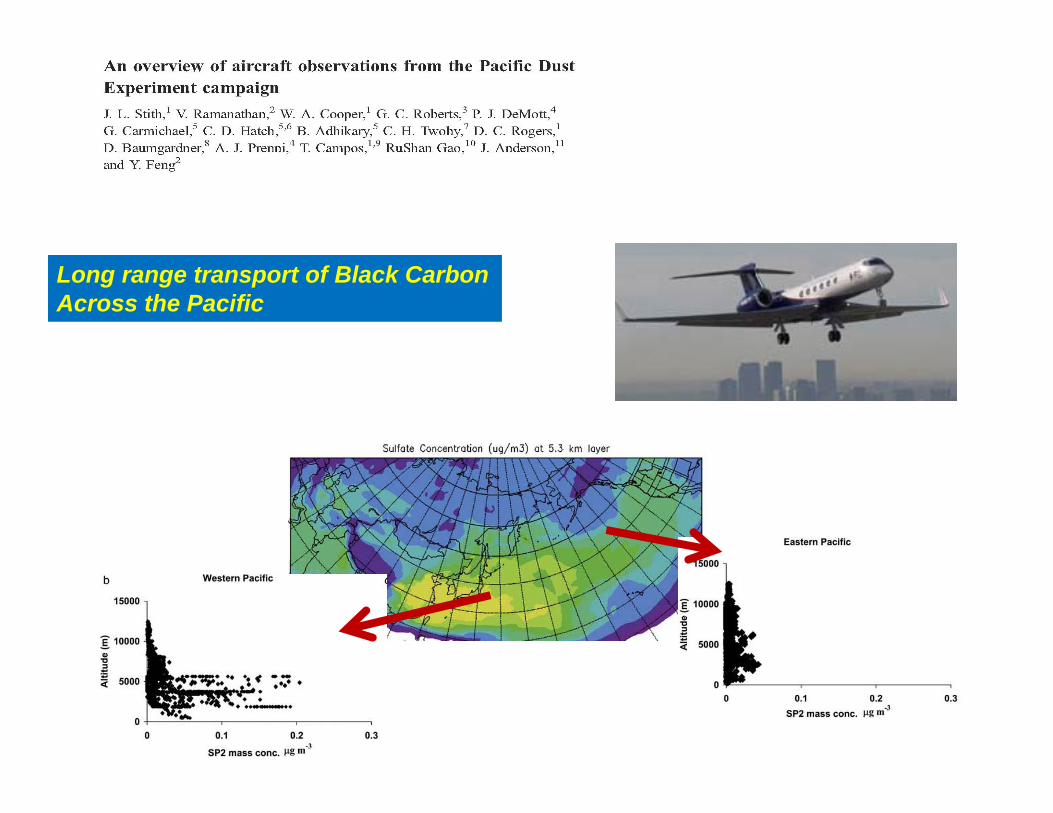
Long range transport of Black CarbonAcross the Pacific
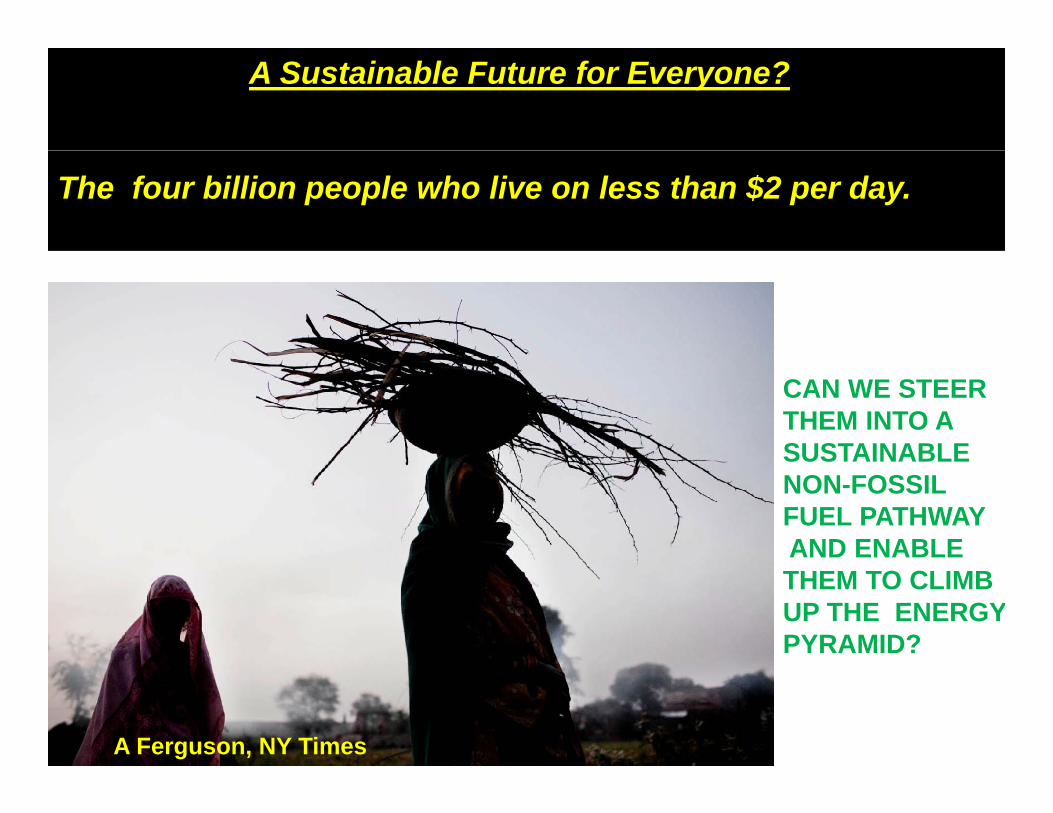
A Sustainable Future for Everyone?
The four billion people who live on less than $2 per day.
CAN WE STEERTHEM INTO A SUSTAINABLESUSTAINABLENON-FOSSIL FUEL PATHWAYAND ENABLE THEM TO CLIMBUP THE ENERGYPYRAMID?
A Ferguson, NY Times
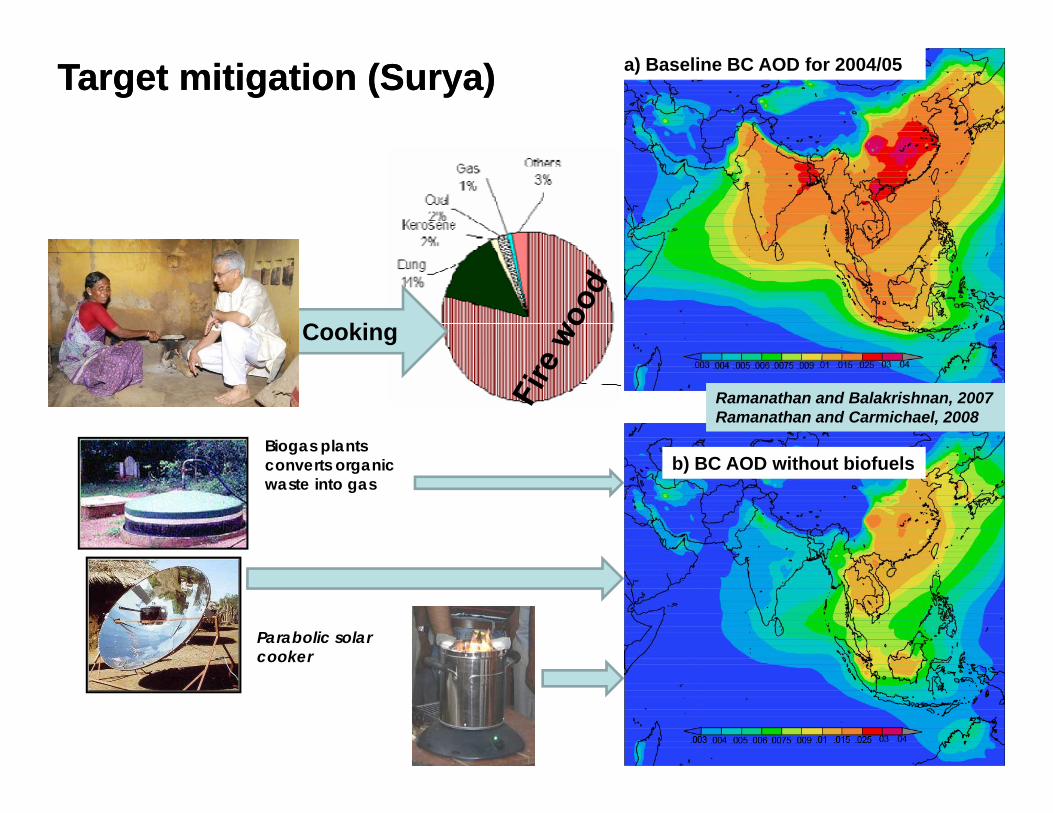
a) Baseline BC AOD for 2004/05Target mitigation (Surya)Target mitigation (Surya)
Rural Cooking
b) BC AOD ith t bi f l
Ramanathan and Balakrishnan, 2007Ramanathan and Carmichael, 2008
Biogas plants b) BC AOD without biofuelsconverts organic
waste into gas
Parabolic solar cooker
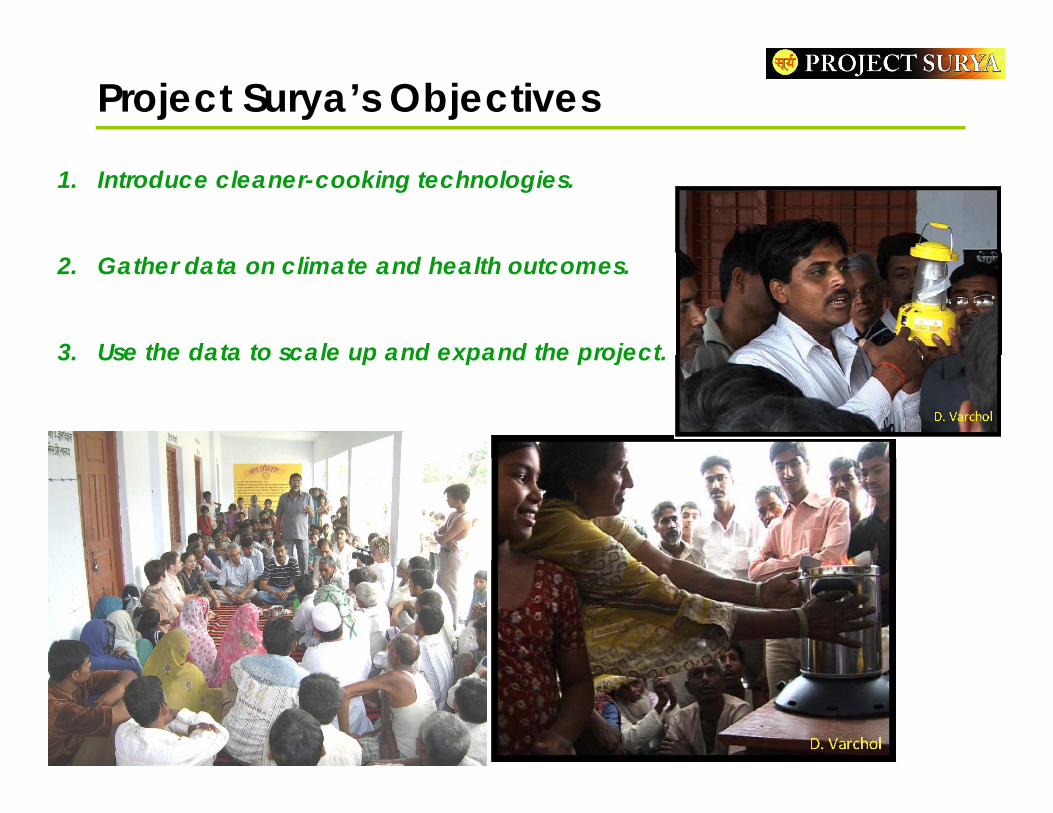
Project Surya’s Objectives
1. Introduce cleaner-cooking technologies.
2. Gather data on climate and health outcomes.
3 Use the data to scale up and expand the project3. Use the data to scale up and expand the project.
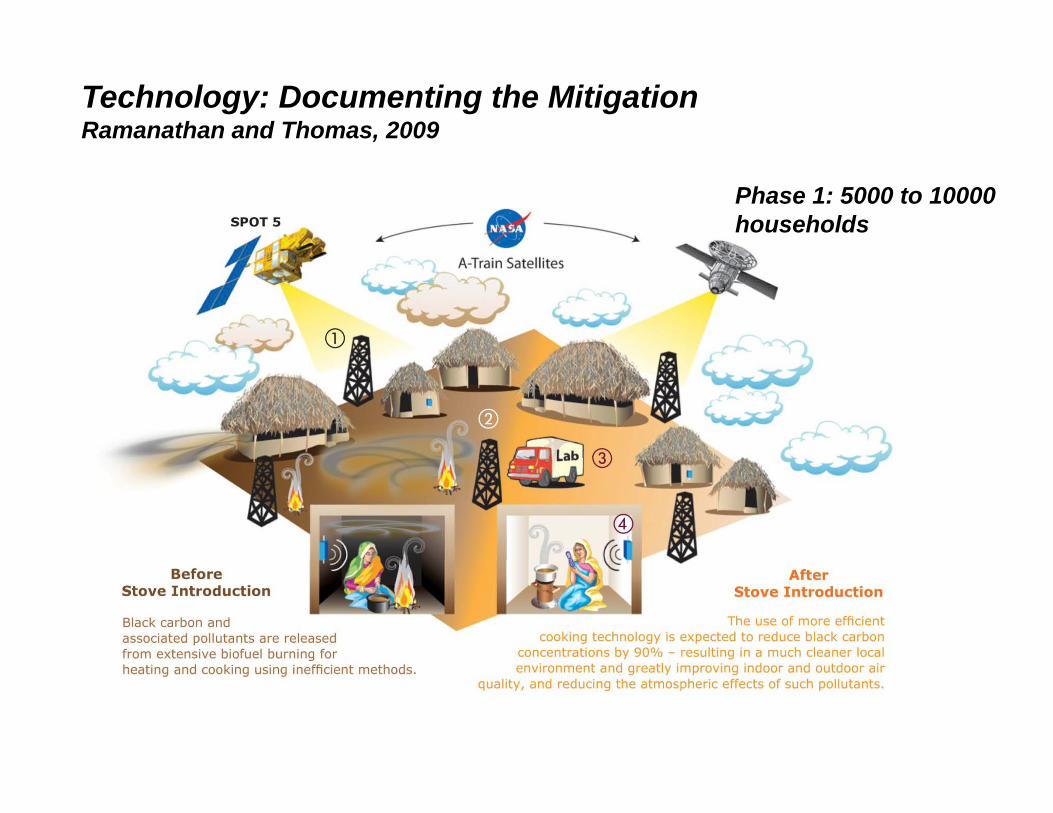
Technology: Documenting the MitigationRamanathan and Thomas, 2009
Phase 1: 5000 to 10000households
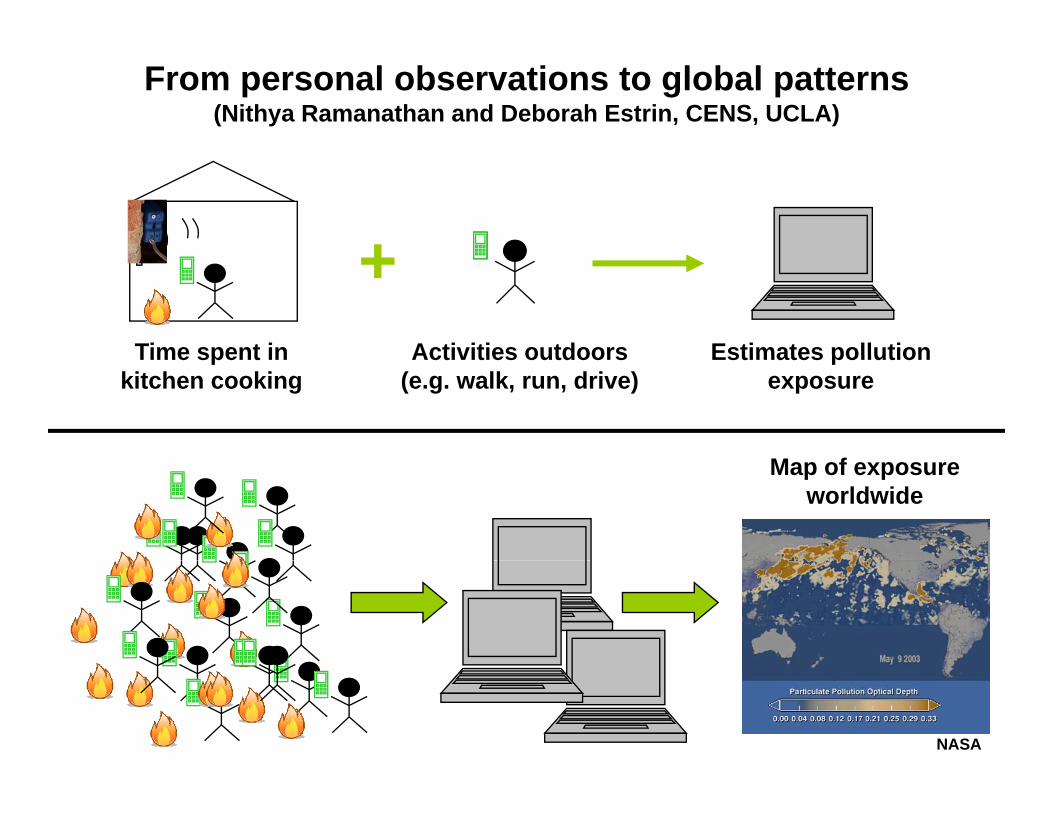
From personal observations to global patterns(Nithya Ramanathan and Deborah Estrin, CENS, UCLA)
+Time spent in
+Activities outdoors Estimates pollution
M f
Time spent in kitchen cooking
Activities outdoors (e.g. walk, run, drive)
Estimates pollution exposure
Map of exposure worldwide
NASA
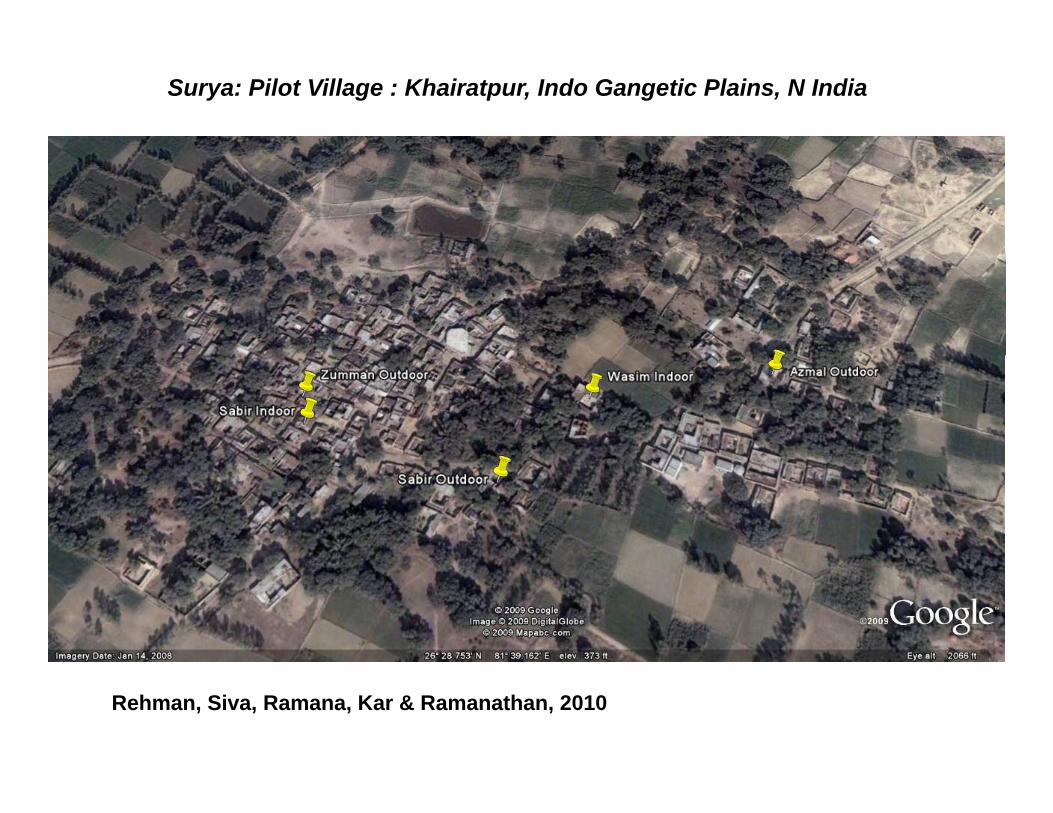
Surya: Pilot Village : Khairatpur, Indo Gangetic Plains, N India
Rehman, Siva, Ramana, Kar & Ramanathan, 2010
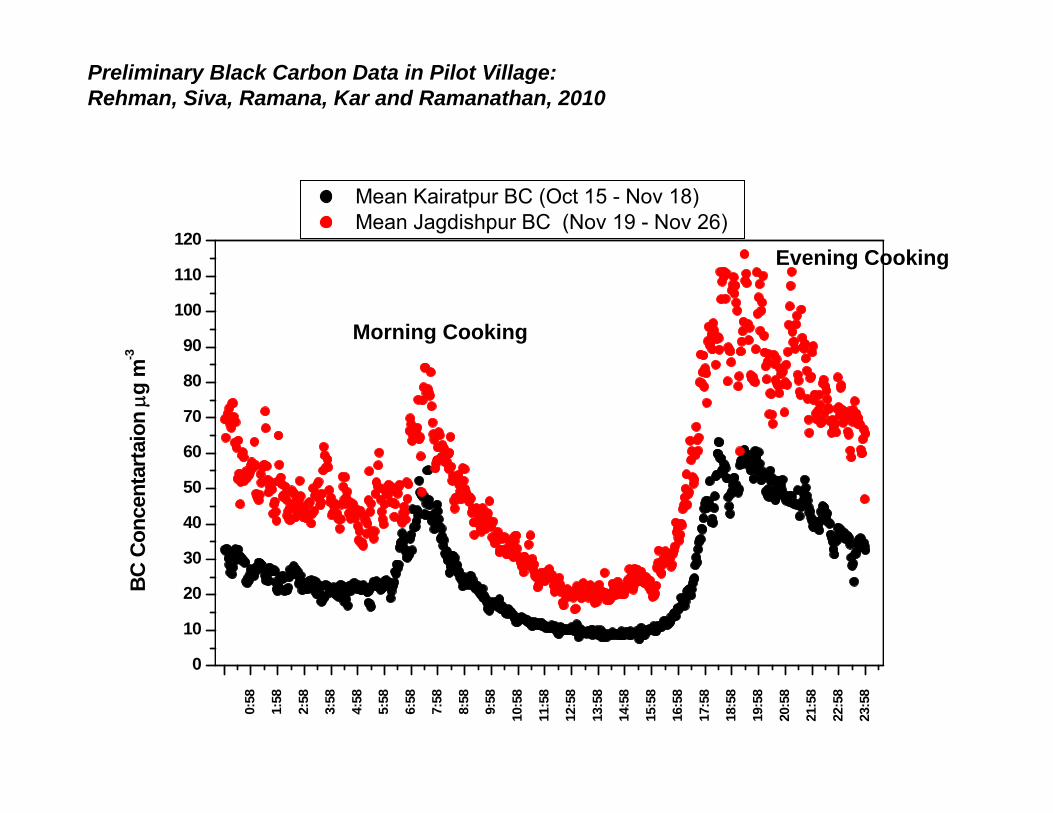
Preliminary Black Carbon Data in Pilot Village:Rehman, Siva, Ramana, Kar and Ramanathan, 2010
120
Mean Kairatpur BC (Oct 15 - Nov 18) Mean Jagdishpur BC (Nov 19 - Nov 26)
E i C ki
90
100
110
3
Morning Cooking
Evening Cooking
60
70
80
taio
n μg
m-3
30
40
50
Conc
enta
rt
0
10
20
30
BC
0:58
1:58
2:58
3:58
4:58
5:58
6:58
7:58
8:58
9:58
10:5
8
11:5
8
12:5
8
13:5
8
14:5
8
15:5
8
16:5
8
17:5
8
18:5
8
19:5
8
20:5
8
21:5
8
22:5
8
23:5
8
0
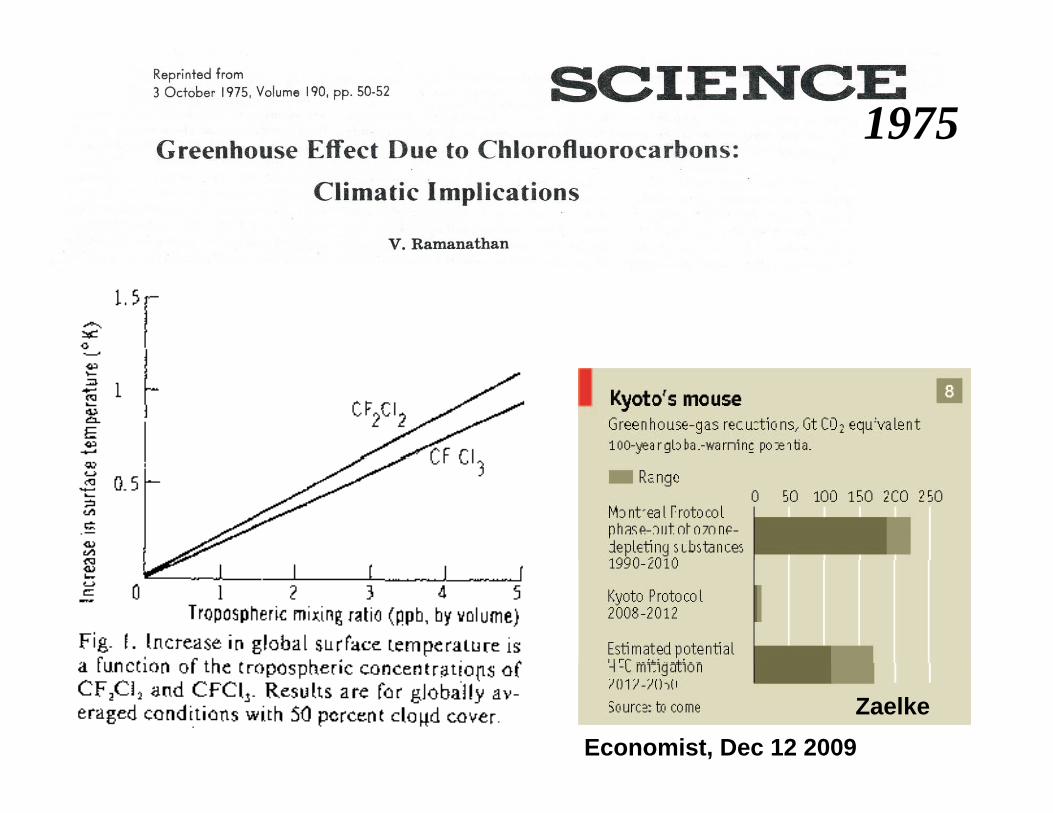
1975
ZaelkeEconomist, Dec 12 2009
THANK YOU - Any Questions?THANK YOU - Any Questions?THANK YOU - Any Questions?THANK YOU - Any Questions?