MICROSTRUCTURAL MODIFICATIONS AFTER SMALL CHARGE ...
22
1 MICROSTRUCTURAL MODIFICATIONS IN α-BRASS TARGETS AFTER SMALL CHARGE EXPLOSIONS D. Firrao a* , P. Matteis a , C. Pozzi a , M.G. Ienco b , G. Pellati b , M.R. Pinasco b , R. Montanari c , M.E. Tata c a DISMIC, Politecnico di Torino, Corso Duca degli Abruzzi 24, 10129, Torino, Italy b DCCI, Università di Genova, via Dodecaneso 31, 16146, Genova, Italy c Dip. Ing. Mec., Università di Roma Tor Vergata, Via del Politecnico 1, 00133, Roma, Italy * Corresponding author: Donato FIRRAO, DISMIC Politecnico di Torino, Corso Duca degli Abruzzi 24, 10129, Torino, Italy, e-mail [email protected], Phone +39.011.090.4663, Fax +39.011.090.4699 This is the author post-print version of an article published on Calphad, Vol. 33, pp. 76-81, 2009 (ISSN 0364-5916). The final publication is available at http://dx.doi.org/10.1016/j.calphad.2008.09.016 This version does not contain journal formatting and may contain minor changes with respect to the published edition. The present version is accessible on PORTO, the Open Access Repository of the Politecnico of Torino, in compliance with the publisher’s copyright policy. Copyright owner: Elsevier.
Transcript of MICROSTRUCTURAL MODIFICATIONS AFTER SMALL CHARGE ...
1
MICROSTRUCTURAL MODIFICATIONS IN α-BRASS TARGETS
AFTER SMALL CHARGE EXPLOSIONS
D. Firraoa*
, P. Matteisa, C. Pozzi
a, M.G. Ienco
b, G. Pellati
b, M.R. Pinasco
b, R. Montanari
c,
M.E. Tatac
aDISMIC, Politecnico di Torino, Corso Duca degli Abruzzi 24, 10129, Torino, Italy
bDCCI, Università di Genova, via Dodecaneso 31, 16146, Genova, Italy
cDip. Ing. Mec., Università di Roma Tor Vergata, Via del Politecnico 1, 00133, Roma, Italy
*Corresponding author: Donato FIRRAO,
DISMIC Politecnico di Torino, Corso Duca degli Abruzzi 24, 10129, Torino, Italy,
e-mail [email protected], Phone +39.011.090.4663, Fax +39.011.090.4699
This is the author post-print version of an article published on
Calphad, Vol. 33, pp. 76-81, 2009 (ISSN 0364-5916).
The final publication is available at
http://dx.doi.org/10.1016/j.calphad.2008.09.016
This version does not contain journal formatting and may contain
minor changes with respect to the published edition.
The present version is accessible on PORTO, the Open Access
Repository of the Politecnico of Torino, in compliance with the
publisher’s copyright policy.
Copyright owner: Elsevier.
2
Abstract
Metals exposed to explosions undergo several macro and micro changes. At the
microstructural level slip bands or mechanical twins, caused by the pressure and
temperature wave, can be detected. Twinning or slip occurs depending on the metal
stacking fault energy, the blast wave pressure and the deformation rate. An experimental
campaign was performed on different FCC metals. Results concerning α-brass (30% Zn)
are presented herein. Specimens exposed to small charge explosion (100 g of plastic
explosive) were analyzed by optical and electronic microscopy, by Electron Back-Scattered
Diffraction (EBSD) imaging, and by X-ray diffraction. Microstructural plastic deformation
marks were detected and their possible attribution either to mechanical twinning or to cross
slip is discussed on the basis of X-ray diffraction and EBSD results. The detectability
target-to-charge distance limit, and hence the critical stress for microstructural changes, are
evaluated.
Keywords: explosion, mechanical twinning, metallography, brass
1. Introduction
Effects on metal targets after an explosion include fracture, macroscopic and localized
plastic deformations, surface modifications and microstructural crystallographic alterations
with ensuing mechanical properties changes [1,2]. At some distance from an explosive
charge macro effects vanish; only microstructural variations, such as full or partial surface
melting, recrystallization phenomena, intense slip bands and/or mechanical twins, and
possibly phase transformations, are present, with the former ones to disappear first as
3
distance increases. In the case of small charge explosions, macro effects are restricted to
very small charge-to-target distances (of the order of tens of millimeters), whereas, at larger
distances, most modifications are at the crystallographic level only.
In some forensic science investigations, the abovementioned crystallographic
modifications, and particularly the occurrence of twinning, may be among the few
remaining clues of a small explosion, and may be useful to hypothesize the nature and
location of the charge.
Competition between slip and twinning is decided by the value of the stacking fault energy
(sf) of the metals undergoing explosive shocks. Since a few decades many studies can be
found in the literature regarding tests performed in the field of extremely high strain rates
and pressures (on the order of tens or hundreds of GPa), that cause twinning phenomena to
be clearly apparent [3]. Nevertheless, a systematic analysis of the range of pressures and
strain rates which lead to the slip/twinning transition lacks in the literature, thus preventing
a knowledgeable approach in case of medium to small charge explosions.
By the use of elasticity theory formulations [4] the maximum shear stress arising from the
overpressure at the detectability threshold (where overall plastic deformation is absent) can
be estimated and results compared with the minimum shear stress necessary to form slip
bands or twins [1], in order to try to find correlations between maximum distance of
detectability and shock wave overpressures impinging on a metal object.
In order to seek experimental proofs of the validity of the approach, an experimental
program has been undertaken to correlate the blast wave properties with the ensuing
modifications observed in blast exposed Face Centered Cubic (FCC) metal targets with low
4
to high stacking fault energy values. Results concerning AISI 304 stainless steel, 18 carat
gold alloy, OFHC copper, and AA 2014 were already published [6-8]. Results obtained
from α-brass targets are presented herein.
2. Experimental
2.1 Specimens preparation
Disk shaped samples, 20.5 mm diameter and 3 mm thickness, were pierced from a rolled
and annealed α-brass sheet. The nominal composition (wt.%) was Cu 70, Zn 30. The
resulting microstructure was fully recrystallized with average grain size of the order of 50
µm.
2.2 Experimental setups and methods
The experimental setups are shown in Figures
Figure 1. Spherical unconfined charges of plastic explosive (wt.% composition: pentrite
86%, plasticizer 11%, polymer 2%, carbon black 0.45%) were exploded by cylindrical
detonators inserted at their cores. The charges were hung from the detonator electrical
cables and the samples with previously polished and etched surfaces were placed
horizontally below them (Figures 1a,b). To approximate free-surface conditions on the face
not directly exposed to the shock wave, each sample was supported only by a very thin
5
circumferential rim of a wooden sample-holder. The same setup was previously used for all
the tested alloys and described in more detail [6].
The tests were performed with 100 g charges (TNT equivalent mass: 109 g [6]) and with
charge-to-sample distances, d, in the 70 to 420 mm range (distance between the center of
the charge and the sample upper surface).
The sample thickness was measured before and after the tests. The blast exposed surfaces
were examined as-such by Optical Microscopy (OM), Scanning Electron Microscopy
(SEM), Electron Back-Scattered Diffraction (EBSD) imaging, and X-ray Diffraction
(XRD).
2.3 Shock Wave Properties
For dimensional reasons, the blast waves properties depend on the reduced distance,
defined as r = dm-1/3, where m is the charge’s TNT equivalent mass [8,9]. The peak
overpressure exercised on the sample’s exposed surface, p, is estimated (Table I) either
from previous instrumented explosion tests performed in the 0.3 to 0.88 m·kg-1/3
reduced
distance range [6], or from previous literature data concerning the same reduced distance
range [9], by considering the pressure increase due to the reflection of the blast wave on the
sample [10]. The overpressure rise time was also estimated from experimental results.
In the case of tests at charge-to-target distances close to, or larger than, the microstructural
variation detectability thresholds, and causing limited or nil final plastic deformation, the
sample stress history can be estimated by using the dynamic elasticity theory. The
overpressure rise times are much longer (on the order of 10 µs) than the time needed for a
6
shock wave to travel twice through the sample (about 1.35 µs for an elastic uniaxial-
deformation wave). It follows that the stress history of any point inside the sample
consisted of only one significant pressure rise and pressure decrease (plus negligible
oscillations), with an overall maximum value that decreases with the distance from the
exposed surface; no relevant negative pressure (i.e. tension) occurs [6]. Thus the maximum
shear stress σmax occurs at the most favorable orientation at the exposed surface, and can be
calculated according to Meyers [4].
3. Results
3.1 Macroscopic deformation
The specimens’ residual deformation has been evaluated by measuring their thickness (t)
before and after the explosions with a micrometer caliper (± 0.01 mm instrumental
uncertainty); Δt values are reported in Table I.
A slight compressive residual deformation (less than 1%) probably occurred at distances
lower than 170 mm, since most measures in this range yield negative values, although
comparable the experimental uncertainty; no residual deformation occurred at the highest
distances, on the same basis.
Thus, the shear stress τmax calculated with the abovementioned hypotheses (Table I) is
considered valid for tests at distances from 220 mm on, whereas it may be not completely
valid for smaller distances.
3.2 Microstructures
7
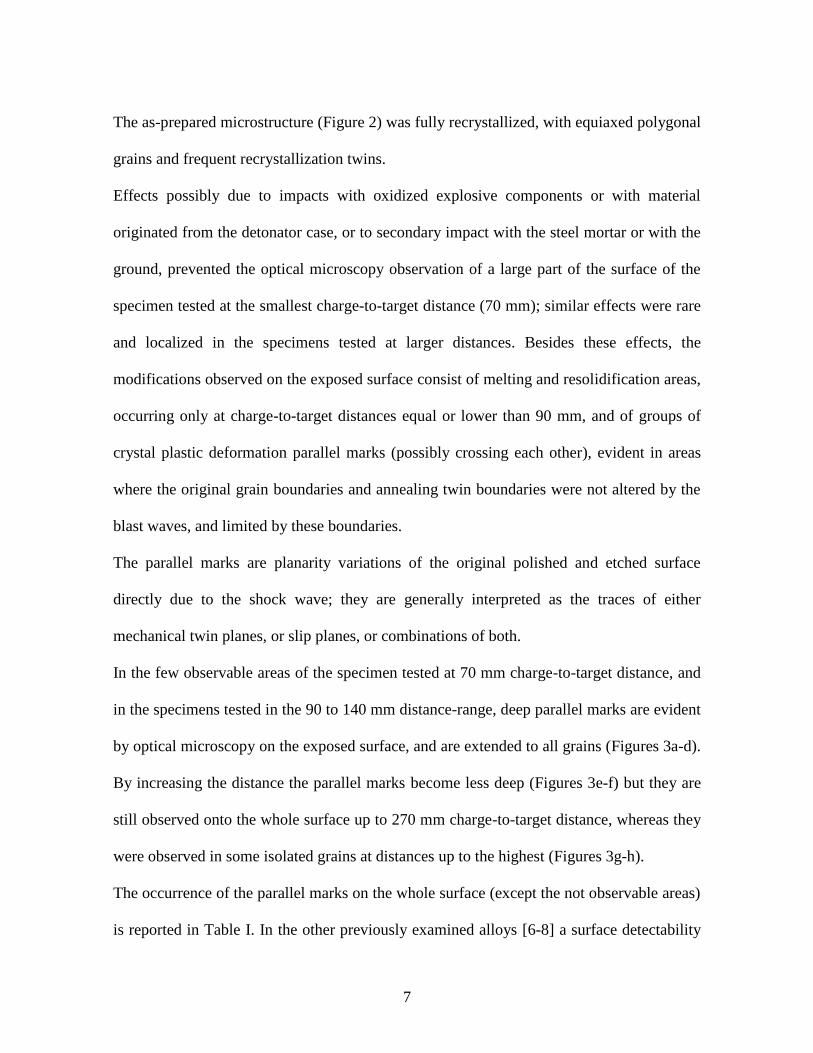
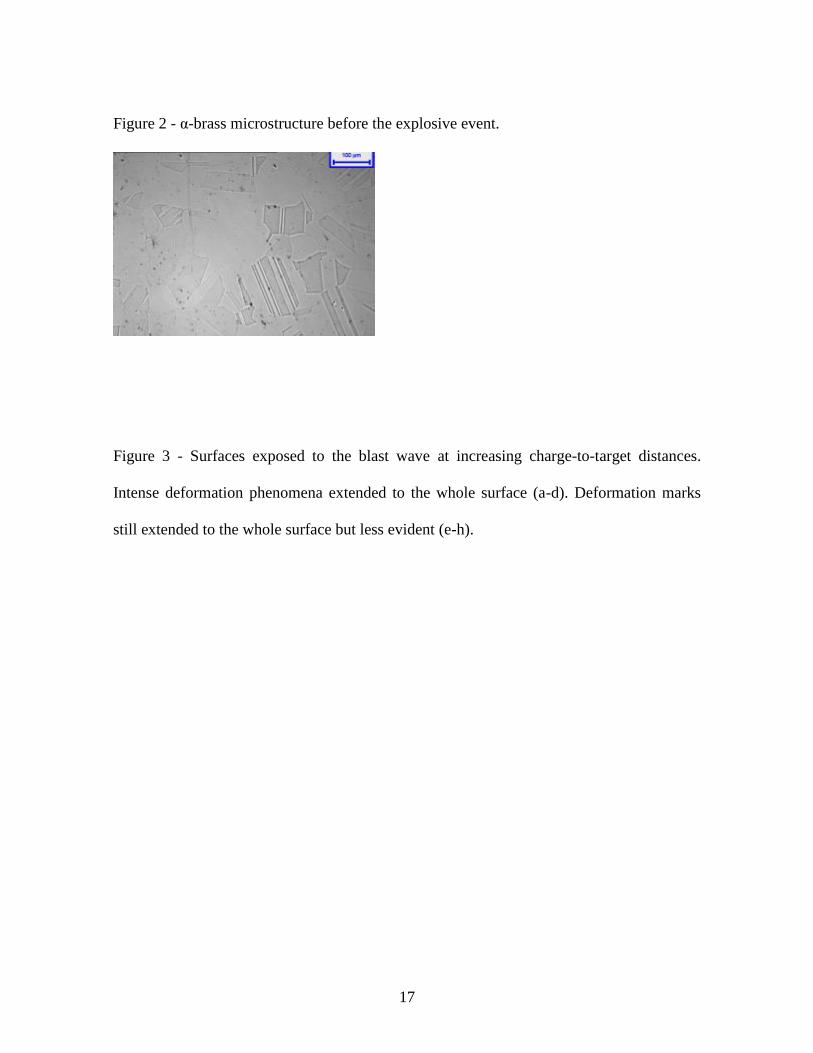
The as-prepared microstructure (Figure 2) was fully recrystallized, with equiaxed polygonal
grains and frequent recrystallization twins.
Effects possibly due to impacts with oxidized explosive components or with material
originated from the detonator case, or to secondary impact with the steel mortar or with the
ground, prevented the optical microscopy observation of a large part of the surface of the
specimen tested at the smallest charge-to-target distance (70 mm); similar effects were rare
and localized in the specimens tested at larger distances. Besides these effects, the
modifications observed on the exposed surface consist of melting and resolidification areas,
occurring only at charge-to-target distances equal or lower than 90 mm, and of groups of
crystal plastic deformation parallel marks (possibly crossing each other), evident in areas
where the original grain boundaries and annealing twin boundaries were not altered by the
blast waves, and limited by these boundaries.
The parallel marks are planarity variations of the original polished and etched surface
directly due to the shock wave; they are generally interpreted as the traces of either
mechanical twin planes, or slip planes, or combinations of both.
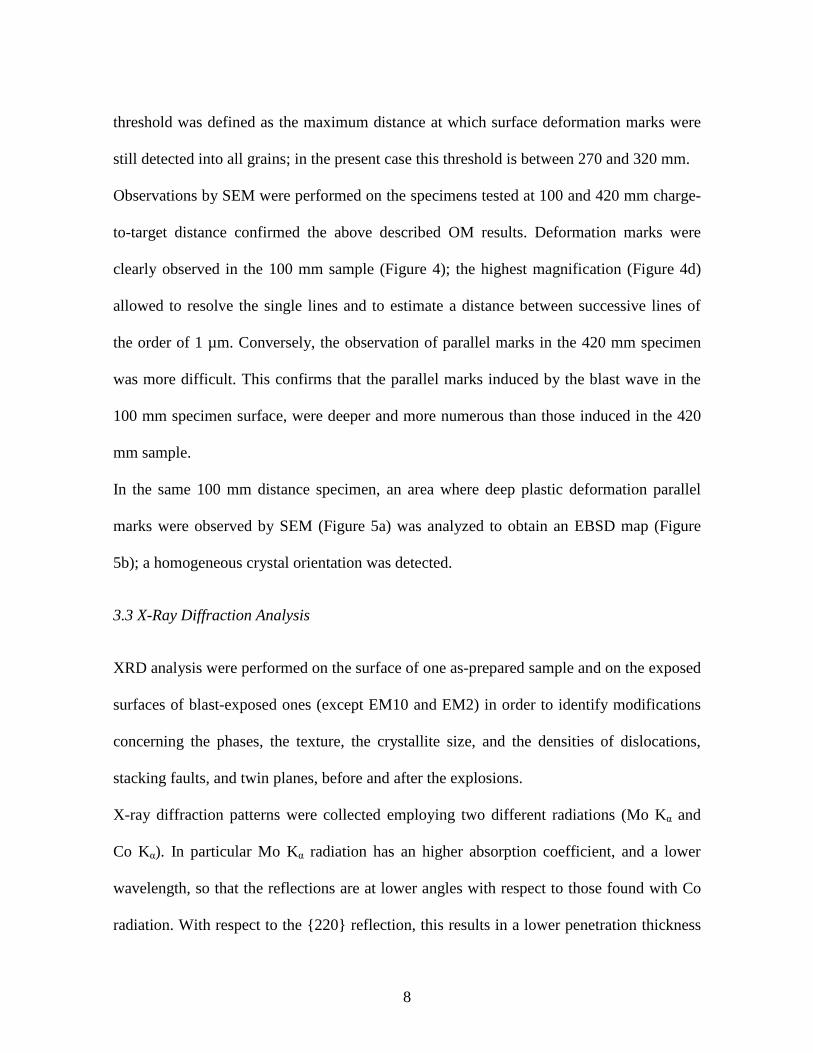
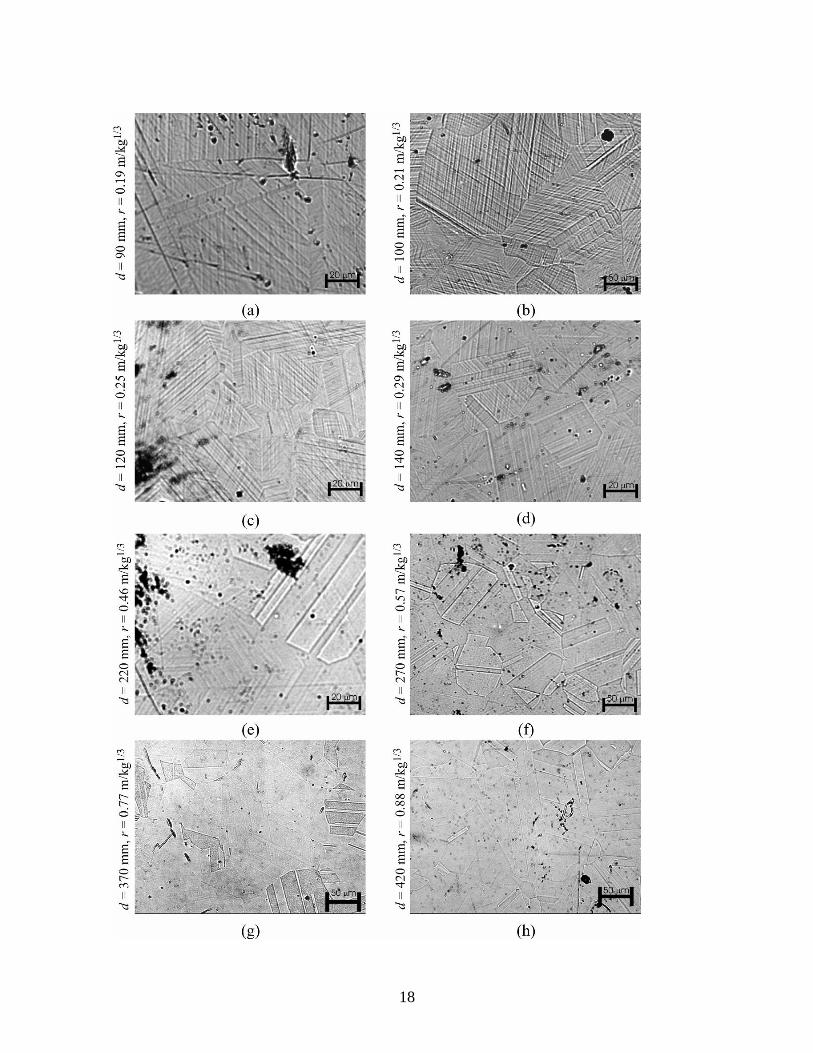
In the few observable areas of the specimen tested at 70 mm charge-to-target distance, and
in the specimens tested in the 90 to 140 mm distance-range, deep parallel marks are evident
by optical microscopy on the exposed surface, and are extended to all grains (Figures 3a-d).
By increasing the distance the parallel marks become less deep (Figures 3e-f) but they are
still observed onto the whole surface up to 270 mm charge-to-target distance, whereas they
were observed in some isolated grains at distances up to the highest (Figures 3g-h).
The occurrence of the parallel marks on the whole surface (except the not observable areas)
is reported in Table I. In the other previously examined alloys [6-8] a surface detectability
8
threshold was defined as the maximum distance at which surface deformation marks were
still detected into all grains; in the present case this threshold is between 270 and 320 mm.
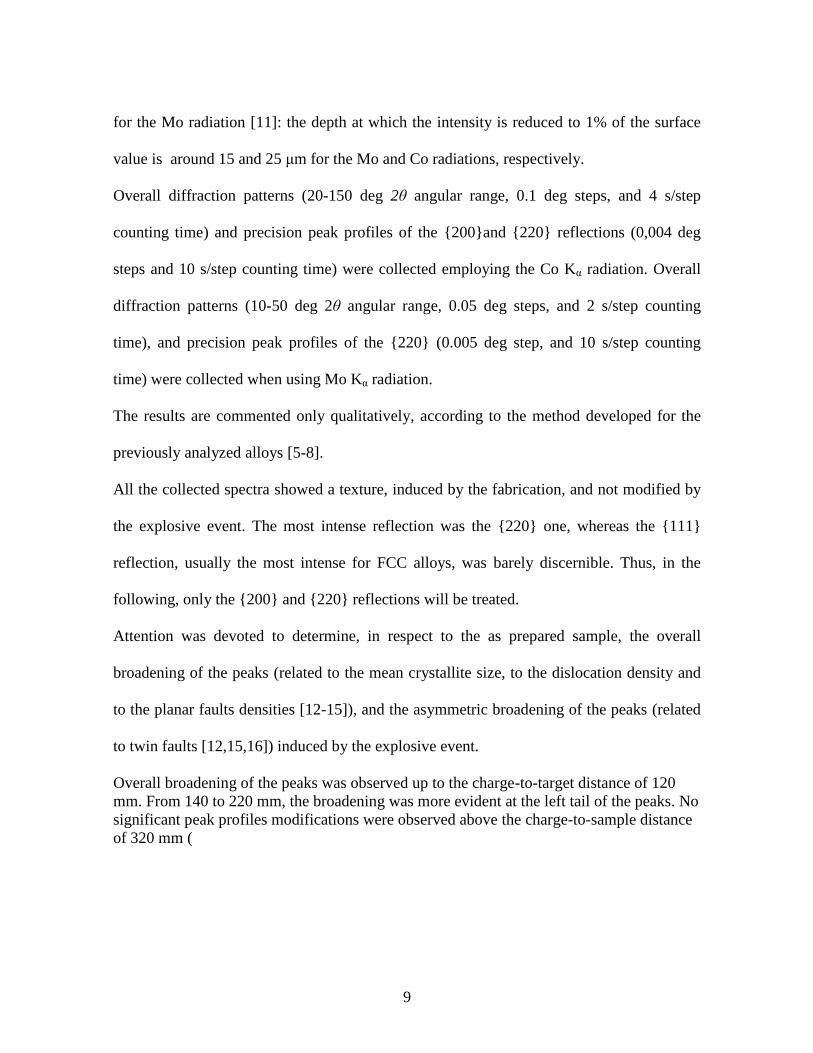
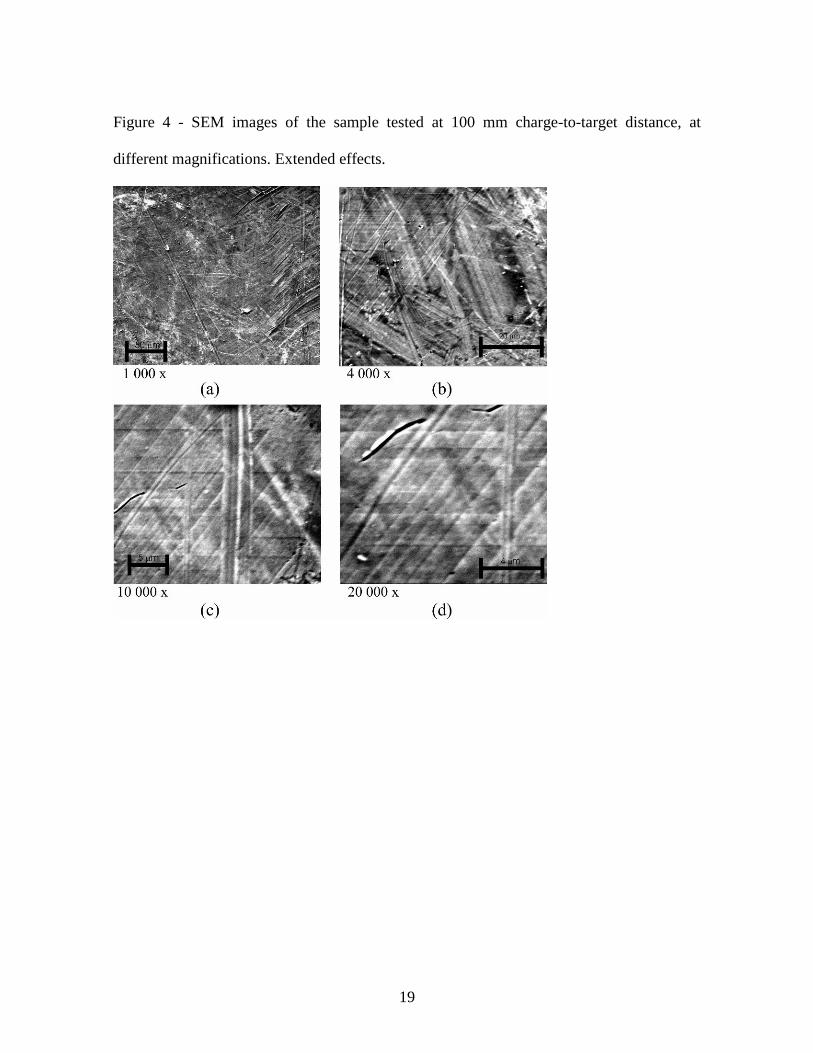
Observations by SEM were performed on the specimens tested at 100 and 420 mm charge-
to-target distance confirmed the above described OM results. Deformation marks were
clearly observed in the 100 mm sample (Figure 4); the highest magnification (Figure 4d)
allowed to resolve the single lines and to estimate a distance between successive lines of
the order of 1 µm. Conversely, the observation of parallel marks in the 420 mm specimen
was more difficult. This confirms that the parallel marks induced by the blast wave in the
100 mm specimen surface, were deeper and more numerous than those induced in the 420
mm sample.
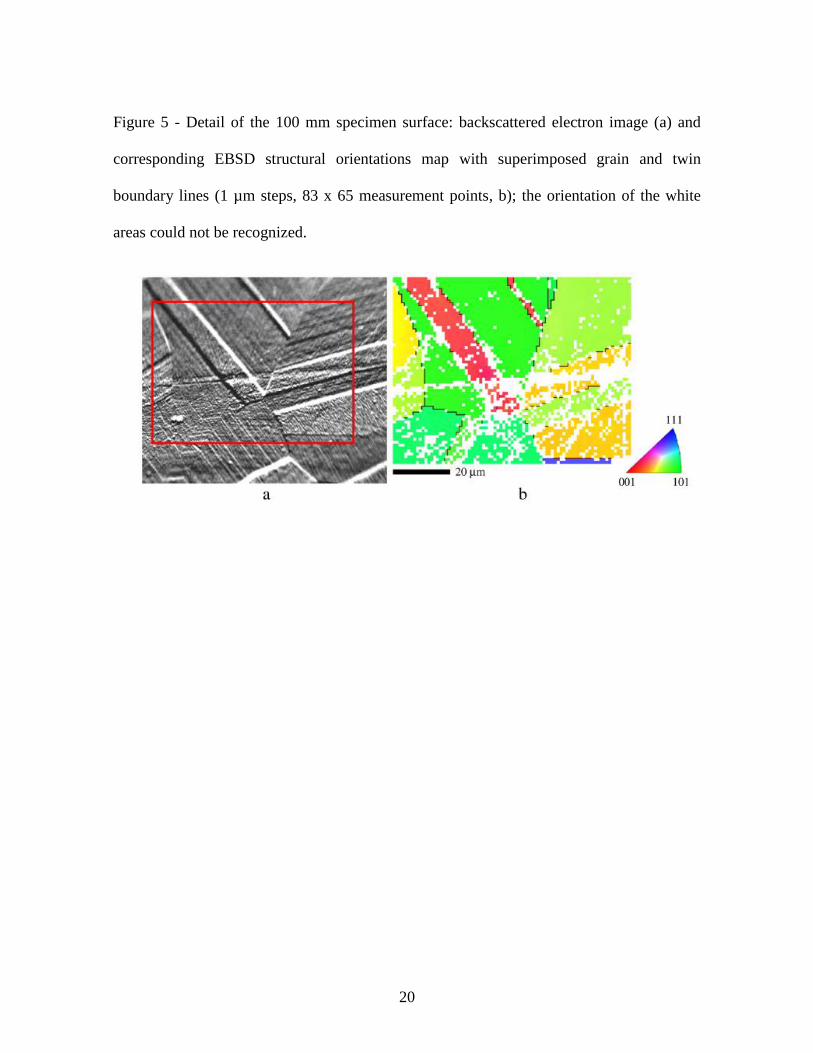
In the same 100 mm distance specimen, an area where deep plastic deformation parallel
marks were observed by SEM (Figure 5a) was analyzed to obtain an EBSD map (Figure
5b); a homogeneous crystal orientation was detected.
3.3 X-Ray Diffraction Analysis
XRD analysis were performed on the surface of one as-prepared sample and on the exposed
surfaces of blast-exposed ones (except EM10 and EM2) in order to identify modifications
concerning the phases, the texture, the crystallite size, and the densities of dislocations,
stacking faults, and twin planes, before and after the explosions.
X-ray diffraction patterns were collected employing two different radiations (Mo Kα and
Co Kα). In particular Mo Kα radiation has an higher absorption coefficient, and a lower
wavelength, so that the reflections are at lower angles with respect to those found with Co
radiation. With respect to the {220} reflection, this results in a lower penetration thickness
9
for the Mo radiation [11]: the depth at which the intensity is reduced to 1% of the surface
value is around 15 and 25 μm for the Mo and Co radiations, respectively.
Overall diffraction patterns (20-150 deg 2θ angular range, 0.1 deg steps, and 4 s/step
counting time) and precision peak profiles of the {200}and {220} reflections (0,004 deg
steps and 10 s/step counting time) were collected employing the Co Kα radiation. Overall
diffraction patterns (10-50 deg 2θ angular range, 0.05 deg steps, and 2 s/step counting
time), and precision peak profiles of the {220} (0.005 deg step, and 10 s/step counting
time) were collected when using Mo Kα radiation.
The results are commented only qualitatively, according to the method developed for the
previously analyzed alloys [5-8].
All the collected spectra showed a texture, induced by the fabrication, and not modified by
the explosive event. The most intense reflection was the {220} one, whereas the {111}
reflection, usually the most intense for FCC alloys, was barely discernible. Thus, in the
following, only the {200} and {220} reflections will be treated.
Attention was devoted to determine, in respect to the as prepared sample, the overall
broadening of the peaks (related to the mean crystallite size, to the dislocation density and
to the planar faults densities [12-15]), and the asymmetric broadening of the peaks (related
to twin faults [12,15,16]) induced by the explosive event.
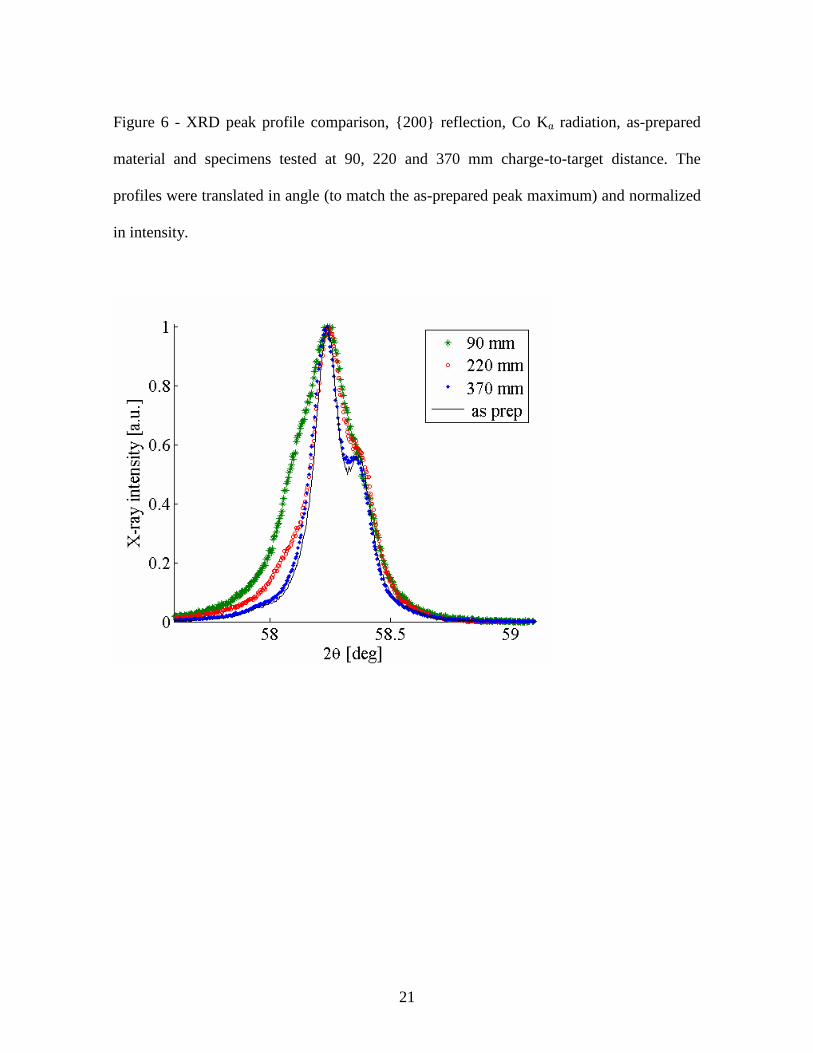
Overall broadening of the peaks was observed up to the charge-to-target distance of 120
mm. From 140 to 220 mm, the broadening was more evident at the left tail of the peaks. No
significant peak profiles modifications were observed above the charge-to-sample distance
of 320 mm (
10
Figure 6).
4. Discussion
For most FCC alloys, at low deformation rates the critical shear stress for slip, c,sl, is lower
than the critical shear stress for twinning, c,tw, but increases as the deformation rate
increases. Conversely, c,tw is almost constant with the deformation rate, and is an
increasing function of the stacking fault energy, sf. Thus twinning can occur at high
deformation rates in FCC alloys with low sf as a single deformation mechanism or
concurrently with slip, depending on the strain rate as well as the blast intensity.
Values of sf of Cu70Zn30-brass in the 10 -15 mJ/m2 range can be found in the literature
[17-22]. On this bases the relationship by Firrao et al. [1] yields c,tw values ranging from
22 to 33 MPa, larger values are obtained by the use of other relationships [23,24].
On the other hand, typical values of critical shear stress for slip at low deformation rates,
c,sl, vary from 10-4
to 10-5
G, where G, is the shear modulus, giving values in the 0.4 to 4
MPa range for the present alloy [25].
11
From the present results, the threshold shear stress th for the detection of whole surface
deformation marks is in the 7 to 8 MPa range (Table I, 270 to 320 mm charge-to-target
distance). Such a surface threshold stress th is lower than the estimated limiting twinning
stress c,tw, suggesting that the deformation marks observed at the higher distances are
mainly due to slip. At these high distances, this slip deformation was not sufficient to yield
a dislocation density increase detectable by the XRD peak broadening.
At charge to target distances lower than 120 mm, the estimated critical shear stress for
twinning was exceeded, thus a twinning or, better, a combined slip/twinning effect can be
hypothesized. The EBSD analysis indicated that the deep deformation lines observed by
SEM in one area of the 90 mm specimen were not twin boundary lines. Therefore, it may
be concluded that at least a significant portion of these lines are the traces of slip
deformations, even if twinning cannot be excluded on the basis of EBDS imaging only. At
these distances the XRD analysis shows a large peak broadening, which is probably
determined by the contribution of several phenomena, including the localized melting
(yielding small grains in the resolidified layer) and the increase of the densities of both
dislocation and planar faults.
Since the asymmetric broadening of the XRD peaks is often correlated with the presence of
twin faults [12], the XRD results in the 140 to 220 mm charge-to-target distance range
suggests that twinning phenomena occurred in this range even if the estimated shear stress
max was lower than c,tw. Moreover, a similar result (i.e. occurrence of mechanical twins in
specimens with estimate max lower than estimated c,tw) was previously obtained for the
stainless steel [6], and was explained by hypothesizing the influence of other effects (e.g.
12
constrained thermal dilatation) on the actual max surface stress, alongside the blast
pressure.
5. Conclusions
A series of explosions of small (100 g plastic-explosive, TNT equivalent 109 g) charges
were performed at charge-to-target distances in the 70 to 420 mm range, employing as
targets 3 mm thick disks consisting of α-brass with 50 μm average grain size.
Macroscopic deformations were very limited. Crystallographic alterations, due to either
twin or slip phenomena, or both, were evidenced by sets of parallel surface plastic
deformation marks in every grain, up to a OM detectability threshold distance comprised in
the 270 to 320 mm range, corresponding to a 8-7 MPa surface shear stress range, as
computed from the blast wave pressure by using the elasticity theory.
The plastic deformation marks are tentatively attributed to slip at the higher distances and
to both slip and twinning at the shortest distances, on the basis of the determined shear
stress thresholds for each of these phenomena. More extensive statistical EBSD analyses
are ongoing in order to verify this latter hypothesis and to highlight the respective
contributions of the two named plastic deformation modes.
Acknowledgements
G. Brandimarte and S. Petralia, Italian Navy, Istituto Chimica Esplosivi, It-19138, La
Spezia, Italy, for performing the explosive tests. Italian Ministry of University and
Reaserch for financial support, by grant n. 2001094974.

13
14
References
[1] D. Firrao, G. Ubertalli, E. Cordano, Tech. Law Ins. 4 (1999) 23-30.
[2] G.E. Dieter, Hardening effects produced with shock waves, in “Strengthening
mechanisms in solids”, J.J. Harwood ed., ASM, 1962.
[3] C. S. Smith, Trans. AIME 212 (1958) 574-589.
[4] M.A. Meyers and K.K. Chawla, Mechanical Metallurgy: principles and applications,
(Prentice-Hall, Englewood Cliffs, NJ, 1984), 536.
[5] D. Firrao, P. Matteis, G. Scavino, G. Ubertalli, M.G. Ienco, G. Pellati, P. Piccardo,
M.R. Pinasco, E. Stagno, R. Montanari, M.E. Tata, G. Brandimarte, S. Petralia, Mater.
Sc. Eng. A, 424 (2006), n. 1, 23-32.
[6] D. Firrao P. Matteis, G. Scavino, G. Ubertalli, C. Pozzi, M.G. Ienco, G. Pellati, P.
Piccardo, M.R. Pinasco, E. Stagno, R. Montanari, M.E. Tata, G. Brandimarte, S.
Petralia, Metall. Mater. Trans. A, 38A (2007), 2869 - 2884
[7] D. Firrao; P. Matteis; C. Pozzi; G. Scavino; G. Ubertalli; M.G. Ienco; G. Pellati; P.
Piccardo; M.R. Pinasco; G. Costanza; R. Montanari; M.E. Tata; G. Brandimarte; S.
Petralia, TMS 2008 Annual Meeting Supplemental Proceedings, Volume I: Materials
Processing and Properties, TMS (USA), 2008, 327-332, Vol. 1, ISBN: 978-0-87339-
716-2
[8] H.L. Brode, J. App. Phys. 26 (1955) 766-775.
[9] J. Henrych, The dynamic of explosion and its use, Elsevier, Amsterdam, 1979.
[10] S. Petralia, Compendio di esplosivistica, Mariperman, La Spezia, Italy, 2000.
[11] B. D. Cullity, Elements of X-ray diffraction, 2nd edition, Addison Wesley, Reading,
MA, 1978, pp. 292-294.
15
[12] B.E. Warren, X-Ray Diffraction, Addison Wesley, Reading, MA, 1969, pp. 275-298.
[13] G.K. Williamson and R.E. Smallman, Phil. Mag. 1 (1956) 34.
[14] W.H. Hall, Proc. Phys. Soc. London A62 (1949) 741.
[15] L. Velterop, R. Delhez, Th. H. de Keijser, E. J. Mittemeijer, D. Reefman, J. Appl.
Cryst. 33 (2000), 296-306
[16] M.S. Paterson, J. Appl. Phys. 23 (1952) 805-811.
[17] A.Howie and P.R. Swann, Phil. Mag. 6 (1961) 1215.
[18] R. Siems, P. Delavignette, S. Amelinckx, Z. Physik 165 (1961) 502.
[19] P.R. Thornton, T.E. Mitchell, P.B. Hirsch, Phil. Mag. 7 (1962) 1349.
[20] L.E. Murr and F.I. Grace, Trans. AIME 245 (1969) 2225.
[21] L.E. Murr, Interfacial Phenomena In Metals And Alloys, Addison Wesley, Reading,
MA, 1975, pp. 145-147.
[22] B. Gonzalez, L. E. Murr, O. L. Valerio, E. V. Esquivel, H. Lopez, Materials
Characterization 49 (2003) 359-366.
[23] H.Suzuki and C. Barrett, Acta Metall. 6 (1958) 156.
[24] L. Remy and A. Pineau, Mat Sc Eng. 26 (1976) 123.
[25] R.W. Cahn, P. Haasen (eds.), Physical metallurgy. North- Holland, Amsterdam
(Holland), 1996

16
Figures
Figure 1 - View (a) and drawing (b) of experimental setup with metal specimens; drawing
(c) of experimental setup with pressure sensors (all dimensions are in mm).
17
Figure 2 -α-brass microstructure before the explosive event.
Figure 3 - Surfaces exposed to the blast wave at increasing charge-to-target distances.
Intense deformation phenomena extended to the whole surface (a-d). Deformation marks
still extended to the whole surface but less evident (e-h).
18
19
Figure 4 - SEM images of the sample tested at 100 mm charge-to-target distance, at
different magnifications. Extended effects.
20
Figure 5 - Detail of the 100 mm specimen surface: backscattered electron image (a) and
corresponding EBSD structural orientations map with superimposed grain and twin
boundary lines (1 µm steps, 83 x 65 measurement points, b); the orientation of the white
areas could not be recognized.
21
Figure 6 - XRD peak profile comparison, {200} reflection, Co Kα radiation, as-prepared
material and specimens tested at 90, 220 and 370 mm charge-to-target distance. The
profiles were translated in angle (to match the as-prepared peak maximum) and normalized
in intensity.
22
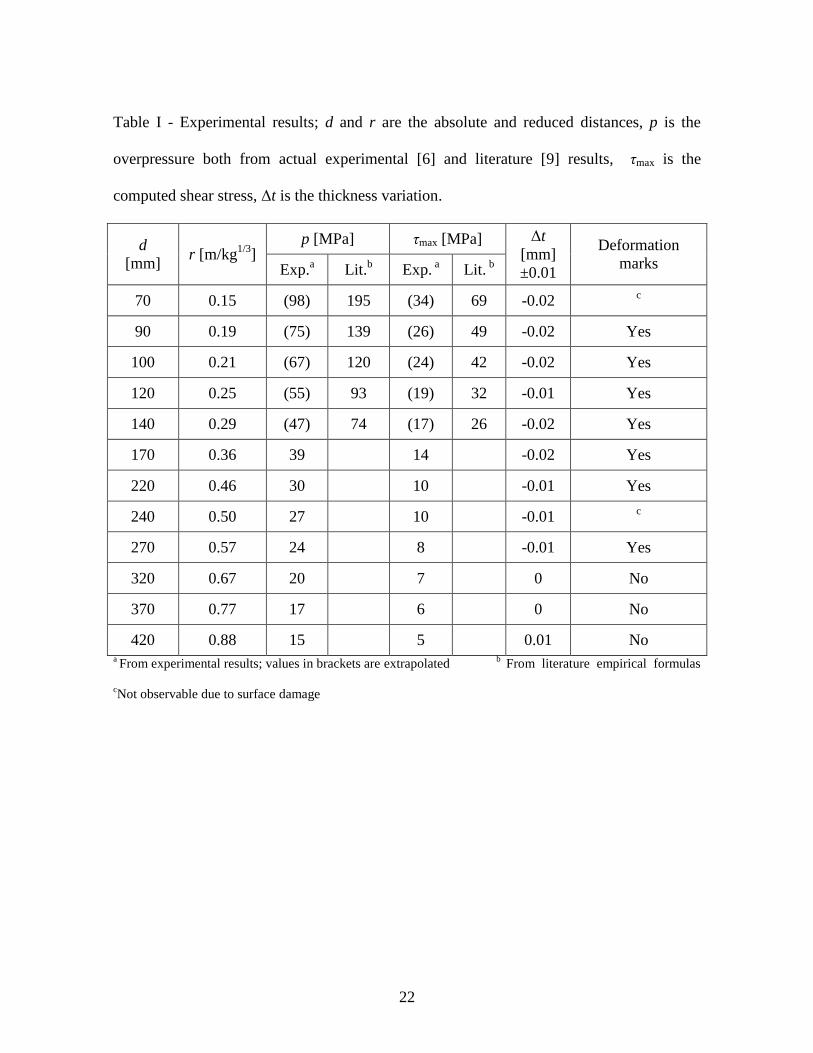
Table I - Experimental results; d and r are the absolute and reduced distances, p is the
overpressure both from actual experimental [6] and literature [9] results, τmax is the
computed shear stress, Δt is the thickness variation.
d
[mm] r [m/kg
1/3]
p [MPa] τmax [MPa] Δt
[mm]
±0.01
Deformation
marks Exp.a Lit.
b Exp.
a Lit.
b
70 0.15 (98) 195 (34) 69 -0.02 c
90 0.19 (75) 139 (26) 49 -0.02 Yes
100 0.21 (67) 120 (24) 42 -0.02 Yes
120 0.25 (55) 93 (19) 32 -0.01 Yes
140 0.29 (47) 74 (17) 26 -0.02 Yes
170 0.36 39 14 -0.02 Yes
220 0.46 30 10 -0.01 Yes
240 0.50 27 10 -0.01 c
270 0.57 24 8 -0.01 Yes
320 0.67 20 7 0 No
370 0.77 17 6 0 No
420 0.88 15 5 0.01 No a From experimental results; values in brackets are extrapolated
b From literature empirical formulas
cNot observable due to surface damage


![Peripheral modifications of [Ψ[CH NH]Tpg4]vancomycin ...](https://static.fdocument.org/doc/165x107/6211b4c5b9a3d33a3c037f89/peripheral-modifications-of-ch-nhtpg4vancomycin-.jpg)