Microbial growth models for shelf life prediction in an ... · Microbial growth models for shelf...
11
Microbial growth models for shelf life prediction in an Icelandic cod supply chain R. Gospavic 1 , H. L. Lauzon 2 , V. Popov 1 , E. Martinsdottir 2 , M. N. Haque 1 & E. Reynisson 2 1 Wessex Institute of Technology, Southampton, UK 2 Matís ohf., Icelandic Food and Biotech R&D, Reykjavík, Iceland Abstract The quality and safety of food products is influenced by the presence of spoilage and pathogenic microorganisms. The presence and concentration of spoilage microorganisms is the main factor which determines the shelf life of a food product. The presence of pathogens could cause serious health problems. In order to simulate and predict the shelf life of Icelandic cod loins stored in styrofoam boxes in an actual supply chain from Iceland to France, a mathematical model for microbial growth is developed. Three specific spoilage organisms (SSO) are considered: Pseudomonas spp. (Ps), Photobacterium phosphoreum (Pp) and H 2 S-producing bacteria (H 2 S). The Baranyi and Roberts model is used for prediction of microbial growth in cod loins. The temperature dependence of the growth rate is taken into account through the square root model as a secondary model. Previous laboratory data are used for developing the primary and secondary models. The laboratory data from field trials, collected under dynamic temperature conditions, are used for calibration of the lag phase for each spoilage bacterium. Temperature recordings along with microbial and sensory analyses from the different cod groups are collected to test and validate the shelf life prediction (SLP) models. Finally, the model predictions are compared with shelf life data obtained by sensory evaluation of cooked products performed during the trials. Keywords: Icelandic cod, microbial growth models, shelf life prediction, field trials. Food and Environment 69 www.witpress.com, ISSN 1743-3541 (on-line) WIT Transactions on Ecology and the Environment, Vol 152, © 2011 WIT Press doi:10.2495/FENV1100 1 7
Transcript of Microbial growth models for shelf life prediction in an ... · Microbial growth models for shelf...
Microbial growth models for shelf life prediction in an Icelandic cod supply chain
R. Gospavic1, H. L. Lauzon2, V. Popov1, E. Martinsdottir2, M. N. Haque1 & E. Reynisson2 1Wessex Institute of Technology, Southampton, UK 2Matís ohf., Icelandic Food and Biotech R&D, Reykjavík, Iceland
Abstract
The quality and safety of food products is influenced by the presence of spoilage and pathogenic microorganisms. The presence and concentration of spoilage microorganisms is the main factor which determines the shelf life of a food product. The presence of pathogens could cause serious health problems. In order to simulate and predict the shelf life of Icelandic cod loins stored in styrofoam boxes in an actual supply chain from Iceland to France, a mathematical model for microbial growth is developed. Three specific spoilage organisms (SSO) are considered: Pseudomonas spp. (Ps), Photobacterium phosphoreum (Pp) and H2S-producing bacteria (H2S). The Baranyi and Roberts model is used for prediction of microbial growth in cod loins. The temperature dependence of the growth rate is taken into account through the square root model as a secondary model. Previous laboratory data are used for developing the primary and secondary models. The laboratory data from field trials, collected under dynamic temperature conditions, are used for calibration of the lag phase for each spoilage bacterium. Temperature recordings along with microbial and sensory analyses from the different cod groups are collected to test and validate the shelf life prediction (SLP) models. Finally, the model predictions are compared with shelf life data obtained by sensory evaluation of cooked products performed during the trials. Keywords: Icelandic cod, microbial growth models, shelf life prediction, field trials.
Food and Environment 69
www.witpress.com, ISSN 1743-3541 (on-line) WIT Transactions on Ecology and the Environment, Vol 152, © 2011 WIT Press
doi:10.2495/FENV1100 17
1 Introduction
The shelf life is one of the most important parameters which determine the quality and in some cases safety of the food product. The shelf life is mainly influenced by the concentration of the main spoilage microorganisms [1]. The mathematical models for microbial growth are the necessary components for the efficient prediction and estimation of the shelf life in real supply chains [2–4]. Considerable efforts have been invested in development of the mathematical models for description of the microbial growth in food products [5, 6]. There are two basic types of mathematical models for microbial growth: deterministic and stochastic [7, 8]. In the case of deterministic models the outcome is one single growth curve or one single quantity for microbial concentration at any instant of time. On the other hand the stochastic models include the probability component in the analysis and the outcome is the probability or probability density function (PDF) to have certain microbial concentration at any instant of time [8]. In this study the Baranyi and Roberts model is used as primary model [5, 9, 10]. The Baranyi and Roberts model for microbial growth is a deterministic model which includes the four independent parameters: initial and maximal concentration of the microorganisms, the lag phase and the growth rate. As the lag phase is dependent on the physiological state of the microbial cells in the initial moment, the model has to be calibrated for every separate trial or shipment. The growth of the specific microbial population is affected by the environmental conditions and type of the food. The most important environmental factor effecting the microbial growth is temperature [11]. As the temperature conditions along the real supply chain are variable, for accurate prediction of the shelf life it is essential to use the models which are able to take into account the temperature variations [6, 9, 12]. To obtain the parameters in the primary model the microbial growth data under constant environmental conditions are generated. This procedure is repeated for different temperatures. The laboratory data obtained in such way are fitted on the primary model and the independent parameters from primary model for different temperatures are obtained. To obtain the temperature dependence of the growth rate the data for static temperatures are fitted on the square root model. Using mathematical models for microbial growth to predict shelf life is of practical interest as the temperature profile in the supply chain is not constant and unexpected temperature abuse could occur. The required temperature profile for evaluation of the shelf life is obtained by combining the actual supply chain temperatures in real time up to current time instant and temperature profile derived from previous temperature monitoring in the supply chain from the current time instant to end of the supply chain [13]. In this way the control of the quality and safety of the food products could be considerably improved.
70 Food and Environment
www.witpress.com, ISSN 1743-3541 (on-line) WIT Transactions on Ecology and the Environment, Vol 152, © 2011 WIT Press
2 Mathematical model for microbial growth
2.1 Primary model
In this work the Baranyi and Roberts model is used as primary model for prediction of the microbial growth [5, 10]. This model is general and could be used for any type of food or microorganism. The model parameters are obtained using the laboratory results for microbial concentration under different static temperatures for specific type of food and microorganisms. This type of primary growth models is the simplest one and it is an unstructured, non-segregated model. This means that spatial structure of the food or biomass is not considered i.e. medium in which the microorganism grows is homogeneous, the cell concentration is the only dependent variable and the environmental parameters are not included directly in the model. The simplest growth models of population theory are the first order ordinary differential equations where the growth rate does not depend on time explicitly (autonomous models) [10]. In all logistic models, the main assumption is that the concentration of the microbial population is limited by the maximum density of the population. It could be said that all characteristic bacterial curves have three characteristic parts: (i) lag time, (ii) growth phase, (iii) saturation phase when maximum population density is reached. The actual growth could be modelled using the Baranyi and Roberts model by using the next set of differential equations with appropriate initial conditions [5, 10]:
00; qqtq
dt
tdq (1)
,0;1
;1 0max
0 NNtq
tqtN
N
Nt
dt
tdN
(2)
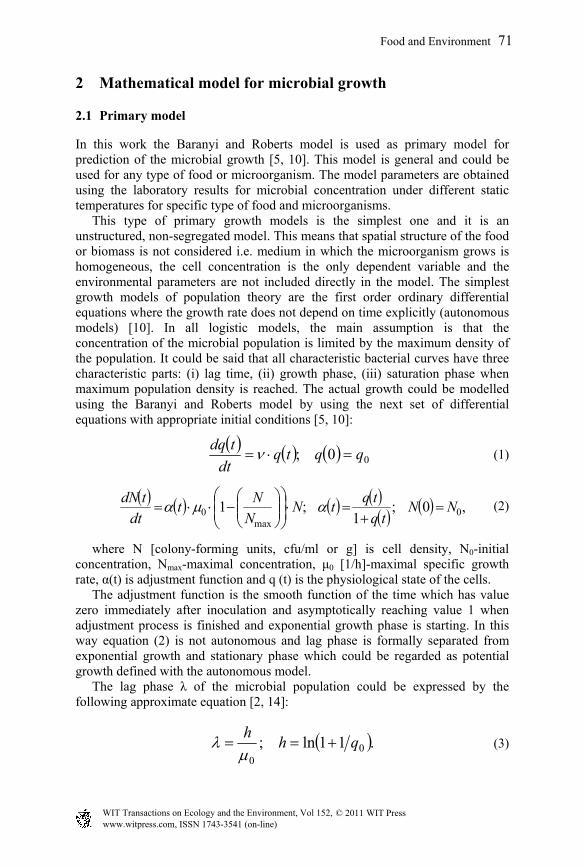
where N [colony-forming units, cfu/ml or g] is cell density, N0-initial concentration, Nmax-maximal concentration, μ0 [1/h]-maximal specific growth rate, α(t) is adjustment function and q (t) is the physiological state of the cells. The adjustment function is the smooth function of the time which has value zero immediately after inoculation and asymptotically reaching value 1 when adjustment process is finished and exponential growth phase is starting. In this way equation (2) is not autonomous and lag phase is formally separated from exponential growth and stationary phase which could be regarded as potential growth defined with the autonomous model. The lag phase λ of the microbial population could be expressed by the following approximate equation [2, 14]:
.11ln; 00
qhh
(3)
Food and Environment 71
www.witpress.com, ISSN 1743-3541 (on-line) WIT Transactions on Ecology and the Environment, Vol 152, © 2011 WIT Press
According to relation (3) the lag phase of the microbial population depends only on the initial physiological state of the cells q0 and it is independent of the temperature variation in the supply chain.
2.2 Secondary model
We will consider that only one model parameter, maximal specific growth rate μ0, is a function of the temperature. Initial and maximal population density, N0 and Nmax respectively, were considered as constant during the simulation in dynamic conditions. The initial physiological state of the cells q0 should be considered as initial value which is dependent only on the initial state of the cell and initial environmental conditions, and it will be kept constant during the simulation in dynamic conditions [15]. If the temperature is the only dynamic environmental variable while the other environmental variables could be considered as constant parameters, the maximal specific growth rate could be modelled by the square root model according to the following equation [11, 16]:
,min0 TTb (4)
where Tmin is minimal temperature for growth and b is empirical model parameter. These models do not take into account the thermal deactivation [11, 16]. The developed secondary model for Icelandic cod loins stored aerobically is valid in the temperature range from -1.3°C to 11.1°C.
2.3 Experimental design
Whole and gutted Atlantic cod (Gadus morhua L) was processed into loins three days post catch and packed with a cooling mat into expanded polystyrene (EPS) boxes, each weighing 5 kg. This study included 5 test groups, 3 bulk groups constituted of EPS boxes assembled into 3 pallets (SB, TB, AB) and 2 retail groups (ST, TT) repackaged at Matís in 800-g tray portions in a plastic vacuum bag (20PA/50PE; Samhentir, Iceland) under 40% vacuum on day 0 (processing day) using freshly produced loins (ST) and on day 6 (TT) using loins from TB boxes. Pallet 1 (SB) was stored under superchilled conditions at Matís from day 0. Pallet 2 was shipped in a superchilled container to the Westman Isles, simulating sea freight and distribution to the retailer in France, but returning to Matís on day 6 for chilled storage (TB). Pallet 3 was also shipped to the Westman Isles but removed from the superchilled container on day 5, abused for 13 hours (mean environmental temperature around 13°C) before being shipped to Matís on day 6 (AB). The sampling and labeling of the cod loins are defined in Table 1.
2.4 Microbial and sensory analysis during the field trials
Microbiological and sensory analyses were performed on days 0-6-8-10-13 as described by Olafsdottir et al. [4]. Briefly, microbiological media were surface-
72 Food and Environment
www.witpress.com, ISSN 1743-3541 (on-line) WIT Transactions on Ecology and the Environment, Vol 152, © 2011 WIT Press
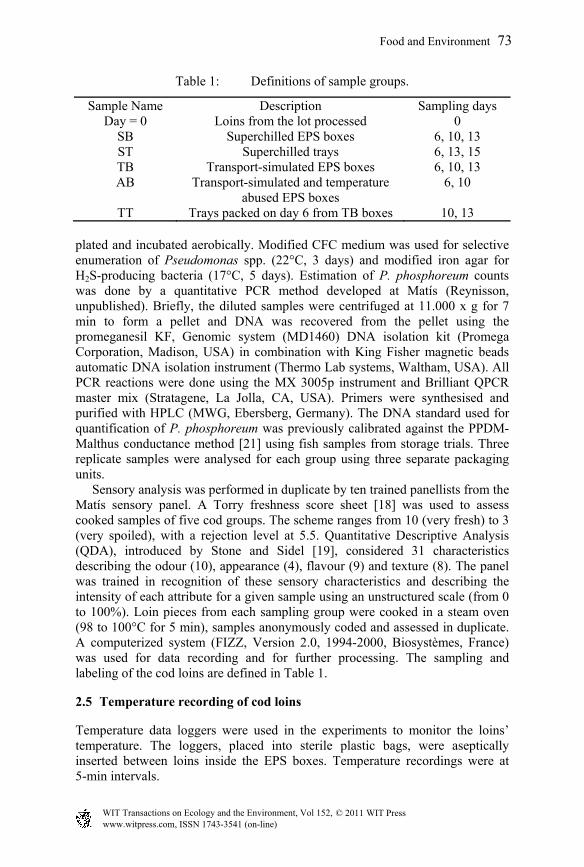
Table 1: Definitions of sample groups.
Sample Name Description Sampling days Day = 0 Loins from the lot processed 0
SB Superchilled EPS boxes 6, 10, 13 ST Superchilled trays 6, 13, 15 TB Transport-simulated EPS boxes 6, 10, 13 AB Transport-simulated and temperature
abused EPS boxes 6, 10
TT Trays packed on day 6 from TB boxes 10, 13 plated and incubated aerobically. Modified CFC medium was used for selective enumeration of Pseudomonas spp. (22°C, 3 days) and modified iron agar for H2S-producing bacteria (17°C, 5 days). Estimation of P. phosphoreum counts was done by a quantitative PCR method developed at Matís (Reynisson, unpublished). Briefly, the diluted samples were centrifuged at 11.000 x g for 7 min to form a pellet and DNA was recovered from the pellet using the promeganesil KF, Genomic system (MD1460) DNA isolation kit (Promega Corporation, Madison, USA) in combination with King Fisher magnetic beads automatic DNA isolation instrument (Thermo Lab systems, Waltham, USA). All PCR reactions were done using the MX 3005p instrument and Brilliant QPCR master mix (Stratagene, La Jolla, CA, USA). Primers were synthesised and purified with HPLC (MWG, Ebersberg, Germany). The DNA standard used for quantification of P. phosphoreum was previously calibrated against the PPDM-Malthus conductance method [21] using fish samples from storage trials. Three replicate samples were analysed for each group using three separate packaging units. Sensory analysis was performed in duplicate by ten trained panellists from the Matís sensory panel. A Torry freshness score sheet [18] was used to assess cooked samples of five cod groups. The scheme ranges from 10 (very fresh) to 3 (very spoiled), with a rejection level at 5.5. Quantitative Descriptive Analysis (QDA), introduced by Stone and Sidel [19], considered 31 characteristics describing the odour (10), appearance (4), flavour (9) and texture (8). The panel was trained in recognition of these sensory characteristics and describing the intensity of each attribute for a given sample using an unstructured scale (from 0 to 100%). Loin pieces from each sampling group were cooked in a steam oven (98 to 100°C for 5 min), samples anonymously coded and assessed in duplicate. A computerized system (FIZZ, Version 2.0, 1994-2000, Biosystèmes, France) was used for data recording and for further processing. The sampling and labeling of the cod loins are defined in Table 1.
2.5 Temperature recording of cod loins
Temperature data loggers were used in the experiments to monitor the loins’ temperature. The loggers, placed into sterile plastic bags, were aseptically inserted between loins inside the EPS boxes. Temperature recordings were at 5-min intervals.
Food and Environment 73
www.witpress.com, ISSN 1743-3541 (on-line) WIT Transactions on Ecology and the Environment, Vol 152, © 2011 WIT Press
3 Results
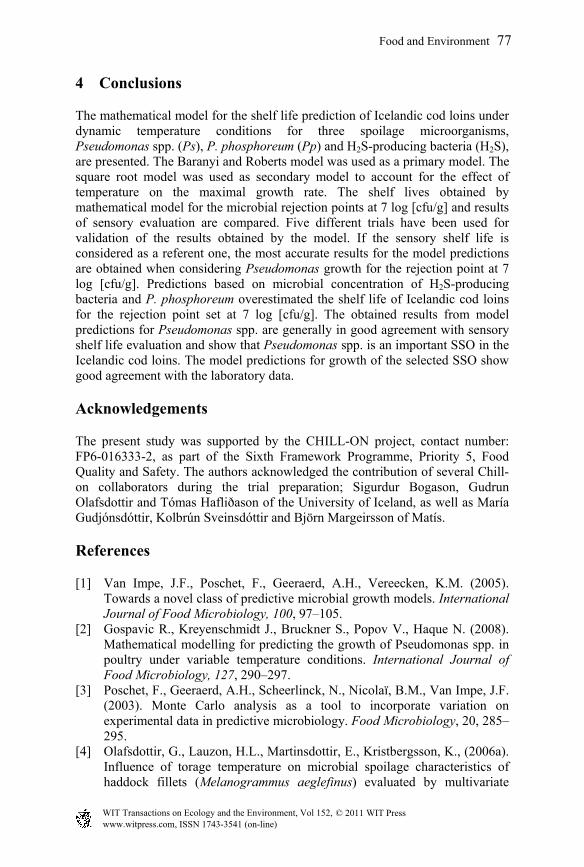
To validate the developed mathematical model for shelf life prediction of Icelandic cod loins in the Iceland–France supply chain, field trials were performed in Iceland during November 2009. The aim of the experimental design of the field trials and the corresponding shelf life studies was to include scenarios to test and demonstrate the functionality of the developed mathematical models for prediction of the shelf life. Temperature fluctuations were introduced according to the actual scenario in the cod supply chain via sea freight. Sensory evaluation of cooked products was used to determine the shelf life and was compared with the results obtained by the model. Three spoilage microorganisms of importance in the Icelandic cod products were considered: Pseudomonas spp. (Ps), P. phosphoreum (Pp) and H2S-producing bacteria (H2S), relating mainly to Shewanella putrefaciens [17]. Previous laboratory results for these three specific spoilage organisms (SSO) are used in developing the primary and secondary models for microbial growth [17]. Five different trials with laboratory data for three SSO were used for the validation of the model. The microbial rejection point for shelf life used was 7 log [cfu/g], which is based on several shelf life trials conducted at Matís in previous years [4, 20]. The comparisons between sensory shelf life and predicted shelf life based on the three SSO (Ps, Pp and H2S) for the five different trials are shown in Table 2. It is generally observed that the shelf life prediction based on Pseudomonas growth and the microbial limit of 7 log [cfu/g] for product rejection agrees well with the estimated sensory shelf life. The sample product labelled ST has higher discrepancy between the prediction and the sensory shelf life due to the fact that the temperature has fallen outside the valid range of the model. The valid range for the temperature in cod shelf life model is from -1.3°C to 11.1°C, due to the data sets available during model preparation. Obviously, the ST sample is outside the range. It is also notable that in the SB sample it was predicted slightly higher shelf life as the mean product core temperature was very near to the end of the valid temperature range. In fact, undesirable low temperature fluctuations occurred in this storage chamber, as demonstrated by the tray products (ST), resulting in lower temperature of the product in box corners and possibly occurrence of non-microbial damages. As suggested by Olafsdottir et al. [20], superchilling may enhance enzymatic degradation in cod loins, probably explaining the more rapid quality deterioration detected by sensory analysis than that predicted by SSO. In Figures 1 to 3, the laboratory results, model prediction for microbial growth with upper and lower limits and temperature profiles for trial AB-P3 for the case of Pseudomonas spp., H2S-producing bacteria and P. phosphoreum are shown, respectively. The observed growth for the SSO in abused cod products follows well their predicted growth curve.
74 Food and Environment
www.witpress.com, ISSN 1743-3541 (on-line) WIT Transactions on Ecology and the Environment, Vol 152, © 2011 WIT Press
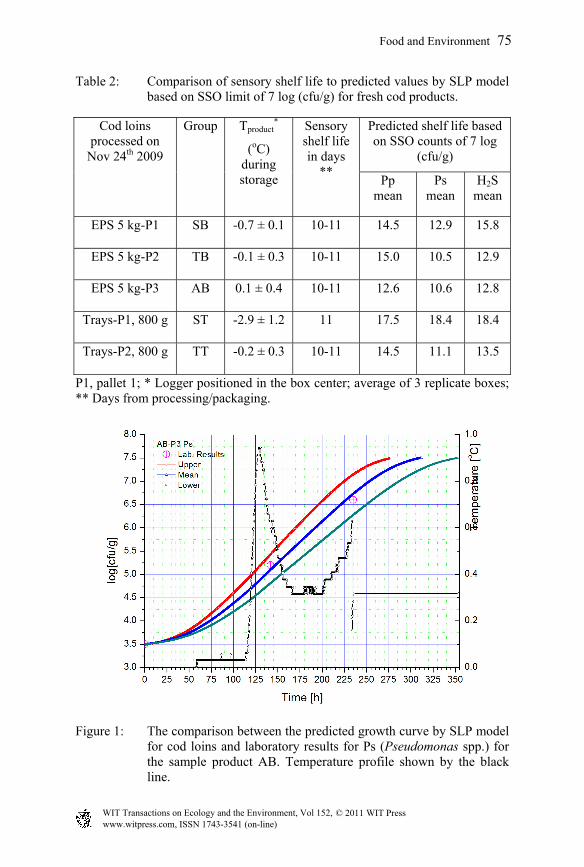
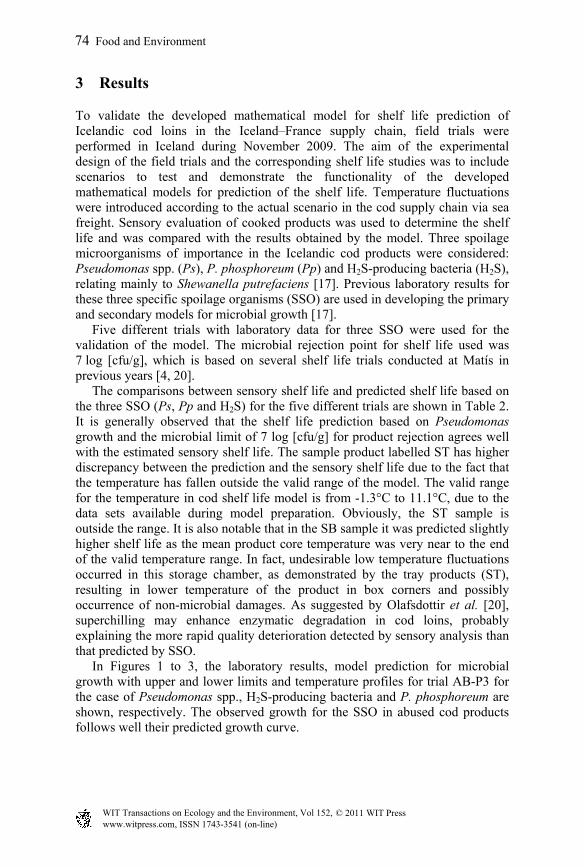
Table 2: Comparison of sensory shelf life to predicted values by SLP model based on SSO limit of 7 log (cfu/g) for fresh cod products.
Cod loins processed on
Nov 24th 2009
Group Tproduct*
(oC) during storage
Sensory shelf life in days
**
Predicted shelf life based on SSO counts of 7 log
(cfu/g)
Pp mean
Ps mean
H2S mean
EPS 5 kg-P1 SB -0.7 ± 0.1 10-11 14.5 12.9 15.8
EPS 5 kg-P2 TB -0.1 ± 0.3 10-11 15.0 10.5 12.9
EPS 5 kg-P3 AB 0.1 ± 0.4 10-11 12.6 10.6 12.8
Trays-P1, 800 g ST -2.9 ± 1.2 11 17.5 18.4 18.4
Trays-P2, 800 g TT -0.2 ± 0.3 10-11 14.5 11.1 13.5
P1, pallet 1; * Logger positioned in the box center; average of 3 replicate boxes; ** Days from processing/packaging.
Figure 1: The comparison between the predicted growth curve by SLP model for cod loins and laboratory results for Ps (Pseudomonas spp.) for the sample product AB. Temperature profile shown by the black line.
Food and Environment 75
www.witpress.com, ISSN 1743-3541 (on-line) WIT Transactions on Ecology and the Environment, Vol 152, © 2011 WIT Press
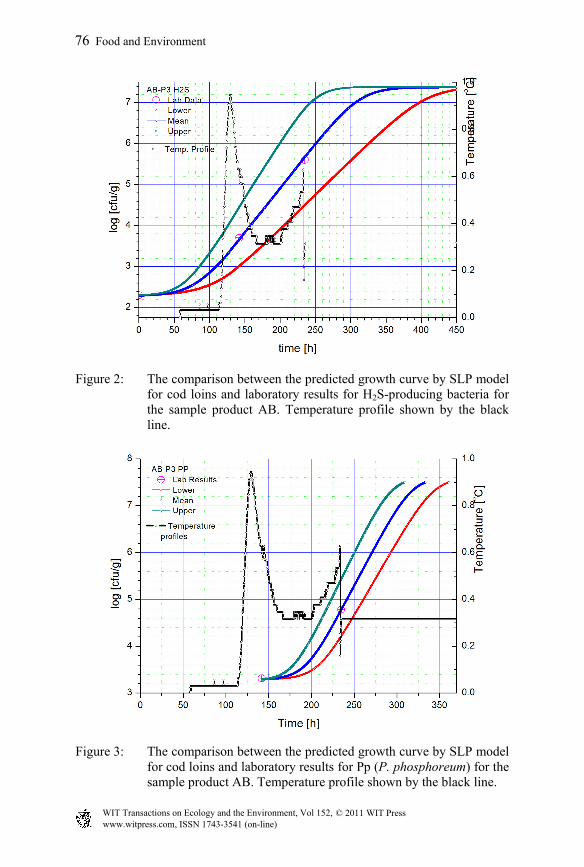
Figure 2: The comparison between the predicted growth curve by SLP model for cod loins and laboratory results for H2S-producing bacteria for the sample product AB. Temperature profile shown by the black line.
Figure 3: The comparison between the predicted growth curve by SLP model for cod loins and laboratory results for Pp (P. phosphoreum) for the sample product AB. Temperature profile shown by the black line.
76 Food and Environment
www.witpress.com, ISSN 1743-3541 (on-line) WIT Transactions on Ecology and the Environment, Vol 152, © 2011 WIT Press
4 Conclusions
The mathematical model for the shelf life prediction of Icelandic cod loins under dynamic temperature conditions for three spoilage microorganisms, Pseudomonas spp. (Ps), P. phosphoreum (Pp) and H2S-producing bacteria (H2S), are presented. The Baranyi and Roberts model was used as a primary model. The square root model was used as secondary model to account for the effect of temperature on the maximal growth rate. The shelf lives obtained by mathematical model for the microbial rejection points at 7 log [cfu/g] and results of sensory evaluation are compared. Five different trials have been used for validation of the results obtained by the model. If the sensory shelf life is considered as a referent one, the most accurate results for the model predictions are obtained when considering Pseudomonas growth for the rejection point at 7 log [cfu/g]. Predictions based on microbial concentration of H2S-producing bacteria and P. phosphoreum overestimated the shelf life of Icelandic cod loins for the rejection point set at 7 log [cfu/g]. The obtained results from model predictions for Pseudomonas spp. are generally in good agreement with sensory shelf life evaluation and show that Pseudomonas spp. is an important SSO in the Icelandic cod loins. The model predictions for growth of the selected SSO show good agreement with the laboratory data.
Acknowledgements
The present study was supported by the CHILL-ON project, contact number: FP6-016333-2, as part of the Sixth Framework Programme, Priority 5, Food Quality and Safety. The authors acknowledged the contribution of several Chill-on collaborators during the trial preparation; Sigurdur Bogason, Gudrun Olafsdottir and Tómas Hafliðason of the University of Iceland, as well as María Gudjónsdóttir, Kolbrún Sveinsdóttir and Björn Margeirsson of Matís.
References
[1] Van Impe, J.F., Poschet, F., Geeraerd, A.H., Vereecken, K.M. (2005). Towards a novel class of predictive microbial growth models. International Journal of Food Microbiology, 100, 97–105.
[2] Gospavic R., Kreyenschmidt J., Bruckner S., Popov V., Haque N. (2008). Mathematical modelling for predicting the growth of Pseudomonas spp. in poultry under variable temperature conditions. International Journal of Food Microbiology, 127, 290–297.
[3] Poschet, F., Geeraerd, A.H., Scheerlinck, N., Nicolaï, B.M., Van Impe, J.F. (2003). Monte Carlo analysis as a tool to incorporate variation on experimental data in predictive microbiology. Food Microbiology, 20, 285–295.
[4] Olafsdottir, G., Lauzon, H.L., Martinsdottir, E., Kristbergsson, K., (2006a). Influence of torage temperature on microbial spoilage characteristics of haddock fillets (Melanogrammus aeglefinus) evaluated by multivariate
Food and Environment 77
www.witpress.com, ISSN 1743-3541 (on-line) WIT Transactions on Ecology and the Environment, Vol 152, © 2011 WIT Press
quality prediction. International Journal of Food Microbiology, 111, 112–125.
[5] Baranyi J., Roberts T. A. (1994). A dynamic approach to predicting bacterial growth in food – Review Paper. International Journal of Food Microbiology, 23, 277-294.
[6] Van Impe, J.F., Nicolaï, B.M., Martens, T., De Baerdemaeker, J., Vandewalle, J. (1992). Dynamic mathematical model to predict microbial growth and inactivation during food processing. Applied and Environmental Microbiology, 58, 2901–2909.
[7] Progress Report on Risk Assessment for microbial contamination, Deliverable D1.15, CHILL-ON project.
[8] Soboleva, T.K., Pleasants, A.B., le Roux, G. (2000). Predictive microbiology and food safety. International Journal of Food Microbiology, 57, 183–192
[9] Baranyi, J., Roberts, T.A. (1995). Mathematics of predictive food microbiology. International Journal of Food Microbiology, 26, 199–218.
[10] Baranyi, J., Roberts, T.A., McClure, P. (1993). A non-autonomous differential equation to model bacterial growth. Food Microbiology, 10, 43–59.
[11] Ratkowsky, D.A., Olley, J., McMeekin, T.A. and Ball, A. (1982). Relationship between temperature and growth rate of bacterial cultures. Journal of Bacteriology, 149, 1-5.
[12] Kreyenschmidt, J. (2003). Modellierung des Frischeverlustes von Fleisch sowie des Entfärbeprozesses von Temperatur-Zeit Integratoren zur Festlegung von Anforderungsprofilen für die produktbegleitende Temperaturüberwachung, Diss. Universität Bonn, Agrimedia Verlag, Bergen Dumme.
[13] Zwietering, M.H., Wijtzes, T., De Wit, J. C., Van’t Riet, K. (1992). A decision support system for prediction of microbial spoilage in foods. Journal of Food Protection, 55, 973–979.
[14] Swinnen, I.A.M., Bernaerts, K., Dens, E.J.J., Geeraerd, A.H., Van Impe, J.F. (2004). Predictive modeling of the microbial lag phase: a review. International Journal of Food Microbiology, 94, 137–159.
[15] J. Baranyi, T.P. Robinson, A. Kaloti, B.M. Mackey. (1995). Predicting growth of Brochothrix thermosphacta at changing temperature. International Journal of Food Microbiology, 27, 61–75.
[16] D.A. Ratkowsky, R.K. Lowry, T.A. McMeekin, A.N. Stokes, R.E. Chandler. (1983). Model for Bacterial Culture Growth Rate Through the Entire Biokinetic Temperature Range. Journal of Bacteriology, 154 (3), 1222-1226
[17] D1.18 Final report on risk assessments for microbial contamination and QMRA software module. Chill-On report, Project no.: FP6-016333-2, 2009.
[18] Shewan, J.M., Macintosh, R.G., Tucker, C.G., Ehrenberg, A.S.C. (1953). The development of a numeric scoring system for the sensory assessment of
78 Food and Environment
www.witpress.com, ISSN 1743-3541 (on-line) WIT Transactions on Ecology and the Environment, Vol 152, © 2011 WIT Press
the spoilage of wet white fish stored in ice. Journal of the Science of Food and Agriculture, 4, 283–298.
[19] Stone H, Sidel J.L. (2004). Descriptive analysis. In Sensory Evaluation Practices, 3rd Ed. (H. Stone and J.L. Sidel, eds.), pp. 201–244, Elsevier, Amsterdam, the Netherlands.
[20] Olafsdottir G, Lauzon HL, Martinsdottir E, Kristbergsson K. (2006b). Evaluation of shelf-life of superchilled cod (Gadus morhua) fillets and influence of temperature fluctuations on microbial and chemical quality indicators. Journal of Food Science, 71 (2), S97–S109.
[21] Dalgaard, P., Mejlholm, O., Huss, H.H (1996). Conductance method for quantitative determination of Photobacterium phosphoreum in fish products. Journal of Applied Bacteriology, 81, 57–64.
Food and Environment 79
www.witpress.com, ISSN 1743-3541 (on-line) WIT Transactions on Ecology and the Environment, Vol 152, © 2011 WIT Press