Metabolic effects of insulin and glucagon - LF UP Olomouc · Metabolic effects of insulin and...
19
Metabolic effects of insulin and glucagon • structure, biosynthesis, secretion • insulin dependent/independent tissues, glucose entry into cells • receptors, signal pathways – biological response • enzymes regulated by insulin and glucagon • metabolism at well-fed state and starvation •Diabetes mellitus
Transcript of Metabolic effects of insulin and glucagon - LF UP Olomouc · Metabolic effects of insulin and...

Metabolic effects of insulin and glucagon
• structure, biosynthesis, secretion
• insulin dependent/independent tissues, glucose entry into cells
• receptors, signal pathways – biological response
• enzymes regulated by insulin and glucagon
• metabolism at well-fed state and starvation
•Diabetes mellitus
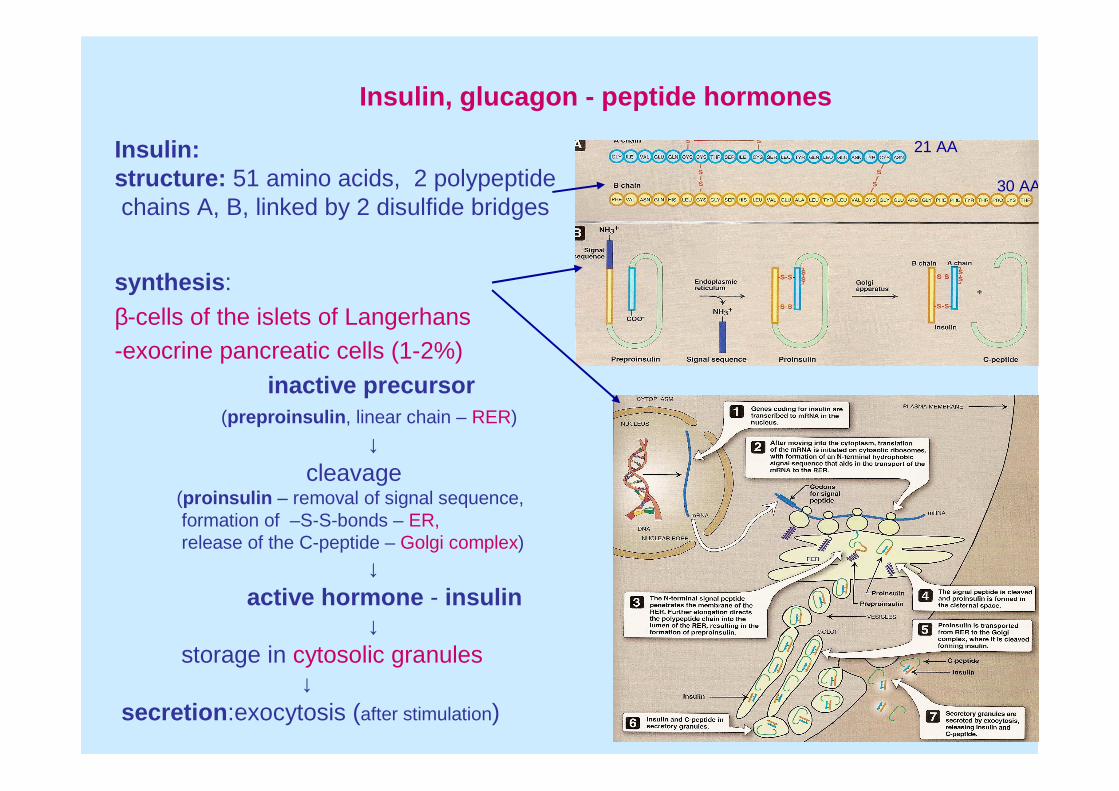
Insulin, glucagon - peptide hormones
synthesis :
β-cells of the islets of Langerhans-exocrine pancreatic cells (1-2%)
inactive precursor(preproinsulin, linear chain – RER)
↓cleavage
(proinsulin – removal of signal sequence, formation of –S-S-bonds – ER,release of the C-peptide – Golgi complex)
↓active hormone - insulin
↓storage in cytosolic granules
↓secretion :exocytosis (after stimulation)
Insulin:structure: 51 amino acids, 2 polypeptidechains A, B, linked by 2 disulfide bridges
21 AA
30 AA
insulin degradation :circulating insulin - biological half-time ~ 6 min
degradation in liver, kidney - insulinase
bound to receptors in tissues – half-time ~ 7- 12 hrsdegradation in lysosomes -after internalization of the hormone-receptor complex
Glucagon:structure: 29 amino acids – single linear chain
synthesis: α-cells of the islets of Langerhansinactive precursor
(proglucagon – large polypeptide)↓
cleavage (several steps)↓
active hormone - glucagon↓
storage in cytosolic granules↓
secretion : exocytosis (after stimulation)
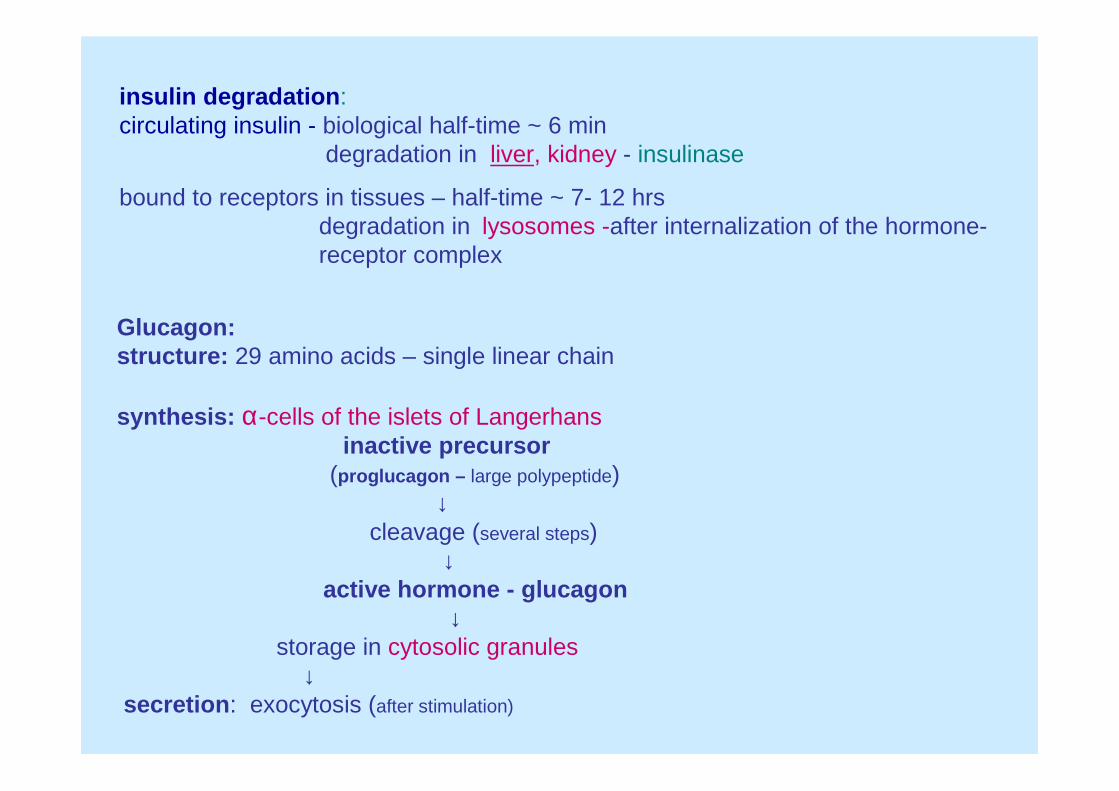
Regulation of insulin and glucagon release from pancreatic cells
+ low blood glucose level+ epinephrine (stress, trauma, severe excercise)
- regardless blood glucose level
+ high blood glucose level
α−cells β-cells
-
60 0 60 120 180 240
Changes in blood levelsafter ingestion
of carbohydrate-rich meal
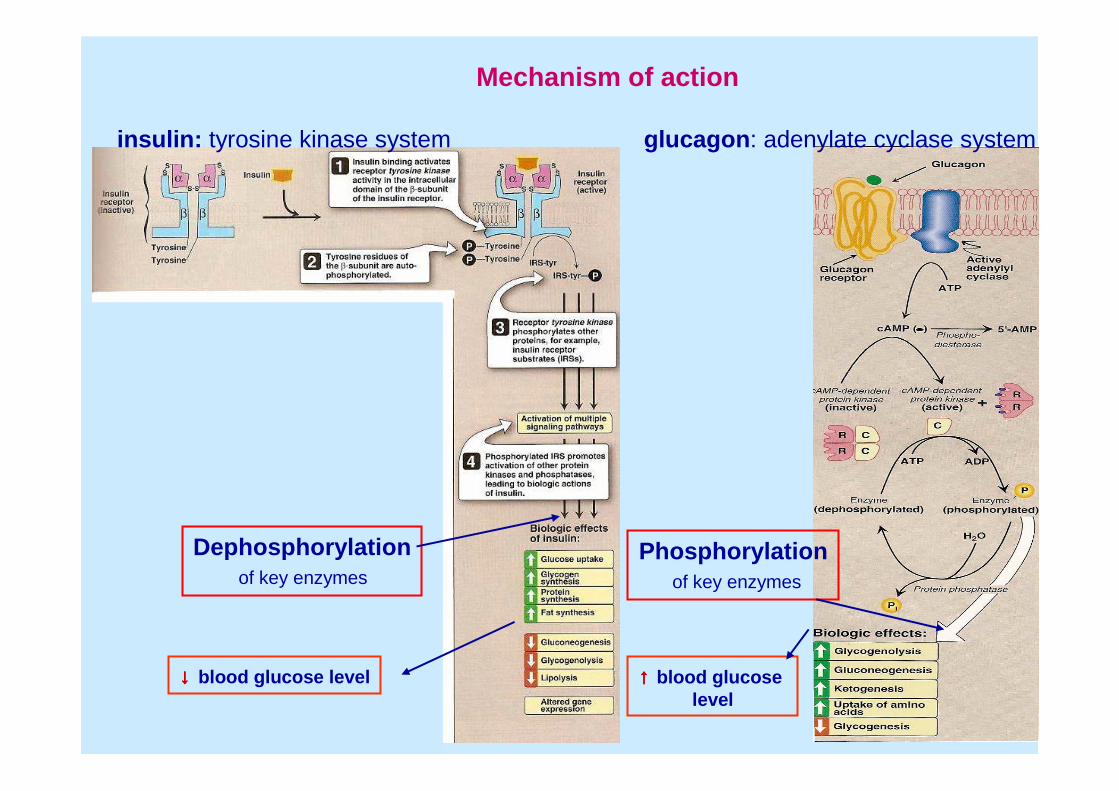
Mechanism of action
insulin: tyrosine kinase system glucagon: adenylate cyclase system
Dephosphorylationof key enzymes
Phosphorylationof key enzymes
↓↓↓↓ blood glucose level ↑↑↑↑ blood glucoselevel
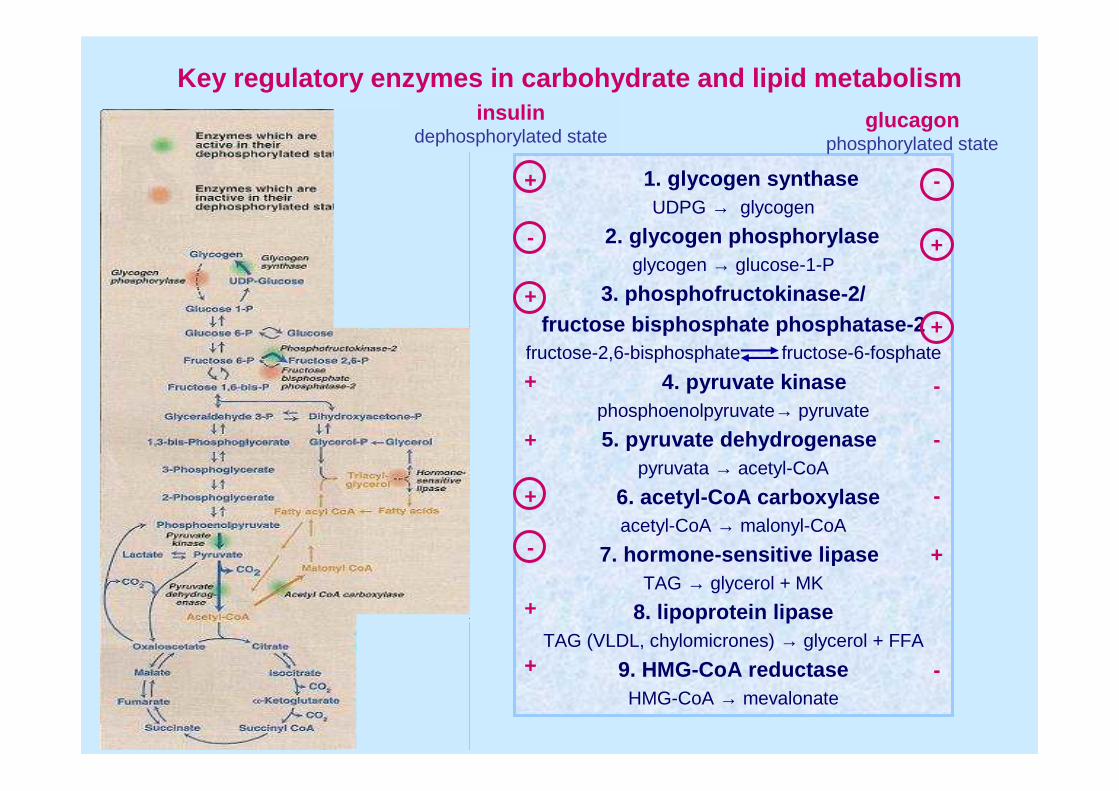
Key regulatory enzymes in carbohydrate and lipid metabolism
1. glycogen synthaseUDPG → glycogen
2. glycogen phosphorylaseglycogen → glucose-1-P
3. phosphofructokinase-2/fructose bisphosphate phosphatase-2
fructose-2,6-bisphosphate fructose-6-fosphate
4. pyruvate kinasephosphoenolpyruvate→ pyruvate
5. pyruvate dehydrogenasepyruvata → acetyl-CoA
6. acetyl-CoA carboxylaseacetyl-CoA → malonyl-CoA
7. hormone-sensitive lipase TAG → glycerol + MK
8. lipoprotein lipaseTAG (VLDL, chylomicrones) → glycerol + FFA
9. HMG-CoA reductaseHMG-CoA → mevalonate
insulindephosphorylated state
glucagonphosphorylated state
+
-
+
+
+
+
-
+
+
-
+
+
-
-
-
+
-
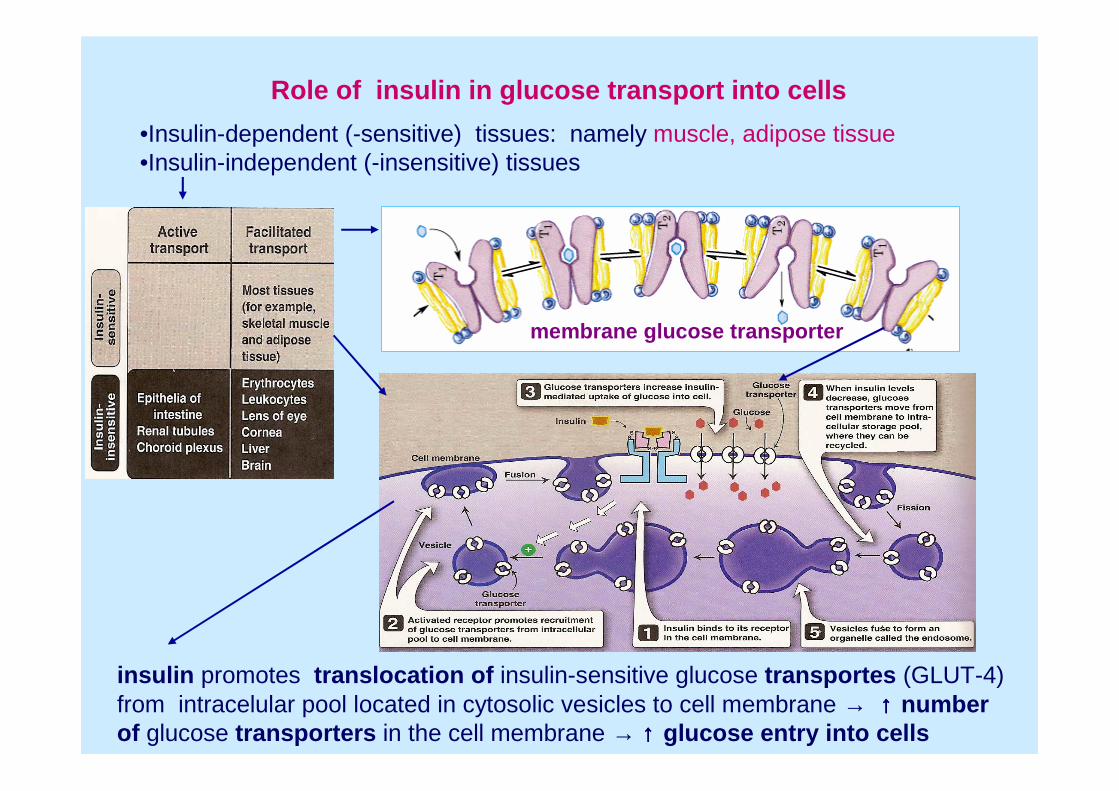
Role of insulin in glucose transport into cells
membrane glucose transporter
•Insulin-dependent (-sensitive) tissues: namely muscle, adipose tissue•Insulin-independent (-insensitive) tissues
insulin promotes translocation of insulin-sensitive glucose transportes (GLUT-4)from intracelular pool located in cytosolic vesicles to cell membrane → ↑↑↑↑ numberof glucose transporters in the cell membrane → ↑↑↑↑ glucose entry into cells
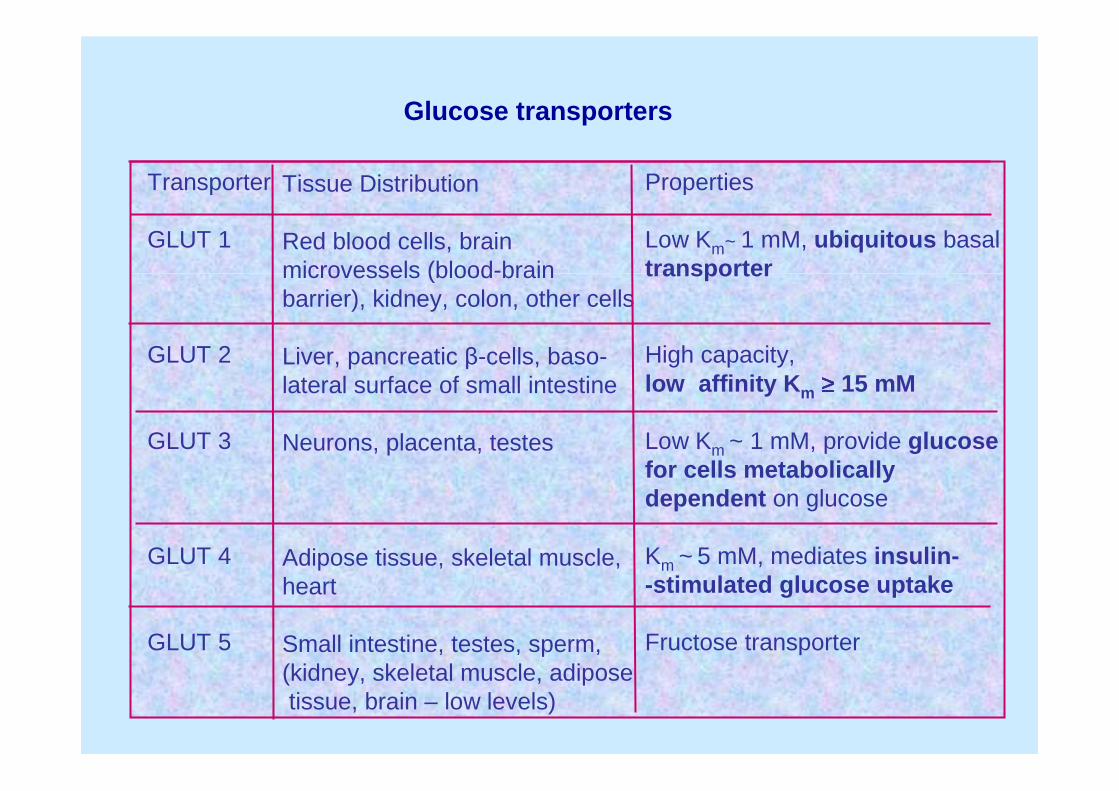
Glucose transporters
Transporter
GLUT 1
GLUT 2
GLUT 3
GLUT 4
GLUT 5
Tissue Distribution
Red blood cells, brainmicrovessels (blood-brainbarrier), kidney, colon, other cells
Liver, pancreatic β-cells, baso-lateral surface of small intestine
Neurons, placenta, testes
Adipose tissue, skeletal muscle, heart
Small intestine, testes, sperm,(kidney, skeletal muscle, adiposetissue, brain – low levels)
Properties
Low Km~ 1 mM, ubiquitous basaltransporter
High capacity, low affinity Km ≥≥≥≥ 15 mM
Low Km ~ 1 mM, provide glucosefor cells metabolicallydependent on glucose
Km ~ 5 mM, mediates insulin--stimulated glucose uptake
Fructose transporter
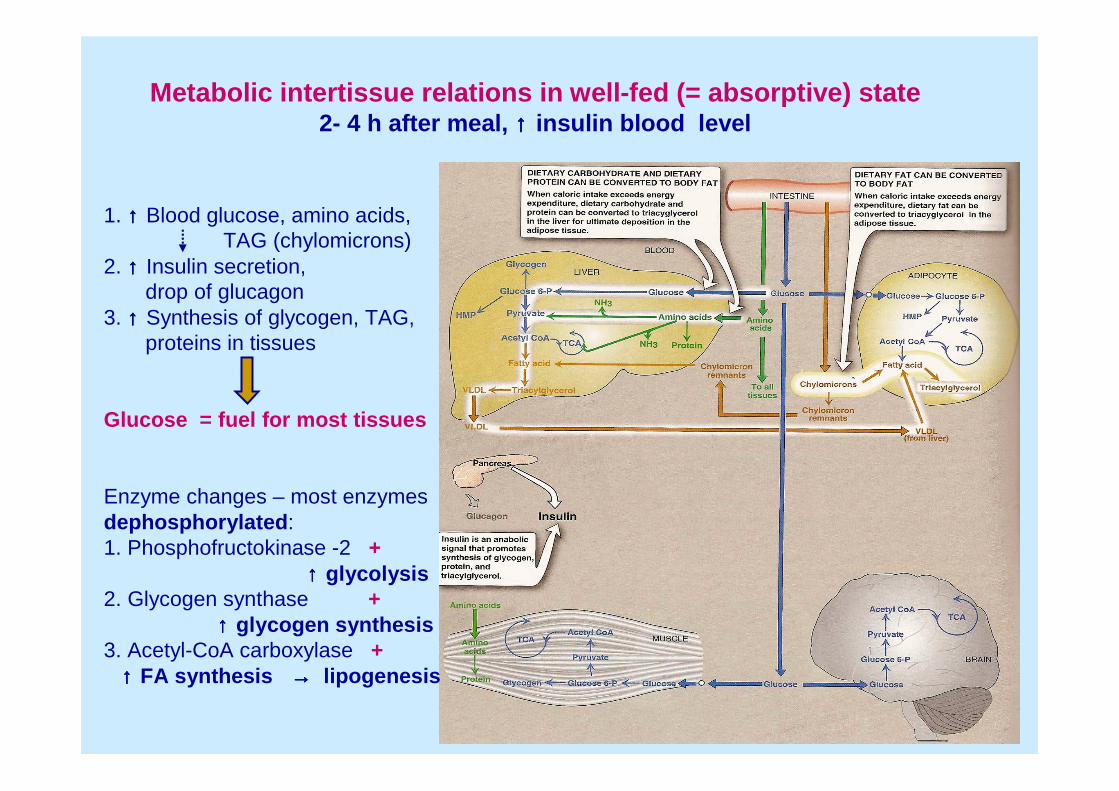
Metabolic intertissue relations in well-fed (= absorptive) state2- 4 h after meal, ↑↑↑↑ insulin blood level
1. ↑↑↑↑ Blood glucose, amino acids,TAG (chylomicrons)
2. ↑↑↑↑ Insulin secretion, drop of glucagon
3. ↑↑↑↑ Synthesis of glycogen, TAG,proteins in tissues
Glucose = fuel for most tissues
Enzyme changes – most enzymesdephosphorylated:1. Phosphofructokinase -2 +
↑↑↑↑ glycolysis2. Glycogen synthase +
↑↑↑↑ glycogen synthesis3. Acetyl-CoA carboxylase +
↑↑↑↑ FA synthesis →→→→ lipogenesis
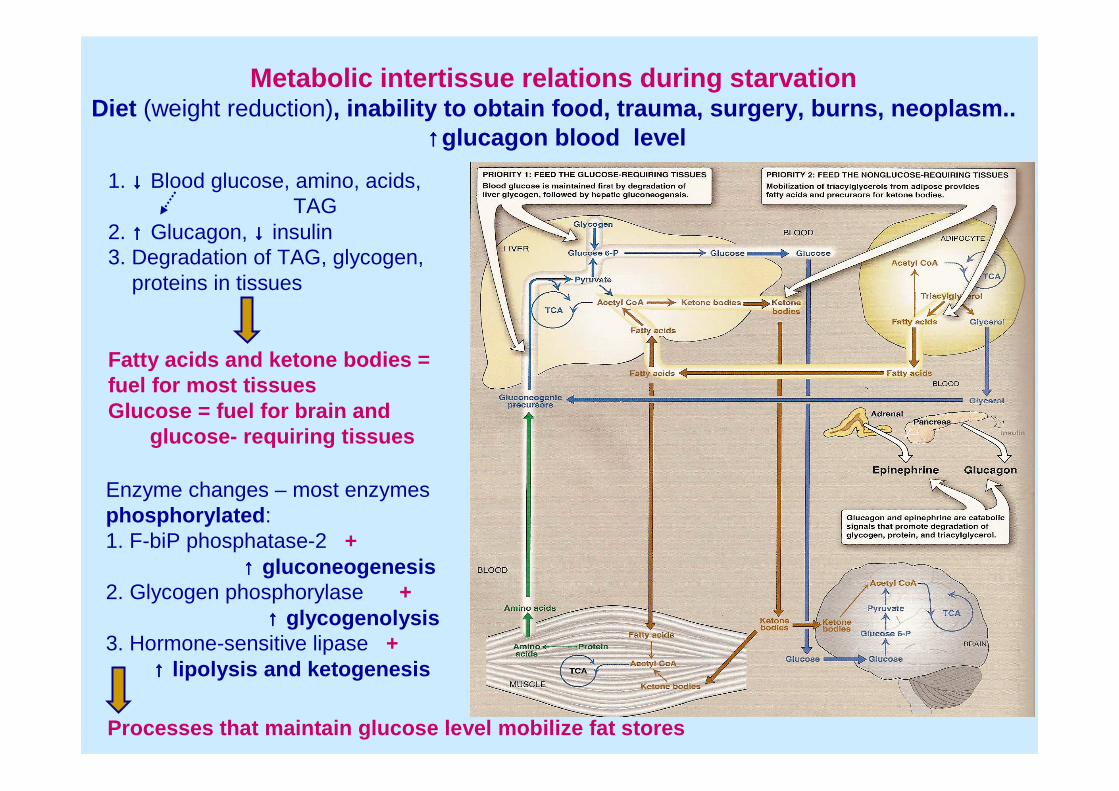
Metabolic intertissue relations during starvationDiet (weight reduction), inability to obtain food, trauma, surgery, burns, neoplasm..
↑↑↑↑glucagon blood level
1. ↓↓↓↓ Blood glucose, amino, acids, TAG
2. ↑↑↑↑ Glucagon, ↓↓↓↓ insulin3. Degradation of TAG, glycogen,
proteins in tissues
Fatty acids and ketone bodies =fuel for most tissuesGlucose = fuel for brain and
glucose- requiring tissues
Enzyme changes – most enzymesphosphorylated:1. F-biP phosphatase-2 +
↑↑↑↑ gluconeogenesis2. Glycogen phosphorylase +
↑↑↑↑ glycogenolysis3. Hormone-sensitive lipase +
↑↑↑↑ lipolysis and ketogenesis
Processes that maintain glucose level mobilize fat stores
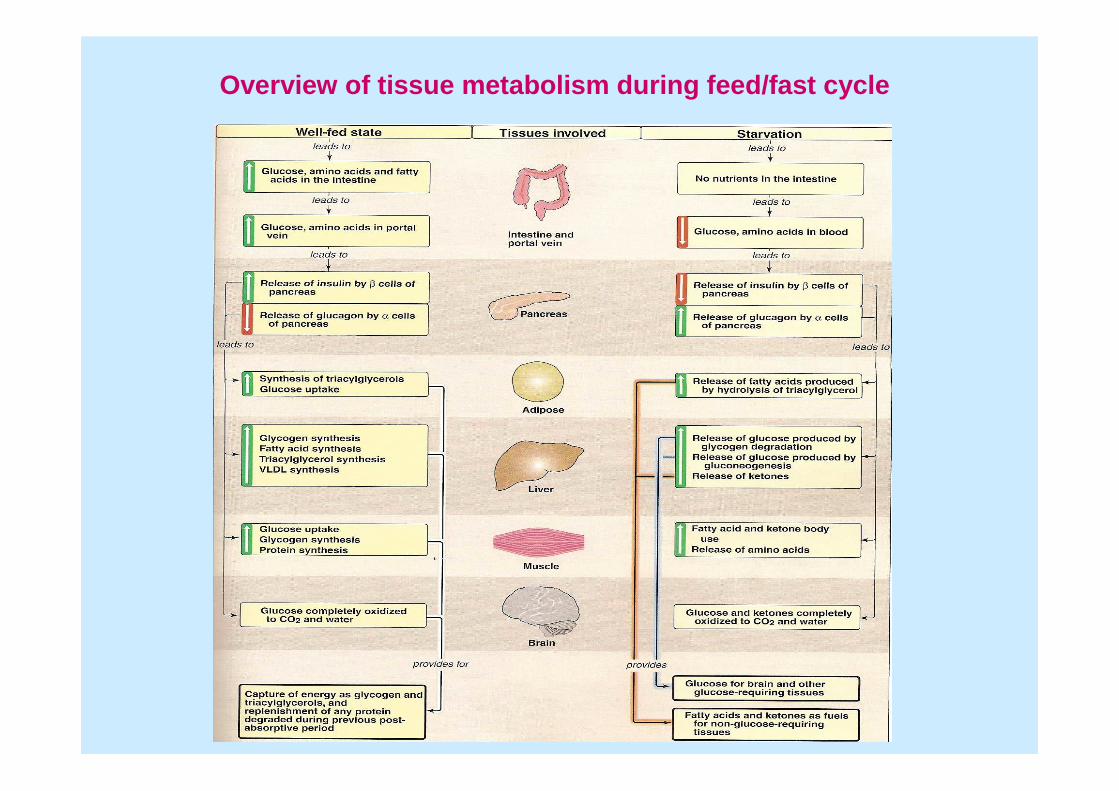
Overview of tissue metabolism during feed/fast cycle
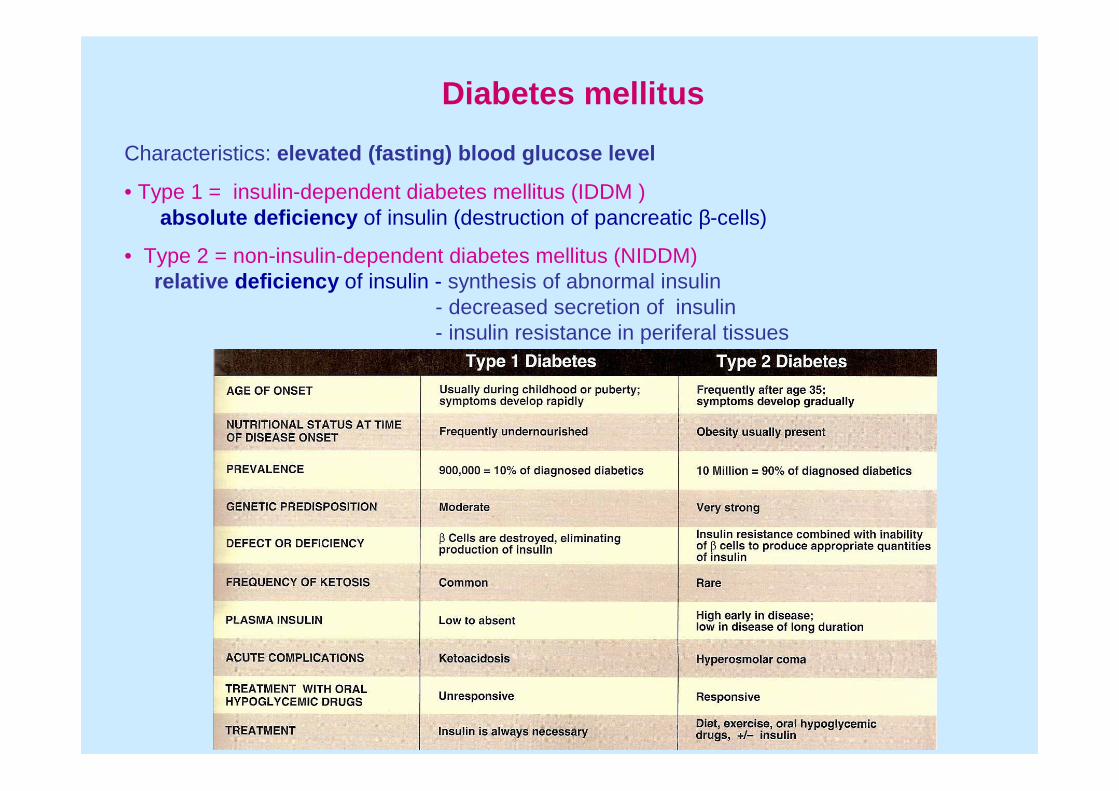
Diabetes mellitus
Characteristics: elevated (fasting) blood glucose level
• Type 1 = insulin-dependent diabetes mellitus (IDDM )absolute deficiency of insulin (destruction of pancreatic β-cells)
• Type 2 = non-insulin-dependent diabetes mellitus (NIDDM)relative deficiency of insulin - synthesis of abnormal insulin
- decreased secretion of insulin- insulin resistance in periferal tissues
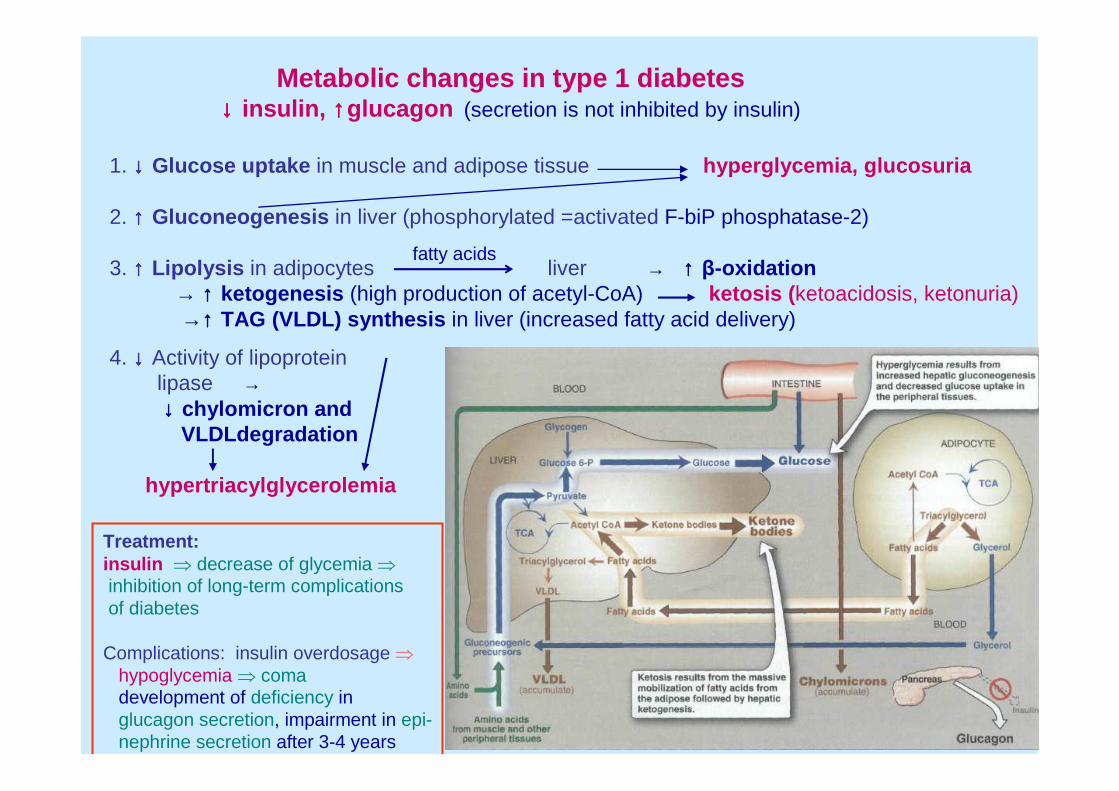
1. ↓↓↓↓ Glucose uptake in muscle and adipose tissue hyperglycemia, glucosuria
2. ↑↑↑↑ Gluconeogenesis in liver (phosphorylated =activated F-biP phosphatase-2)
3. ↑↑↑↑ Lipolysis in adipocytes liver → ↑↑↑↑ β-oxidation→ ↑↑↑↑ ketogenesis (high production of acetyl-CoA) ketosis (ketoacidosis, ketonuria)→↑↑↑↑ TAG (VLDL) synthesis in liver (increased fatty acid delivery)
4. ↓↓↓↓ Activity of lipoproteinlipase →↓↓↓↓ chylomicron and
VLDLdegradation
hypertriacylglycerolemia
fatty acids
Metabolic changes in type 1 diabetes↓↓↓↓ insulin, ↑↑↑↑glucagon (secretion is not inhibited by insulin)
Treatment:insulin ⇒ decrease of glycemia ⇒
inhibition of long-term complicationsof diabetes
Complications: insulin overdosage ⇒
hypoglycemia ⇒ comadevelopment of deficiency in glucagon secretion, impairment in epi-nephrine secretion after 3-4 years
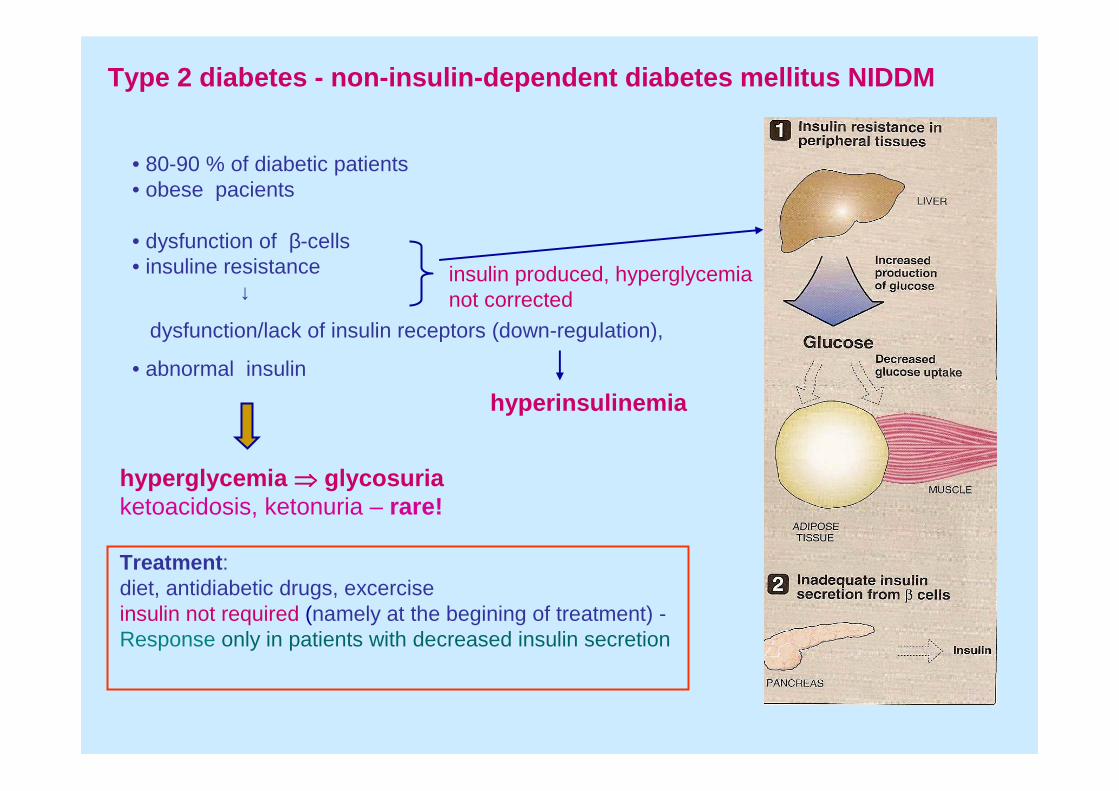
• 80-90 % of diabetic patients• obese pacients
• dysfunction of β-cells• insuline resistance
↓
dysfunction/lack of insulin receptors (down-regulation),
• abnormal insulin
insulin produced, hyperglycemianot corrected
Type 2 diabetes - non-insulin-dependent diabetes mellitus NIDDM
hyperglycemia ⇒⇒⇒⇒ glycosuriaketoacidosis, ketonuria – rare!
Treatment: diet, antidiabetic drugs, excerciseinsulin not required (namely at the begining of treatment) -Response only in patients with decreased insulin secretion
hyperinsulinemia
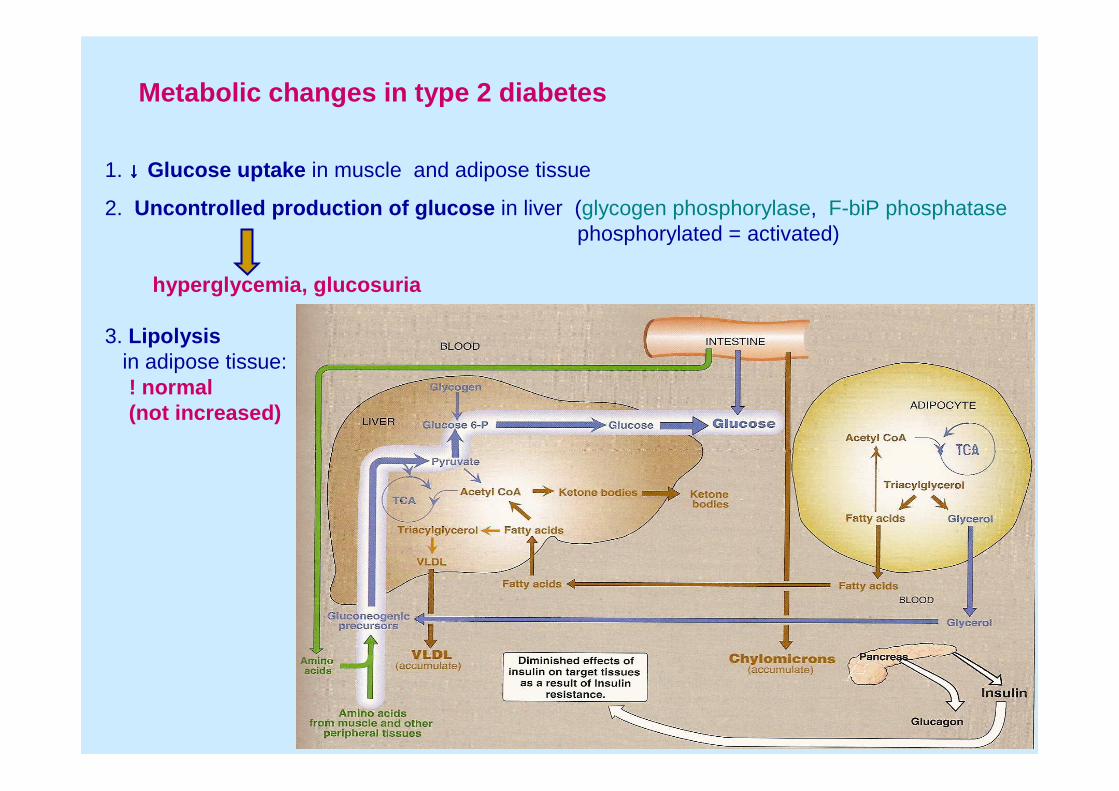
1. ↓↓↓↓ Glucose uptake in muscle and adipose tissue
2. Uncontrolled production of glucose in liver (glycogen phosphorylase, F-biP phosphatasephosphorylated = activated)
hyperglycemia, glucosuria
3. Lipolysisin adipose tissue: ! normal(not increased)
Metabolic changes in type 2 diabetes
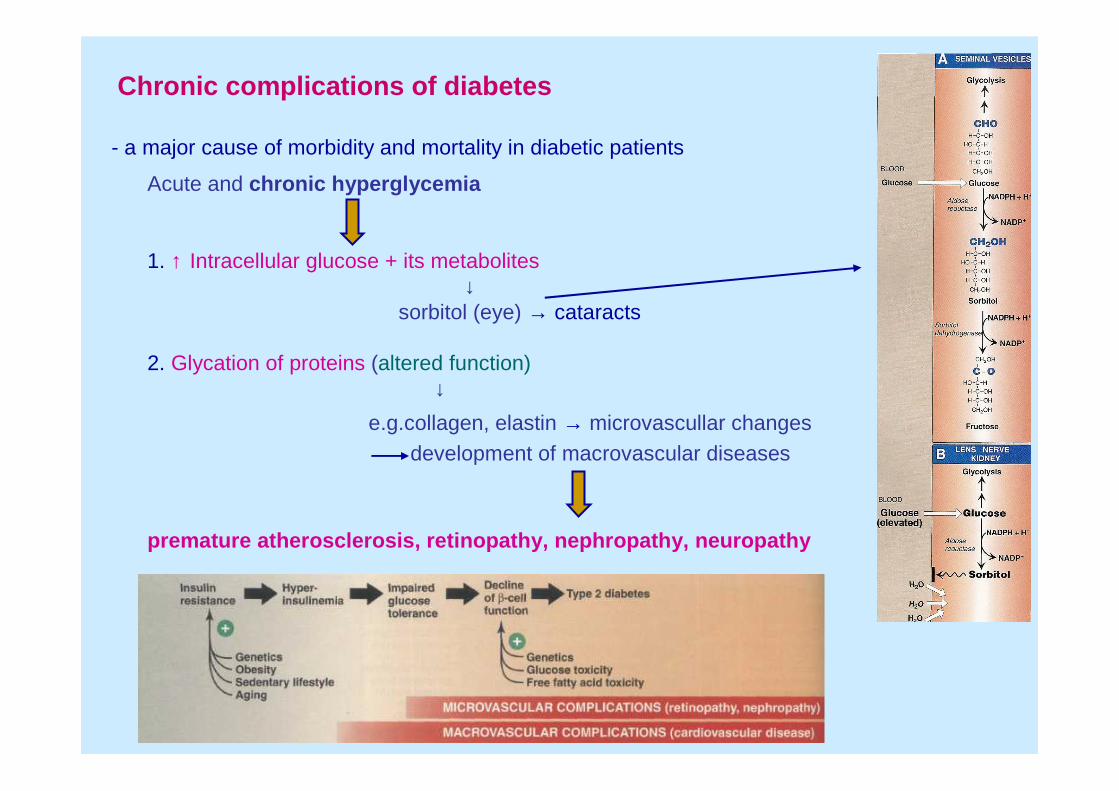
Chronic complications of diabetes
Acute and chronic hyperglycemia
1. ↑ Intracellular glucose + its metabolites↓
sorbitol (eye) → cataracts
2. Glycation of proteins (altered function)↓
e.g.collagen, elastin → microvascullar changesdevelopment of macrovascular diseases
premature atherosclerosis, retinopathy, nephropathy, neuropathy
- a major cause of morbidity and mortality in diabetic patients
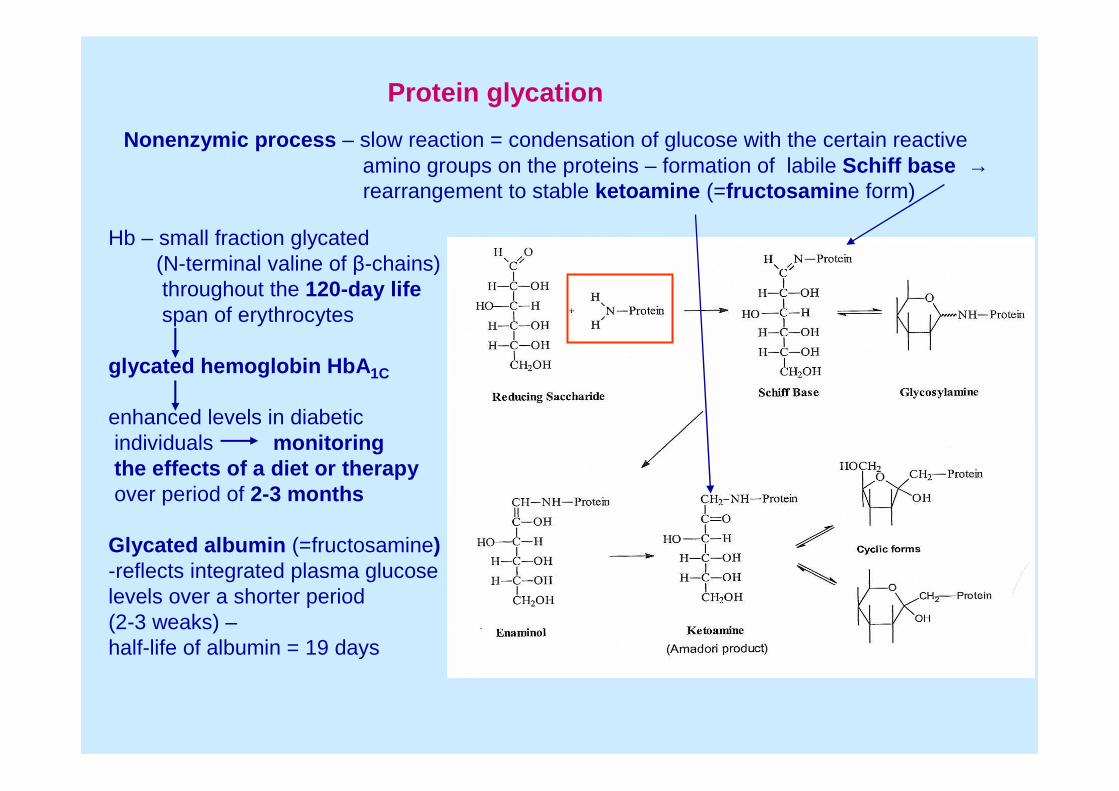
Protein glycation
Nonenzymic process – slow reaction = condensation of glucose with the certain reactiveamino groups on the proteins – formation of labile Schiff base →rearrangement to stable ketoamine (=fructosamine form)
Hb – small fraction glycated(N-terminal valine of β-chains)throughout the 120-day lifespan of erythrocytes
glycated hemoglobin HbA1C
enhanced levels in diabeticindividuals monitoringthe effects of a diet or therapyover period of 2-3 months
Glycated albumin (=fructosamine)-reflects integrated plasma glucoselevels over a shorter period (2-3 weaks) –half-life of albumin = 19 days
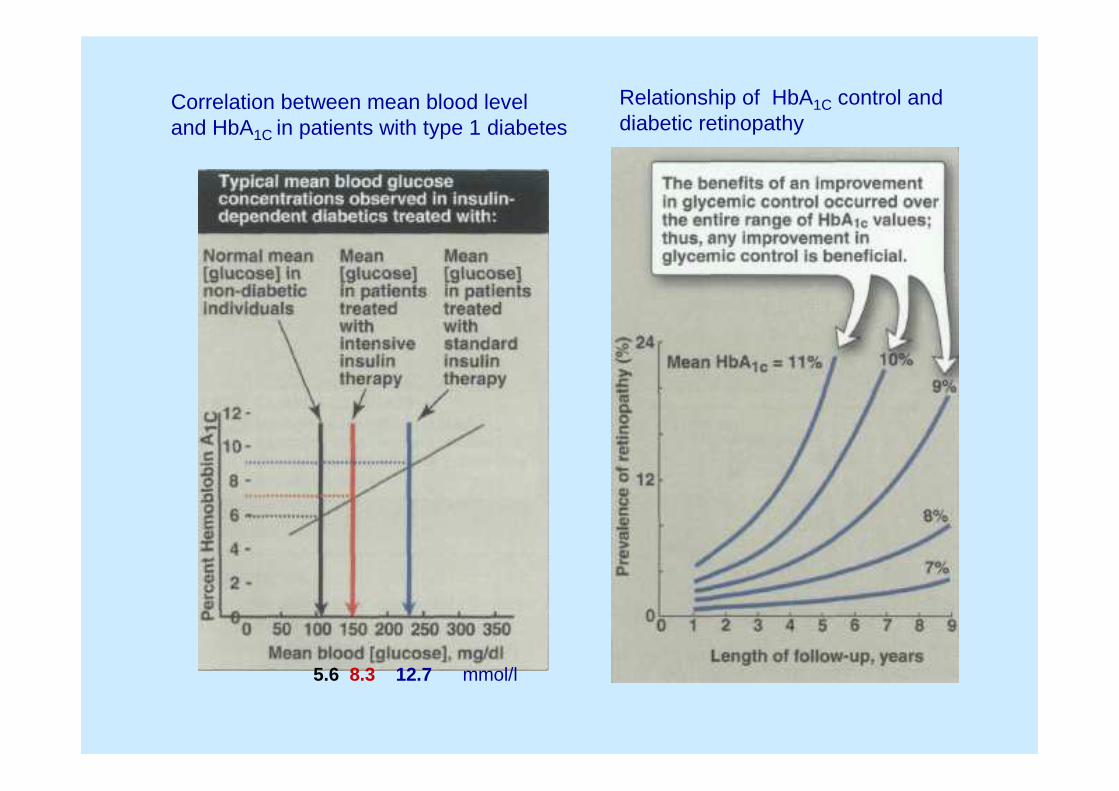
Correlation between mean blood leveland HbA1C in patients with type 1 diabetes
Relationship of HbA1C control anddiabetic retinopathy
5.6 8.3 12.7 mmol/l
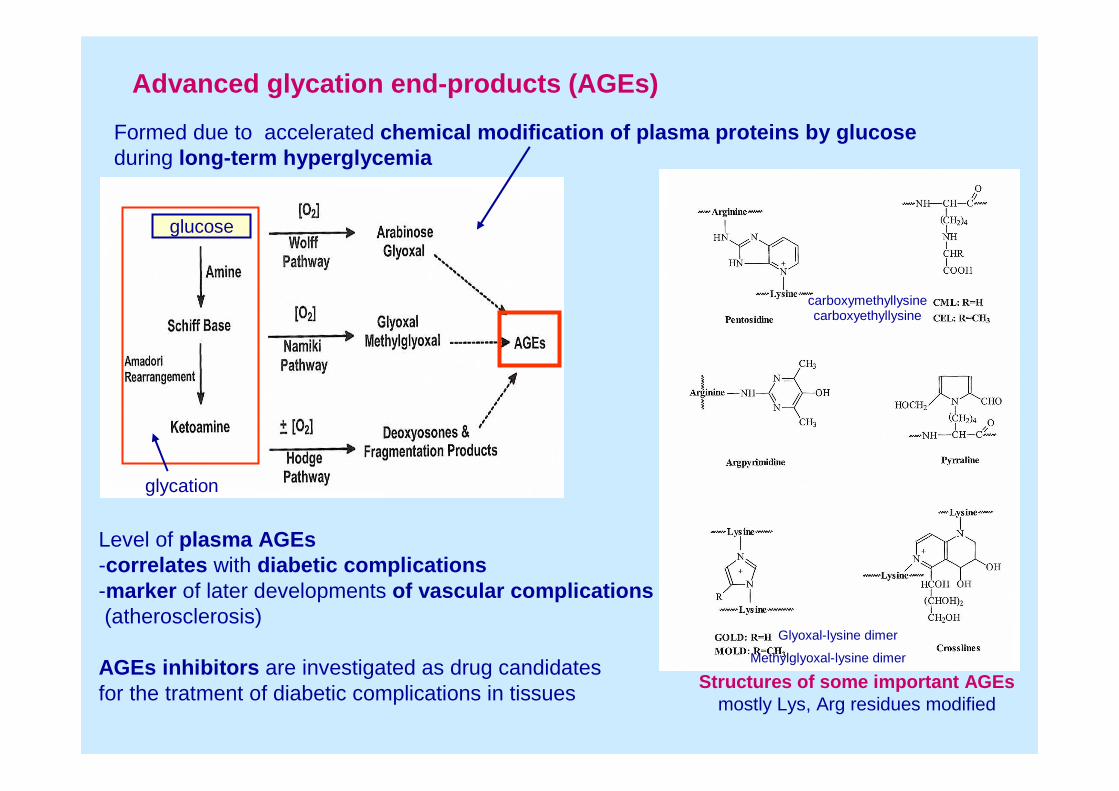
Advanced glycation end-products (AGEs)
Formed due to accelerated chemical modification of plasma proteins by glucoseduring long-term hyperglycemia
glucose
glycation
Level of plasma AGEs-correlates with diabetic complications-marker of later developments of vascular complications(atherosclerosis)
AGEs inhibitors are investigated as drug candidatesfor the tratment of diabetic complications in tissues
Structures of some important AGEsmostly Lys, Arg residues modified
carboxymethyllysinecarboxyethyllysine
Glyoxal-lysine dimer
Methylglyoxal-lysine dimer