Medical Engineering and Physics · · 2017-05-20Medical Engineering and Physics 42 (2017) 80–90...
11
Medical Engineering and Physics 42 (2017) 80–90 Contents lists available at ScienceDirect Medical Engineering and Physics journal homepage: www.elsevier.com/locate/medengphy Total ankle replacement design and positioning affect implant-bone micromotion and bone strains Ran S. Sopher a , Andrew A. Amis a,b , James D. Calder b,c , Jonathan R.T. Jeffers a,∗ a Department of Mechanical Engineering, Imperial College London, 715 City & Guilds Building, South Kensington, London SW7 2AZ, UK b Department of Surgery & Cancer, Imperial College London, Charing Cross Hospital, London, W6 8RP, UK c Fortius Clinic, 17 Fitzhardinge St, London, W1H 6EQ , UK a r t i c l e i n f o Article history: Received 14 June 2016 Revised 12 January 2017 Accepted 31 January 2017 Keywords: Total ankle replacement Fixation Micromotion Malpositioning Finite element modelling a b s t r a c t Implant loosening – commonly linked with elevated initial micromotion – is the primary indication for total ankle replacement (TAR) revision. Finite element modelling has not been used to assess micromo- tion of TAR implants; additionally, the biomechanical consequences of TAR malpositioning – previously linked with higher failure rates – remain unexplored. The aim of this study was to estimate implant-bone micromotion and peri-implant bone strains for optimally positioned and malpositioned TAR prostheses, and thereby identify fixation features and malpositioning scenarios increasing the risk of loosening. Finite element models simulating three of the most commonly used TAR devices (BOX ® , Mobility ® and Salto ® ) implanted into the tibia/talus and subjected to physiological loads were developed. Mobility and Salto demonstrated the largest micromotion of all tibial and talar components, respectively. Any malpositioning of the implant creating a gap between it and the bone resulted in a considerable increase in micromotion and bone strains. It was concluded that better primary stability can be achieved through fixation nearer to the joint line and/or while relying on more than a single peg. Incomplete seating on the bone may result in considerably elevated implant-bone micromotion and bone strains, thereby increasing the risk for TAR failure. © 2017 The Authors. Published by Elsevier Ltd on behalf of IPEM. This is an open access article under the CC BY license. (http://creativecommons.org/licenses/by/4.0/) 1. Introduction Total ankle replacement (TAR) can provide arthritis patients with pain relief and improved ankle range of motion, and is there- fore gaining popularity as an alternative to arthrodesis [1,2]. The currently used semi-constrained cementless designs with mobile- bearing polyethylene (PE) insert have shown promising results [2]. Loosening of the tibial or talar component is the primary indi- cation for TAR revision (19–47%, [3–7]). High levels of micromotion of cementless orthopaedic prostheses (>50–150 μm; [8–10]) are thought to impede osseointegration at the bone-implant interface, thereby hampering fixation [11] and potentially leading to clinical loosening [8,9,12]. Accordingly, micromotion of two TAR prosthesis designs has been assessed experimentally to evaluate the implant primary stability using optical tracking [13]. A useful tool to assess initial micromotion of joint replacement implants and peri-implant bone strains is finite element modelling (FEM) (e.g. hip, [14,15]; shoulder, [16–18]). Several studies have ∗ Corresponding author. E-mail address: j.jeffers@imperial.ac.uk (J.R.T. Jeffers). employed FEM to explore the performance of current TAR devices: Terrier et al. [19–21] modelled the Salto ® implanted in the tibia to explore bone strains and stresses occurring at the implant vicinity. Espinosa et al. [22] developed a model to study contact pressures occurring in the PE component of the Agility ® and Mobility ® . Reg- giani et al. [23] included ligaments in a FE model to investigate the kinematics and contact pressures of the BOX ® . However, to our knowledge, no FE study has investigated TAR implant-bone micro- motion. Manufacturers of TAR prostheses provide detailed guidelines for their positioning during arthroplasty surgery. Proper implant positioning is necessary for achieving good clinical results [24,25], and even a slight degree of malpositioning has been claimed to result in higher failure rates [26]. Malpositioning of TAR has also been investigated in biomechanical settings. Saltzman et al. [24] found that elongation of the tibiocalcaneal ligament was con- siderably increased by varus/valgus malpositioning, and Espinosa et al. [22] found that such malpositioning increased pressures acting on the mobile component, which could lead to premature PE wear. Varus/valgus and dorsi-/plantar-flexed malpositioning of TAR components reported in the literature [27] may lead to a gap between the implant and the bone (often seen clinically http://dx.doi.org/10.1016/j.medengphy.2017.01.022 1350-4533/© 2017 The Authors. Published by Elsevier Ltd on behalf of IPEM. This is an open access article under the CC BY license. (http://creativecommons.org/licenses/by/4.0/)
Transcript of Medical Engineering and Physics · · 2017-05-20Medical Engineering and Physics 42 (2017) 80–90...
Medical Engineering and Physics 42 (2017) 80–90
Contents lists available at ScienceDirect
Medical Engineering and Physics
journal homepage: www.elsevier.com/locate/medengphy
Total ankle replacement design and positioning affect implant-bone
micromotion and bone strains
Ran S. Sopher a , Andrew A. Amis a , b , James D. Calder b , c , Jonathan R.T. Jeffers a , ∗
a Department of Mechanical Engineering, Imperial College London, 715 City & Guilds Building, South Kensington, London SW7 2AZ, UK b Department of Surgery & Cancer, Imperial College London, Charing Cross Hospital, London, W6 8RP, UK c Fortius Clinic, 17 Fitzhardinge St, London, W1H 6EQ , UK
a r t i c l e i n f o
Article history:
Received 14 June 2016
Revised 12 January 2017
Accepted 31 January 2017
Keywords:
Total ankle replacement
Fixation
Micromotion
Malpositioning
Finite element modelling
a b s t r a c t
Implant loosening – commonly linked with elevated initial micromotion – is the primary indication for
total ankle replacement (TAR) revision. Finite element modelling has not been used to assess micromo-
tion of TAR implants; additionally, the biomechanical consequences of TAR malpositioning – previously
linked with higher failure rates – remain unexplored. The aim of this study was to estimate implant-bone
micromotion and peri-implant bone strains for optimally positioned and malpositioned TAR prostheses,
and thereby identify fixation features and malpositioning scenarios increasing the risk of loosening. Finite
element models simulating three of the most commonly used TAR devices (BOX
®, Mobility ® and Salto ®)
implanted into the tibia/talus and subjected to physiological loads were developed. Mobility and Salto
demonstrated the largest micromotion of all tibial and talar components, respectively. Any malpositioning
of the implant creating a gap between it and the bone resulted in a considerable increase in micromotion
and bone strains. It was concluded that better primary stability can be achieved through fixation nearer
to the joint line and/or while relying on more than a single peg. Incomplete seating on the bone may
result in considerably elevated implant-bone micromotion and bone strains, thereby increasing the risk
for TAR failure.
© 2017 The Authors. Published by Elsevier Ltd on behalf of IPEM.
This is an open access article under the CC BY license. ( http://creativecommons.org/licenses/by/4.0/ )
e
T
e
E
o
g
t
k
m
f
p
a
t
a
[
s
e
1. Introduction
Total ankle replacement (TAR) can provide arthritis patients
with pain relief and improved ankle range of motion, and is there-
fore gaining popularity as an alternative to arthrodesis [1,2] . The
currently used semi-constrained cementless designs with mobile-
bearing polyethylene (PE) insert have shown promising results [2] .
Loosening of the tibial or talar component is the primary indi-
cation for TAR revision (19–47%, [3–7] ). High levels of micromotion
of cementless orthopaedic prostheses ( > 50–150 μm; [8–10] ) are
thought to impede osseointegration at the bone-implant interface,
thereby hampering fixation [11] and potentially leading to clinical
loosening [8,9,12] . Accordingly, micromotion of two TAR prosthesis
designs has been assessed experimentally to evaluate the implant
primary stability using optical tracking [13] .
A useful tool to assess initial micromotion of joint replacement
implants and peri-implant bone strains is finite element modelling
(FEM) (e.g. hip, [14,15] ; shoulder, [16–18] ). Several studies have
∗ Corresponding author.
E-mail address: j.jeffers@im perial.ac.uk (J.R.T. Jeffers).
a
P
o
a
http://dx.doi.org/10.1016/j.medengphy.2017.01.022
1350-4533/© 2017 The Authors. Published by Elsevier Ltd on behalf of IPEM. This is an op
( http://creativecommons.org/licenses/by/4.0/ )
mployed FEM to explore the performance of current TAR devices:
errier et al. [19–21] modelled the Salto ® implanted in the tibia to
xplore bone strains and stresses occurring at the implant vicinity.
spinosa et al. [22] developed a model to study contact pressures
ccurring in the PE component of the Agility ® and Mobility ®. Reg-
iani et al. [23] included ligaments in a FE model to investigate
he kinematics and contact pressures of the BOX
®. However, to our
nowledge, no FE study has investigated TAR implant-bone micro-
otion.
Manufacturers of TAR prostheses provide detailed guidelines
or their positioning during arthroplasty surgery. Proper implant
ositioning is necessary for achieving good clinical results [24,25] ,
nd even a slight degree of malpositioning has been claimed
o result in higher failure rates [26] . Malpositioning of TAR has
lso been investigated in biomechanical settings. Saltzman et al.
24] found that elongation of the tibiocalcaneal ligament was con-
iderably increased by varus/valgus malpositioning, and Espinosa
t al. [22] found that such malpositioning increased pressures
cting on the mobile component, which could lead to premature
E wear. Varus/valgus and dorsi-/plantar-flexed malpositioning
f TAR components reported in the literature [27] may lead to
gap between the implant and the bone (often seen clinically
en access article under the CC BY license.
R.S. Sopher et al. / Medical Engineering and Physics 42 (2017) 80–90 81
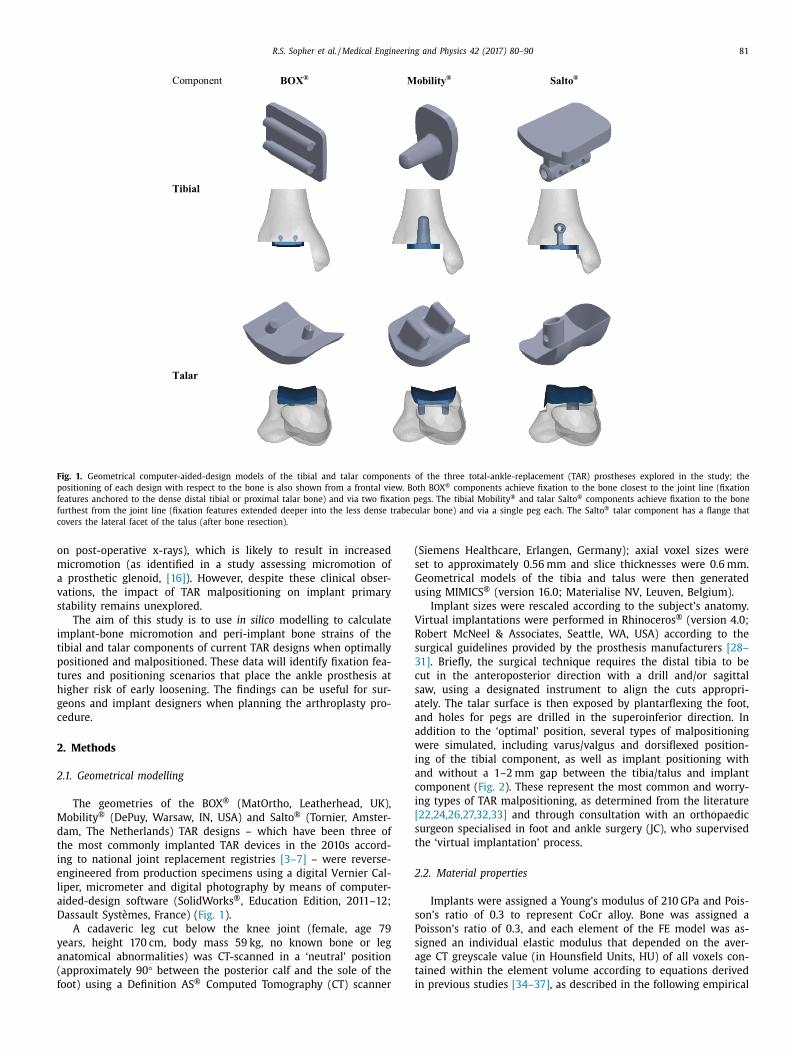
Fig. 1. Geometrical computer-aided-design models of the tibial and talar components of the three total-ankle-replacement (TAR) prostheses explored in the study; the
positioning of each design with respect to the bone is also shown from a frontal view. Both BOX ® components achieve fixation to the bone closest to the joint line (fixation
features anchored to the dense distal tibial or proximal talar bone) and via two fixation pegs. The tibial Mobility ® and talar Salto ® components achieve fixation to the bone
furthest from the joint line (fixation features extended deeper into the less dense trabecular bone) and via a single peg each. The Salto ® talar component has a flange that
covers the lateral facet of the talus (after bone resection).
o
m
a
v
s
i
t
p
t
h
g
c
2
2
M
d
t
i
e
l
a
D
y
a
(
f
(
s
G
u
V
R
s
3
c
s
a
a
a
w
i
a
c
i
[
s
t
2
s
P
s
a
t
i
n post-operative x-rays), which is likely to result in increased
icromotion (as identified in a study assessing micromotion of
prosthetic glenoid, [16] ). However, despite these clinical obser-
ations, the impact of TAR malpositioning on implant primary
tability remains unexplored.
The aim of this study is to use in silico modelling to calculate
mplant-bone micromotion and peri-implant bone strains of the
ibial and talar components of current TAR designs when optimally
ositioned and malpositioned. These data will identify fixation fea-
ures and positioning scenarios that place the ankle prosthesis at
igher risk of early loosening. The findings can be useful for sur-
eons and implant designers when planning the arthroplasty pro-
edure.
. Methods
.1. Geometrical modelling
The geometries of the BOX
® (MatOrtho, Leatherhead, UK),
obility ® (DePuy, Warsaw, IN, USA) and Salto ® (Tornier, Amster-
am, The Netherlands) TAR designs – which have been three of
he most commonly implanted TAR devices in the 2010s accord-
ng to national joint replacement registries [3–7] – were reverse-
ngineered from production specimens using a digital Vernier Cal-
iper, micrometer and digital photography by means of computer-
ided-design software (SolidWorks ®, Education Edition, 2011–12;
assault Systèmes, France) ( Fig. 1 ).
A cadaveric leg cut below the knee joint (female, age 79
ears, height 170 cm, body mass 59 kg, no known bone or leg
natomical abnormalities) was CT-scanned in a ‘neutral’ position
approximately 90 ° between the posterior calf and the sole of the
oot) using a Definition AS ® Computed Tomography (CT) scanner
Siemens Healthcare, Erlangen, Germany); axial voxel sizes were
et to approximately 0.56 mm and slice thicknesses were 0.6 mm.
eometrical models of the tibia and talus were then generated
sing MIMICS ® (version 16.0; Materialise NV, Leuven, Belgium).
Implant sizes were rescaled according to the subject’s anatomy.
irtual implantations were performed in Rhinoceros ® (version 4.0;
obert McNeel & Associates, Seattle, WA, USA) according to the
urgical guidelines provided by the prosthesis manufacturers [28–
1] . Briefly, the surgical technique requires the distal tibia to be
ut in the anteroposterior direction with a drill and/or sagittal
aw, using a designated instrument to align the cuts appropri-
tely. The talar surface is then exposed by plantarflexing the foot,
nd holes for pegs are drilled in the superoinferior direction. In
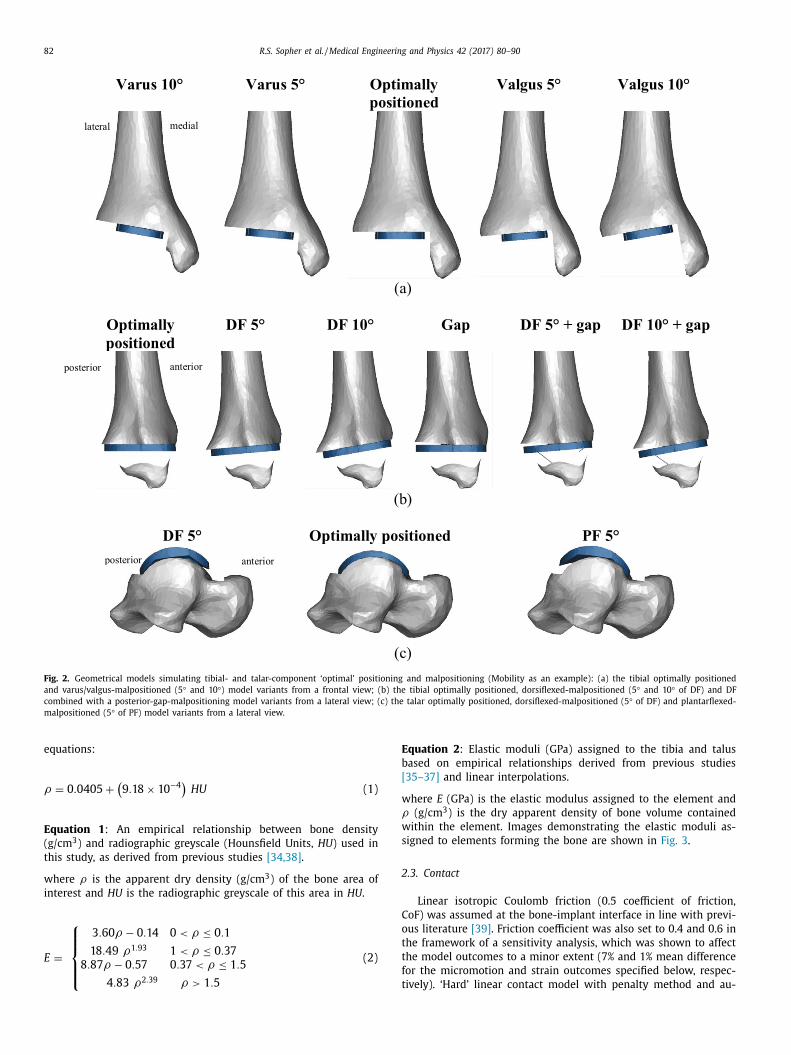
ddition to the ‘optimal’ position, several types of malpositioning
ere simulated, including varus/valgus and dorsiflexed position-
ng of the tibial component, as well as implant positioning with
nd without a 1–2 mm gap between the tibia/talus and implant
omponent ( Fig. 2 ). These represent the most common and worry-
ng types of TAR malpositioning, as determined from the literature
22,24,26,27,32,33] and through consultation with an orthopaedic
urgeon specialised in foot and ankle surgery (JC), who supervised
he ‘virtual implantation’ process.
.2. Material properties
Implants were assigned a Young’s modulus of 210 GPa and Pois-
on’s ratio of 0.3 to represent CoCr alloy. Bone was assigned a
oisson’s ratio of 0.3, and each element of the FE model was as-
igned an individual elastic modulus that depended on the aver-
ge CT greyscale value (in Hounsfield Units, HU) of all voxels con-
ained within the element volume according to equations derived
n previous studies [34–37] , as described in the following empirical
82 R.S. Sopher et al. / Medical Engineering and Physics 42 (2017) 80–90
Fig. 2. Geometrical models simulating tibial- and talar-component ‘optimal’ positioning and malpositioning (Mobility as an example): (a) the tibial optimally positioned
and varus/valgus-malpositioned (5 ° and 10 °) model variants from a frontal view; (b) the tibial optimally positioned, dorsiflexed-malpositioned (5 ° and 10 ° of DF) and DF
combined with a posterior-gap-malpositioning model variants from a lateral view; (c) the talar optimally positioned, dorsiflexed-malpositioned (5 ° of DF) and plantarflexed-
malpositioned (5 ° of PF) model variants from a lateral view.
E
b
[
w
ρ
w
s
2
C
o
t
t
f
t
equations:
ρ = 0 . 0405 +
(9 . 18 × 10
−4 )
HU (1)
Equation 1 : An empirical relationship between bone density
(g/cm
3 ) and radiographic greyscale (Hounsfield Units, HU ) used in
this study, as derived from previous studies [34,38] .
where ρ is the apparent dry density (g/cm
3 ) of the bone area of
interest and HU is the radiographic greyscale of this area in HU .
E =
⎧ ⎪ ⎪ ⎨
⎪ ⎪ ⎩
3 . 60 ρ − 0 . 14 0 < ρ ≤ 0 . 1
18 . 49 ρ1 . 93 1 < ρ ≤ 0 . 37
8 . 87 ρ − 0 . 57 0 . 37 < ρ ≤ 1 . 5
4 . 83 ρ2 . 39 ρ > 1 . 5
(2)
quation 2 : Elastic moduli (GPa) assigned to the tibia and talus
ased on empirical relationships derived from previous studies
35–37] and linear interpolations.
here E (GPa) is the elastic modulus assigned to the element and
(g/cm
3 ) is the dry apparent density of bone volume contained
ithin the element. Images demonstrating the elastic moduli as-
igned to elements forming the bone are shown in Fig. 3 .
.3. Contact
Linear isotropic Coulomb friction (0.5 coefficient of friction,
oF) was assumed at the bone-implant interface in line with previ-
us literature [39] . Friction coefficient was also set to 0.4 and 0.6 in
he framework of a sensitivity analysis, which was shown to affect
he model outcomes to a minor extent (7% and 1% mean difference
or the micromotion and strain outcomes specified below, respec-
ively). ‘Hard’ linear contact model with penalty method and au-
R.S. Sopher et al. / Medical Engineering and Physics 42 (2017) 80–90 83
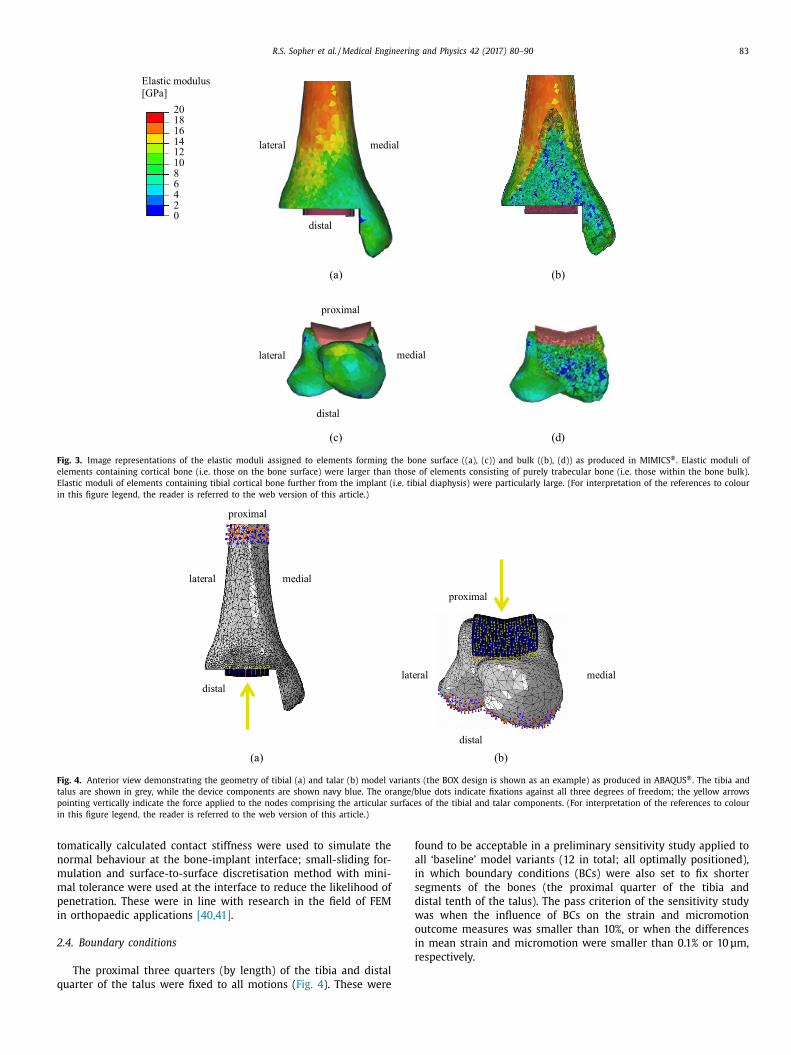
Fig. 3. Image representations of the elastic moduli assigned to elements forming the bone surface ((a), (c)) and bulk ((b), (d)) as produced in MIMICS ®. Elastic moduli of
elements containing cortical bone (i.e. those on the bone surface) were larger than those of elements consisting of purely trabecular bone (i.e. those within the bone bulk).
Elastic moduli of elements containing tibial cortical bone further from the implant (i.e. tibial diaphysis) were particularly large. (For interpretation of the references to colour
in this figure legend, the reader is referred to the web version of this article.)
Fig. 4. Anterior view demonstrating the geometry of tibial (a) and talar (b) model variants (the BOX design is shown as an example) as produced in ABAQUS ®. The tibia and
talus are shown in grey, while the device components are shown navy blue. The orange/blue dots indicate fixations against all three degrees of freedom; the yellow arrows
pointing vertically indicate the force applied to the nodes comprising the articular surfaces of the tibial and talar components. (For interpretation of the references to colour
in this figure legend, the reader is referred to the web version of this article.)
t
n
m
m
p
i
2
q
f
a
i
s
d
w
o
i
r
omatically calculated contact stiffness were used to simulate the
ormal behaviour at the bone-implant interface; small-sliding for-
ulation and surface-to-surface discretisation method with mini-
al tolerance were used at the interface to reduce the likelihood of
enetration. These were in line with research in the field of FEM
n orthopaedic applications [40,41] .
.4. Boundary conditions
The proximal three quarters (by length) of the tibia and distal
uarter of the talus were fixed to all motions ( Fig. 4 ). These were
ound to be acceptable in a preliminary sensitivity study applied to
ll ‘baseline’ model variants (12 in total; all optimally positioned),
n which boundary conditions (BCs) were also set to fix shorter
egments of the bones (the proximal quarter of the tibia and
istal tenth of the talus). The pass criterion of the sensitivity study
as when the influence of BCs on the strain and micromotion
utcome measures was smaller than 10%, or when the differences
n mean strain and micromotion were smaller than 0.1% or 10 μm,
espectively.
84 R.S. Sopher et al. / Medical Engineering and Physics 42 (2017) 80–90
c
t
a
m
t
p
t
e
2
6
m
i
v
i
C
2
I
m
d
m
m
m
a
g
m
c
u
i
w
l
t
w
3
3
3
M
p
m
o
s
S
a
t
B
a
a
t
0
s
m
d
i
h
a
∼
2.5. Loading conditions
Loading conditions (LCs), applied as point forces evenly dis-
tributed between the nodes forming the implant articular surfaces
( Fig. 4 ), simulated the physiological peak axial contact load acting
on the implant tibial and talar components during gait. This was
estimated in a previous study [42] to occur at 45–50% gait-cycle
(GC) (terminal stance, just after heel rise), and to equal 5.2-times
bodyweight. A preliminary study in which the ankle contact forces
acting in six segments of the stance phase of gait (2%, 12%, 31%,
45%, 50%, 55% GC) were applied to the model, confirmed that the
implant-bone micromotion and bone strains were the largest at
45–50% GC, and accordingly, this was selected as the segment of
stance phase to be simulated in the current model. Shear forces
were not considered as these are small [43-45] , and should not
be normally transmitted to the implant fixation interface due to
the floating nature of the PE bearing of the implants considered.
To investigate the effect of shear forces possibly occurring at the
interface between the PE and metal components of the implant
on the model outcome measures (see below), we conducted a
preliminary sensitivity study in which small shear forces (acting
posteriorly and of magnitude equal to the product of the axial
compression force and the estimated PE-CoCr CoF, 0.07; [46] ) were
applied to all ‘baseline’ model variants (24 in total) in addition
to the aforementioned compressive load. Such shear was found
to affect outcome measures only slightly: tibial micromotion
outcomes were affected by less than 10% (4% on average), while
strain outcomes were affected by up to 3% (1% on average); talar
micromotion outcomes were affected by less than 3% (1% on
average), while strain outcomes were affected by 1% on average.
Since all implant designs considered have mobile PE bearings,
the point of load application is not certain. Three loading cases
were therefore implemented to represent a centrally, anteriorly
and posteriorly located PE bearing by applying the loading to cen-
trally, anteriorly and posteriorly located halves of the articular im-
plant surfaces, respectively, so to cover the positions of the PE
component during stance [20,22,23] .
2.6. Meshing
Automatic meshing was applied in 3-matic ® (version 16.0; Ma-
terialise NV, Leuven, Belgium) using solid linear tetrahedral el-
ements (of type C3D4 in ABAQUS; mesh density of maximum
triangle edge length 5 mm); finer meshing (maximum triangle
edge length 1.5 mm) was applied at the vicinity of the bone-
implant interface. The meshes of the tibial and talar model
variants comprised 32,0 0 0–48,0 0 0 and 21,0 0 0–29,0 0 0 3-degrees-
of-freedom nodes, respectively. These meshes were considered
acceptable based on a mesh-refinement study in which three dif-
ferent mesh densities (of 3.0-, 2.0- and 1.5-mm edge length at
the vicinity of the bone-implant interface) were implemented to
each of the ‘baseline’ model variants (24 in total; all optimally
positioned, while applying four different loading scenarios). This
preliminary investigation into mesh convergence demonstrated
that differences in outcome measures between the 2.0-mm- and
1.5-mm-edge-length meshes were considerably smaller compared
with the differences between the 3.0-mm- and 1.5-mm-edge-
length meshes. For the tibial component model variants, for ex-
ample, the average difference in mean and peak tibial micro-
motion (percentagewise) between the 3-mm- and 1.5-mm-edge-
length meshes was 8% and 9%, respectively, but this reduced
to 4% and 5% for the 2-mm-edge-length mesh. A similar trend
was observed for the talar micromotion, as well as for bone
strains. Meshes with characteristic edge length of 1.5 mm, which
were the finest meshes we were able to utilise given the com-
plexity of the model, the number of model variants and the
omputational resources we had available, were thus consis-
ently implemented. It should be noted that meshes of equiv-
lent element type and similar density were used and experi-
entally validated in previous studies conducted in our group
o assess micromotion of a glenoid implant inserted into a
orcine scapula [16] , and strains occurring at the vicinity of a
ibial component used in knee replacement inserted into a cadav-
ric human tibia [47] .
.7. Numerical method
The ABAQUS ® Standard/Implicit FE solver (ABAQUS CAE, ver.
.11-2, SIMULIA, Providence, RI, USA) in its nonlinear analysis
ode was used to process all 117 model variants and 102 prelim-
nary model variants. The runtime of each tibial and talar model
ariant was approximately 1 h and 30 min, respectively, when us-
ng a 64-bit Microsoft Windows 7-based desktop computer with a
PU comprising Intel Core i7 3.4 GHz 4-cores and 8 GB RAM.
.8. Outcome measures
A script was coded in MATLAB
® (version R2013a, MathWorks
nc., Natick, MA, USA) to calculate the distribution of total, nor-
al and tangential micromotion at the bone-implant interface and
etermine peak (95th percentile) and mean micromotion for each
odel variant. The bone-implant interface area subjected to total
icromotion larger than 100 μm [48] was calculated; this is the
id-range of the 50–150 μm range identified in previous studies
s containing a critical micromotion level above which osseointe-
ration is less likely to occur [8–10] . Additionally, distributions of
aximum and minimum principal strains within the bone were
alculated, and peak and mean values of these within a bone vol-
me defined by an offset surface of 10-mm from the bone-implant
nterface (region of interest, ROI) were determined. A custom script
as also used to calculate the volume of bone exposed to strains
arger than yield strains, expressed as the ratio of this volume over
he total volume of all elements in the ROI. The bone yield strains
ere 0.73% (compressive) and 0.65% (tensile) [49] .
. Results
.1. Optimally positioned implants
.1.1. Tibial components
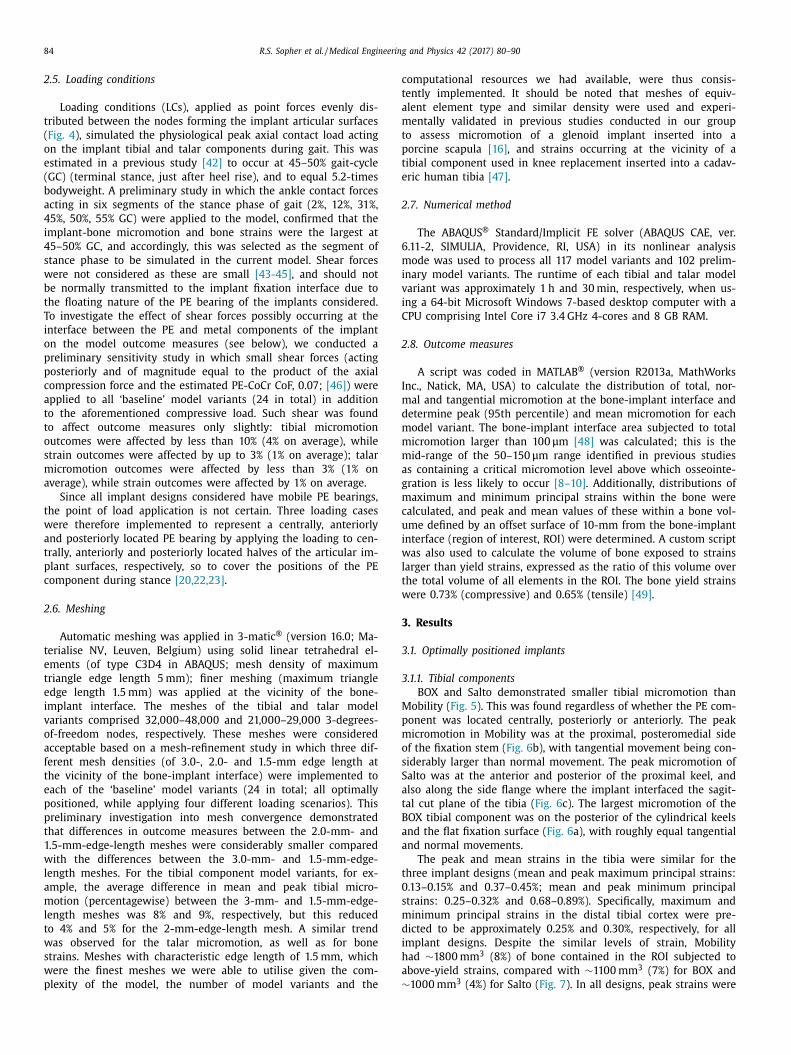
BOX and Salto demonstrated smaller tibial micromotion than
obility ( Fig. 5 ). This was found regardless of whether the PE com-
onent was located centrally, posteriorly or anteriorly. The peak
icromotion in Mobility was at the proximal, posteromedial side
f the fixation stem ( Fig. 6 b), with tangential movement being con-
iderably larger than normal movement. The peak micromotion of
alto was at the anterior and posterior of the proximal keel, and
lso along the side flange where the implant interfaced the sagit-
al cut plane of the tibia ( Fig. 6 c). The largest micromotion of the
OX tibial component was on the posterior of the cylindrical keels
nd the flat fixation surface ( Fig. 6 a), with roughly equal tangential
nd normal movements.
The peak and mean strains in the tibia were similar for the
hree implant designs (mean and peak maximum principal strains:
.13–0.15% and 0.37–0.45%; mean and peak minimum principal
trains: 0.25–0.32% and 0.68–0.89%). Specifically, maximum and
inimum principal strains in the distal tibial cortex were pre-
icted to be approximately 0.25% and 0.30%, respectively, for all
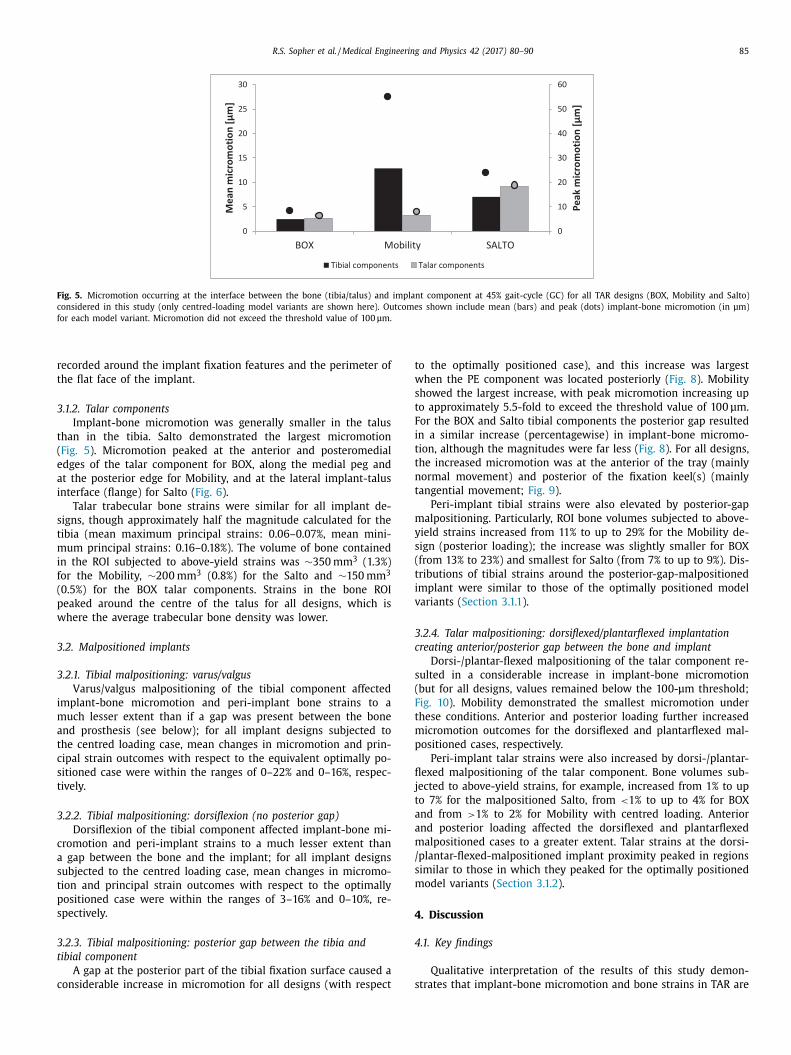
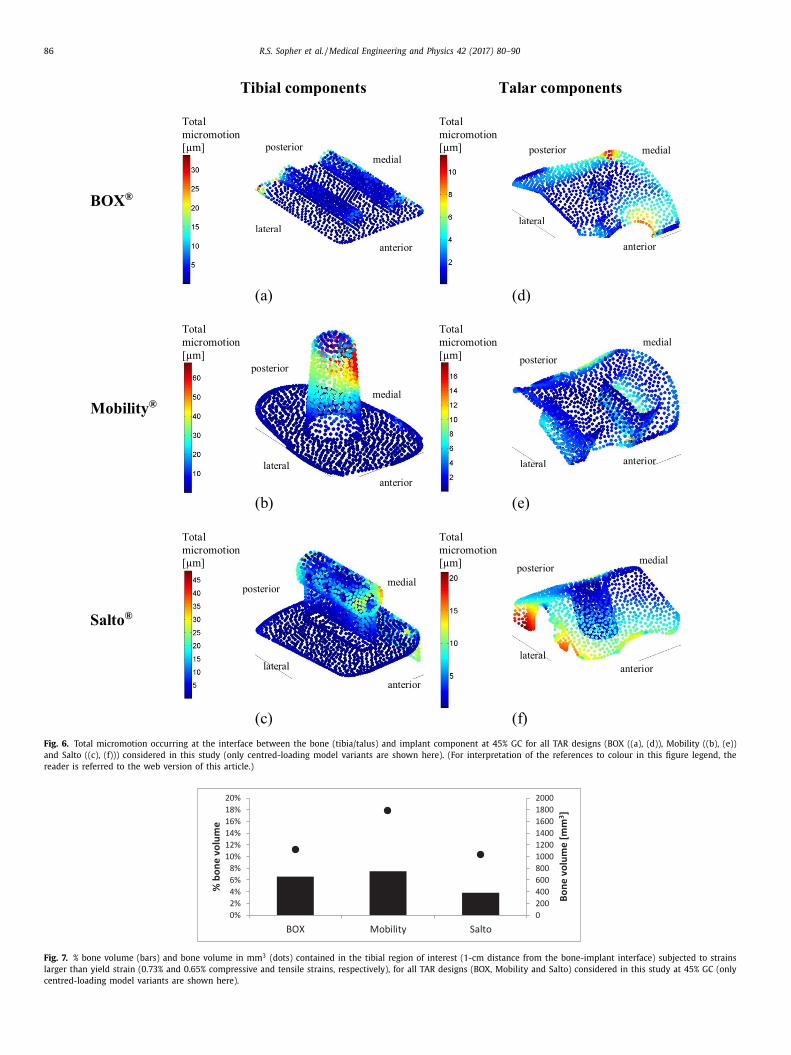
mplant designs. Despite the similar levels of strain, Mobility
ad ∼1800 mm
3 (8%) of bone contained in the ROI subjected to
bove-yield strains, compared with ∼1100 mm
3 (7%) for BOX and
10 0 0 mm
3 (4%) for Salto ( Fig. 7 ). In all designs, peak strains were
R.S. Sopher et al. / Medical Engineering and Physics 42 (2017) 80–90 85
Fig. 5. Micromotion occurring at the interface between the bone (tibia/talus) and implant component at 45% gait-cycle (GC) for all TAR designs (BOX, Mobility and Salto)
considered in this study (only centred-loading model variants are shown here). Outcomes shown include mean (bars) and peak (dots) implant-bone micromotion (in μm)
for each model variant. Micromotion did not exceed the threshold value of 100 μm.
r
t
3
t
(
e
a
i
s
t
m
i
f
(
p
w
3
3
i
m
a
t
c
s
t
3
c
a
s
t
p
s
3
t
c
t
w
s
t
F
i
t
t
n
t
m
y
s
(
t
i
v
3
c
s
(
F
t
m
p
fl
j
t
a
a
m
/
s
m
4
4
s
ecorded around the implant fixation features and the perimeter of
he flat face of the implant.
.1.2. Talar components
Implant-bone micromotion was generally smaller in the talus
han in the tibia. Salto demonstrated the largest micromotion
Fig. 5 ). Micromotion peaked at the anterior and posteromedial
dges of the talar component for BOX, along the medial peg and
t the posterior edge for Mobility, and at the lateral implant-talus
nterface (flange) for Salto ( Fig. 6 ).
Talar trabecular bone strains were similar for all implant de-
igns, though approximately half the magnitude calculated for the
ibia (mean maximum principal strains: 0.06–0.07%, mean mini-
um principal strains: 0.16–0.18%). The volume of bone contained
n the ROI subjected to above-yield strains was ∼350 mm
3 (1.3%)
or the Mobility, ∼200 mm
3 (0.8%) for the Salto and ∼150 mm
3
0.5%) for the BOX talar components. Strains in the bone ROI
eaked around the centre of the talus for all designs, which is
here the average trabecular bone density was lower.
.2. Malpositioned implants
.2.1. Tibial malpositioning: varus/valgus
Varus/valgus malpositioning of the tibial component affected
mplant-bone micromotion and peri-implant bone strains to a
uch lesser extent than if a gap was present between the bone
nd prosthesis (see below); for all implant designs subjected to
he centred loading case, mean changes in micromotion and prin-
ipal strain outcomes with respect to the equivalent optimally po-
itioned case were within the ranges of 0–22% and 0–16%, respec-
ively.
.2.2. Tibial malpositioning: dorsiflexion (no posterior gap)
Dorsiflexion of the tibial component affected implant-bone mi-
romotion and peri-implant strains to a much lesser extent than
gap between the bone and the implant; for all implant designs
ubjected to the centred loading case, mean changes in micromo-
ion and principal strain outcomes with respect to the optimally
ositioned case were within the ranges of 3–16% and 0–10%, re-
pectively.
.2.3. Tibial malpositioning: posterior gap between the tibia and
ibial component
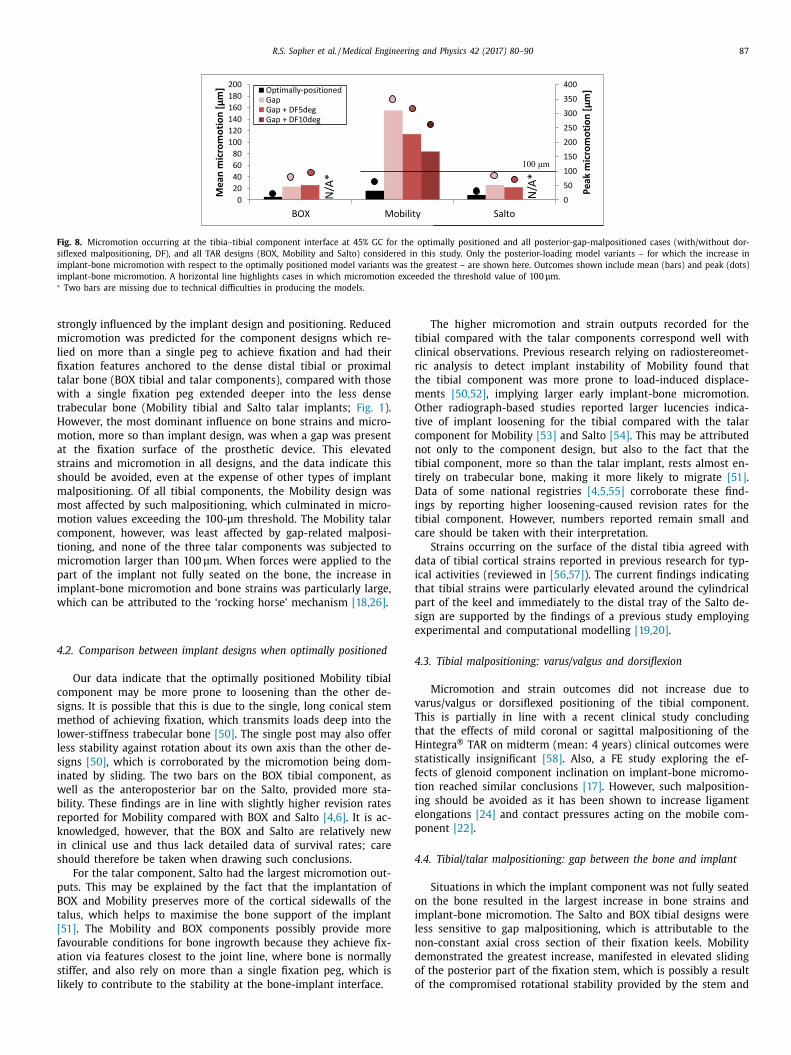
A gap at the posterior part of the tibial fixation surface caused a
onsiderable increase in micromotion for all designs (with respect
o the optimally positioned case), and this increase was largest
hen the PE component was located posteriorly ( Fig. 8 ). Mobility
howed the largest increase, with peak micromotion increasing up
o approximately 5.5-fold to exceed the threshold value of 100 μm.
or the BOX and Salto tibial components the posterior gap resulted
n a similar increase (percentagewise) in implant-bone micromo-
ion, although the magnitudes were far less ( Fig. 8 ). For all designs,
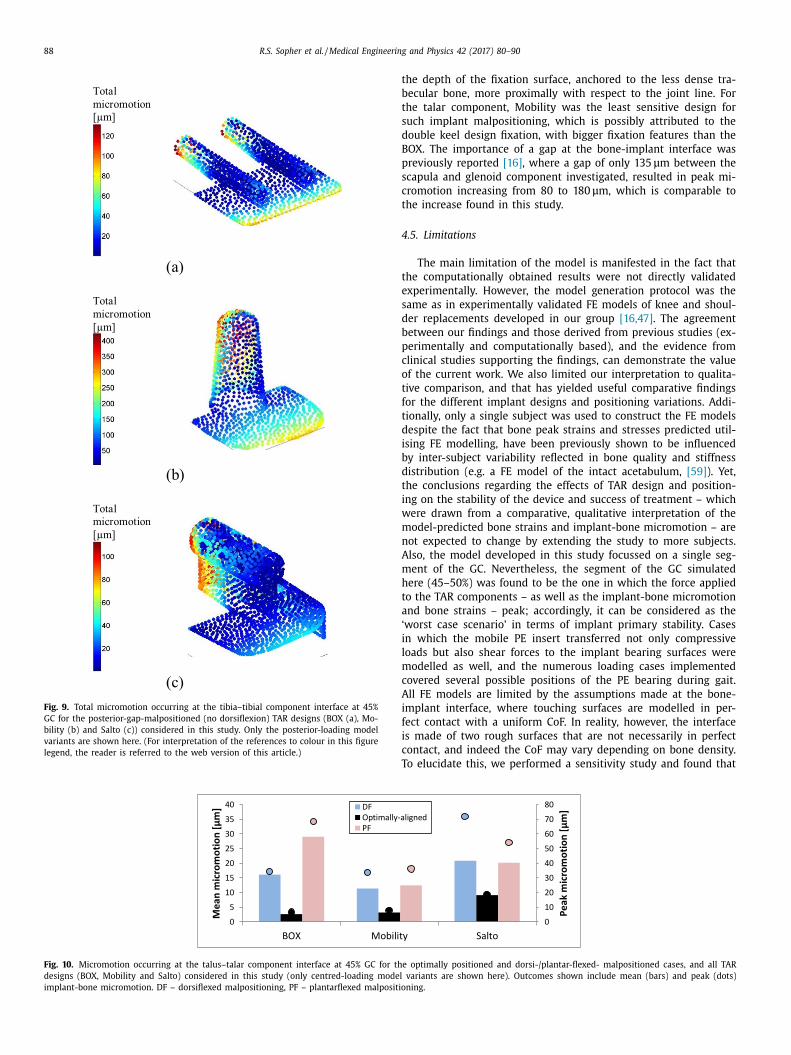
he increased micromotion was at the anterior of the tray (mainly
ormal movement) and posterior of the fixation keel(s) (mainly
angential movement; Fig. 9 ).
Peri-implant tibial strains were also elevated by posterior-gap
alpositioning. Particularly, ROI bone volumes subjected to above-
ield strains increased from 11% to up to 29% for the Mobility de-
ign (posterior loading); the increase was slightly smaller for BOX
from 13% to 23%) and smallest for Salto (from 7% to up to 9%). Dis-
ributions of tibial strains around the posterior-gap-malpositioned
mplant were similar to those of the optimally positioned model
ariants ( Section 3.1.1 ).
.2.4. Talar malpositioning: dorsiflexed/plantarflexed implantation
reating anterior/posterior gap between the bone and implant
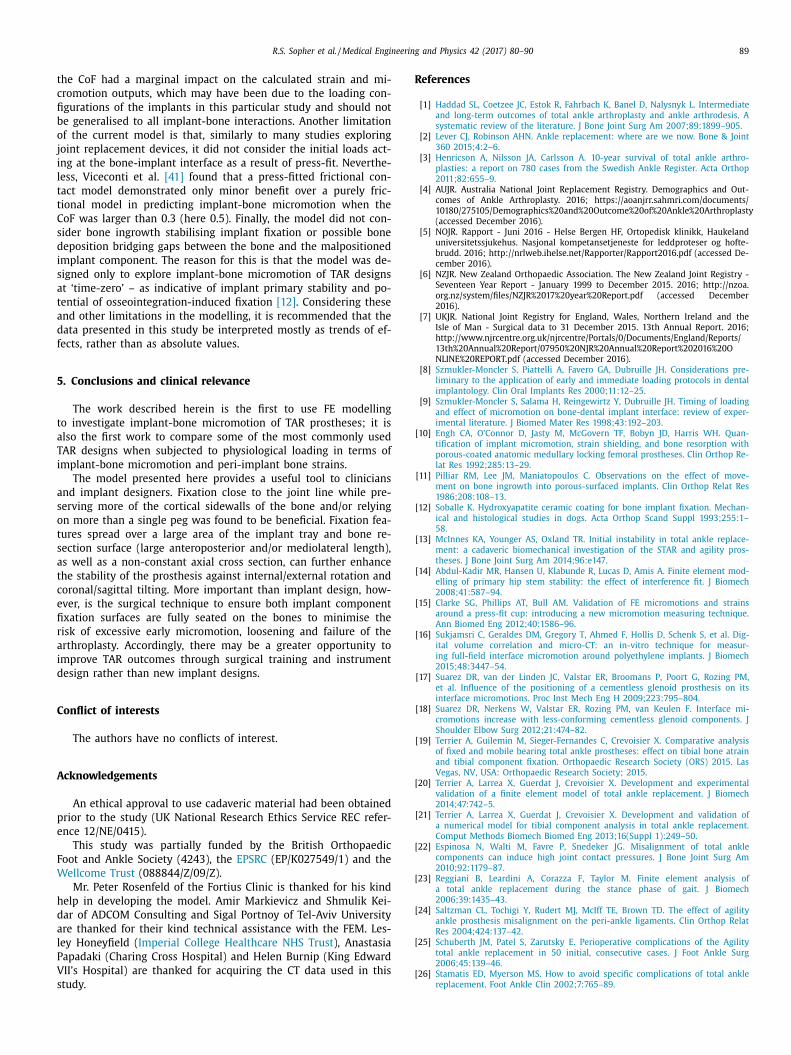
Dorsi-/plantar-flexed malpositioning of the talar component re-
ulted in a considerable increase in implant-bone micromotion
but for all designs, values remained below the 100-μm threshold;
ig. 10 ). Mobility demonstrated the smallest micromotion under
hese conditions. Anterior and posterior loading further increased
icromotion outcomes for the dorsiflexed and plantarflexed mal-
ositioned cases, respectively.
Peri-implant talar strains were also increased by dorsi-/plantar-
exed malpositioning of the talar component. Bone volumes sub-
ected to above-yield strains, for example, increased from 1% to up
o 7% for the malpositioned Salto, from < 1% to up to 4% for BOX
nd from > 1% to 2% for Mobility with centred loading. Anterior
nd posterior loading affected the dorsiflexed and plantarflexed
alpositioned cases to a greater extent. Talar strains at the dorsi-
plantar-flexed-malpositioned implant proximity peaked in regions
imilar to those in which they peaked for the optimally positioned
odel variants ( Section 3.1.2 ).
. Discussion
.1. Key findings
Qualitative interpretation of the results of this study demon-
trates that implant-bone micromotion and bone strains in TAR are
86 R.S. Sopher et al. / Medical Engineering and Physics 42 (2017) 80–90
Fig. 6. Total micromotion occurring at the interface between the bone (tibia/talus) and implant component at 45% GC for all TAR designs (BOX ((a), (d)), Mobility ((b), (e))
and Salto ((c), (f))) considered in this study (only centred-loading model variants are shown here). (For interpretation of the references to colour in this figure legend, the
reader is referred to the web version of this article.)
Fig. 7. % bone volume (bars) and bone volume in mm
3 (dots) contained in the tibial region of interest (1-cm distance from the bone-implant interface) subjected to strains
larger than yield strain (0.73% and 0.65% compressive and tensile strains, respectively), for all TAR designs (BOX, Mobility and Salto) considered in this study at 45% GC (only
centred-loading model variants are shown here).
R.S. Sopher et al. / Medical Engineering and Physics 42 (2017) 80–90 87
Fig. 8. Micromotion occurring at the tibia–tibial component interface at 45% GC for the optimally positioned and all posterior-gap-malpositioned cases (with/without dor-
siflexed malpositioning, DF), and all TAR designs (BOX, Mobility and Salto) considered in this study. Only the posterior-loading model variants – for which the increase in
implant-bone micromotion with respect to the optimally positioned model variants was the greatest – are shown here. Outcomes shown include mean (bars) and peak (dots)
implant-bone micromotion. A horizontal line highlights cases in which micromotion exceeded the threshold value of 100 μm. ∗ Two bars are missing due to technical difficulties in producing the models.
s
m
l
fi
t
w
t
H
m
a
s
s
m
m
m
c
t
m
p
i
w
4
c
s
m
l
l
s
i
w
b
r
k
i
s
p
B
t
[
f
a
s
l
t
c
r
t
m
O
t
c
n
t
t
D
i
t
c
d
i
t
p
s
e
4
v
T
t
H
s
f
t
i
e
p
4
o
i
l
n
d
o
o
trongly influenced by the implant design and positioning. Reduced
icromotion was predicted for the component designs which re-
ied on more than a single peg to achieve fixation and had their
xation features anchored to the dense distal tibial or proximal
alar bone (BOX tibial and talar components), compared with those
ith a single fixation peg extended deeper into the less dense
rabecular bone (Mobility tibial and Salto talar implants; Fig. 1 ).
owever, the most dominant influence on bone strains and micro-
otion, more so than implant design, was when a gap was present
t the fixation surface of the prosthetic device. This elevated
trains and micromotion in all designs, and the data indicate this
hould be avoided, even at the expense of other types of implant
alpositioning. Of all tibial components, the Mobility design was
ost affected by such malpositioning, which culminated in micro-
otion values exceeding the 100-μm threshold. The Mobility talar
omponent, however, was least affected by gap-related malposi-
ioning, and none of the three talar components was subjected to
icromotion larger than 100 μm. When forces were applied to the
art of the implant not fully seated on the bone, the increase in
mplant-bone micromotion and bone strains was particularly large,
hich can be attributed to the ‘rocking horse’ mechanism [18,26] .
.2. Comparison between implant designs when optimally positioned
Our data indicate that the optimally positioned Mobility tibial
omponent may be more prone to loosening than the other de-
igns. It is possible that this is due to the single, long conical stem
ethod of achieving fixation, which transmits loads deep into the
ower-stiffness trabecular bone [50] . The single post may also offer
ess stability against rotation about its own axis than the other de-
igns [50] , which is corroborated by the micromotion being dom-
nated by sliding. The two bars on the BOX tibial component, as
ell as the anteroposterior bar on the Salto, provided more sta-
ility. These findings are in line with slightly higher revision rates
eported for Mobility compared with BOX and Salto [4,6] . It is ac-
nowledged, however, that the BOX and Salto are relatively new
n clinical use and thus lack detailed data of survival rates; care
hould therefore be taken when drawing such conclusions.
For the talar component, Salto had the largest micromotion out-
uts. This may be explained by the fact that the implantation of
OX and Mobility preserves more of the cortical sidewalls of the
alus, which helps to maximise the bone support of the implant
51] . The Mobility and BOX components possibly provide more
avourable conditions for bone ingrowth because they achieve fix-
tion via features closest to the joint line, where bone is normally
tiffer, and also rely on more than a single fixation peg, which is
ikely to contribute to the stability at the bone-implant interface.
The higher micromotion and strain outputs recorded for the
ibial compared with the talar components correspond well with
linical observations. Previous research relying on radiostereomet-
ic analysis to detect implant instability of Mobility found that
he tibial component was more prone to load-induced displace-
ents [50,52] , implying larger early implant-bone micromotion.
ther radiograph-based studies reported larger lucencies indica-
ive of implant loosening for the tibial compared with the talar
omponent for Mobility [53] and Salto [54] . This may be attributed
ot only to the component design, but also to the fact that the
ibial component, more so than the talar implant, rests almost en-
irely on trabecular bone, making it more likely to migrate [51] .
ata of some national registries [4,5,55] corroborate these find-
ngs by reporting higher loosening-caused revision rates for the
ibial component. However, numbers reported remain small and
are should be taken with their interpretation.
Strains occurring on the surface of the distal tibia agreed with
ata of tibial cortical strains reported in previous research for typ-
cal activities (reviewed in [56,57] ). The current findings indicating
hat tibial strains were particularly elevated around the cylindrical
art of the keel and immediately to the distal tray of the Salto de-
ign are supported by the findings of a previous study employing
xperimental and computational modelling [19,20] .
.3. Tibial malpositioning: varus/valgus and dorsiflexion
Micromotion and strain outcomes did not increase due to
arus/valgus or dorsiflexed positioning of the tibial component.
his is partially in line with a recent clinical study concluding
hat the effects of mild coronal or sagittal malpositioning of the
integra ® TAR on midterm (mean: 4 years) clinical outcomes were
tatistically insignificant [58] . Also, a FE study exploring the ef-
ects of glenoid component inclination on implant-bone micromo-
ion reached similar conclusions [17] . However, such malposition-
ng should be avoided as it has been shown to increase ligament
longations [24] and contact pressures acting on the mobile com-
onent [22] .
.4. Tibial/talar malpositioning: gap between the bone and implant
Situations in which the implant component was not fully seated
n the bone resulted in the largest increase in bone strains and
mplant-bone micromotion. The Salto and BOX tibial designs were
ess sensitive to gap malpositioning, which is attributable to the
on-constant axial cross section of their fixation keels. Mobility
emonstrated the greatest increase, manifested in elevated sliding
f the posterior part of the fixation stem, which is possibly a result
f the compromised rotational stability provided by the stem and
88 R.S. Sopher et al. / Medical Engineering and Physics 42 (2017) 80–90
Fig. 9. Total micromotion occurring at the tibia–tibial component interface at 45%
GC for the posterior-gap-malpositioned (no dorsiflexion) TAR designs (BOX (a), Mo-
bility (b) and Salto (c)) considered in this study. Only the posterior-loading model
variants are shown here. (For interpretation of the references to colour in this figure
legend, the reader is referred to the web version of this article.)
t
b
t
s
d
B
p
s
c
t
4
t
e
s
d
b
p
c
o
t
f
t
d
i
b
d
t
i
w
m
n
A
m
h
t
a
‘
i
l
m
c
A
i
f
i
c
T
Fig. 10. Micromotion occurring at the talus–talar component interface at 45% GC for th
designs (BOX, Mobility and Salto) considered in this study (only centred-loading model
implant-bone micromotion. DF – dorsiflexed malpositioning, PF – plantarflexed malpositio
he depth of the fixation surface, anchored to the less dense tra-
ecular bone, more proximally with respect to the joint line. For
he talar component, Mobility was the least sensitive design for
uch implant malpositioning, which is possibly attributed to the
ouble keel design fixation, with bigger fixation features than the
OX. The importance of a gap at the bone-implant interface was
reviously reported [16] , where a gap of only 135 μm between the
capula and glenoid component investigated, resulted in peak mi-
romotion increasing from 80 to 180 μm, which is comparable to
he increase found in this study.
.5. Limitations
The main limitation of the model is manifested in the fact that
he computationally obtained results were not directly validated
xperimentally. However, the model generation protocol was the
ame as in experimentally validated FE models of knee and shoul-
er replacements developed in our group [16,47] . The agreement
etween our findings and those derived from previous studies (ex-
erimentally and computationally based), and the evidence from
linical studies supporting the findings, can demonstrate the value
f the current work. We also limited our interpretation to qualita-
ive comparison, and that has yielded useful comparative findings
or the different implant designs and positioning variations. Addi-
ionally, only a single subject was used to construct the FE models
espite the fact that bone peak strains and stresses predicted util-
sing FE modelling, have been previously shown to be influenced
y inter-subject variability reflected in bone quality and stiffness
istribution (e.g. a FE model of the intact acetabulum, [59] ). Yet,
he conclusions regarding the effects of TAR design and position-
ng on the stability of the device and success of treatment – which
ere drawn from a comparative, qualitative interpretation of the
odel-predicted bone strains and implant-bone micromotion – are
ot expected to change by extending the study to more subjects.
lso, the model developed in this study focussed on a single seg-
ent of the GC. Nevertheless, the segment of the GC simulated
ere (45–50%) was found to be the one in which the force applied
o the TAR components – as well as the implant-bone micromotion
nd bone strains – peak; accordingly, it can be considered as the
worst case scenario’ in terms of implant primary stability. Cases
n which the mobile PE insert transferred not only compressive
oads but also shear forces to the implant bearing surfaces were
odelled as well, and the numerous loading cases implemented
overed several possible positions of the PE bearing during gait.
ll FE models are limited by the assumptions made at the bone-
mplant interface, where touching surfaces are modelled in per-
ect contact with a uniform CoF. In reality, however, the interface
s made of two rough surfaces that are not necessarily in perfect
ontact, and indeed the CoF may vary depending on bone density.
o elucidate this, we performed a sensitivity study and found that
e optimally positioned and dorsi-/plantar-flexed- malpositioned cases, and all TAR
variants are shown here). Outcomes shown include mean (bars) and peak (dots)
ning.
R.S. Sopher et al. / Medical Engineering and Physics 42 (2017) 80–90 89
t
c
fi
b
o
j
i
l
t
t
C
s
d
i
s
a
t
a
d
f
5
t
a
T
i
a
s
o
t
s
a
t
c
e
fi
r
a
i
d
C
A
p
e
F
W
h
d
a
l
P
V
s
R
[
[
[
[
[
he CoF had a marginal impact on the calculated strain and mi-
romotion outputs, which may have been due to the loading con-
gurations of the implants in this particular study and should not
e generalised to all implant-bone interactions. Another limitation
f the current model is that, similarly to many studies exploring
oint replacement devices, it did not consider the initial loads act-
ng at the bone-implant interface as a result of press-fit. Neverthe-
ess, Viceconti et al. [41] found that a press-fitted frictional con-
act model demonstrated only minor benefit over a purely fric-
ional model in predicting implant-bone micromotion when the
oF was larger than 0.3 (here 0.5). Finally, the model did not con-
ider bone ingrowth stabilising implant fixation or possible bone
eposition bridging gaps between the bone and the malpositioned
mplant component. The reason for this is that the model was de-
igned only to explore implant-bone micromotion of TAR designs
t ‘time-zero’ – as indicative of implant primary stability and po-
ential of osseointegration-induced fixation [12] . Considering these
nd other limitations in the modelling, it is recommended that the
ata presented in this study be interpreted mostly as trends of ef-
ects, rather than as absolute values.
. Conclusions and clinical relevance
The work described herein is the first to use FE modelling
o investigate implant-bone micromotion of TAR prostheses; it is
lso the first work to compare some of the most commonly used
AR designs when subjected to physiological loading in terms of
mplant-bone micromotion and peri-implant bone strains.
The model presented here provides a useful tool to clinicians
nd implant designers. Fixation close to the joint line while pre-
erving more of the cortical sidewalls of the bone and/or relying
n more than a single peg was found to be beneficial. Fixation fea-
ures spread over a large area of the implant tray and bone re-
ection surface (large anteroposterior and/or mediolateral length),
s well as a non-constant axial cross section, can further enhance
he stability of the prosthesis against internal/external rotation and
oronal/sagittal tilting. More important than implant design, how-
ver, is the surgical technique to ensure both implant component
xation surfaces are fully seated on the bones to minimise the
isk of excessive early micromotion, loosening and failure of the
rthroplasty. Accordingly, there may be a greater opportunity to
mprove TAR outcomes through surgical training and instrument
esign rather than new implant designs.
onflict of interests
The authors have no conflicts of interest.
cknowledgements
An ethical approval to use cadaveric material had been obtained
rior to the study (UK National Research Ethics Service REC refer-
nce 12/NE/0415).
This study was partially funded by the British Orthopaedic
oot and Ankle Society (4243), the EPSRC (EP/K027549/1) and the
ellcome Trust (088844/Z/09/Z).
Mr. Peter Rosenfeld of the Fortius Clinic is thanked for his kind
elp in developing the model. Amir Markievicz and Shmulik Kei-
ar of ADCOM Consulting and Sigal Portnoy of Tel-Aviv University
re thanked for their kind technical assistance with the FEM. Les-
ey Honeyfield ( Imperial College Healthcare NHS Trust ), Anastasia
apadaki (Charing Cross Hospital) and Helen Burnip (King Edward
II’s Hospital) are thanked for acquiring the CT data used in this
tudy.
eferences
[1] Haddad SL , Coetzee JC , Estok R , Fahrbach K , Banel D , Nalysnyk L . Intermediate
and long-term outcomes of total ankle arthroplasty and ankle arthrodesis. A
systematic review of the literature. J Bone Joint Surg Am 2007;89:1899–905 . [2] Lever CJ , Robinson AHN . Ankle replacement: where are we now. Bone & Joint
360 2015;4:2–6 . [3] Henricson A , Nilsson JA , Carlsson A . 10-year survival of total ankle arthro-
plasties: a report on 780 cases from the Swedish Ankle Register. Acta Orthop2011;82:655–9 .
[4] AUJR. Australia National Joint Replacement Registry. Demographics and Out-
comes of Ankle Arthroplasty. 2016; https://aoanjrr.sahmri.com/documents/ 10180/275105/Demographics%20and%20Outcome%20of%20Ankle%20Arthroplasty
(accessed December 2016). [5] NOJR. Rapport - Juni 2016 - Helse Bergen HF, Ortopedisk klinikk, Haukeland
universitetssjukehus. Nasjonal kompetansetjeneste for leddproteser og hofte-brudd. 2016; http://nrlweb.ihelse.net/Rapporter/Rapport2016.pdf (accessed De-
cember 2016). [6] NZJR. New Zealand Orthopaedic Association. The New Zealand Joint Registry -
Seventeen Year Report - January 1999 to December 2015. 2016; http://nzoa.
org.nz/system/files/NZJR%2017%20year%20Report.pdf (accessed December 2016).
[7] UKJR. National Joint Registry for England, Wales, Northern Ireland and theIsle of Man - Surgical data to 31 December 2015. 13th Annual Report. 2016;
http://www.njrcentre.org.uk/njrcentre/Portals/0/Documents/England/Reports/ 13th%20Annual%20Report/07950%20NJR%20Annual%20Report%202016%20O
NLINE%20REPORT.pdf (accessed December 2016).
[8] Szmukler-Moncler S , Piattelli A , Favero GA , Dubruille JH . Considerations pre-liminary to the application of early and immediate loading protocols in dental
implantology. Clin Oral Implants Res 20 0 0;11:12–25 . [9] Szmukler-Moncler S , Salama H , Reingewirtz Y , Dubruille JH . Timing of loading
and effect of micromotion on bone-dental implant interface: review of exper-imental literature. J Biomed Mater Res 1998;43:192–203 .
[10] Engh CA , O’Connor D , Jasty M , McGovern TF , Bobyn JD , Harris WH . Quan-
tification of implant micromotion, strain shielding, and bone resorption withporous-coated anatomic medullary locking femoral prostheses. Clin Orthop Re-
lat Res 1992;285:13–29 . [11] Pilliar RM , Lee JM , Maniatopoulos C . Observations on the effect of move-
ment on bone ingrowth into porous-surfaced implants. Clin Orthop Relat Res1986;208:108–13 .
[12] Soballe K . Hydroxyapatite ceramic coating for bone implant fixation. Mechan-
ical and histological studies in dogs. Acta Orthop Scand Suppl 1993;255:1–58 .
[13] McInnes KA , Younger AS , Oxland TR . Initial instability in total ankle replace-ment: a cadaveric biomechanical investigation of the STAR and agility pros-
theses. J Bone Joint Surg Am 2014;96:e147 . [14] Abdul-Kadir MR , Hansen U , Klabunde R , Lucas D , Amis A . Finite element mod-
elling of primary hip stem stability: the effect of interference fit. J Biomech
2008;41:587–94 . [15] Clarke SG , Phillips AT , Bull AM . Validation of FE micromotions and strains
around a press-fit cup: introducing a new micromotion measuring technique.Ann Biomed Eng 2012;40:1586–96 .
[16] Sukjamsri C , Geraldes DM , Gregory T , Ahmed F , Hollis D , Schenk S , et al. Dig-ital volume correlation and micro-CT: an in-vitro technique for measur-
ing full-field interface micromotion around polyethylene implants. J Biomech
2015;48:3447–54 . [17] Suarez DR , van der Linden JC , Valstar ER , Broomans P , Poort G , Rozing PM ,
et al. Influence of the positioning of a cementless glenoid prosthesis on itsinterface micromotions. Proc Inst Mech Eng H 2009;223:795–804 .
[18] Suarez DR , Nerkens W , Valstar ER , Rozing PM , van Keulen F . Interface mi-cromotions increase with less-conforming cementless glenoid components. J
Shoulder Elbow Surg 2012;21:474–82 . [19] Terrier A , Guilemin M , Sieger-Fernandes C , Crevoisier X . Comparative analysis
of fixed and mobile bearing total ankle prostheses: effect on tibial bone atrain
and tibial component fixation. Orthopaedic Research Society (ORS) 2015. LasVegas, NV, USA: Orthopaedic Research Society; 2015 .
20] Terrier A , Larrea X , Guerdat J , Crevoisier X . Development and experimentalvalidation of a finite element model of total ankle replacement. J Biomech
2014;47:742–5 . [21] Terrier A , Larrea X , Guerdat J , Crevoisier X . Development and validation of
a numerical model for tibial component analysis in total ankle replacement.
Comput Methods Biomech Biomed Eng 2013;16(Suppl 1):249–50 . 22] Espinosa N , Walti M , Favre P , Snedeker JG . Misalignment of total ankle
components can induce high joint contact pressures. J Bone Joint Surg Am2010;92:1179–87 .
23] Reggiani B , Leardini A , Corazza F , Taylor M . Finite element analysis ofa total ankle replacement during the stance phase of gait. J Biomech
2006;39:1435–43 .
[24] Saltzman CL , Tochigi Y , Rudert MJ , McIff TE , Brown TD . The effect of agilityankle prosthesis misalignment on the peri-ankle ligaments. Clin Orthop Relat
Res 2004;424:137–42 . 25] Schuberth JM , Patel S , Zarutsky E . Perioperative complications of the Agility
total ankle replacement in 50 initial, consecutive cases. J Foot Ankle Surg2006;45:139–46 .
26] Stamatis ED , Myerson MS . How to avoid specific complications of total ankle
replacement. Foot Ankle Clin 2002;7:765–89 .
90 R.S. Sopher et al. / Medical Engineering and Physics 42 (2017) 80–90
[
[27] Doets HC , Brand R , Nelissen RG . Total ankle arthroplasty in inflammatoryjoint disease with use of two mobile-bearing designs. J Bone Joint Surg Am
2006;88:1272–84 . [28] DePuy. DePuy. Mobility Total Ankle System Surgical Technique. 2005;
http://www.rpa.spot.pt/getdoc/5243102b-0def-4108-a82f-8b59568ad3b7/ Mobility-Total-Ankle-Surgical-Technique.aspx (accessed June 2014).
[29] Finsbury. Finsbury Orthopaedics. BOX Ankle Operative Technique. 2010;http://www.artro.it/Repository/File/Box%20Ankle%20Optec%20Jun%202005.pdf
(accessed June 2014).
[30] Tornier. Tornier Surgical Implants. Salto (Mobile Version) Total Ankle ProsthesisSurgical Technique. 2009; http://www.rpa.spot.pt/getdoc/6065d9a6-dd01-46cf-
b5f9-f6f73ed785d5/Salto-II-(1).aspx (accessed June 2014). [31] Tornier. Tornier Surgical Implants. Salto Talaris Instrumentation II. 2009;
http://www.peggerssupersummaries.com/wp-content/uploads/2013/12/SALT- TORNIER-TOTAL-ANKLE-REPLACEMENT-UNCEMENTED.pdf (accessed June
2014).
[32] Jung HG , Nicholson JJ , Parks B , Myerson MS . Radiographic and biomechani-cal support for fibular plating of the agility total ankle. Clin Orthop Relat Res
2004;424:118–24 . [33] Conti SF , Wong YS . Complications of total ankle replacement. Foot Ankle Clin
N Am 2001;7:791–807 . [34] McBroom RJ , Hayes WC , Edwards WT , Goldberg RP , White AAD . Prediction of
vertebral body compressive fracture using quantitative computed tomography.
J Bone Joint Surg Am 1985;67:1206–14 . [35] Morgan EF , Bayraktar HH , Keaveny TM . Trabecular bone modulus-density rela-
tionships depend on anatomic site. J Biomech 2003;36:897–904 . [36] Snyder SM , Schneider E . Estimation of mechanical properties of cortical bone
by computed tomography. J Orthop Res 1991;9:422–31 . [37] Keyak JH , Lee IY , Skinner HB . Correlations between orthogonal mechanical
properties and density of trabecular bone: use of different densitometric mea-
sures. J Biomed Mater Res 1994;28:1329–36 . [38] Tuncer M , Hansen UN , Amis AA . Prediction of structural failure of tibial bone
models under physiological loads: effect of CT density-modulus relationships.Med Eng Phys 2014;36:991–7 discussion .
[39] Shirazi-Adl A , Dammak M , Paiement G . Experimental determination of fric-tion characteristics at the trabecular bone/porous-coated metal interface in ce-
mentless implants. J Biomed Mater Res 1993;27:167–75 .
[40] Bernakiewicz M , Viceconti M . The role of parameter identification in finite el-ement contact analyses with reference to orthopaedic biomechanics applica-
tions. J Biomech 2002;35:61–7 . [41] Viceconti M , Muccini R , Bernakiewicz M , Baleani M , Cristofolini L . Large-slid-
ing contact elements accurately predict levels of bone-implant micromotionrelevant to osseointegration. J Biomech 20 0 0;33:1611–18 .
[42] Sopher RS , Amis AA , Davies DC , Jeffers JR . The influence of muscle pennation
angle and cross-sectional area on contact forces in the ankle joint. J Strain AnalEng Des 2017;52:12–23 .
[43] Procter P , Paul JP . Ankle joint biomechanics. J Biomech 1982;15:627–34 . 44] Seireg A , Arvikar . The prediction of muscular lad sharing and joint forces in
the lower extremities during walking. J Biomech 1975;8:89–102 . [45] Stauffer RN , Chao EY , Brewster RC . Force and motion analysis of the
normal, diseased, and prosthetic ankle joint. Clin Orthop Relat Res1977;127:189–96 .
[46] Revell PA . Joint replacement technology. 1st ed. UK: Woodhead Publishing;2008 .
[47] Tuncer M , Cobb JP , Hansen UN , Amis AA . Validation of multiple subject-spe-
cific finite element models of unicompartmental knee replacement. Med EngPhys 2013;35:1457–64 .
[48] Brunski JB . Avoid pitfalls of overloading and micromotion of intraosseous im-plants. Dent Implantol Update 1993;4:77–81 .
[49] Morgan EF , Keaveny TM . Dependence of yield strain of human trabecular boneon anatomic site. J Biomech 2001;34:569–77 .
[50] Dunbar MJ , Fong JW , Wilson DA , Hennigar AW , Francis PA , Glazebrook MA .
Longitudinal migration and inducible displacement of the Mobility Total AnkleSystem. Acta Orthop 2012;83:394–400 .
[51] Wood PL , Crawford LA , Suneja R , Kenyon A . Total ankle replacement forrheumatoid ankle arthritis. Foot Ankle Clin 2007;12:497–508 vii .
[52] Fong JW , Veljkovic A , Dunbar MJ , Wilson DA , Hennigar AW , Glazebrook MA .Validation and precision of model-based radiostereometric analysis (MBRSA)
for total ankle arthroplasty. Foot Ankle Int 2011;32:1155–63 .
[53] Wood PL , Karski MT , Watmough P . Total ankle replacement: the results of 100Mobility total ankle replacements. J Bone Joint Surg Br 2010;92:958–62 .
[54] Schweitzer KM , Adams SB , Viens NA , Queen RM , Easley ME , Deorio JK ,et al. Early prospective clinical results of a modern fixed-bearing total ankle
arthroplasty. J Bone Joint Surg Am 2013;95:1002–11 . [55] Skytta ET , Koivu H , Eskelinen A , Ikavalko M , Paavolainen P , Remes V . Total
ankle replacement: a population-based study of 515 cases from the Finnish
Arthroplasty Register. Acta Orthop 2010;81:114–18 . [56] Al Nazer R , Lanovaz J , Kawalilak C , Johnston JD , Kontulainen S . Direct in
vivo strain measurements in human bone – a systematic literature review. JBiomech 2012;45:27–40 .
[57] Yang PF , Bruggemann GP , Rittweger J . What do we currently know from invivo bone strain measurements in humans. J Musculoskelet Neuronal Interact
2011;11:8–20 .
[58] Braito M , Dammerer D , Reinthaler A , Kaufmann G , Huber D , Biedermann R .Effect of coronal and sagittal alignment on outcome after mobile-bearing total
ankle replacement. Foot Ankle Int 2015;36:1029–37 . [59] Clarke SG , Phillips AT , Bull AM . Evaluating a suitable level of model complexity
for finite element analysis of the intact acetabulum. Comput Methods BiomechBiomed Eng 2013;16:717–24 .