MATERIALS AND METHODS - Shodhgangashodhganga.inflibnet.ac.in/bitstream/10603/20586/14... ·...
24
Materials and Methods MATERIALS AND METHODS 3.1 Pesticides and chemicals Lindane/γ-Hexachlorocyclohexane (γ-HCH, 99% pure) was purchased from Sigma Chemical Co., USA. HCH-muck was a generous gift from Kanoria Chemicals and Industries Ltd. (U.P., India). Alufolein kiesel gel 60 F 254 plates were purchased from Merck (Darmstadt, Germany). Acetone and ethyl acetate (purity >99.0%) were purchased from Thomas Baker, Mumbai, India. The media components were purchased from HiMedia Lab., India. All other solvents and reagents used were of highest available purity. The oligonucleotide primers for polymerase chain reaction (PCR) were supplied by Sigma-Genosys (USA) and PCR reaction-mix was purchased from Genei, Bangalore, India. 3.2 Media used 3.2.1 Medium used for growth and storage of isolates: The cultures were grown in nutrient broth and were stored on nutrient agar slants at 4°C. The stored microbial strains were sub-cultured every month. The cells were also maintained as 20% (v/v) glycerol stock in nutrient broth at -80°C. The composition of the nutrient agar medium used is as given below: Components Quantity (g l -1 ) Peptone - 5.00 Beef extract - 3.00 NaCl - 5.00 Agar-agar - 20.0 Distilled water to make - 1000 ml pH - 7.0 3.2.2 Biosurfactant production medium: Mineral salt medium (MSM) of the following composition was used for biosurfactant production studies, unless specified otherwise. 47
Transcript of MATERIALS AND METHODS - Shodhgangashodhganga.inflibnet.ac.in/bitstream/10603/20586/14... ·...
Materials and Methods
MATERIALS AND METHODS
3.1 Pesticides and chemicals
Lindane/γ-Hexachlorocyclohexane (γ-HCH, 99% pure) was purchased from
Sigma Chemical Co., USA. HCH-muck was a generous gift from Kanoria Chemicals and
Industries Ltd. (U.P., India). Alufolein kiesel gel 60 F254 plates were purchased from
Merck (Darmstadt, Germany). Acetone and ethyl acetate (purity >99.0%) were purchased
from Thomas Baker, Mumbai, India. The media components were purchased from
HiMedia Lab., India. All other solvents and reagents used were of highest available
purity. The oligonucleotide primers for polymerase chain reaction (PCR) were supplied
by Sigma-Genosys (USA) and PCR reaction-mix was purchased from Genei, Bangalore,
India.
3.2 Media used
3.2.1 Medium used for growth and storage of isolates:
The cultures were grown in nutrient broth and were stored on nutrient agar slants
at 4°C. The stored microbial strains were sub-cultured every month. The cells were also
maintained as 20% (v/v) glycerol stock in nutrient broth at -80°C. The composition of the
nutrient agar medium used is as given below:
Components Quantity (g l-1)
Peptone - 5.00
Beef extract - 3.00
NaCl - 5.00
Agar-agar - 20.0
Distilled water to make - 1000 ml
pH - 7.0
3.2.2 Biosurfactant production medium:
Mineral salt medium (MSM) of the following composition was used for
biosurfactant production studies, unless specified otherwise.
47
Materials and Methods
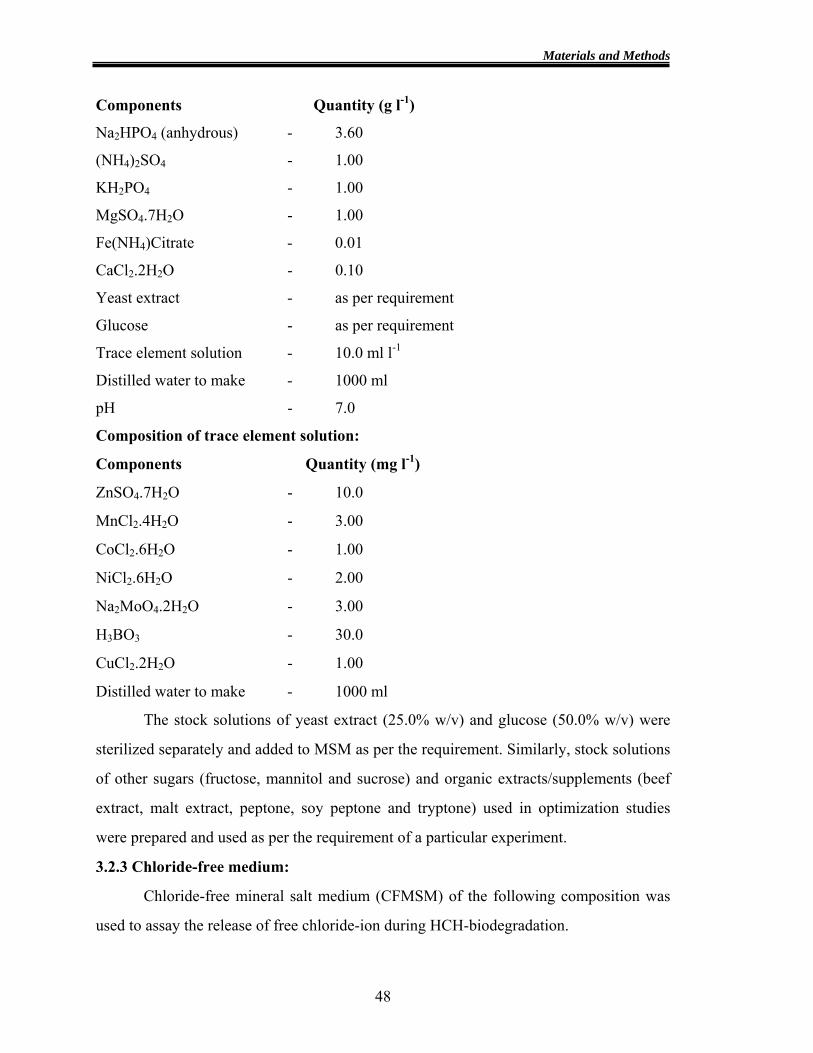
Components Quantity (g l-1)
Na2HPO4 (anhydrous) - 3.60
(NH4)2SO4 - 1.00
KH2PO4 - 1.00
MgSO4.7H2O - 1.00
Fe(NH4)Citrate - 0.01
CaCl2.2H2O - 0.10
Yeast extract - as per requirement
Glucose - as per requirement
Trace element solution - 10.0 ml l-1
Distilled water to make - 1000 ml
pH - 7.0
Composition of trace element solution:
Components Quantity (mg l-1)
ZnSO4.7H2O - 10.0
MnCl2.4H2O - 3.00
CoCl2.6H2O - 1.00
NiCl2.6H2O - 2.00
Na2MoO4.2H2O - 3.00
H3BO3 - 30.0
CuCl2.2H2O - 1.00
Distilled water to make - 1000 ml
The stock solutions of yeast extract (25.0% w/v) and glucose (50.0% w/v) were
sterilized separately and added to MSM as per the requirement. Similarly, stock solutions
of other sugars (fructose, mannitol and sucrose) and organic extracts/supplements (beef
extract, malt extract, peptone, soy peptone and tryptone) used in optimization studies
were prepared and used as per the requirement of a particular experiment.
3.2.3 Chloride-free medium:
Chloride-free mineral salt medium (CFMSM) of the following composition was
used to assay the release of free chloride-ion during HCH-biodegradation.
48
Materials and Methods
Components Quantity (g l-1)
Na2HPO4 (anhydrous) - 3.60
(NH4)2SO4 - 1.00
KH2PO4 - 1.00
MgSO4.7H2O - 1.00
Fe(NH4)Citrate - 0.01
Ca(NO3)2 - 0.10
Distilled water to make - 1000 ml
pH - 7.0
3.3 Isolation of microbial strains
3.3.1 Isolation of biosurfactant-producing microorganisms:
The microbial populations in soil samples collected from sites contaminated with
petrochemicals (petrol stations, motor workshops, etc.) were isolated. The soil samples
were collected in plastic bags from just below the surface, appropriately labeled and
stored at 4°C. To a 9 ml water blank, 1 g of soil sample was added and contents of the
test tube were vortexed and the suspension was used as inoculum (10% v/v) to inoculate
50 ml MSM in 250 ml Erlenmeyer flask supplemented with 0.1% (w/v) yeast extract.
Different supplements viz. n-hexadecane, diesel-petrol mix (1:1), mobile oil and
vegetable oil were added at the rate of 2.0% (v/v) to the respective flasks for enrichment
of microbial populations present in the soil samples. The flasks were incubated at 30°C
on an orbital shaker at 100 rpm. The cell suspension was used as 10% (v/v) inoculum in
fresh MSM medium, containing respective the carbon sources to further enrich the
microbial populations, after every 15 days for a period of two months. At each transfer, 1
ml of sample was withdrawn and serially diluted and 0.1 ml of the appropriately diluted
culture broth was spread plated onto MSM agar plates supplemented with 0.1% (w/v)
yeast extract and 2.0% (v/v) of the respective carbon sources, separately. The plates were
incubated at 30°C and observed for growth. Morphologically distinct bacterial colonies
were isolated and purified.
49
Materials and Methods
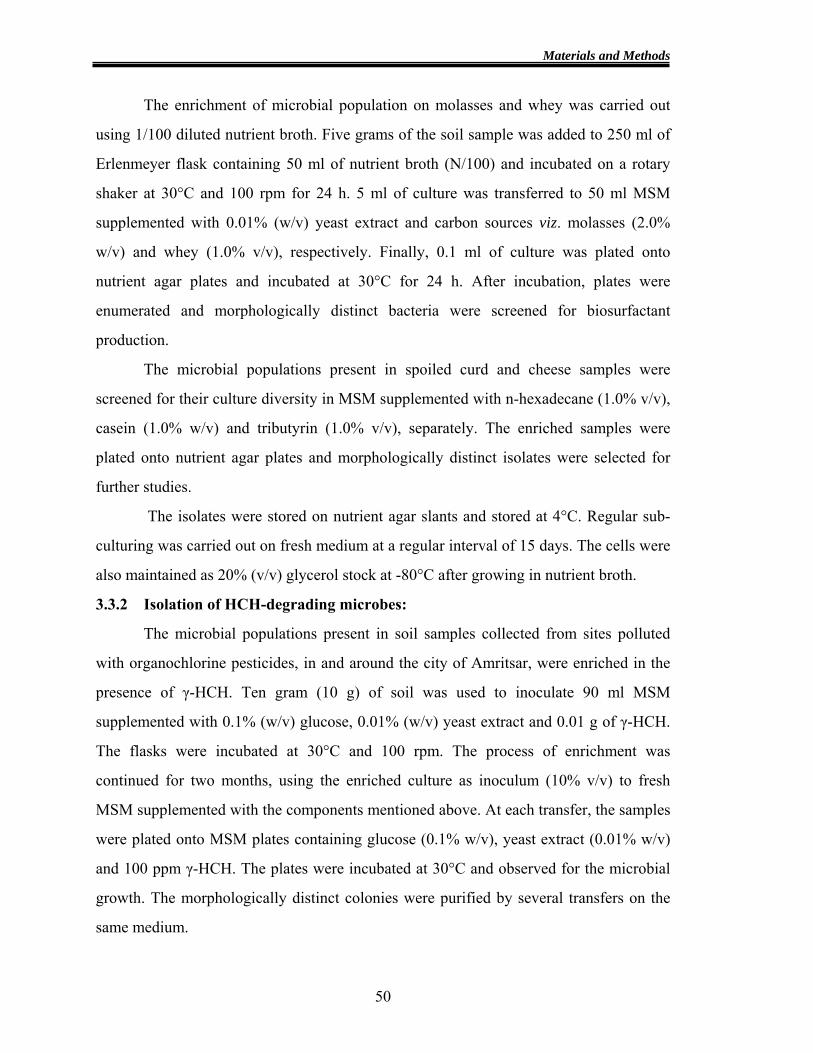
The enrichment of microbial population on molasses and whey was carried out
using 1/100 diluted nutrient broth. Five grams of the soil sample was added to 250 ml of
Erlenmeyer flask containing 50 ml of nutrient broth (N/100) and incubated on a rotary
shaker at 30°C and 100 rpm for 24 h. 5 ml of culture was transferred to 50 ml MSM
supplemented with 0.01% (w/v) yeast extract and carbon sources viz. molasses (2.0%
w/v) and whey (1.0% v/v), respectively. Finally, 0.1 ml of culture was plated onto
nutrient agar plates and incubated at 30°C for 24 h. After incubation, plates were
enumerated and morphologically distinct bacteria were screened for biosurfactant
production.
The microbial populations present in spoiled curd and cheese samples were
screened for their culture diversity in MSM supplemented with n-hexadecane (1.0% v/v),
casein (1.0% w/v) and tributyrin (1.0% v/v), separately. The enriched samples were
plated onto nutrient agar plates and morphologically distinct isolates were selected for
further studies.
The isolates were stored on nutrient agar slants and stored at 4°C. Regular sub-
culturing was carried out on fresh medium at a regular interval of 15 days. The cells were
also maintained as 20% (v/v) glycerol stock at -80°C after growing in nutrient broth.
3.3.2 Isolation of HCH-degrading microbes:
The microbial populations present in soil samples collected from sites polluted
with organochlorine pesticides, in and around the city of Amritsar, were enriched in the
presence of γ-HCH. Ten gram (10 g) of soil was used to inoculate 90 ml MSM
supplemented with 0.1% (w/v) glucose, 0.01% (w/v) yeast extract and 0.01 g of γ-HCH.
The flasks were incubated at 30°C and 100 rpm. The process of enrichment was
continued for two months, using the enriched culture as inoculum (10% v/v) to fresh
MSM supplemented with the components mentioned above. At each transfer, the samples
were plated onto MSM plates containing glucose (0.1% w/v), yeast extract (0.01% w/v)
and 100 ppm γ-HCH. The plates were incubated at 30°C and observed for the microbial
growth. The morphologically distinct colonies were purified by several transfers on the
same medium.
50
Materials and Methods
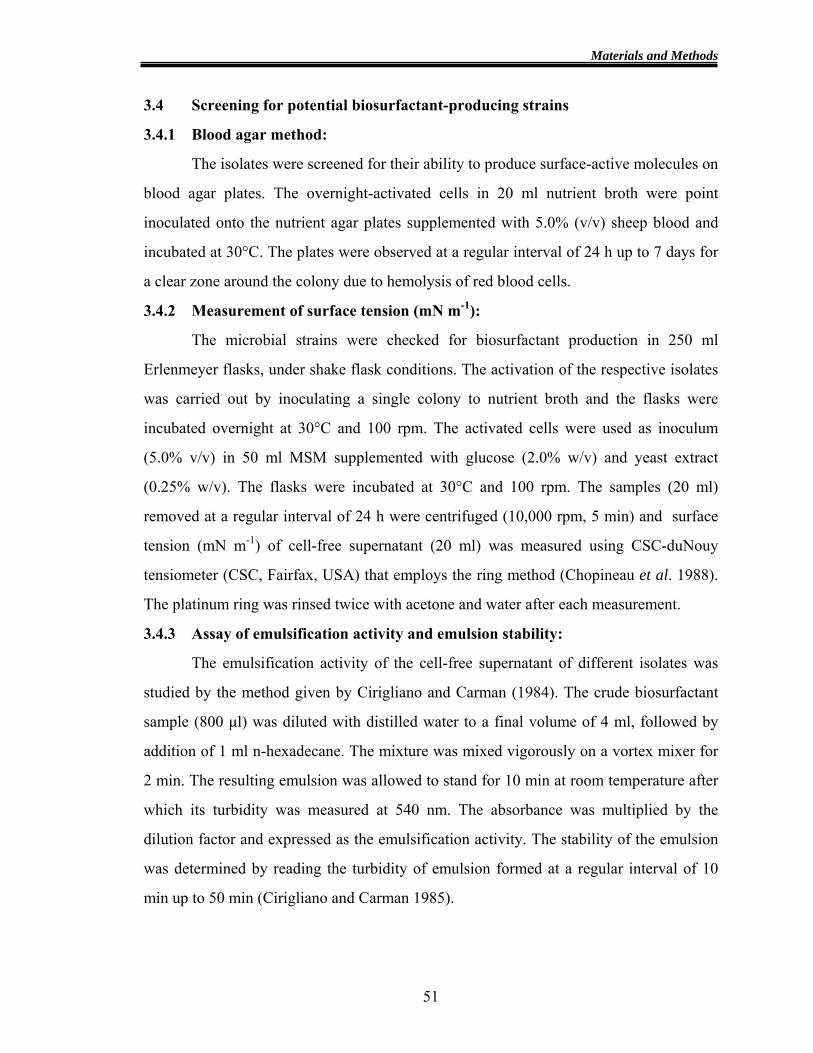
3.4 Screening for potential biosurfactant-producing strains
3.4.1 Blood agar method:
The isolates were screened for their ability to produce surface-active molecules on
blood agar plates. The overnight-activated cells in 20 ml nutrient broth were point
inoculated onto the nutrient agar plates supplemented with 5.0% (v/v) sheep blood and
incubated at 30°C. The plates were observed at a regular interval of 24 h up to 7 days for
a clear zone around the colony due to hemolysis of red blood cells.
3.4.2 Measurement of surface tension (mN m-1):
The microbial strains were checked for biosurfactant production in 250 ml
Erlenmeyer flasks, under shake flask conditions. The activation of the respective isolates
was carried out by inoculating a single colony to nutrient broth and the flasks were
incubated overnight at 30°C and 100 rpm. The activated cells were used as inoculum
(5.0% v/v) in 50 ml MSM supplemented with glucose (2.0% w/v) and yeast extract
(0.25% w/v). The flasks were incubated at 30°C and 100 rpm. The samples (20 ml)
removed at a regular interval of 24 h were centrifuged (10,000 rpm, 5 min) and surface
tension (mN m-1) of cell-free supernatant (20 ml) was measured using CSC-duNouy
tensiometer (CSC, Fairfax, USA) that employs the ring method (Chopineau et al. 1988).
The platinum ring was rinsed twice with acetone and water after each measurement.
3.4.3 Assay of emulsification activity and emulsion stability:
The emulsification activity of the cell-free supernatant of different isolates was
studied by the method given by Cirigliano and Carman (1984). The crude biosurfactant
sample (800 µl) was diluted with distilled water to a final volume of 4 ml, followed by
addition of 1 ml n-hexadecane. The mixture was mixed vigorously on a vortex mixer for
2 min. The resulting emulsion was allowed to stand for 10 min at room temperature after
which its turbidity was measured at 540 nm. The absorbance was multiplied by the
dilution factor and expressed as the emulsification activity. The stability of the emulsion
was determined by reading the turbidity of emulsion formed at a regular interval of 10
min up to 50 min (Cirigliano and Carman 1985).
51
Materials and Methods
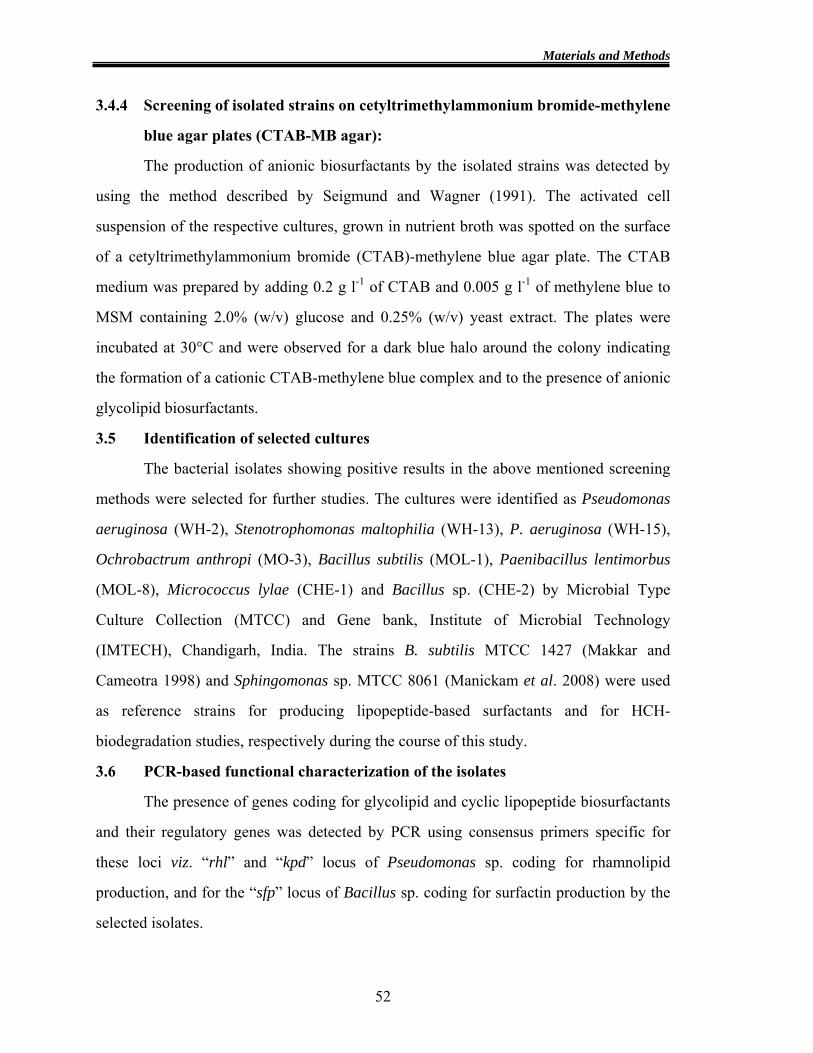
3.4.4 Screening of isolated strains on cetyltrimethylammonium bromide-methylene
blue agar plates (CTAB-MB agar):
The production of anionic biosurfactants by the isolated strains was detected by
using the method described by Seigmund and Wagner (1991). The activated cell
suspension of the respective cultures, grown in nutrient broth was spotted on the surface
of a cetyltrimethylammonium bromide (CTAB)-methylene blue agar plate. The CTAB
medium was prepared by adding 0.2 g l-1 of CTAB and 0.005 g l-1 of methylene blue to
MSM containing 2.0% (w/v) glucose and 0.25% (w/v) yeast extract. The plates were
incubated at 30°C and were observed for a dark blue halo around the colony indicating
the formation of a cationic CTAB-methylene blue complex and to the presence of anionic
glycolipid biosurfactants.
3.5 Identification of selected cultures
The bacterial isolates showing positive results in the above mentioned screening
methods were selected for further studies. The cultures were identified as Pseudomonas
aeruginosa (WH-2), Stenotrophomonas maltophilia (WH-13), P. aeruginosa (WH-15),
Ochrobactrum anthropi (MO-3), Bacillus subtilis (MOL-1), Paenibacillus lentimorbus
(MOL-8), Micrococcus lylae (CHE-1) and Bacillus sp. (CHE-2) by Microbial Type
Culture Collection (MTCC) and Gene bank, Institute of Microbial Technology
(IMTECH), Chandigarh, India. The strains B. subtilis MTCC 1427 (Makkar and
Cameotra 1998) and Sphingomonas sp. MTCC 8061 (Manickam et al. 2008) were used
as reference strains for producing lipopeptide-based surfactants and for HCH-
biodegradation studies, respectively during the course of this study.
3.6 PCR-based functional characterization of the isolates
The presence of genes coding for glycolipid and cyclic lipopeptide biosurfactants
and their regulatory genes was detected by PCR using consensus primers specific for
these loci viz. “rhl” and “kpd” locus of Pseudomonas sp. coding for rhamnolipid
production, and for the “sfp” locus of Bacillus sp. coding for surfactin production by the
selected isolates.
52
Materials and Methods
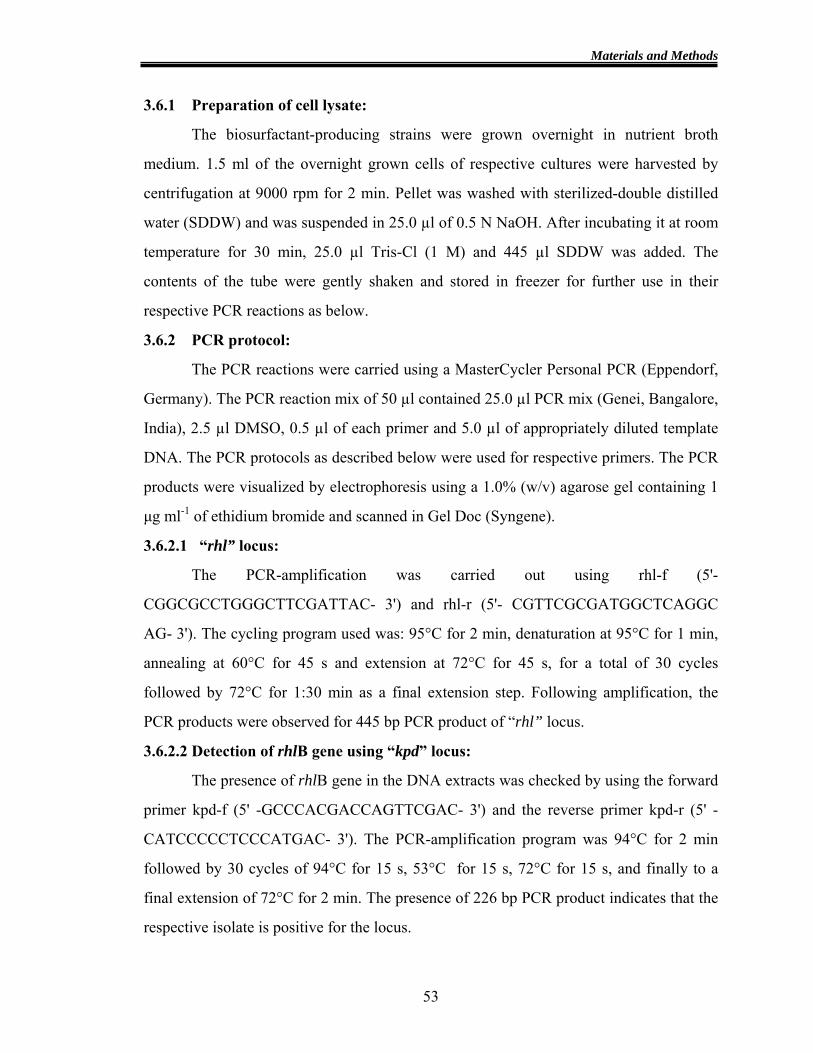
3.6.1 Preparation of cell lysate:
The biosurfactant-producing strains were grown overnight in nutrient broth
medium. 1.5 ml of the overnight grown cells of respective cultures were harvested by
centrifugation at 9000 rpm for 2 min. Pellet was washed with sterilized-double distilled
water (SDDW) and was suspended in 25.0 µl of 0.5 N NaOH. After incubating it at room
temperature for 30 min, 25.0 µl Tris-Cl (1 M) and 445 µl SDDW was added. The
contents of the tube were gently shaken and stored in freezer for further use in their
respective PCR reactions as below.
3.6.2 PCR protocol:
The PCR reactions were carried using a MasterCycler Personal PCR (Eppendorf,
Germany). The PCR reaction mix of 50 µl contained 25.0 µl PCR mix (Genei, Bangalore,
India), 2.5 µl DMSO, 0.5 µl of each primer and 5.0 µl of appropriately diluted template
DNA. The PCR protocols as described below were used for respective primers. The PCR
products were visualized by electrophoresis using a 1.0% (w/v) agarose gel containing 1
µg ml-1 of ethidium bromide and scanned in Gel Doc (Syngene).
3.6.2.1 “rhl” locus:
The PCR-amplification was carried out using rhl-f (5'-
CGGCGCCTGGGCTTCGATTAC- 3') and rhl-r (5'- CGTTCGCGATGGCTCAGGC
AG- 3'). The cycling program used was: 95°C for 2 min, denaturation at 95°C for 1 min,
annealing at 60°C for 45 s and extension at 72°C for 45 s, for a total of 30 cycles
followed by 72°C for 1:30 min as a final extension step. Following amplification, the
PCR products were observed for 445 bp PCR product of “rhl” locus.
3.6.2.2 Detection of rhlB gene using “kpd” locus:
The presence of rhlB gene in the DNA extracts was checked by using the forward
primer kpd-f (5' -GCCCACGACCAGTTCGAC- 3') and the reverse primer kpd-r (5' -
CATCCCCCTCCCATGAC- 3'). The PCR-amplification program was 94°C for 2 min
followed by 30 cycles of 94°C for 15 s, 53°C for 15 s, 72°C for 15 s, and finally to a
final extension of 72°C for 2 min. The presence of 226 bp PCR product indicates that the
respective isolate is positive for the locus.
53

Materials and Methods
3.6.2.3 “sfp” locus:
The forward primer sfp-f (5' –ATGAAGATTTACGGAATTTA- 3') and reverse
primer sfp-r (5' -TTATAAAAGCTCTTCGTACG- 3') was used for amplification of the
regulatory gene “sfp”. The PCR protocol was as follows: initial denaturation at 95°C for
2 min was followed by cycling events of 95°C for 1 min, annealing at 46°C for 30 s and
extension at 72°C for 1 min, for a total of 24 cycles. It was followed by a final extension
step at 72°C for 2 min. A PCR product of 675 bp in size will be observed in surfactin-
positive isolates.
3.7 Biosurfactant production by selected strains
The bacterial strains WH-2, WH-13, WH-15, MO-3, MOL-1, MOL-8, CHE-1 and
CHE-2 were further screened for their biosurfactant production potential. The cells of
respective isolates were activated for an overnight in nutrient broth at 30°C and 100 rpm.
The activated cells were centrifuged (Sigma, model 3K30) at 10,000 rpm for 10 min,
washed and resuspended in 0.8% (w/v) saline. The cell suspension, corresponding to 0.3
OD600 was used as inoculum, unless specified otherwise. The isolates were inoculated to
MSM supplemented with glucose (2.0% w/v) and yeast extract (0.25% w/v). The flasks
were incubated at 30°C and 100 rpm for 96 h. The medium was centrifuged at 10,000
rpm for 10 min to get a crude biosurfactant extract (CBE), which was used for further
studies. The growth and biosurfactant production profile of each strain was evaluated by
following the respective parameters as described below, at a regular interval of 24 h.
3.7.1 Cell growth:
Cellular growth at the respective time intervals was measured by following
optical density of the culture at 600 nm using UV-Visible Spectrophotometer (UV-1601,
Shimadzu).
3.7.2 Determination of biomass:
The gram dry weight per liter was determined by taking 1.5 ml sample of the
culture broth from the growth medium, at a specific time interval of 24 h. The cells were
separated by centrifugation at 10,000 rpm for 10 min and washed. The cell pellet was
dried at 100°C. The reading was taken every 24 h till a constant weight was achieved.
54
Materials and Methods
3.7.3 Surface tension (mN m-1):
The surface tension of cell-free supernatant at each sampling was determined as
described in Section 3.4.2.
3.7.4 Determination of biosurfactant concentration:
3.7.4.1 For rhamnose containing biosurfactants:
The orcinol assay (Chandrasekaran and Bemiller 1980) was used to assess the
amount of rhamnolipids in the sample as per the following protocol: 333 µl of the culture
supernatant was extracted thrice with 1 ml of diethyl ether. The ether fractions were
pooled and evaporated to dryness and redissolved in 0.5 ml of water. To 100 µl of each
sample in a 5 ml test tube, 900 µl of a solution containing 0.19% (w/v) orcinol was added
and heated at 80°C for 30 min. The samples were cooled for 15 min at room temperature
and the absorbance (at 421 nm) was measured. The concentration of rhamnolipid was
determined from standard curve of rhamnose between 0 and 50 µg ml-1. Rhamnolipid
content was determined by multiplying rhamnose concentration by 3 (Itoh et al. 1971).
3.7.4.2 For non-rhamnose containing biosurfactants:
The concentration of the non-rhamnose based surface-active molecules was
determined using dry weight method (Moran et al. 2002). The pellets obtained after acid
precipitation of the cell-free supernatant (as described in Section 3.8) were extracted
twice with a mixture of chloroform: methanol (2:1 v/v). Organic phase was concentrated
and pooled in a weighed 1.5 ml microcentrifuge tube. The tubes were weighed again after
the solvent was evaporated, to determine the weight of surface-active components
produced by each isolate.
3.7.5 Specific productivity (Yp/x) determination:
The yield of biosurfactant on biomass (Yp/x, g rhamnolipid g-1 dry cell mass) was also
evaluated as below.
Yp/x = A/B-C
where,
A = Total biosurfactant produced (g l-1)
B = Biomass at the time of harvesting (g l-1)
C = Biomass at 0 h (g l-1)
55
Materials and Methods
3.8 Extraction of biosurfactants
The cells of respective isolates were grown in the medium as described in Section
3.7 and pH of the cell-free supernatant was lowered to 2.0 with 5 N HCl. The flask was
incubated for 48 h at 4°C to allow precipitation. The precipitated surface-active
components were separated by centrifugation at 10,000 rpm for 10 min. The pellet was
washed with sterile distilled water, air dried and dissolved in 5 ml of alkaline water. The
precipitate was extracted thrice with equal volume of ethyl acetate and chloroform:
methanol (2:1) for rhamnose-containing biosurfactants and non-rhamnose type of
biosurfactants, respectively. The pooled organic extracts were dried using rotary vacuum
evaporator (Büchi, Switzerland) for further analysis.
3.9 Screening of HCH-degrading microbial strains
The isolates were screened for their HCH-degradation potential in 50 ml nutrient
broth supplemented with γ-HCH at a rate of 100 µg ml-1. The medium was inoculated
with 10% (v/v) of the overnight-activated isolates, separately. The flasks were incubated
at 30°C and 100 rpm for 96 h. The medium was extracted thrice with chloroform.
Organic phase was pooled and concentrated using rotary vacuum evaporator (Büchi,
Switzerland). The concentrated organic extracts were analyzed by thin-layer
chromatography (TLC) using the ethyl acetate: hexane (1:9) solvent system and
chromatograms were visualized both under UV light and iodine vapors. HCH-
degradation by the isolates was also monitored by chloride-ion release using mercuric
thiocyanate method (Bergmann and Sanik 1957, Appendix-1).
3.10 Biodegradation of HCH-muck in the presence of crude biosurfactant extracts
The effect of absence and presence of 5.0% (v/v) crude biosurfactant extracts
(CBEs) of different surfactant-producing strains viz. P. aeruginosa (WH-2),
Paenibacillus lentimorbus (MOL-8), and Bacillus sp. (CHE-2) on the biodegradation of
HCH-muck by B. licheniformis HA-12 and B. alcalophilus HA-13 was evaluated in 250
ml Erlenmeyer flasks containing 50 ml chloride-free mineral salt medium (CFMSM). The
cells of HA-12 and HA-13 were activated in CFMSM at 30°C and 100 rpm in the
presence of 20 ppm HCH-muck. Cells were harvested by centrifugation at 10,000 rpm for
56
Materials and Methods
10 min, washed with CFMSM and resuspended in 10 ml of the same medium. The flasks
containing 5.0% (v/v) of the respective CBEs supplemented with 20 ppm HCH-muck
were inoculated with 500 µl of the activated culture and incubated at 30°C (100 rpm) for
48 h. The control flask having MSM without any CBE supplement was also inoculated.
The samples of 0 h and 48 h were evaluated for growth by taking OD600. The release of
chloride-ion into growth medium was monitored using Ion meter (Orion 720) fitted with
chloride-ion specific electrode.
3.11 Optimization of process parameters for biosurfactant production by P.
aeruginosa WH-2
The effect of different medium components and physico-chemical parameters on
growth and biosurfactant production potential of P. aeruginosa WH-2 was followed by
using the conventional one-factor at a time approach. The parameter supporting best
biosurfactant yield at each stage was selected for further studies.
The optimization studies were conducted in MSM (pH 7.0 ± 0.2) supplemented
with appropriate carbon and nitrogen sources. The incubation was carried out at 30°C and
100 rpm for 96 h. The various parameters viz. cell biomass, pH change, reduction in
surface tension, biosurfactant concentration and specific productivity, were determined as
described in Section 3.7.
3.11.1 Optimization of medium components for biosurfactant production
The effect of different carbon and nitrogen (organic/inorganic) sources on
biosurfactant production by WH-2 was studied. Further, the influence of different levels
of phosphate ions, magnesium ions and iron (Fe3+) on the overall biosurfactant yield was
assessed. The effect of other trace elements viz. Zn2+, Mn2+, Co2+, Ni2+ and Cu2+ on
surfactant production by WH-2 was also examined.
3.11.1.1 Effect of carbon sources on biosurfactant production:
The effect of different carbon sources viz. glucose, fructose, mannitol, sucrose,
sodium citrate, sodium acetate, ethanol, oleic acid and n-hexadecane on biosurfactant
production efficiency of WH-2 was evaluated. The MSM was supplemented with 2.0%
(w/v) of the respective carbon source and 0.25% (w/v) yeast extract. The respective
57
Materials and Methods
carbon sources were added to growth medium from their sterilized stock solutions into
the medium after sterilization. Fructose, found to be the most suitable carbon source out
of the tested carbon sources, was used for further studies.
The effect of different concentrations of fructose viz. 0.5, 1.0, 2.0, 3.0 and 4.0 (%
w/v) on biosurfactant production efficiency of WH-2 was studied. The WH-2 cells grown
in MSM supplemented with 2.0% (w/v) fructose supported the best biosurfactant
potential of the strain and this concentration was used for further studies, unless specified
otherwise.
3.11.1.2 Effect of nitrogen sources on biosurfactant production:
The effect of different organic and inorganic nitrogen sources on biosurfactant
production efficiency of WH-2 was studied.
3.11.1.2.1 Effect of organic nitrogen supplements on biosurfactant production:
The potential of different organic supplements viz. yeast extract, beef extract,
malt extract, peptone, soy peptone and tryptone to support biosurfactant production by
WH-2 was studied. The MSM was supplemented with 2.0% (w/v) fructose and 0.25%
(w/v) of different organic nitrogen supplements. The medium supplemented with
tryptone (0.25% w/v) supported best biosurfactant yield. Thus, tryptone was selected
for further studies.
The effect of different concentrations (0.1-0.5% w/v) of tryptone on biosurfactant
production by WH-2 was studied, in order to determine its optimal concentration. The
cells grown in presence of 0.25% (w/v) tryptone supported maximum biosurfactant yield
and was used for further studies, unless specified otherwise.
3.11.1.2.2 Effect of inorganic nitrogen sources on biosurfactant production:
Different inorganic nitrogen sources viz. ammonium sulphate, ammonium
chloride, ammonium nitrate, ammonium dihydrogen orthophosphate, sodium nitrate,
potassium nitrate and ammonium acetate were supplemented to MSM at a rate of
0.10% (w/v), to evaluate their effect on biosurfactant production efficiency of WH-2.
Out of these, ammonium sulphate was found to support the best biosurfactant
production.
58
Materials and Methods
The cells of WH-2 were grown in MSM supplemented with different
concentrations of (NH4)2SO4 viz. 0.05, 0.10 and 0.20 (% w/v). MSM supplemented with
0.10% (w/v) of (NH4)2SO4 supported maximum biosurfactant production by the strain.
3.11.1.3 Effect of Na+, K+ and phosphate ions on biosurfactant production:
The effect of different levels of Na+, K+ and phosphate (PO43-) ions in MSM on
the potential of biosurfactant production by cells of WH-2 was evaluated. The
biosurfactant production potential of WH-2 cells was studied using MSM supplemented
with different concentrations of Na2HPO4 (anhydrous, 1.0-6.0 g l-1) and KH2PO4 (0.5-3.0
g l-1).
3.11.1.4 Effect of magnesium ions on biosurfactant production:
The effect of varying concentrations of magnesium ion on the biosurfactant
production efficiency of WH-2 was studied by supplementing MSM with different
concentrations of MgSO4.7H2O in the range of 0.0-5.0 g l-1.
3.11.1.5 Effect of iron on biosurfactant production:
The effect of iron (Fe3+) supplemented in growth medium on biosurfactant
production efficiency of WH-2 was studied by varying the concentration of ferric
ammonium citrate (FAC), a constituent of MSM. The medium supplemented with
varying concentrations of FAC viz. 0.0, 0.01 and 0.02 (g l-1) was inoculated with
activated suspension of WH-2 cells.
3.11.1.6 Effect of trace elements on biosurfactant production:
The effect of different metal ions viz. Zn2+, Mn2+, Co2+, Ni2+ and Cu2+ on
biosurfactant production efficiency of WH-2 was studied by supplementing MSM with
trace element solution (TES) at a rate of 1.0 and 2.0 (% v/v). The MSM without TES
supplement was taken as a control.
3.11.2 Optimization of physico-chemical parameters for biosurfactant production by
WH-2
3.11.2.1 Effect of incubation temperature on biosurfactant production:
The effect of incubation temperature, in the range of 25°C to 40°C, on the
biosurfactant production was studied. The flasks were incubated at 100 rpm for 96 h.
59
Materials and Methods
3.11.2.2 Effect of inoculum level on biosurfactant production:
The effect of initial inoculum level on biosurfactant production was assessed. The
cells grown for 18 h in nutrient broth (pH 7.0) were used as inoculum. The cells were
centrifuged at 10,000 rpm for 10 min, washed with saline (0.8% w/v) and suspended in
the same. The OD600 of the cell suspension was determined and appropriate volume was
used to inoculate MSM to achieve an initial OD in the range of 0.1-0.5 (OD600). The
inoculum level of 0.3 OD600 supporting maximum biosurfactant production by WH-2
cells was selected for further studies.
3.11.2.3 Effect of inoculum age on biosurfactant production:
The effect of age of inoculum on the biosurfactant yield of the WH-2 was studied
by using cells grown for 12, 24, 36, 48, 60 and 72 h as inoculum, separately. The
harvested cells as per protocol described in Section 3.11.2.2 were used to inoculate MSM
so as to attain an initial OD600 level of 0.3.
3.11.2.4 Effect of initial pH on biosurfactant production:
The effect of initial pH of the MSM on biosurfactant production potential of WH-
2 cells was studied. The pH of MSM was adjusted in the range of 5.0 to 8.5 using either
0.5 N NaOH or 1 N HCl prior to sterilization. The medium was inoculated with activated
cell suspension and incubation was carried out at 30°C and 100 rpm for 96 h.
3.11.2.5 Effect of static and shaking conditions on biosurfactant production:
The effect of incubation under static and shaking (50, 100, 150 and 200 rpm)
conditions on biosurfactant production by WH-2 was studied. The flasks were incubated
at 30°C.
3.12 Biosurfactant production by P. aeruginosa WH-2 under optimized
conditions:
The biosurfactant production under optimized conditions was carried out in 250
ml Erlenmeyer flasks having 50 ml of MSM. The MSM (pH 7.0) was supplemented with
2.0 % (w/v) fructose and 0.25 % (w/v) tryptone, and was inoculated with activated (24 h)
cell suspension to get a final OD600 of 0.3. The flasks were incubated at 30ºC in an
environmental incubator shaker at 100 rpm. The surface-active properties of the
60
Materials and Methods
biosurfactant were determined at a regular interval of 24 h of incubation (Section 3.7).
The study was conducted in three independent experiments and the data reported is the
average of three observations.
3.13 Biosurfactant production by P. aeruginosa WH-2 on alternative/low-cost
medium supplements
The cane molasses, a by-product from sugar industry, was used as a carbon source
in MSM to evaluate biosurfactant production ability of strain WH-2.
3.13.1 Effect of molasses concentration on biosurfactant production:
The MSM was supplemented with different concentrations of cane molasses (1.0-
6.0% v/v) equivalent to 0.4-2.4% (w/v) reducing sugars. The initial reducing sugar level
in cane molasses was determined by standard DNS (dinitrosalicylic acid) method (Miller
1959). The flasks were inoculated with activated WH-2 cells corresponding to 0.3 OD600
and incubated at 30°C and 100 rpm in an orbital environmental shaker for 96 h. The
biosurfactant production was calculated as per method described in Section 3.7.4.1. The
concentration supporting the maximum biosurfactant yield was used for further
experiments.
3.13.1.2 Biosurfactant production by P. aeruginosa WH-2 using molasses as a sole
source of carbon:
The production of biosurfactant was studied by growing cells of P. aeruginosa
WH-2 in MSM supplemented with 4.0% v/v (equivalent to 1.6% w/v of reducing sugars)
of cane molasses as sole carbon and energy source. The abiotic control having the same
media composition but without inoculum, was also incubated under same conditions. The
samples were drawn at a regular interval of 24 h till 120 h and analyzed for biosurfactant
production (Section 3.7). The study was conducted in three independent experiments and
the data reported is the average of three readings.
3.14 Statistical model studies
Response surface methodology (RSM) using the Box-Behnken design (Box and
Behnken 1960) of experiments was used to develop a mathematical correlation between
61
Materials and Methods
three independent variables, found to be significantly affecting the biosurfactant
production by P. aeruginosa WH-2 during initial optimization studies.
3.14.1 Response Surface Methodology (RSM) using Box–Behnken design of
experiments for fructose- and molasses-supplemented medium:
Based on one-factor at a time approach experiments, three independent variables
affecting the biosurfactant production by WH-2 were chosen for optimization by
Response Surface Methodology (RSM) using Box–Behnken design of experiments. This
was used to develop a mathematical correlation between three independent variables on
the production of biosurfactants by P. aeruginosa WH-2 (Table 3.1), based on fructose
and cane molasses as a carbon source, separately. The three independent variables,
fructose concentration (X1), pH (X2) and inoculum level (X3) were chosen to study their
effect on biosurfactant production by WH-2 in fructose-supplemented medium. On the
other hand, molasses concentration (X1), cornsteep liquor (CSL) concentration (X2) and
phosphate (Na2HPO4) concentration (X3) were chosen to study the effect of these
variables on biosurfactant production in molasses-supplemented medium. The model was
studied within a range of variables designated as low (-1), middle (0) and high (+1)
concentration (Table 3.2). The experimental design included 17 flasks with five replicates
having all the three variables at their central coded values (Table 3.3). The mathematical
relationship of response G (rhamnolipid concentration) and variable X was approximated
by the quadratic model equation
G = β0 + β1 X1 + β2 X2 + β3 X3 + β11 X12 + β22 X2
2 + β33 X32 + β12 X1 X2 + β13 X1 X3 + β23 X2 X3
where G is the predicted response, β0 intercept, β1, β2 and β3, linear coefficients, β11,β 22,
β33, squared coefficients and β12, β13, β23, interaction coefficients. The MINITAB
statistical software (MINITAB Inc., version 11.12, PA, USA) was used to analyze
parameters and to generate response surface graphs.
3.15 Extraction and purification of WH-2 biosurfactant
3.15.1 Extraction of biosurfactant
The biosurfactant produced by cells of WH-2 grown in MSM was isolated from
cell-free supernatant. The suitable method of recovery for biosurfactant was optimized by
62
Materials and Methods
using different precipitation and extraction protocols reported in literature with suitable
variations. The effectiveness of the recovery processes was determined by comparing
surface tension and emulsification activity, for γ-HCH and n-hexadecane of the cell-free
supernatant, before and after the recovery of biosurfactant.
3.15.1.1 Acid precipitation:
The recovery of anionic surface-active components was carried out by acid
precipitation at pH 2.0. For this, the effect of different strengths of acid viz. 1 N HCl, 5 N
HCl and concentrated HCl was studied. After adjusting the pH of cell-free supernatant to
2.0, the flasks were incubated overnight at 4°C to allow complete precipitation of the
surface-active components. The precipitates were pelleted out by centrifugation at 10,000
rpm for 10 min in a pre-weighed centrifuge tube. After centrifugation, the pellet was
washed with distilled water and re-centrifuged. The pellet was dried and the tube was
weighed again to determine the yield.
3.15.1.2 Solvent extraction:
The cell-free supernatant of WH-2 was extracted thrice with different solvent
combinations i.e. chloroform, chloroform: methanol (1:1), chloroform: methanol (2:1),
chloroform: methanol (1:2), hexane and ethyl acetate. The pooled samples were
concentrated using rotavapor (Büchi, Switzerland).
3.15.2 Column chromatography for purification of surfactant preparation
The ethyl acetate-extracted WH-2 surfactant was further purified by column
chromatography. A column 28 cm (length) x 1.3 cm (diameter) was used for preparing a
bed of silica gel (60-120 mesh)-chloroform slurry. The WH-2 biosurfactant sample (1 g
of dry weight) was dissolved in 2 ml of chloroform and was loaded carefully on the silica
bed with Pasteur pipette. The column was washed with 100% chloroform until neutral
lipids were completely eluted. The column was further developed with chloroform:
methanol mobile phase starting at an initial gradient of 50:3 (v/v, 200 ml), followed by
50:5 (v/v, 100 ml); 50:50 (v/v, 100 ml) and then 100% methanol (100 ml) at a flow rate
of 1 ml min-1. The presence of surface-active molecules in every 20 ml fraction collected
was checked by thin-layer chromatography using pre-formed silica gel plates (Merck).
63
Materials and Methods
The mobile phase used for developing the thin-layer chromatogram was chloroform:
methanol: water (65:25:4, v/v). The plates were sprayed with anthrone-sulphuric acid
reagent (Appendix-1) and heated at 105°C for 10 min to develop the spots. The fractions
having similar compounds were pooled and dried under vacuum with a rotavapor.
Rhamnolipids were quantified by weighing after drying in oven until a constant weight
was achieved.
3.16 Determination of surfactant composition
3.16.1 Thin-layer chromatography (TLC):
The different biosurfactant types were separated by analytical thin-layer
chromatography (TLC) carried out on silica gel plates 60 F254 (Merck, Darmstadt,
Germany) using the solvent system: chloroform: methanol: water = 65:25:4 (v/v/v). The
nature of biosurfactant was determined by using different spraying reagents viz. anthrone,
α-naphthol and diphenylamine reagent (for carbohydrates), rhodamine 6G (for lipids),
hydroxylamine-ferric chloride (for esterified fatty acids) and ninhydrin (for amino acids).
The composition and method of preparation of these reagents is given in Appendix-1.
3.16.2 Saponification and acid hydrolysis:
The biosurfactant produced by P. aeruginosa WH-2 (500 mg) was dissolved in
diethyl ether (10 ml) and treated with 0.5 N NaOH in 90% ethanol (15 ml) for 12 h at
60°C for hydrolysis of the ester bond. After saponification, water (10 ml) was added and
mixed with the hydrolysate. The resulting ether-extractable and water-soluble fractions
were separated. The water-soluble fraction was hydrolyzed with 1 ml of 2 N H2SO4 in a
screw-capped tube at 90°C for 4 h. After the hydrolysis, CaCO3 (0.5 g) was added to
neutralize the acid and the resulting solution was used for further chromatographic
analysis using the solvent system and spraying reagents as discussed in Section 3.16.1.
3.16.3 1H Nuclear Magnetic resonance (NMR) analysis:
The biosurfactant sample was dried in vacuum to remove the traces of organic
solvents used for extraction. The dried sample was then dissolved in 1 ml of a mixture of
deutrated chloroform (CDCl3) and deutrated methanol (CD3OD) in the ratio of 70:30
(v/v) and pipetted into the NMR cell (Wilmad, USA). 1H-spectra of biosurfactant sample
64

Materials and Methods
of P. aeruginosa strain WH-2 was recorded on AMX 300 NMR spectrophotometer
(Bruker, Germany, 300 MHz) locked to the major deuterium resonance of Me4Si (TMS)
in deutrated solvents, without spinning. Chemical shifts were recorded as δ values
relative to TMS.
3.17 Physico-chemical properties of WH-2 biosurfactant preparation
3.17.1 Critical micelle concentration (CMC) and γCMC determination:
To determine the CMC of partially-purified as well as purified WH-2
biosurfactant, different concentrations (0-1.0 g l-1) of the biosurfactant were prepared in
alkaline water. Surface tension was measured with a tensiometer as described in Section
3.4.2. The surface tension vs concentration graphs were plotted using Sigma plot to
determine CMC and the surface tension at this point was designated as γCMC. The CMC
was expressed as mg l-1.
3.17.2 pH stability:
The pH of partially-purified biosurfactant solution (200 mg l-1) was adjusted to
various levels in the range of 2-12 at room temperature using 0.5 N HCl/NaOH. The
solutions were incubated at room temperature for 24 h followed by evaluation of surface-
active properties viz. surface tension, ability to emulsify n-hexadecane, and stability of
emulsion formed. The emulsification activity for γ-HCH was determined as described by
Appaiah and Karanth (1991). 20 mg of γ-HCH (0.4% w/v) as acetone solution (0.2 ml)
was added to 5.0 ml of crude biosurfactant extract (CBE) and vortexed for 1 min. The
colloidal supernatant was carefully decanted after allowing the excess pesticide to settle
for 2 h at ambient conditions. The emulsion thus formed was read at 660 nm against
distilled water as a blank. The MSM treated in a similar way served as a control.
3.17.3 Thermal stability:
The thermal stability of biosurfactant was evaluated by incubating 50 mg l-1
solution of the partially-purified biosurfactant at 100°C for 4 h. The samples withdrawn
at regular intervals of 20 min were used to determine different surface-active properties
viz. surface tension, emulsification activities for γ-HCH and n-hexadecane, and stability
of emulsion formed.
65
Materials and Methods
3.17.4 Resistance to salts:
The ability of biosurfactant produced by WH-2 to retain its activity in the
presence of salts was studied by adding salts such as NaCl, CaCl2 and MgSO4 ranging
from 0-10.0% (w/v) to 50 mg l-1 solution of the partially-purified biosurfactant
preparation in alkaline water. The effect of salts was assessed by measuring surface
tension and emulsification activity of the respective biosurfactant solutions.
3.17.5 Emulsification index (E24):
The emulsification index i.e. the ability of the biosurfactant preparation to
emulsify non-water soluble hydrophobic compounds, was also determined. For this, 6
ml of substrate (diesel oil, n-hexadecane, kerosene oil, vegetable oil, and petrol) was
added to 4 ml of the crude biosurfactant extract in a graduated tube and vortexed at
full speed for 2 min. The height of the emulsion formed was noted and it was
allowed to stand for 24 h. After 24 h, the height of the emulsion was again noted and
from the data E24 was determined (Cooper and Goldenberg 1987). The emulsion index
(E24) is the height of the emulsion layer (HEL), divided by total height (HS), and
multiplied by 100.
Thus, E24 (%) = (HEL/ HS) x 100
3.18 Comparison of surface-active properties of the biosurfactant with sodium
dodecyl sulphate (SDS)
The emulsification potential of the biosurfactant preparation of WH-2 was
compared with a commonly used anionic surfactant, SDS. The emulsification assay of
SDS was carried out at various conditions of pH (Section 3.17.2), temperature
(Section 3.17.3) and salt (Section 3.17.4). The emulsification activities for γ-HCH
(Section 3.17.2) and n-hexadecane (Section 3.4.3), and emulsion stability (Section
3.4.3) were evaluated.
3.19 Fermenter studies
3.19.1 Fermenter:
Scale-up studies for the production of rhamnolipids by P. aeruginosa WH-2 were
carried out in a 3 l stirred-type bioreactor (STB, Büchi, Switzerland). Agitation was
66
Materials and Methods
provided by six flat-blade impellers and the filtered air was introduced through a sparger
at 5 l min-1. Dissolved oxygen in the broth was measured with a galvanic oxygen
electrode. The temperature of fermenter was maintained at 30 ± 2°C using a BioRad
(USA) cooling system. The fermenter was fitted with an outlet for continuous removal of
foam formed due to biosurfactant production in the growth medium.
3.19.2 Medium used:
The MSM (2 l) was sterilized in situ in the glass vessel and was allowed to cool
down to room temperature. The medium was supplemented with fructose (2.0% w/v),
tryptone (0.05% w/v), MgSO4.7H2O (10.0% w/v) and CaCl2.2H2O (1.0% w/v) from their
respective sterilized stock solutions.
3.19.3 Inoculum development:
A single colony of an overnight-activated culture on nutrient agar plate was
aseptically transferred into 500 ml nutrient broth. The culture was grown for 24 h at
30°C and 100 rpm on a rotary shaker. The cells were harvested (10,000 rpm, 10 min)
and washed with 0.8% (w/v) saline to remove medium components. The pellet was
suspended in the saline and was used to inoculate the medium in fermenter to achieve
a final OD600 of 0.3. The culture broth samples were collected from the fermenter at
regular intervals of time for further analysis including OD600, pH of medium, the
concentration of reducing sugars and surface tension of the centrifuged fermentation
broth.
3.19.4 Substrate consumption:
Total reducing sugars in the growth medium were determined colorimetrically by
dinitrosalicylic acid (DNS) method. 3.0 ml of DNS solution (Appendix-1) was added to
1.0 ml of an appropriately diluted sample. The mixture was heated in a water bath at
100°C for 10 min. The solution was then cooled at room temperature and absorbance was
measured at 540 nm. The concentration of sugars in the medium was calculated from the
standard curve for fructose in the range of 0.1-0.5 µg ml-1.
3.19.5 Foam collection:
The foam formed after the initiation of biosurfactant production was collected
in a sterilized flask through an outlet attachment. The flask was kept at 4°C to allow
67
Materials and Methods
the collected foam to settle down. The liquid obtained after settling down of foam was
centrifuged and used for surface tension measurement and acid precipitation of
surface-active molecules as per protocols described in Sections 3.4.2 and 3.8
respectively.
3.20 Role of biosurfactant in bioremediation
The ability of WH-2 rhamnolipids to improve the partitioning of HCH-muck to
aqueous phase was studied. The efficacy of partitioning of the biosurfactant solutions
with concentrations equivalent to CMC (38 mg l-1), above CMC (60 mg l-1) and below
CMC (20 mg l-1) was evaluated.
3.20.1 Aqueous phase partitioning of HCH-muck by WH-2 biosurfactant
The aqueous phase partitioning of HCH was evaluated in presence and absence of
purified WH-2 biosurfactant in a glass vial (15 ml). For each experiment, 20 µg HCH ml-
1 was carefully added to the bottom of a screw cap vial. After evaporation of solvent, 5
ml MSM supplemented with appropriate concentration of biosurfactant was added to the
vial. Two vials in duplicate were used for each biosurfactant concentrations i.e. at CMC,
above CMC, below CMC, and in absence of surfactant. The vials were properly screwed
and placed on a rotary shaker at 150 rpm and 30°C for 24 h. The aqueous phase was
removed from the vials after 24 h incubation and was extracted thrice with acetone:
hexane (20:80) mix. Further, the vials were rinsed with organic solvent mixture to extract
the residual HCH-muck.
3.20.1.1 Analytical methods:
The respective pooled organic phase from both the treatments were
concentrated separately using rotavapor and dissolved in a final volume of 1.0 ml.
Samples were analyzed using a gas chromatograph (Nucon, Model-5765) fitted with a
fused silica capillary column BPX608 (Agilent) 25 m x 0.32 mm (i.d.) x 0.43 mm
(o.d.), using electron capture detector (ECD). The injector, detector and column were
maintained at 250, 270 and 240°C, respectively. The flow of carrier gas (Nitrogen)
was 25 ml min-1. One micro liter (µl) of the sample was injected to the column using
a 5 µl glass syringe.
68
Materials and Methods
3.20.2 Effect of WH-2 biosurfactant on growth of HCH-degrading strains
The biosurfactants are known to inhibit the growth of other microorganisms.
In light of this, the effect of different concentrations of the biosurfactant preparation
of WH-2 on the overall growth of HCH-degrading strain Sphingomonas sp. MTCC
8061 was checked. The cells of Sphingomonas sp. were grown in MSM supplemented
with both glucose (0.5 g l-1) and the respective concentrations of purified
biosurfactant (at CMC, above CMC and below CMC). The controls having MSM
supplemented with glucose and respective concentrations of biosurfactant, separately
were also simultaneously studied. The flasks were incubated at 30°C and 100 rpm for
48 h. The growth was determined at different intervals of time using Shimadzu
UV1601 PC spectrophotometer.
3.20.3 Biodegradation of HCH-isomers by Sphingomonas sp. in the presence of
purified WH-2 surfactant
The ability of Sphingomonas sp. MTCC 8061 to degrade HCH in the absence and
presence of purified WH-2 surfactant was studied.
3.20.3.1 Inoculum development:
The cells were grown at 30°C and 100 rpm for 48 h in MSM supplemented with
sodium benzoate (1% w/v). The cells were centrifuged at 10,000 rpm and 10 min,
washed twice using sterilized MSM and resuspended in the same medium to an optical
density of 2.0.
3.20.3.2 Biodegradation studies:
The studies were carried out in 15 ml screw cap vials. The initial concentration of
HCH used was 20 µg ml-1 added from a stock solution (2000 µg ml-1) in acetone. The
solvent was allowed to evaporate overnight at 30°C and 4.5 ml of filter-sterilized
biosurfactant solution was added to MSM at the desired concentration (below CMC: 20
mg l-1 and at CMC: 38 mg l-1). Finally, each vial was inoculated with 0.5 ml of the
activated cell suspension and incubated on a rotary shaker at 150 rpm and 30°C for 24 h.
The entire contents of the vials were extracted by adding acetone: hexane mix (20:80).
69
Materials and Methods
Organic phase was concentrated using rotary vacuum evaporator (Büchi, Switzerland).
The dried extracts were dissolved in 1 ml of acetone and were analyzed for the residual
HCH-congeners using ECD (Section 3.20.1.1). The degradation for each congener in
HCH-muck was quantified by comparing the peak area with the cell-free control
incubated along with the biotic samples and was represented as percent degradation
achieved.
70