Mass Spectrometry of Lens Crystallins: Bovine β-Crystallins
7
RAPID COMMUNICATIONS IN MASS SPECTROMETRY, VOL. 10, 123-129 (1996) Mass Spectrometry of Lens Crystallins: Bovine P=Crystallins Greg W. Kilby, Roger J. W. Ttuscott, Glen M. Stuchbury and Margaret M. Sheil* Department of Chemistry and Australian Cataract Research Foundation, University of Wollongong, NSW 2522, Australia The bovine &crystallins have been isolated by gel permeation chromatography (GPC) and fast protein liquid chromatography (FPLC). Electrospray ionization mass spectrometric examination of the resulting fractions confirms the relative molecular masses of three bovine &crystallins, i.e. pB, , pB2 and PA,, only one of which (pB3 has been reported previously by mass spectrometry. The sequence of pB, is shown to be incorrect as the identity of this protein was confirmed by FPLC, sodium dodecyl sulphate-polyacrylamide gel electrophoresis (SDS-PAGE) and matrix-assisted laser desorption ionization (MALDI) mass analysis of a tryptic digest of this protein. ESI analysis of the remaining p subunits, i.e. PA,, PA, and PA4, suggests the published sequences of these proteins also contain errors. The major components observed in the (i.e. octameric) and (trimeric) aggregates of the &crystallins are shown to be consistent with subunit compositions determined by SDS-PAGE. A number of cleavage products of pcrystallins were also identified, i.e. species with masses corresponding to pB~-’”, /3B;-’”, pByw, pB;-’% were detected in the ESI mass spectra following isolation of the pB, fraction from one-year-old lenses by FPLC. A species with mass of pBFz4 is also observed in the ESI mass spectrum of the & fraction isolated by GPC. The largest and most hydrophobic of the &crystallins, pB,, is detected in the & aggregate but not following FPLC purification of a fraction containing pB, and pB,. A variety of dflerent methods (including MALDI) were used to examine this fraction but none enabled the successful analysis of pB, in the deaggregated protein. Finally, this work demonstrates the advantages and some of the difficulties in mass spectrometric characterization of this class of proteins. The soluble lens proteins, i.e. crystallins, are important for the maintenance of transparency of the lens.’ Bovine and human lenses contain three major classes of soluble proteins a-, P and y-crystallins. Modifications to the crystallins are known to occur both on ageing’ and in the development of lens nuclear cataract? Thus, there is considerable interest in the characterization of the post-translational modifications and other changes in crystallins from aged and cataractous lenses. Electrospray ionization mass spectrometry (ESI- MS) is now established as a powerful tool for the determination of accurate molecular weights of proteins4 and there have been a number of studies utilizing ESI-MS for the characterisation of bovine and human crystallins. These include: analysis of bovine a-: P16.7 and y-* crystallins as well as foetal and young human crystallins.’. lo These studies have shown the potential of mass spectrome- try for detection of both age-related changes’ and post-translational modifications of the crystalIins5but have also indicated that a number of the published sequences of the crystallins are incorrect.* The bovine &crystallin superfamily can be separated by conventional size-exclusion gel permeation chromatog- raphy (GPC) into five subgroups in the following order (from largest to smallest), pH-, &, pL2-, yS- and y- crystallin.”. ’’ The three Pcrystallin fractions A, &, , pL2 correspond to aggregate sizes of octamers, trimers and dimers re~pectively.’~.’~ In the bovine lens there exist at least seven Pcrystallin subunits which are further classified into acidic ( PA ) and basic ( ) crystallins subunits. All the Pcrystallins are N-terminally acetylated, whereas the y- crystallins are not. The basic P-crystallin polypeptides are characterized by both N- and C-terminal extensions, whereas the acidic Pcrystallin polypeptides contain only N- terminal extensions.”-” Takemoto et al. have demonstrated age-related preferential proteolysis of the N-terminal Author for correspondence. sequence of human @,-crystallin via polyclonal antisera recognition experiment^.'^ In contrast, Berbers et al. showed that bovine pB2 undergoes preferential enzymatic cleavage from the C-terminus in vitro.I6 These cleavages are consistent with the presence of N- and C-terminal exten- sions that have considerable conformational flexibility as confirmed by NMR spectroscopic studies of pB,-crystal- lin.I3 In support of the hypothesis that these post-translational cleavages of human pB2 are the result of the ageing process, Miesbauer ef al. have recently shown by a combination of mass spectrometry and enzymatic proteol- ysis, that there were no post-translational modifications observed for pB2 isolated from young human lenses.” We have also characterized the age-related cleavage of the C- terminal serine residue from bovine pB, crystallin.’ The seven main Pcrystallin subunits have blocked N- termini and only @,I7 and pBZ1’ have been comprehensively sequenced. The remainder have been determined by a partial protein sequencing (i.e. PA,, pB, and PA, )I* and homology with Pcrystallins from other species and/or by gene sequencing (i.e. PA, and BA4).l9 Isolation of individual p subunits is difficult. Slingsby and Bateman demonstrated a rapid method for separating the PI, pB,, pB,, PA,, and PA4 crystallins, by anion exchange chromatography in denaturing media.I4 Several groups have also applied reversed-phase high-performance liquid chromatography (HPLC) with limited success to separate the pcrystallin subunits. For example, Smith ef al. used HPLC followed by mass spectrometry to determine the masses of several proteins present in the pH, and & fractions of bovine lens crystallins! However, most peaks contained a number of proteins and they only identified one of the proteins of the separation, i.e. pB2, for which they reported a relative molecular mass (M,) of 23 216 (calcu- lated M, 23 209) and used fast-atom bombardment-tandem mass spectrometers (FAB-MUMS) and tryptic peptide mapping to confirm the sequence. Three of the HPLC CCC 095 141 98/96/01 01 23-07 0 1996 John Wiley & Sons, Ltd. Received I5 November 1995 Accepted (revised) 4 December 1995
-
Upload
greg-w-kilby -
Category
Documents
-
view
213 -
download
1
Transcript of Mass Spectrometry of Lens Crystallins: Bovine β-Crystallins
RAPID COMMUNICATIONS IN MASS SPECTROMETRY, VOL. 10, 123-129 (1996)
Mass Spectrometry of Lens Crystallins: Bovine P=Crystallins Greg W. Kilby, Roger J. W. Ttuscott, Glen M. Stuchbury and Margaret M. Sheil* Department of Chemistry and Australian Cataract Research Foundation, University of Wollongong, NSW 2522, Australia
The bovine &crystallins have been isolated by gel permeation chromatography (GPC) and fast protein liquid chromatography (FPLC). Electrospray ionization mass spectrometric examination of the resulting fractions confirms the relative molecular masses of three bovine &crystallins, i.e. pB, , pB2 and PA,, only one of which (pB3 has been reported previously by mass spectrometry. The sequence of pB, is shown to be incorrect as the identity of this protein was confirmed by FPLC, sodium dodecyl sulphate-polyacrylamide gel electrophoresis (SDS-PAGE) and matrix-assisted laser desorption ionization (MALDI) mass analysis of a tryptic digest of this protein. ESI analysis of the remaining p subunits, i.e. PA,, PA, and PA4, suggests the published sequences of these proteins also contain errors. The major components observed in the (i.e. octameric) and (trimeric) aggregates of the &crystallins are shown to be consistent with subunit compositions determined by SDS-PAGE. A number of cleavage products of pcrystallins were also identified, i.e. species with masses corresponding to pB~-’”, /3B;-’”, pByw, pB;-’% were detected in the ESI mass spectra following isolation of the pB, fraction from one-year-old lenses by FPLC. A species with mass of pBFz4 is also observed in the ESI mass spectrum of the & fraction isolated by GPC. The largest and most hydrophobic of the &crystallins, pB,, is detected in the & aggregate but not following FPLC purification of a fraction containing pB, and pB,. A variety of dflerent methods (including MALDI) were used to examine this fraction but none enabled the successful analysis of pB, in the deaggregated protein. Finally, this work demonstrates the advantages and some of the difficulties in mass spectrometric characterization of this class of proteins.
The soluble lens proteins, i.e. crystallins, are important for the maintenance of transparency of the lens.’ Bovine and human lenses contain three major classes of soluble proteins a-, P and y-crystallins. Modifications to the crystallins are known to occur both on ageing’ and in the development of lens nuclear cataract? Thus, there is considerable interest in the characterization of the post-translational modifications and other changes in crystallins from aged and cataractous lenses. Electrospray ionization mass spectrometry (ESI- MS) is now established as a powerful tool for the determination of accurate molecular weights of proteins4 and there have been a number of studies utilizing ESI-MS for the characterisation of bovine and human crystallins. These include: analysis of bovine a-: P16.7 and y-* crystallins as well as foetal and young human crystallins.’. lo
These studies have shown the potential of mass spectrome- try for detection of both age-related changes’ and post-translational modifications of the crystalIins5 but have also indicated that a number of the published sequences of the crystallins are incorrect.*
The bovine &crystallin superfamily can be separated by conventional size-exclusion gel permeation chromatog- raphy (GPC) into five subgroups in the following order (from largest to smallest), pH-, &, pL2-, yS- and y- crystallin.”. ’’ The three Pcrystallin fractions A, &, , pL2 correspond to aggregate sizes of octamers, trimers and dimers re~pectively.’~.’~ In the bovine lens there exist at least seven Pcrystallin subunits which are further classified into acidic ( PA ) and basic ( ) crystallins subunits. All the Pcrystallins are N-terminally acetylated, whereas the y- crystallins are not. The basic P-crystallin polypeptides are characterized by both N- and C-terminal extensions, whereas the acidic Pcrystallin polypeptides contain only N- terminal extensions.”-” Takemoto et al. have demonstrated age-related preferential proteolysis of the N-terminal
Author for correspondence.
sequence of human @,-crystallin via polyclonal antisera recognition experiment^.'^ In contrast, Berbers et al. showed that bovine pB2 undergoes preferential enzymatic cleavage from the C-terminus in vitro.I6 These cleavages are consistent with the presence of N- and C-terminal exten- sions that have considerable conformational flexibility as confirmed by NMR spectroscopic studies of pB,-crystal- lin.I3 In support of the hypothesis that these post-translational cleavages of human pB2 are the result of the ageing process, Miesbauer ef al. have recently shown by a combination of mass spectrometry and enzymatic proteol- ysis, that there were no post-translational modifications observed for pB2 isolated from young human lenses.” We have also characterized the age-related cleavage of the C- terminal serine residue from bovine pB, crystallin.’
The seven main Pcrystallin subunits have blocked N- termini and only @,I7 and pBZ1’ have been comprehensively sequenced. The remainder have been determined by a partial protein sequencing (i.e. PA,, pB, and PA, ) I * and homology with Pcrystallins from other species and/or by gene sequencing (i.e. PA, and BA4).l9 Isolation of individual p subunits is difficult. Slingsby and Bateman demonstrated a rapid method for separating the PI, pB,, pB,, PA,, and PA4 crystallins, by anion exchange chromatography in denaturing media.I4 Several groups have also applied reversed-phase high-performance liquid chromatography (HPLC) with limited success to separate the pcrystallin subunits. For example, Smith ef al. used HPLC followed by mass spectrometry to determine the masses of several proteins present in the pH, and & fractions of bovine lens crystallins! However, most peaks contained a number of proteins and they only identified one of the proteins of the separation, i.e. pB2, for which they reported a relative molecular mass (M,) of 23 216 (calcu- lated M, 23 209) and used fast-atom bombardment-tandem mass spectrometers (FAB-MUMS) and tryptic peptide mapping to confirm the sequence. Three of the HPLC
CCC 095 1 4 1 98/96/01 01 23-07 0 1996 John Wiley & Sons, Ltd.
Received I5 November 1995 Accepted (revised) 4 December 1995
124 MASS SPECTROMETRY OF LENS CRYSTALLINS
fractions from their pH separation also appeared to contain significant amounts of a-crystallins, though they were not assigned as such. In a very recent study, He et aL9 used reversed-phase (RP)-HPLC on-line with ESI-MS to charac- terize several human lens crystallins extracted both from the water soluble and water insoluble fractions of foetal lenses. Of the /3-crystallins, only pB2 was identified conclusively.
We report here the use of both gel permeation chromatog- raphy (GPC) and fast protein liquid chromatography (FPLC) in combination with electrospray (ESI) and matrix- assisted laser desorption (MALDI) mass spectrometry for the characterization of bovine Pcrystallins. This study extends the initial work on bovine Pcrystallins by Smith et aL6 by identifying most of the /3 subunits, including several for which the published sequences appear to be incorrect. Some unusual behaviour of the hydrophobic pB, subunit is also demonstrated.
EXPERIMENTAL Lenses were extracted in 50mM Tris buffer (pH 7.43, containing 5 mM Na, EDTA, 1 mM phenylmethyl- sulphonylfluoride (PMSF), 1 mM 1 ,4-dithiothreitol (DTT), and 0.02% (w/v) sodium azide (approx. 1.5 mL per lens). The homogenate was centrifuged (12 000 rpm for 30 min) to remove insoluble protein and then dialysed against Milli-Qm water (five changes) to remove low molecular weights salts and lens metabolites. The initial separation of the total bovine lens extract containing the a-, /3-, and 'y-
crystallins was performed on a Pharmacia Sephacryl S-300 gel filtration column (1 m X 25 mm) using 0.05 M phos- phate buffer (pH 6.8) containing 0.05% sodium azide (NaN,) as the eluent. The individual /3-crystallins subunits from either &crystallin and/or &-crystallin were purified by FPLC, according to the method of Slingsby and Bateman,I4 on a Pharmacia Mono Q HR 10/10 anion exchange column equilibrated with 0.25 M Tris buffer (pH 7.45) containing 6 M urea. A 10% linear salt gradient was developed with 0.25 M Tris buffer (pH 7.45) containing 6 M urea and 1 M NaCl. Each fraction was extensively dialysed against Milli-QTM water (five changes) then dried in a vacuum centrifuge prior to ESI-MS and MALDI" analysis.
For the tryptic digestion experiments the protein samples were dissolved in 100 mM Tris buffer (pH 8.2) containing 10 mM CaC1,. Trypsin (bovine pancreas, TPCK treated, type XIII, Sigma). 1 mg/mL in 0.1 M HCl was added to the protein in 1% w/w. The sample was then sealed under nitrogen and incubated at 36°C for 24 h after which the reaction was stopped by lyophilization. The dried sample was then stored at - 4 "C prior to analysis by MALDI.
All electrospray mass spectra were acquired on a VG Biotech Quattro mass spectrometer (VG Biotech Ltd., Altrincham, Cheshire, UK) equipped with an electrospray ionization source and a quadrupole-hexapole-quadrupole mass analyser configuration with a 4000 mass range for singly-charged species. The solvent for the spray was delivered via an ISCO (Lincoln, NE, USA) SFC-500 syringe pump at a flow rate typically between 5 and 10 pL min-I. A nitrogen nebulizing gas, flowing concurrent to the stainless steel capillary in the probe at a flow rate of - 10 L h-I, assisted in the production of a stable spray. A dry, warm counter-current nitrogen bath gas at a flow rate of - 350 L h- and at atmospheric pressure was employed to assist evaporation of the electrospray solvent. The electro- spray probe tib potential was 3.5 kV with 0.5 kV on the
chicane counter electrode. Skimmer potentials ranging from 40 to 65 V were used. The photomultiplier was set at 650 V for the first mass analyser (MS 1). The spectra were acquired in the positive-ion mode by multi-channel analysis (MCA) at a rate of 1 s per m / z 100. Typically, data from 10-20 scans were summed to obtain representative spectra. All mass spectra acquired were processed using software supplied by VG Biotech. The mass spectrometer was calibrated with horse-heart myoglobin (M, 16 95 1.4 Da, 20 pmol pL- ). The proteins were typically dissolved in 50% aqueous acetonitrile or methanol containing 1% formic acid with concentrations in the range 20-40 pmol pL- I ,
and 10 pL was injected for each analysis. MALDI analysis of the tryptic peptides was conducted on
a Kratos (Manchester, UK) Kompact I11 MALDI time-of- flight mass spectrometer incorporating a 337 nm nitrogen laser with a 3 ns pulse duration, and an electron multiplier detector. The instrument was operated in the positive-ion reflectron mode with an accelerating potential of 20 kV. The mass scale was calibrated using Substance P with cu-cyano- 4-hydroxycinnamic acid as the matrix. Samples were dissolved in 50% aqueous acetonitrile and mixed in a 1 : 1 ratio with a-cyano4hydroxycinnamic acid. For each sample, spectra were averaged over - 200 laser shots. The pB,/pB, protein fraction was analysed on VG Organic model TOF-Spec E using a-cyano-4-hydroxycinnamic acid, 2.5 dihydroxybenzoic acid and sinnapinic acid as matrices. Samples were dissolved in a variety of different solvents as indicated below.
RESULTS AND DISCUSSION
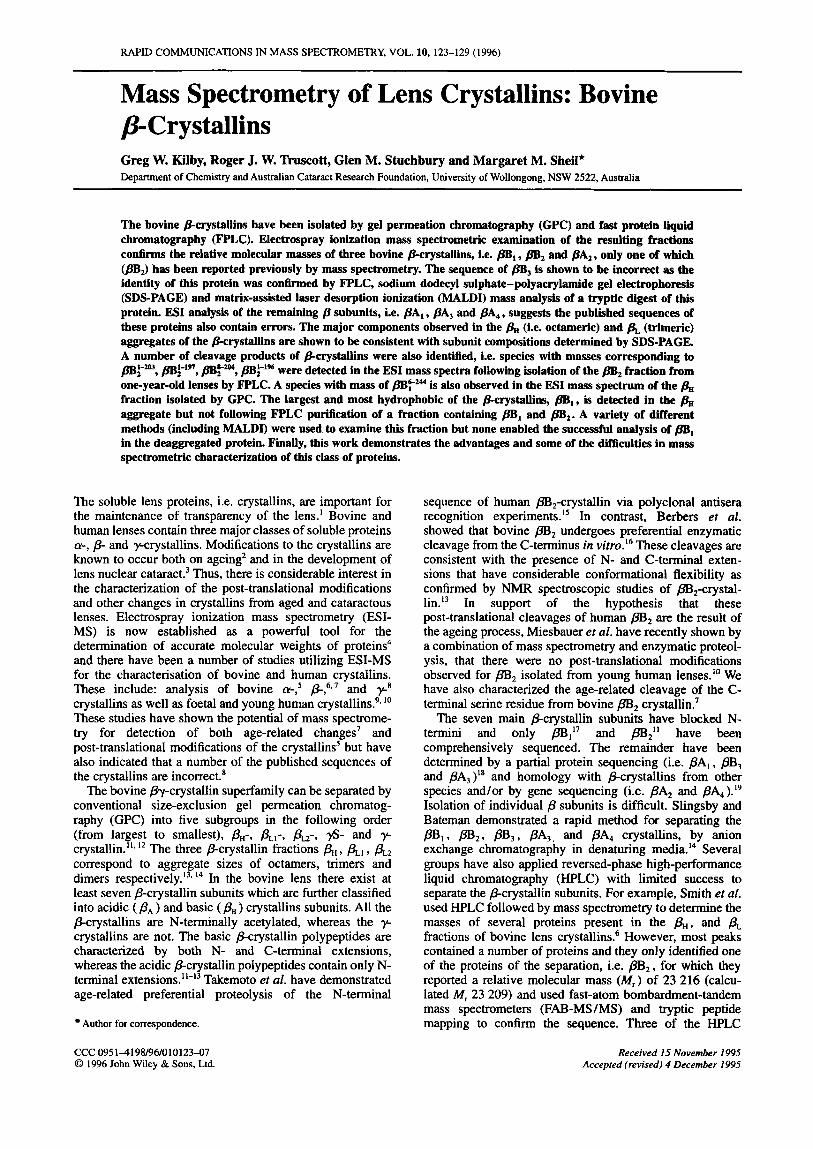
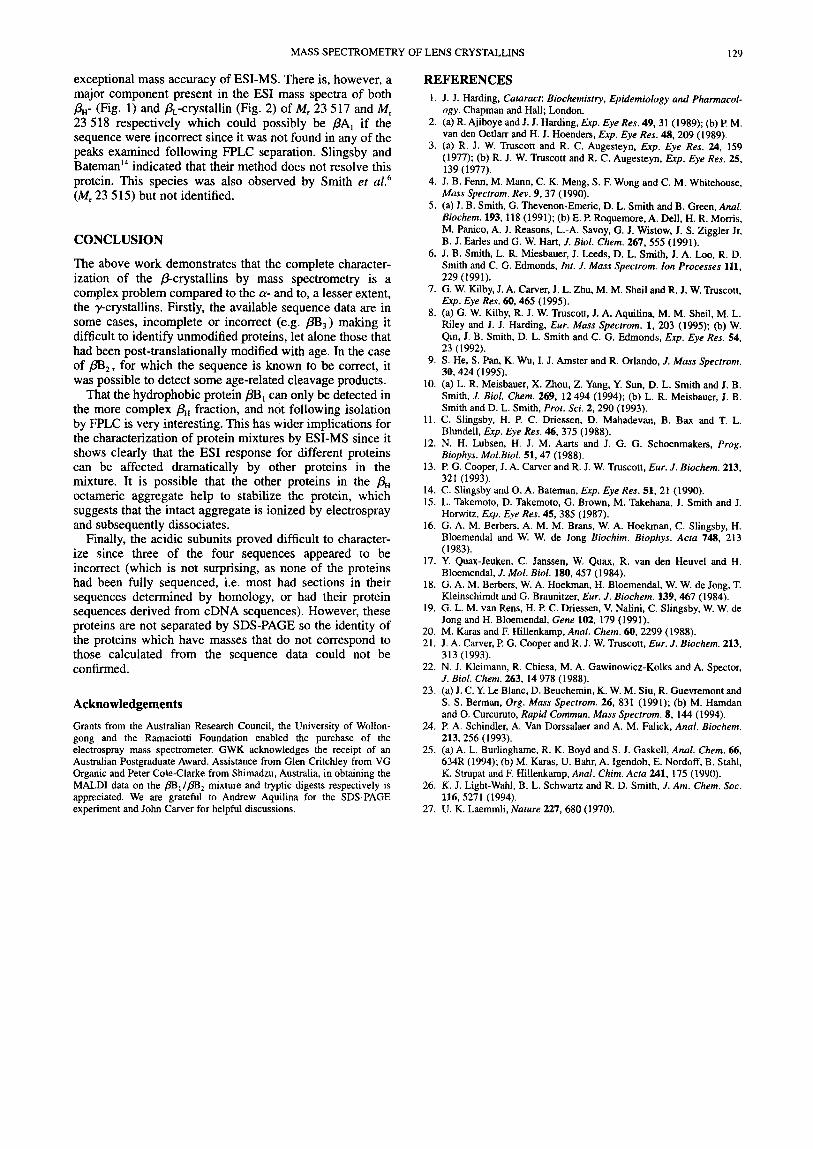
/I-Crystallin aggregates The initial separation of the /3-crystallin aggregates for this study was performed by gel permeation chromatography (GPC). The ESI mass spectra (transformed to a mass scale) of the bovine and & crystallin fractions obtained from the GPC separation are shown in Figs 1 and 2 respectively. The most obvious differences between the two spectra are the peaks with M, 22 411, 28 057 and 26 751 unique to the ESI mass spectra of bovine p-crystallin (Fig. 1) and the peak with a M , of 25 506 unique to the ESI mass spectra of &-crystallin (Fig. 2). Table 1 shows the subunits to which each of the peaks have been tentatively assigned along with the relative molecular masses of the P-crystallin subunits
h
3
- PAI 24240
d %-
P 23517
p1iI'- 26751
PA4 22411
0 22000 23000 24000 25W 2 6 W 27000 2w)oo 2 Y W
p1iI'- 26751
PA4 22411
0 22000 23000 24000 25W 2 6 W 27000 2w)oo 2 Y W
Mass
Figure 1. ESI mass spectrum (transformed to a mass scale) of the bovine &, fraction obtained by gel permeation chromatography (GPC).
MASS SPECTROMETRY OF LENS CRYSTALLINS 125
0 22000 23000 24000 25000 26000 27000 28000 29000
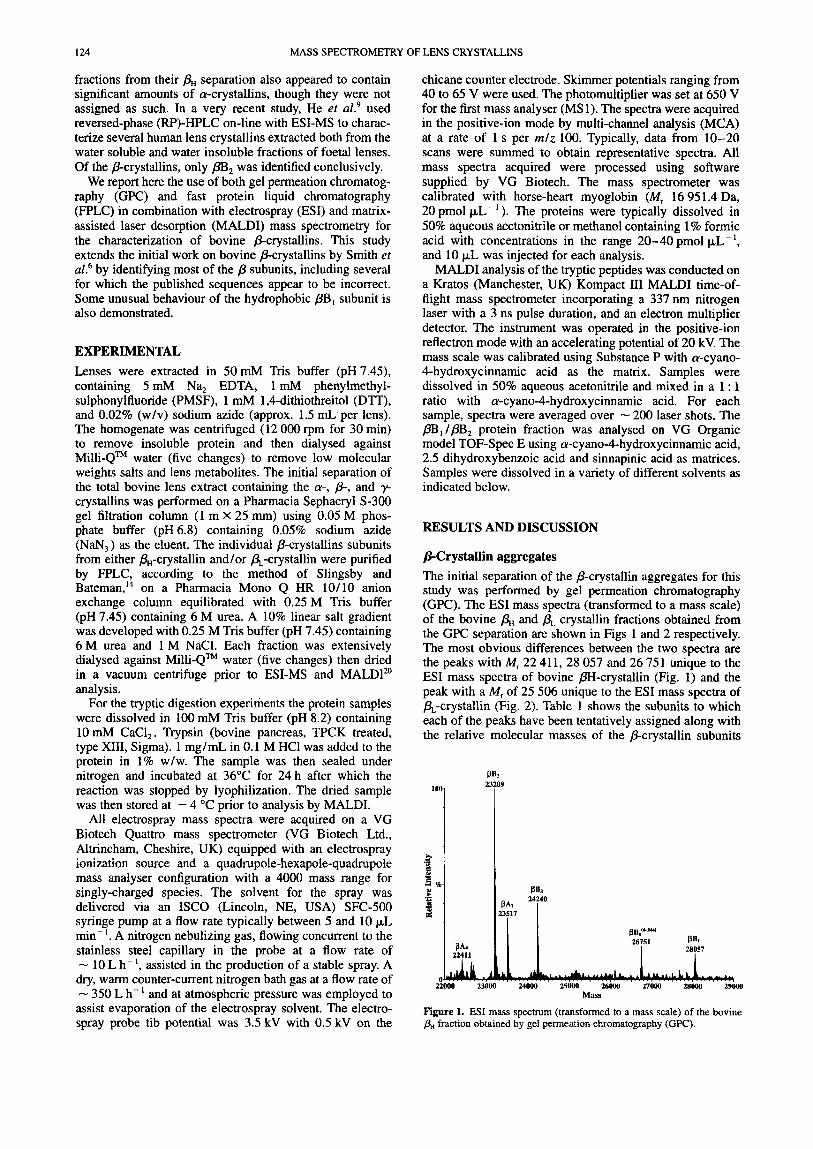
Mass Figure 2. ESI mass spectrum (transformed to a mass scale) of the bovine & fraction obtained by gel permeation chromatography (GPC).
calculated from their respective sequences. The only masses in both the spectra that agree with the available sequence data are those for PB, (M, observed of 28057 and calculated of 28 055)'' and pB2 (M, observed and calculated of 23 209).11 It has been shown previously by SDS-PAGE that pB, is present as a major component only in the &, aggregate and that pB2 is the major component in both aggregate^.'^ The ESI mass analysis of a- and &-crystallin supports this finding. This is also the first reported confirmation of the sequence of bovine pB, by mass spectrometry. pB, has been shown by other techniques to undergo post-translational cleavage of the N-terminus (residues 1-12) to yield pBlb (M, 27 028).'* There is no evidence of this species in the ESI mass spectra of PH- crystallin (Fig. l), although there is a peak with Mr 26 751 that corresponds to the mass of pBy2244 (M, 26752). It is likely that this is a cleavage product of pB, (and not a separate P-crystallin) since it is only present in ESI maSs spectra that show pB, , i.e. &crystallin. Furthermore PB, , along with the other basic pcrystallins, possesses both N-
1
PBla
PBlb
PB3 PB2 -
2
Table 1. Summary of ESI-MS analysis and sequence data for the bovine &crystallins
Sequence data M, observed by ESI-MS FPLC
Bfryrtallin pl-l aggregate pL aggregate
pB, 23209 23210 pB, 24240 24240 PA, 23518 23517
PA3 - 25 506
Peak numbers as shown in Fig. 4.
pB, 28057 -
- - PA2
PA4 22411 -
Following FF'LC
23 209 24 240
22 139
22411
-
-
-
peakno." M, Ref. 1 28055 17 1 23209 1 1 4 24434 18 - 23210 18 4 22 141 19 - 25 155 18 7 23771 19
(residues 1-57) and C-terminal (residues 237-252) peptide extensions from its globular domains," so it is quite reasonable to expect that both the N- and C-terminal peptide extensions are accessible to any chemical or enzymatic cleavage processes.
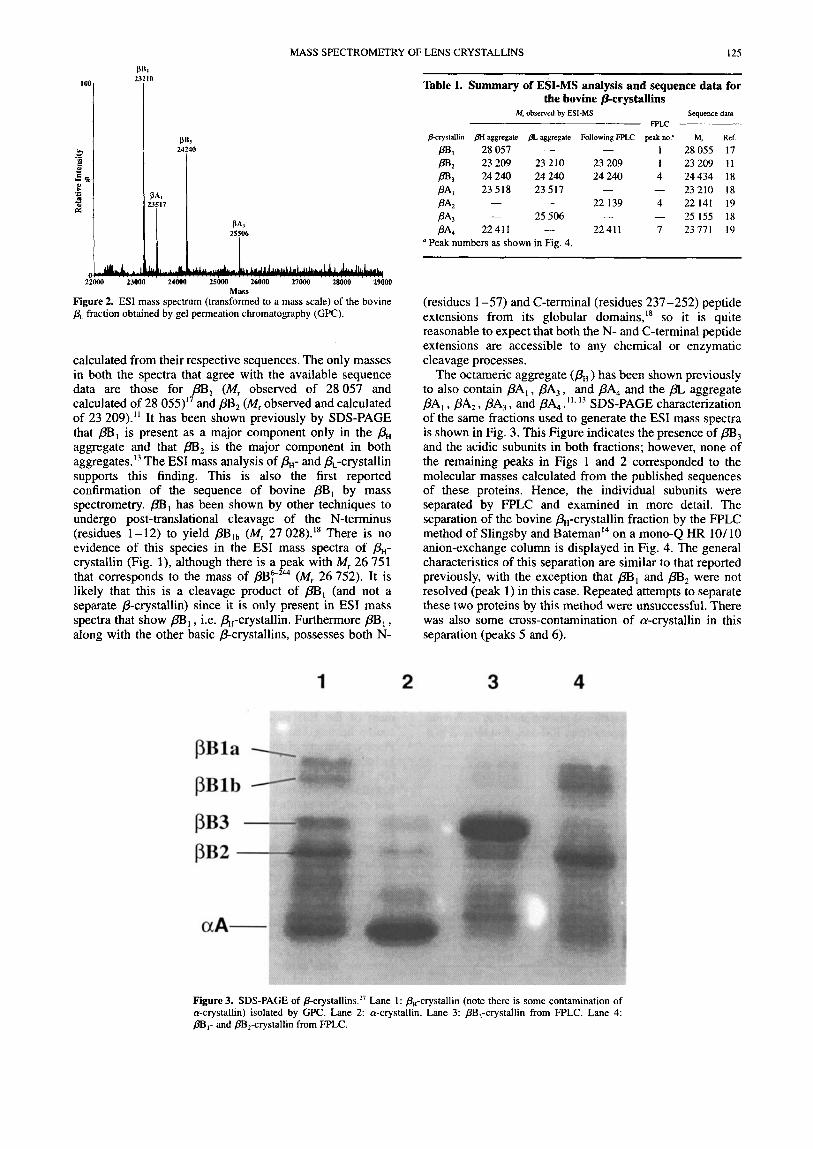
The octameric aggregate (PH ) has been shown previously to also contain PA,, PA,, and PA4 and the @ aggregate PA, , PA2, PA3, and PA4 .I1. l3 SDS-PAGE characterization of the same fractions used to generate the ESI mass spectra is shown in Fig. 3. This Figure indicates the presence of pB3 and the acidic subunits in both fractions; however, none of the remaining peaks in Figs 1 and 2 corresponded to the molecular masses calculated from the published sequences of these proteins. Hence, the individual subunits were separated by FPLC and examined in more detail. The separation of the bovine P,-crystallin fraction by the FPLC method of Slingsby and BatemanL4 on a mono-Q HR 10/ 10 anion-exchange column is displayed in Fig. 4. The general characteristics of this separation are similar to that reported previously, with the exception that pB, and pB, were not resolved (peak 1) in this case. Repeated attempts to separate these two proteins by this method were unsuccessful. There was also some cross-contamination of a-crystallin in this separation (peaks 5 and 6).
3 4
Figure 3. SDS-PAGE of P-~rystallins.~~ Lane 1 : &-crystallin (note there is some contamination of a-crystallin) isolated by GPC. Lane 2 a-crystallin. Lane 3: PB,-crystallin from FPLC. Lane 4: pBI- and cry cry stall in from FPLC.
126 MASS SPECTROMETRY OF LENS CRYSTALLINS
22523
c c , I I . 1
Figure 4. Separation of the &crystallins by anion exchange fast protein liquid chromatography (FPLC) according to the method of Slingsby and Bateman.I4 Peak 1, pB,- and /B,-crystallins; peak 4, m,- and PA,- crystallins; peaks 5 and 6, a-crystallin; peak 7, PA,-crystallin.
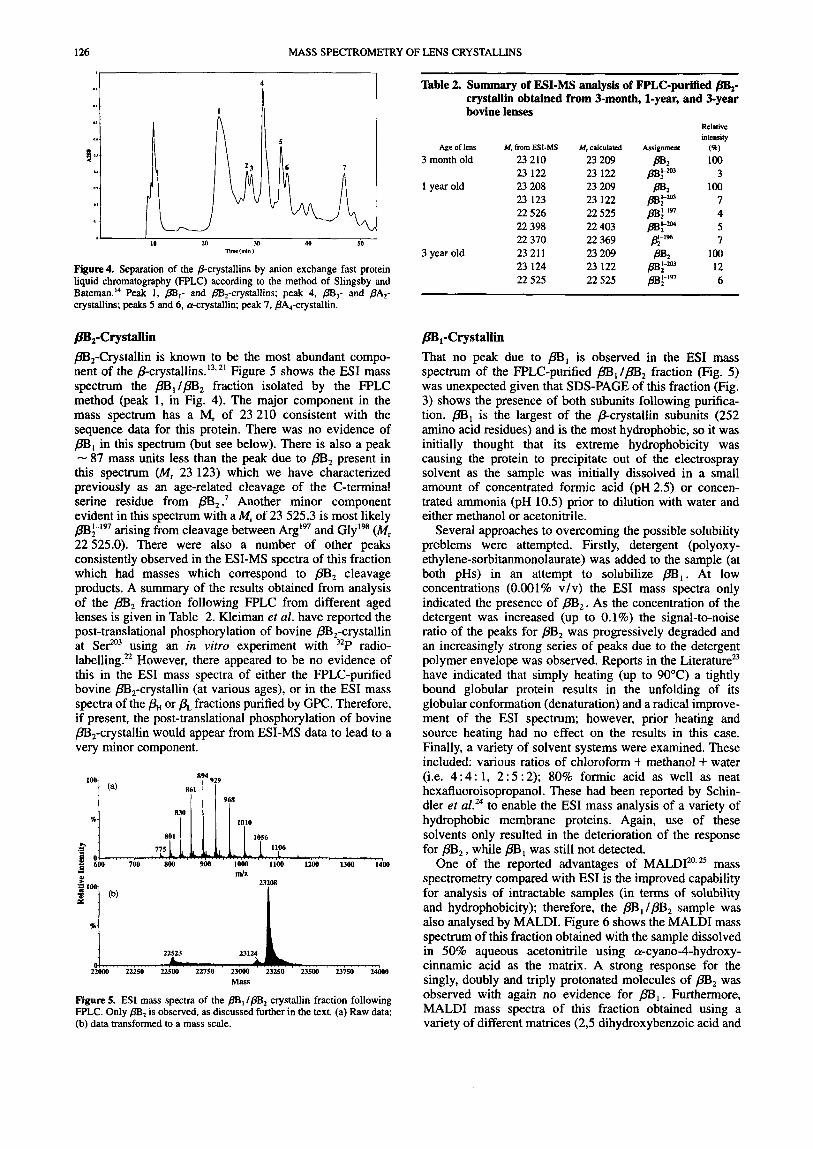
/3B,-Crystallin pB,-Crystallin is known to be the most abundant compo- nent of the /3-~rystallins.’~~~’ Figure 5 shows the ESI mass spectrum the @,/pB, fraction isolated by the FPLC method (peak 1, in Fig. 4). The major component in the mass spectrum has a M, of 23 210 consistent with the sequence data for this protein. There was no evidence of pBl in this spectrum (but see below). There is also a peak - 87 mass units less than the peak due to pB2 present in this spectrum (MI 23 123) which we have characterized previously as an age-related cleavage of the C-terminal serine residue from @,.’ Another minor component evident in this spectrum with a MI of 23 525.3 is most likely @:-I9’ arising from cleavage between ArgJ9’ and GlyI9’ (MI 22 525.0). There were also a number of other peaks consistently observed in the ESI-MS spectra of this fraction which had masses which correspond to @, cleavage products. A summary of the results obtained from analysis of the @, fraction following FPLC from different aged lenses is given in Table 2. Kleiman et al. have reported the post-translational phosphorylation of bovine @,-crystallin at Se?” using an in vitro experiment with 32P radio- labelling>* However, there appeared to be no evidence of this in the ESI mass spectra of either the FPLC-purified bovine pB,-crystallin (at various ages), or in the ESI mass spectra of the &, or pL fractions purified by GPC. Therefore, if present, the post-translational phosphorylation of bovine pB,-crystallin would appear from ESI-MS data to lead to a very minor component.
894 929
I];, , ; _ , , , , , ,
801 1056 4 775 1106
5 600 700 800 900 1000 1100 1200 1300 1400 1
M S
Figure 5. ESI mass spectra of the /3B, I @ , crystallin fraction following FPLC. Only pB, is observed, as discussed further in the text. (a) Raw data; (b) data transformed to a mass scale.
Table 2. Summary of ESI-MS analysis of FPLC-purified pB2- crystallin obtained from %month, 1-year, and %year bovine lenses
Relative inrcnsity
Age of lens M, from ESI-MS M. calculated Assignment (%)
3 month old 23 210 23 209 BB, 100 23 122 23 122 /3B:-m3 3
1 year old 23 208 23 209 B B 2 100 23 123 23 122 pB;-” 7 22 526 22 525 pB;-”’ 4 22 398 22403 pBFm 5 22 370 22 369 E-’” I
3 year old 23 211 23 209 BB, 100 23 124 23 122 mi-” 12 22 525 22525 @;-I” 6
fl,-CrystaIlin That no peak due to pB, is observed in the ESI mass spectrum of the FPLC-purified @,I@, fraction (Fig. 5 ) was unexpected given that SDS-PAGE of this fraction (Fig. 3) shows the presence of both subunits following purifica- tion. pBl is the largest of the Pcrystallin subunits (252 amino acid residues) and is the most hydrophobic, so it was initially thought that its extreme hydrophobicity was causing the protein to precipitate out of the electrospray solvent as the sample was initially dissolved in a small amount of concentrated formic acid (pH 2.5) or concen- trated ammonia (pH 10.5) prior to dilution with water and either methanol or acetonitrile.
Several approaches to overcoming the possible solubility prcblems were attempted. Firstly, detergent (polyoxy- ethylene-sorbitanmonolaurate) was added to the sample (at both pHs) in an attempt to solubilize pB, . At low concentrations (0.001% v/v) the ESI mass spectra only indicated the presence of pB2. As the concentration of the detergent was increased (up to 0.1%) the signal-to-noise ratio of the peaks for pB2 was progressively degraded and an increasingly strong series of peaks due to the detergent polymer envelope was observed. Reports in the Literat~re,~ have indicated that simply heating (up to 9OOC) a tightly bound globular protein results in the unfolding of its globular conformation (denaturation) and a radical improve- ment of the ESI spectrum; however, prior heating and source heating had no effect on the results in this case. Finally, a variety of solvent systems were examined. These included: various ratios of chloroform + methanol + water (i.e. 4: 4: 1, 2 : 5 : 2); 80% formic acid as well as neat hexafluoroisopropanol. These had been reported by Schin- dler et aLZ4 to enable the ESI mass analysis of a variety of hydrophobic membrane proteins. Again, use of these solvents only resulted in the deterioration of the response for pB, , while pB, was still not detected.
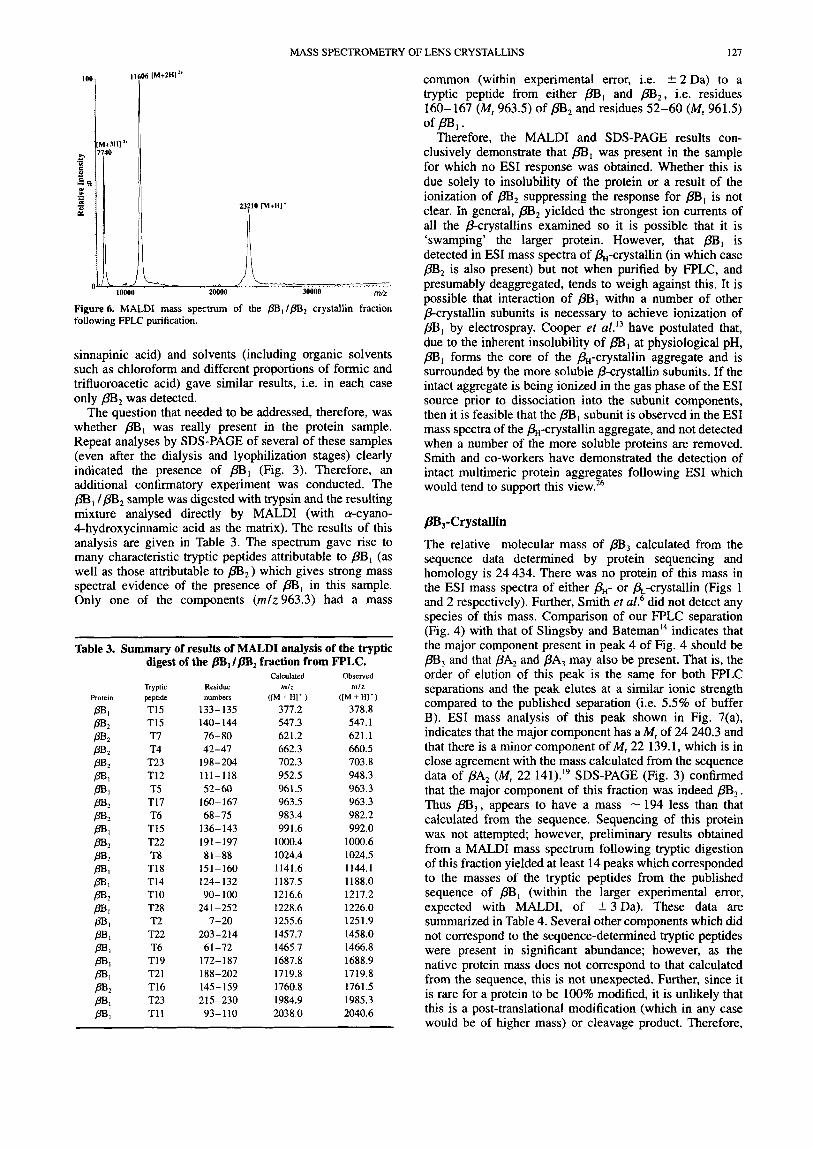
One of the reported advantages of MALD120*25 mass spectrometry compared with ESI is the improved capability for analysis of intractable samples (in terms of solubility and hydrophobicity); therefore, the pB, /pS, sample was also analysed by MALDI. Figure 6 shows the MALDI mass spectrum of this fraction obtained with the sample dissolved in 50% aqueous acetonitrile using a-cyano-4-hydroxy- cinnamic acid as the matrix. A strong response for the singly, doubly and triply protonated molecules of pB2 was observed with again no evidence for pB,. Furthermore, MALDI mass spectra of this fraction obtained using a variety of different matrices (2,5 dihydroxybenzoic acid and
MASS SPECTROMETRY OF LENS CRYSTALLINS 127
)h [M+2Hl'*
23210 IM+HI+
20000 30000 ll%.
Figure6. MALDI mass spectrum of the pS,/pB, crystallin fraction following FPLC purification.
sinnapinic acid) and solvents (including organic solvents such as chloroform and different proportions of formic and trifluoroacetic acid) gave similar results, i.e. in each case only pB, was detected.
The question that needed to be addressed, therefore, was whether pB, was really present in the protein sample. Repeat analyses by SDS-PAGE of several of these samples (even after the dialysis and lyophilization stages) clearly indicated the presence of pBl (Fig. 3). Therefore, an additional confirmatory experiment was conducted. The pB, ipB2 sample was digested with trypsin and the resulting mixture analysed directly by MALDI (with a-cyano- 4-hydroxycinnamic acid as the matrix). The results of this analysis are given in Table 3. The spectrum gave rise to many characteristic tryptic peptides attributable to pBl (as well as those attributable to pB2) which gives strong mass spectral evidence of the presence of pBl in this sample. Only one of the components (miz963.3) had a mass
Table 3. Summary of results of MALDI analysis of the tryptic digest of the OB, /BB, fraction from F'PLC.
Rotein
P B I P B 2
P B 2
P B 2
P B 2
PBI P B I P B 2
PB, P B I P B Z P B Z
P B I P B I P B 2
PB! PB, PB, P B I PB, P B I PB, P B I P B I
I
Tryptic peptide
TI5 T15 T7 T4 T23 T12 T5 TI7 T6 T15 T22 T8 TI8 T14 T10 T28 T2
~ . . - Residue numbers
133-135 140-144 76-80 42-47
111-118
160-167 68-75
198-204
52-60
136- 143 191-197 81-88
151-160 124- 132 90- 100
241 -252 7-20
Calculated mlz
( l M + H l - ) 377.2 547.3 621.2 662.3 702.3 952.5 961.5 963.5 983.4 99 1.6
1000.4 1024.4 1141.6 1187.5 1216.6 1228.6 1255.6
Observed mlz
(IM + HI') 378.8 547.1 621.1 660.5 703.8 948.3 963.3 963.3 982.2 992.0
1000.6 1024.5 1144.1 1188.0 1217.2 1226.0 1251.9
common (within experimental error, i.e. 2 2 Da) to a tryptic peptide from either pB, and pB2, i.e. residues 160-167 (M, 963.5) of pB2 and residues 52-60 (M, 961.5)
Therefore, the MALDI and SDS-PAGE results con- clusively demonstrate that pBl was present in the sample for which no ESI response was obtained. Whether this is due solely to insolubility of the protein or a result of the ionization of pB2 suppressing the response for pBl is not clear. In general, pB2 yielded the strongest ion currents of all the p-crystallins examined so it is possible that it is 'swamping' the larger protein. However, that pB, is detected in ESI mass spectra of &crystallin (in which case pB, is also present) but not when purified by FPLC, and presumably deaggregated, tends to weigh against this. It is possible that interaction of pB, withn a number of other P-crystallin subunits is necessary to achieve ionization of pBl by electrospray. Cooper et uLI3 have postulated that, due to the inherent insolubility of pBl at physiological pH, pB, forms the core of the &-crystallin aggregate and is surrounded by the more soluble &crystallin subunits. If the intact aggregate is being ionized in the gas phase of the ESI source prior to dissociation into the subunit components, then it is feasible that the pB, subunit is observed in the ESI mass spectra of the &pxystallin aggregate, and not detected when a number of the more soluble proteins are removed. Smith and co-workers have demonstrated the detection of intact multimeric protein aggregates following ESI which would tend to support this view."
of@, .
/?B,-Crystallin
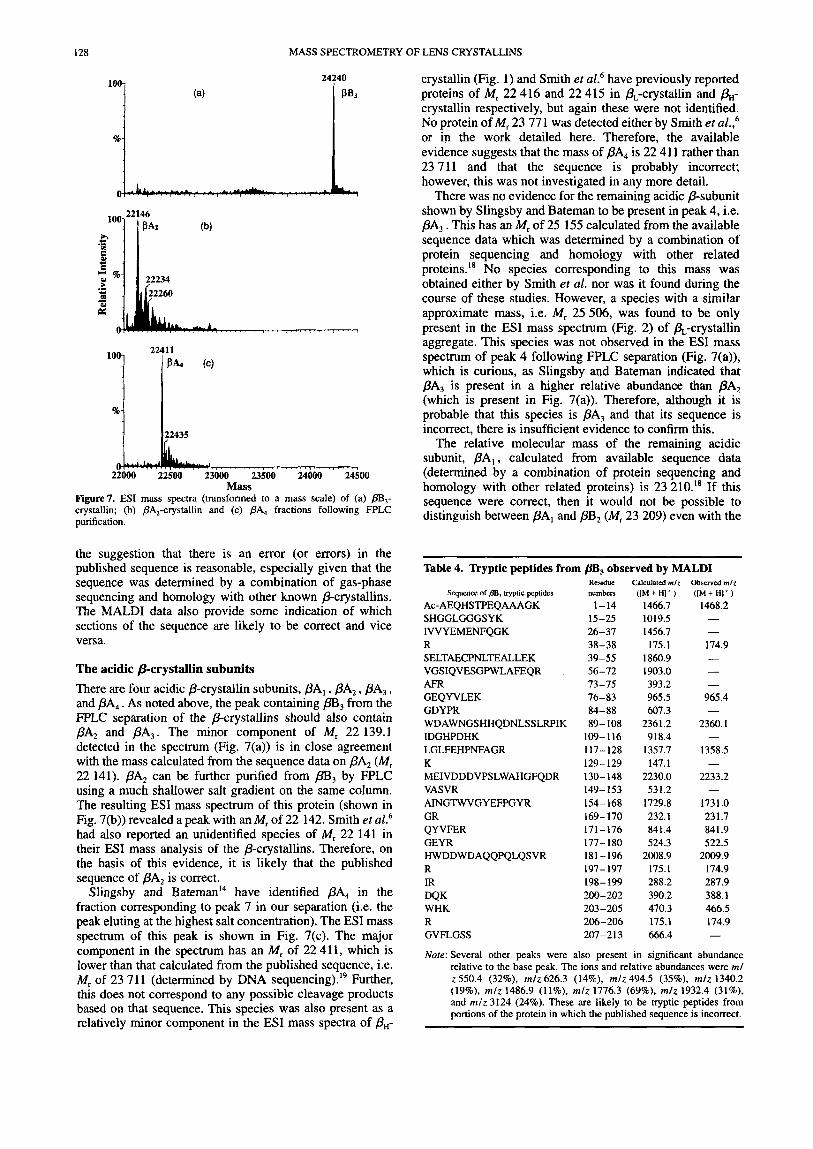
The relative molecular mass of pS, calculated from the sequence data determined by protein sequencing and homology is 24 434. There was no protein of this mass in the EST mass spectra of either &- or &-crystallin (Figs 1 and 2 respectively). Further, Smith et ~ 1 . ~ did not detect any species of this mass. Comparison of our FPLC separation (Fig. 4) with that of Slingsby and BatemanI4 indicates that the major component present in peak 4 of Fig. 4 should be pB, and that PA2 and PA3 may also be present. That is, the order of elution of this peak is the same for both FPLC separations and the peak elutes at a similar ionic strength compared to the published separation (i.e. 5.5% of buffer B). ESI mass analysis of this peak shown in Fig. 7(a), indicates that the major component has a MI of 24 240.3 and that there is a minor component of M, 22 139.1, which is in close agreement with the mass calculated from the sequence data of PA2 (M, 22 141).19 SDS-PAGE (Fig. 3) confirmed that the major component of this fraction was indeed PB,. Thus PB3, appears to have a mass - 194 less than that calculated from the sequence. Sequencing of this protein was not attempted; however, preliminary results obtained from a MALDI mass spectrum following tryptic digestion of this fraction yielded at least 14 peaks which corresponded to the masses of the tryptic peptides from the published sequence of pBl (within the larger experimental error, expected with MALDI, of +3Da). These data are summarized in Table 4. Several other components which did
T22 203-2 14 1457.7 1458.0 not correspond to the sequence-determined tryptic peptides T6 61-72 1465.7 1466.8 were present in significant abundance; however, as the
native protein mass does not correspond to that calculated TI9 172-187 1687.8 1688.9
from the sequence, this is not unexpected. Further, since it T2 1 188-202 1719.8 1719.8 TI6 145-159 1760.8 1761.5 is rare for a protein to be 100% modified, it is unlikely that T23 215-230 1984.9 1985.3 TI1 93-110 2038.0 2040.6 this is a post-translational modification (which in any case
would be of higher mass) or cleavage product. Therefore,
128 MASS SPECTROMETRY OF LENS CRYSTALLINS
24t40
22000 22500 23000 23500 24000 24500 Mass
Figure7. ESI mass spectra (transformed to a mass scale) of (a) @%,- crystallin; (b) PA,-crystallin and (c) PA4 fractions following FPLC purification.
the suggestion that there is an error (or errors) in the published sequence is reasonable, especially given that the sequence was determined by a combination of gas-phase sequencing and homology with other known pcrystallins. The MALDI data also provide some indication of which sections of the sequence are likely to be correct and vice versa.
The acidic P-crystallin subunits There are four acidic P-crystallin subunits, PA, , PA2, PA,, and PA4. As noted above, the peak containing pB3 from the FPLC separation of the P-crystallins should also contain PA2 and PA,. The minor component of M, 22 139.1 detected in the spectrum (Fig. 7(a)) is in close agreement with the mass calculated from the sequence data on PA2 (MI 22 141). PA2 can be further purified from pB3 by FPLC using a much shallower salt gradient on the same column. The resulting ESI mass spectrum of this protein (shown in Fig. 7(b)) revealed a peak with an MI of 22 142. Smith et a1.6 had also reported an unidentified species of M, 22 141 in their ESI mass analysis of the P-crystallins. Therefore, on the basis of this evidence, it is likely that the published sequence of PA2 is correct.
Slingsby and Bateman14 have identified PA4 in the fraction corresponding to peak 7 in our separation (i.e. the peak eluting at the highest salt concentration). The ESI mass spectrum of this peak is shown in Fig. 7(c). The major component in the spectrum has an MI of 22 411, which is lower than that calculated from the published sequence, i.e. MI of 23 711 (determined by DNA sequencing)." Further, this does not correspond to any possible cleavage products based on that sequence. This species was also present as a relatively minor component in the ESI mass spectra of PH-
crystallin (Fig. 1) and Smith et a1.6 have previously reported proteins of M, 22 416 and 22 415 in P,-crystallin and pH- crystallin respectively, but again these were not identified. No protein of MI 23 771 was detected either by Smith et a1.,6 or in the work detailed here. Therefore, the available evidence suggests that the mass of PA4 is 22 4 11 rather than 23 711 and that the sequence is probably incorrect; however, this was not investigated in any more detail.
There was no evidence for the remaining acidic &subunit shown by Slingsby and Bateman to be present in peak 4, i.e. PA, . This has an M, of 25 155 calculated from the available sequence data which was determined by a combination of protein sequencing and homology with other related proteins." No species corresponding to this mass was obtained either by Smith et al. nor was it found during the course of these studies. However, a species with a similar approximate mass, i.e. M, 25 506, was found to be only present in the ESI mass spectrum (Fig. 2) of a-crystallin aggregate. This species was not observed in the ESI mass spectrum of peak 4 following FPLC separation (Fig. 7(a)), which is curious, as Slingsby and Bateman indicated that PA, is present in a higher relative abundance than PA2 (which is present in Fig. 7(a)). Therefore, although it is probable that this species is PA, and that its sequence is incorrect, there is insufficient evidence to confirm this.
The relative molecular mass of the remaining acidic subunit, PA,, calculated from available sequence data (determined by a combination of protein sequencing and homology with other related proteins) is 23 210.'' If this sequence were correct, then it would not be possible to distinguish between PA, and pB2 (MI 23 209) even with the
Table 4. Tryptic peptides from pB, observed by MALDI Residue Calculated mlz Observed mtz
Sequence of j3B, vyplic peptides numbers ([M + HI' ) ([M + HI' )
Ac- AEQHSTPEQA A AGK 1-14 1466.7 1468.2 SHGGLGGGSYK 15-25 1019.5 - IVVYEMENFQGK 26-37 1456.7 - R 38-38 175.1 174.9 SELTAECPNLTEALLEK 39-55 1860.9 - VGSIQVESGPWLAFEQR 56-72 1903.0 - AFR 73-75 393.2 -
GEQYVLEK 76-83 965.5 965.4 GDYPR 84-88 607.3 - WDAWNGSHHQDNLSSLRPIK 89- 108 2361.2 2360.1 IDGHPDHK 109-116 918.4 - LGLFEHPNFAGR 117-128 1357.7 1358.5 K 129-129 147.1 - MEIVDDDVPSLWAHGFQDR 130- 148 2230.0 2233.2 VASVR 149-153 531.2 - AINGTWVGY EFPGY R 154-168 1729.8 1731.0 GR 169-170 232.1 231.7 QYVFER 171-176 841.4 841.9 GEYR 177-180 524.3 522.5
R 197-197 175.1 174.9 IR 198-199 288.2 287.9 DQK 200-202 390.2 388.1 WHK 203-205 470.3 466.5 R 206-206 175.1 174.9 GVFLGSS 207-213 666.4
Noze: Several other peaks were also present in significant abundance relative to the base peak. The ions and relative abundances were m/ z 550.4 (32%), mlz 626.3 (14%). m / z 494.5 (35%). m/z 1340.2 (19%), m/z 1486.9 (ll%), m / z 1776.3 (69%). m / z 1932.4 (31%). and m/z 3124 (24%). These are likely to be tryptic peptides from portions of the protein in which the published sequence is incorrect.
HWDDWDAQQPQLQSVR 181-196 2008.9 2009.9
-
MASS SPECTROMETRY OF LENS CRYSTALLINS 129
exceptional mass accuracy of ESI-MS. There is, however, a major component present in the ESI mass spectra of both pH- (Fig. 1) and &-crystallin (Fig. 2) of M, 23 517 and M, 23 518 respectively which could possibly be PA, if the sequence were incorrect since it was not found in any of the peaks examined following FPLC separation. Slingsby and BatemanI4 indicated that their method does not resolve this protein. This species was also observed by Smith et d6 (M, 23 5 15) but not identified.
CONCLUSION
The above work demonstrates that the complete character- ization of the Pcrystallins by mass spectrometry is a complex problem compared to the LY- and to, a lesser extent, the y-crystallins. Firstly, the available sequence data are in some cases, incomplete or incorrect (e.g. pB3) making it difficult to identify unmodified proteins, let alone those that had been post-translationally modified with age. In the case of pB2, for which the sequence is known to be correct, it was possible to detect some age-related cleavage products.
That the hydrophobic protein pB, can only be detected in the more complex pH fraction, and not following isolation by FPLC is very interesting. This has wider implications for the characterization of protein mixtures by ESI-MS since it shows clearly that the ESI response for different proteins can be affected dramatically by other proteins in the mixture. It is possible that the other proteins in the pH octameric aggregate help to stabilize the protein, which suggests that the intact aggregate is ionized by electrospray and subsequently dissociates.
Finally, the acidic subunits proved difficult to character- ize since three of the four sequences appeared to be incorrect (which is not surprising, as none of the proteins had been fully sequenced, i.e. most had sections in their sequences determined by homology, or had their protein sequences derived from cDNA sequences). However, these proteins are not separated by SDS-PAGE so the identity of the proteins which have masses that do not correspond to those calculated from the sequence data could not be confirmed.
Acknowledgements Grants from the Australian Research Council, the University of Wollon- gong and the Ramaciotti Foundation enabled the purchase of the electrospray mass spectrometer. GWK acknowledges the receipt of an Australian Postgraduate Award. Assistance from Glen Critchley from VG Organic and Peter Cole-Clarke from Shimadzu, Australia, in obtaining the MALDl data on the @ , I @ , mixture and tryptic digests respectively is appreciated. We are grateful to Andrew Aquilina for the SDS-PAGE experiment and John Carver for helpful discussions.
REFERENCES 1. J. J. Harding, Cataract: Biochemistry, Epidemiology and Pharmacol-
ogy. Chapman and Hall; London. 2. (a) R. Ajiboye and J. J. Harding, Exp. Eye Res. 49,31 (1989); (b) P. M.
van den Oetlarr and H. J. Hoenders, Exp. Eye Res. 48,209 (1989). 3. (a) R. J. W. Truscott and R. C . Augesteyn, Exp. Eye Res. 24, 159
(1977); (b) R. J. W. Truscott and R. C. Augesteyn, &p. Eye Res. 25, 139 (1977).
4. J. B. Fenn, M. Mann, C. K. Meng, S. F. Wong and C. M. Whitehouse, Mass Spectrom. Rev. 9, 37 (1990).
5. (a) J. B. Smith, G. Thevenon-Emeric, D. L. Smith and B . Green, Anal. Biochem. 193,118 (1991); (b) E. P. Roquemore, A. Dell, H. R. Moms, M. Panico, A. J. Reasons, L.-A. Savoy, G. J. Wistow, J. S. Ziggler Jr, B. J. Earles and G. W. Hart, J. Biol. Chem. 267,555 (1991).
6. J. B. Smith, L. R. Miesbauer, J. Leeds, D. L. Smith, J. A. Loo, R. D. Smith and C. G. Edmonds, Inr. J . Mass Spectrom. Ion Processes 111, 229 (1991).
7. G. W. Kilby, J. A. Carver, J. L. Zhu, M. M. Sheil and R. J. W. Truscott, Exp. Eye Res. 60,465 (1995).
8. (a) G. W. Kilby, R. J. W. Truscott, J. A. Aquilina, M. M. Sheil, M. L. Riley and J. J. Harding, Eur. Muss Specrrom. 1, 203 (1995); (b) W. Qin, J. B. Smith, D. L. Smith and C. G. Edmonds. Exp. Eye Res. 54, 23 (1992).
9. S. He, S. Pan, K. Wu, I. J. Amster and R. Orlando, J . Muss Spectrom. 30,424 (1995).
10. (a) L. R. Meisbauer, X. Zhou, Z. Yang, Y. Sun, D. L. Smith and J. B. Smith, J. Biol. Chem. 269, 12 494 (1994); (b) L. R. Meisbauer, J. B. Smith and D. L. Smith, Pror. Sci. 2,290 (1993).
11. C. Slingsby, H. P. C. Driessen, D. Mahadevan, B. Bax and T. L. Blundell, Exp. Eye Res. 46, 375 (1988).
12. N. H. Lubsen, H. J. M. Aarts and J. G. G. Schoenmakers, Prog. Biophys. MoLBiol. 51.47 (1988).
13. P. G. Cooper, J. A. Carver and R. J. W. Truscott, Eur. J. Biochem. 213, 321 (1993).
14. C. Slingsby and 0. A. Bateman, Erp. Eye Res. 51,21 (1990). 15. L. Takemoto, D. Takemoto, G. Brown, M. Takehana, J. Smith and J.
Horwitz, Exp. Eye Res. 45,385 (1987). 16. G. A. M. Berbers, A. M. M. Brans, W. A. Hoekman, C. Slingsby, H.
Bloemendal and W. W. de Jong Biochim. Biophys. Acra 748, 213 (1983).
17. Y. Quax-Jeuken, C. Janssen, W. Quax, R. van den Heuvel and H. Bloemendal, J. Mol. Biol. 180,457 (1984).
18. G. A. M. Berbers, W. A. Hoekman, H. Bloemendal, W. W. de Jong, T. Kleinschimdt and G. Braunitzer, Eur. J . Biochem. 139,467 (1984).
19. G. L. M. van Rens, H. P. C. Driessen, V. Nalini, C. Slingsby, W. W. de Jong and H. Bloemendal, Gene 102. 179 (1991).
20. M. Karas and F. Hillenkamp, Anal. Chem. 60,2299 (1988). 21. J. A. Carver, P. G. Cooper and R. J. W. Truscott, Eur. J. Biochem. 213,
313 (1993). 22. N. J. Kleimann, R. Chiesa, M. A. Gawinowicz-Kolks and A. Spector,
J. Biol. Chem. 263, 14 978 (1988). 23. (a) J. C. Y. Le Blanc, D. Beuchemin, K. W. M. Siu, R. Guevremont and
S. S. Berman, Org. Mass Specrrom. 26, 831 (1991); (b) M. Hamdan and 0. Curcuruto, Rapid Comrnun. Mass Spectrom. 8, 144 (1994).
24. P. A. Schindler, A. Van Dorssalaer and A. M. Falick, Anal. Biochem. 213,256 (1993).
25. (a) A. L. Burlinghame, R. K. Boyd and S. J. Gaskell, Anal. Chem. 66, 634R (1994); (b) M. Karas, U. Bahr, A. Igendoh, E. Nordoff, B. Stahl, K. Strupat and F. Hillenkamp, Anal. Chim. Acra 241, 175 (1990).
26. K. J. Light-Wahl. B. L. Schwartz and R. D. Smith, J. Am. Chem. SOC. 116,5271 (1994).
27. U. K. Laemmli, Nature 227, 680 (1970).