Managing Tail Latency in Datacenter-Scale File Systems ... · production systems must be simple and...
15
Managing Tail Latency in Datacenter-Scale File Systems Under Production Constraints Pulkit A. Misra ⋆ María F. Borge ‡ Íñigo Goiri † Alvin R. Lebeck ⋆ Willy Zwaenepoel ‡ δ Ricardo Bianchini † ⋆ Duke University ‡ University of Sydney δ EPFL † Microsoft Research Abstract Distributed file systems often exhibit high tail latencies, especially in large-scale datacenters and in the presence of competing (and possibly higher priority) workloads. This paper introduces techniques for managing tail la- tencies in these systems, while addressing the practical challenges inherent in production datacenters (e.g., hard- ware heterogeneity, interference from other workloads, the need to maximize simplicity and maintainability). We implement our techniques in a scalable distributed file system (an extension of HDFS) used in production at Microsoft. Our evaluation uses 70k servers in 3 datacen- ters, and shows that our techniques reduce tail latency significantly for production workloads. 1 Introduction Motivation. Large-scale distributed systems exhibit un- predictable high-percentile (tail) latency variations, which harm performance predictability and may drive users away. Many factors may cause these variations, such as component failures, replication overhead, load im- balance, and resource contention [18, 21, 33, 35, 49]. The problem is exacerbated when systems run on har- vested resources. Resource-harvesting datacenters co- locate latency-sensitive services (e.g., search engines) with batch jobs (e.g., data analytics, machine learning) to improve resource utilization [24, 50, 58, 61]. In these datacenters, performance isolation mechanisms [20, 24, 29, 36, 50, 56, 58, 61] throttle or even deny resources to the batch jobs when the services need them. Permission to make digital or hard copies of all or part of this work for personal or classroom use is granted without fee provided that copies are not made or distributed for profit or commercial advan- tage and that copies bear this notice and the full citation on the first page. Copyrights for components of this work owned by others than ACM must be honored. Abstracting with credit is permitted. To copy otherwise, or republish, to post on servers or to redistribute to lists, requires prior specific permission and/or a fee. Request permissions from [email protected]. EuroSys ’19, March 25–28, 2019, Dresden, Germany © 2019 Association for Computing Machinery. ACM ISBN 978-1-4503-6281-8/19/03. . . $15.00 https://doi.org/10.1145/3302424.3303973 0 20 40 60 80 100 00:00 04:00 08:00 12:00 16:00 20:00 24:00 Job run time (minutes) Hour of the day Figure 1. Run times of 300 copy jobs over 2 weeks. All days are overlayed over their 24 hours. Many papers have addressed tail latency management in distributed systems. For example, they have tackled straggler tasks in data analytics frameworks [9, 10, 43, 59] and requests in multi-tier services [31], tail laten- cies in distributed file/storage systems [34, 44], and en- forced service-level objectives (SLOs) for compute or storage [33, 37, 47, 51–53, 62]. Unfortunately, the prior works do not account for some important challenges and constraints of real production systems (Sections 2 and 7). For example, the server hardware in datacenters is heterogeneous in terms of resources and storage configurations (static heterogene- ity). The performance isolation mechanisms of resource- harvesting datacenters produce another form of (dynamic) heterogeneity. Thus, tail latency management techniques evaluated in the absence of such static and dynamic het- erogeneity may miss important effects. Datacenters are also very large; evaluating ideas on small systems side- steps many scalability challenges, e.g. difficulties with using centralized components. Perhaps most importantly, production systems must be simple and maintainable. Complex techniques (e.g., relying on sophisticated per- formance modeling) are undesirable, as they require ex- pertise and skills that most engineers are not trained on. Our work. In this paper, we focus on tail latencies in dis- tributed file systems under these production constraints. In particular, we address the challenging scenario where the distributed file system only stores data for the batch workloads, but the latency-sensitive services have full priority over the shared resources (e.g., CPUs, local disk
Transcript of Managing Tail Latency in Datacenter-Scale File Systems ... · production systems must be simple and...

Managing Tail Latency in Datacenter-Scale FileSystems Under Production Constraints
Pulkit A. Misra⋆ María F. Borge‡ Íñigo Goiri†
Alvin R. Lebeck⋆ Willy Zwaenepoel‡ δ Ricardo Bianchini†⋆Duke University ‡University of Sydney δEPFL †Microsoft Research
AbstractDistributed file systems often exhibit high tail latencies,especially in large-scale datacenters and in the presenceof competing (and possibly higher priority) workloads.This paper introduces techniques for managing tail la-tencies in these systems, while addressing the practicalchallenges inherent in production datacenters (e.g., hard-ware heterogeneity, interference from other workloads,the need to maximize simplicity and maintainability). Weimplement our techniques in a scalable distributed filesystem (an extension of HDFS) used in production atMicrosoft. Our evaluation uses 70k servers in 3 datacen-ters, and shows that our techniques reduce tail latencysignificantly for production workloads.
1 IntroductionMotivation. Large-scale distributed systems exhibit un-predictable high-percentile (tail) latency variations, whichharm performance predictability and may drive usersaway. Many factors may cause these variations, suchas component failures, replication overhead, load im-balance, and resource contention [18, 21, 33, 35, 49].The problem is exacerbated when systems run on har-vested resources. Resource-harvesting datacenters co-locate latency-sensitive services (e.g., search engines)with batch jobs (e.g., data analytics, machine learning)to improve resource utilization [24, 50, 58, 61]. In thesedatacenters, performance isolation mechanisms [20, 24,29, 36, 50, 56, 58, 61] throttle or even deny resources tothe batch jobs when the services need them.
Permission to make digital or hard copies of all or part of this workfor personal or classroom use is granted without fee provided thatcopies are not made or distributed for profit or commercial advan-tage and that copies bear this notice and the full citation on the firstpage. Copyrights for components of this work owned by others thanACM must be honored. Abstracting with credit is permitted. To copyotherwise, or republish, to post on servers or to redistribute to lists,requires prior specific permission and/or a fee. Request permissionsfrom [email protected] ’19, March 25–28, 2019, Dresden, Germany© 2019 Association for Computing Machinery.ACM ISBN 978-1-4503-6281-8/19/03. . . $15.00https://doi.org/10.1145/3302424.3303973
0
20
40
60
80
100
00:00 04:00 08:00 12:00 16:00 20:00 24:00
Job
run
time
(min
utes
)Hour of the day
Figure 1. Run times of 300 copy jobs over 2 weeks. Alldays are overlayed over their 24 hours.
Many papers have addressed tail latency managementin distributed systems. For example, they have tackledstraggler tasks in data analytics frameworks [9, 10, 43,59] and requests in multi-tier services [31], tail laten-cies in distributed file/storage systems [34, 44], and en-forced service-level objectives (SLOs) for compute orstorage [33, 37, 47, 51–53, 62].
Unfortunately, the prior works do not account for someimportant challenges and constraints of real productionsystems (Sections 2 and 7). For example, the serverhardware in datacenters is heterogeneous in terms ofresources and storage configurations (static heterogene-ity). The performance isolation mechanisms of resource-harvesting datacenters produce another form of (dynamic)heterogeneity. Thus, tail latency management techniquesevaluated in the absence of such static and dynamic het-erogeneity may miss important effects. Datacenters arealso very large; evaluating ideas on small systems side-steps many scalability challenges, e.g. difficulties withusing centralized components. Perhaps most importantly,production systems must be simple and maintainable.Complex techniques (e.g., relying on sophisticated per-formance modeling) are undesirable, as they require ex-pertise and skills that most engineers are not trained on.Our work. In this paper, we focus on tail latencies in dis-tributed file systems under these production constraints.In particular, we address the challenging scenario wherethe distributed file system only stores data for the batchworkloads, but the latency-sensitive services have fullpriority over the shared resources (e.g., CPUs, local disk
bandwidth) on the same machines. Thus, we seek the bestpossible file system tail latency for the batch workloads;service performance is protected by isolation techniques(e.g., [29, 36]) and are not a topic of this paper.
Though the batch jobs have more relaxed performanceconstraints than the services, lowering their tail latencyis important because: (1) completing them faster frees upcapacity for other jobs to run; (2) lower tail latency im-proves performance predictability and user satisfaction;and (3) batch jobs may be rendered useless if they takeexcessively long. As an illustration of the performancevariation we observe, Figure 1 shows the run times of300 executions of a simple I/O-bound job (distributedcopy of a 200-GB file) on 4k servers in a productiondatacenter over 2 weeks. As we can see, job performancemay vary 60× or more, due to tail data access latencies.
These performance variations occur despite the factthat speculative execution (SE) is enabled in our jobs. SEtracks the tasks’ durations and issues duplicate tasks formanaging tail latencies in batch workloads [9, 10, 59].Unfortunately, SE cannot tackle all sources of storage-level tail latencies without a stronger coupling betweencompute and storage layers [43]. Worse, SE may harmperformance when resources are scarce [8, 39, 41, 43,45], a common scenario in resource-harvesting datacen-ters. Thus, managing storage-level tail latencies indepen-dently is more attractive, leads to simpler systems (lesscoupling), and reduces the need for speculative tasks.
Along these lines, we first characterize the sources ofstorage-level tail latency impacting the run times of I/O-bound jobs shown in Figure 1 (Section 3). The character-ization shows that data read and write accesses exhibitthe most performance variation, not metadata operations.In addition, long disk queues and server-side throttlingare the main culprits, not the utilization of the network,CPU or memory.
We then propose two client-side techniques for man-aging tail data access latencies: “fail fast” for writes, and“smart hedging” for reads (Section 4). Both techniquesare oblivious to the source of variations, and rely onsimple server-side performance reporting and careful re-active policies, while leveraging the existing replicationand fault-tolerance mechanisms in distributed file sys-tems. Many systems use chain replication [48] for datawrites, where each write request (possibly broken intochunks called “packets”) is pipelined serially across theservers that store a replica of the block [1, 2, 11, 13, 14,22, 23, 46]. In such systems, a slow server in the pipelinecan significantly degrade write latency. However, priorworks have almost always assumed that writes happen“in the background” (buffered writes). In contrast, our
characterization shows that, in practice, several concur-rent block writes on the same server can overflow thewrite buffer and significantly impact tail latencies.
To reduce data write tail latencies, our fail fast tech-nique detects and replaces the slowest server in a pipeline.The new server must receive all packets that have alreadybeen written before writing can resume. However, aggres-sive server replacements may overload the system. In fact,since replacements are expensive, fail fast estimates thecost of replacing a server and performs a replacementonly if it would indeed reduce write latencies overall.
Our smart hedging technique for data reads monitorsthe server’s performance on a per-packet basis, and startsa “hedge” (duplicate) request [18] when performancestarts to degrade. Since aggressive hedging may causeoverload, we hedge adaptively and (exponentially) back-off from a server that does not complete a hedge beforethe original request.Implementation and results. To experimentally evalu-ate our techniques, we implement them in Hadoop Dis-tributed File System (HDFS) [1], a popular file systemfor frameworks such as MapReduce [19] and Spark [12],and call the result “CurtailHDFS” (Section 5).
Our evaluation uses (1) synthetic workloads on a 4k-server testbed; and (2) production workloads in 3 datacen-ters with a total of 70k servers (Section 6). We compareCurtailHDFS to baselines that include typical server-sidetechniques for managing latency, such as tracking serverperformance. The results show that CurtailHDFS can re-duce 99th-percentile latency by 19× compared to HDFSfor I/O-bound jobs. For the more balanced productionworkloads, CurtailHDFS reduces the 99.9th-percentilewrite latency by 2× compared to HDFS, and the averageread latency by 1.4× compared to state-of-the-practicehedging. These are significant improvements, especiallygiven the limited scope of our changes, on top of existingtechniques (e.g., speculative task execution).
Though we evaluate our techniques in highly heteroge-neous resource-harvesting datacenters, they are generaland applicable in other contexts as well. In fact, we arecontributing our techniques to open-source HDFS, sothey will immediately benefit frameworks and workloadsthat currently use it in any datacenter.Summary. Our contributions are:• We characterize the tail latency of batch jobs runningon production HDFS in resource-harvesting datacenters.• We propose general client-side techniques for manag-ing tail latencies in distributed file systems, and imple-ment them in HDFS. Our write technique uses an entirelynew approach to shortening tail latencies, whereas ourread technique improves on prior works.• We evaluate our techniques extensively, and show thatthey lower tail latencies significantly.
2
2 Production challenges and constraintsThere are many challenges to manage tail latency inproduction distributed file systems, here we enumerateseveral we encountered.Massive scale. At datacenter scale, systems are moreprone to transient misbehaviors or failures that causelatency tails. Moreover, they must avoid centralized com-ponents. So, systems with a single primary metadata man-ager, such as HDFS, must be extended. Our productionHDFS federates multiple HDFS sub-clusters by placingmultiple software “routers” in front of the sub-clustermetadata managers, as proposed by Misra et al. [38].High heterogeneity. Datacenter hardware is often het-erogeneous, with at least a few server generations withdifferent performance characteristics. Even servers of thesame generation may use multiple types (SSD, HDD,or both) or configurations of storage media (e.g., raidedwith different numbers of devices). There are 12 serverconfigurations in the datacenters we study in this paper.Resource harvesting. Our production HDFS uses twoisolation mechanisms to protect the co-located services:(1) throttling of the data access throughput of the server(at 60MB/sec), and (2) a “busy” flag that informs thecorresponding metadata manager and clients that theserver cannot take more access load. We find that ∼20%of servers may concurrently become unavailable becauseof such activity.Background replication. On server or disk failures, thelost replicas must be re-created in the background, whichincreases server load. The problem is exacerbated in ourdatacenters because the operators of the latency-sensitiveservices may reformat disks at any time. To prevent dataloss, our production HDFS stores the replicas of eachblock on servers that run different services, as proposedby Zhang et al. [61]. Despite doing this, it is common tohave to re-create 25TB monthly, with peaks of 128TB.Load imbalance. At scale, data servers and/or metadatamanagers may become overloaded and provide poor per-formance. Our production HDFS deployments create anaverage of 2 blocks per second with spikes of more than100. During these spikes, some servers are idle whileothers show more than 20 concurrent data accesses.High hidden costs. Datacenter operators are careful tolimit complexity in their systems, to lower labor andmaintenance costs. Similarly, new system componentsand data pipelines are expensive to produce, operate,and maintain. Complexity and new infrastructure mustproduce significant benefits to justify their costs.
3 Characterizing performance variationThis section characterizes the performance variations weobserve in real datacenters and their sources. We base
HDFSClient
Cluster
addBlock
DataNode 2
DataNode 1
DataNode 3
Name Node
/
home user
writepacket
2
ack
1
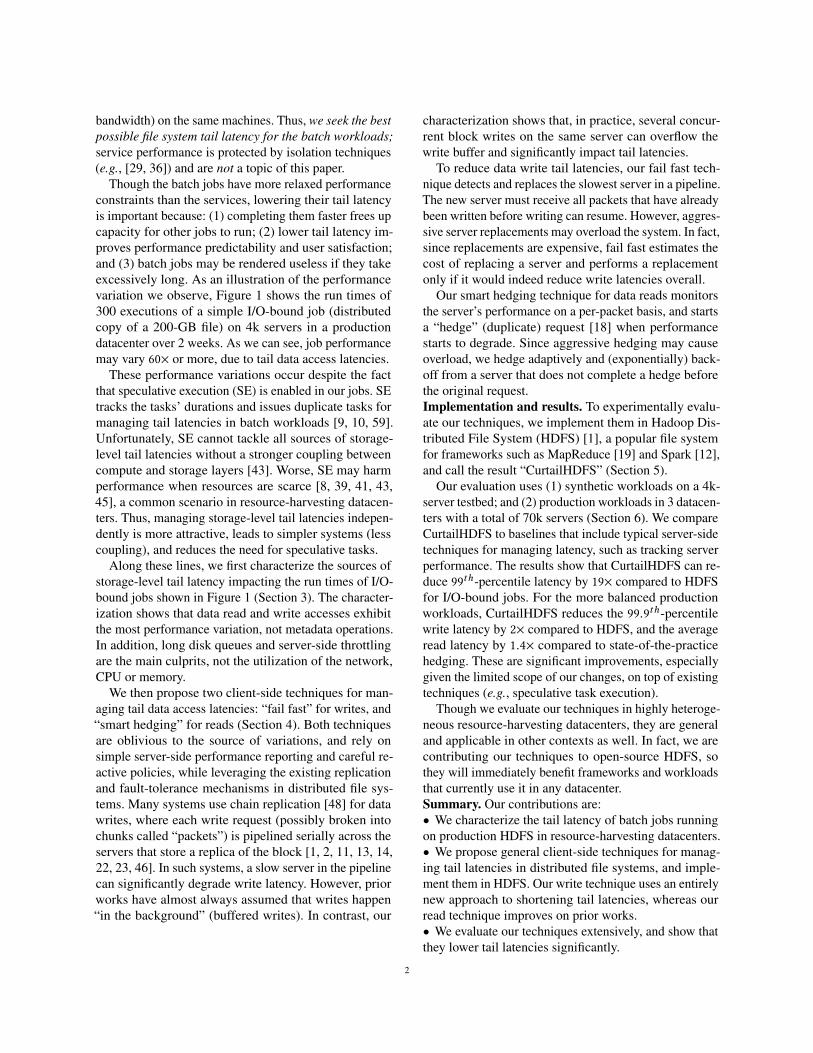
Figure 2. Pipeline to write a block in HDFS.
our study on HDFS, but our observations directly applyto other well-known systems, such as Cosmos Store [17]and GFS [23], that have similar structure.
3.1 HDFS overviewHDFS is a popular open-source system that is used incompanies like Yahoo, Microsoft, and Twitter. It com-prises a primary metadata manager called the “NameNode” (NN), and its per-server block storage node called“Data Node” (DN). The NN manages the namespace andmaps files to their blocks. HDFS replicates each block(across three DNs, by default) for redundancy. Next, wedescribe write and read operations on a file.Writes. Writes append data to an existing file, i.e. thereare no writes-in-place. The client first asks the NN for thecreation of a new block (256MB in our deployments) andspecifies the replication factor for it. The NN returns anordered set of DNs that should store the block’s replicas;it selects the DNs based on a pre-configured policy (e.g.,balance free space). The DNs form a write pipeline.
HDFS writes the data in a pipeline at a packet granular-ity (64kB). Figure 2 shows the steps involved in writing apacket. The client sends the packet to the first DN, whichwrites it to its local file system and propagates it to thenext downstream DN, and so on. Upon receiving thepacket, the last DN sends an ack that propagates all theway back to the client, thereby completing the operation.
To speed up the process, the client sends multiple (64)packets concurrently. In the event of failures, the clientasks the NN for replacements and uses an existing DNin the pipeline for transferring all committed data to thenew DNs. Writing can resume after the new DNs havebeen brought to a consistent state.Reads. Reads involve fewer steps. First, the client asksthe NN for the block’s locations, and the NN returns alist of DNs that store the replicas; the list is sorted basedon proximity to the client. Then, the client establishesa connection with the first DN on the list and reads onepacket (1MB) at a time. In case of errors (e.g., DN failureor data corruption), the client tries reading the remainingpackets from the next DN on the list.
3
Concurrency. HDFS uses a single-writer, multiple-readermodel. An HDFS client that opens a file for writing isgiven write ownership of the file by the NN and no otherclient can write to the file until the writer relinquishesownership. However, write ownership does not preventother clients from reading the file; a file can have manyconcurrent readers.Consistency. Although HDFS allows multiple readersand a writer to access the same file concurrently, it pro-vides no guarantees about the visibility of writes to a fileunder modification. However, HDFS does guarantee thatall writes become immediately visible to any reader afterthe writer closes the file and relinquishes the write own-ership. Thereafter, HDFS provides strong consistency: aclient can read the latest data from any replica (DN) thatstores the recently created/appended file block(s) [? ].Extensions. As we mention in Section 2, our productionHDFS uses two main extensions to the standard open-source version: (1) the replica placement algorithm fromZhang et al. [61]; and (2) the sub-cluster federation tech-niques from Misra et al. [38]. Writes and reads happenas we describe above, below the routers at the federationlayer. Neither extension has a relevant impact on taillatency or on our techniques to manage it.
3.2 MethodologyExperimental setup. For our next experiments, we de-ploy our production HDFS on 4k servers across 4 sub-clusters in a resource-harvesting datacenter. The servershave 12-32 cores, 32-128GB of memory, 10-Gbps NICs,and a 6TB RAID consisting of 4 15k-RPM HDDs. Insome servers, we also use a 1TB RAID of 2 SSDs to storethe file system data. The NN in each sub-cluster repli-cates each block across 4 DNs in the same sub-cluster;replicas of a block may be stored on HDDs, SSDs orsome combination of the two storage mediums.Workload. Our experiment profiles a DistCP [4] job thatspawns 200 tasks for copying a 200GB file between 2sub-clusters. We run this experiment every 2 hours, for aweek. Each run spans a few thousand servers; speculativetask execution is enabled in each run. We use TeraGen [5]to re-create the source file before each run. See Section 6for our study of other workloads.Monitoring infrastructure. We extended HTrace [3] toprofile I/O operations at a packet granularity and collectsystem load metrics. We are contributing our extensionsto open-source HDFS [6, 7].
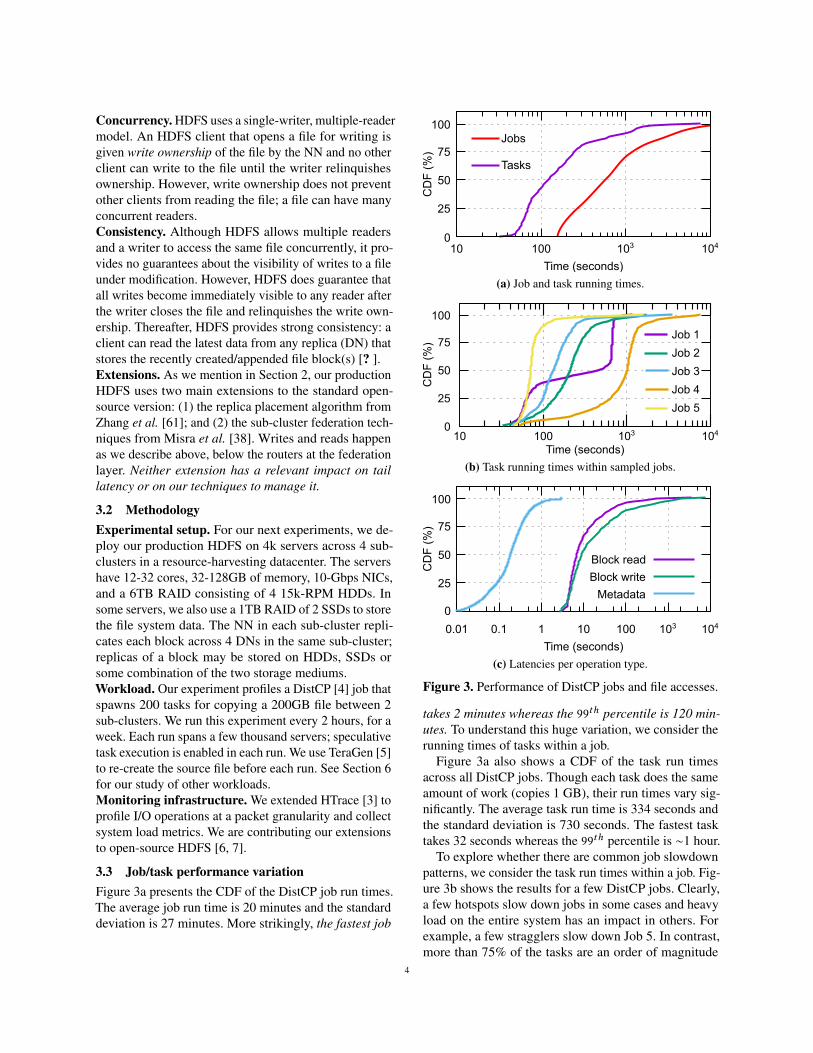
3.3 Job/task performance variationFigure 3a presents the CDF of the DistCP job run times.The average job run time is 20 minutes and the standarddeviation is 27 minutes. More strikingly, the fastest job
25
50
75
100
10 100 103 104
Time (seconds)
0
CD
F (
%)
Jobs
Tasks
(a) Job and task running times.
25
50
75
100
10 100 103 104
Time (seconds)
Job 2
Job 3
Job 4
Job 5
0
Job 1
CD
F (
%)
(b) Task running times within sampled jobs.
25
50
75
100
0.01 0.1 1 10 100 103 104
Time (seconds)
Block write
Metadata
Block read
0
CD
F (
%)
(c) Latencies per operation type.
Figure 3. Performance of DistCP jobs and file accesses.
takes 2 minutes whereas the 99th percentile is 120 min-utes. To understand this huge variation, we consider therunning times of tasks within a job.
Figure 3a also shows a CDF of the task run timesacross all DistCP jobs. Though each task does the sameamount of work (copies 1 GB), their run times vary sig-nificantly. The average task run time is 334 seconds andthe standard deviation is 730 seconds. The fastest tasktakes 32 seconds whereas the 99th percentile is ∼1 hour.
To explore whether there are common job slowdownpatterns, we consider the task run times within a job. Fig-ure 3b shows the results for a few DistCP jobs. Clearly,a few hotspots slow down jobs in some cases and heavyload on the entire system has an impact in others. Forexample, a few stragglers slow down Job 5. In contrast,more than 75% of the tasks are an order of magnitude
4
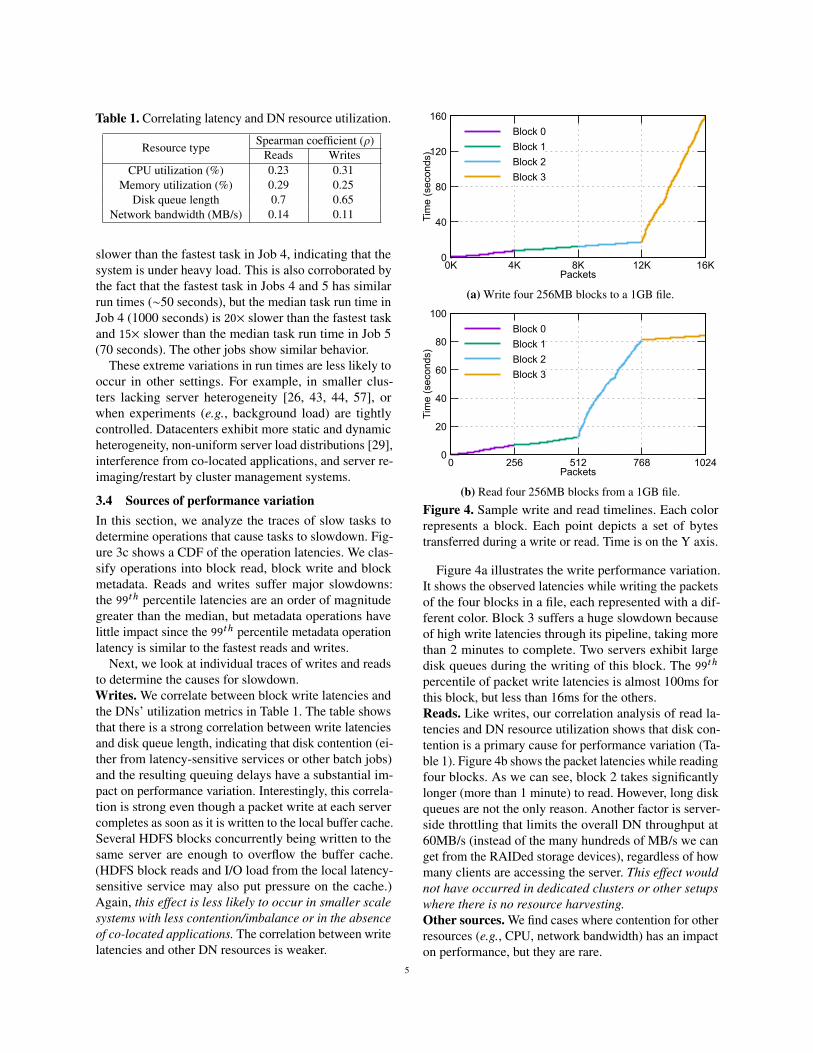
Table 1. Correlating latency and DN resource utilization.
Resource typeSpearman coefficient (ρ)
Reads WritesCPU utilization (%) 0.23 0.31
Memory utilization (%) 0.29 0.25Disk queue length 0.7 0.65
Network bandwidth (MB/s) 0.14 0.11
slower than the fastest task in Job 4, indicating that thesystem is under heavy load. This is also corroborated bythe fact that the fastest task in Jobs 4 and 5 has similarrun times (∼50 seconds), but the median task run time inJob 4 (1000 seconds) is 20× slower than the fastest taskand 15× slower than the median task run time in Job 5(70 seconds). The other jobs show similar behavior.
These extreme variations in run times are less likely tooccur in other settings. For example, in smaller clus-ters lacking server heterogeneity [26, 43, 44, 57], orwhen experiments (e.g., background load) are tightlycontrolled. Datacenters exhibit more static and dynamicheterogeneity, non-uniform server load distributions [29],interference from co-located applications, and server re-imaging/restart by cluster management systems.
3.4 Sources of performance variationIn this section, we analyze the traces of slow tasks todetermine operations that cause tasks to slowdown. Fig-ure 3c shows a CDF of the operation latencies. We clas-sify operations into block read, block write and blockmetadata. Reads and writes suffer major slowdowns:the 99th percentile latencies are an order of magnitudegreater than the median, but metadata operations havelittle impact since the 99th percentile metadata operationlatency is similar to the fastest reads and writes.
Next, we look at individual traces of writes and readsto determine the causes for slowdown.Writes. We correlate between block write latencies andthe DNs’ utilization metrics in Table 1. The table showsthat there is a strong correlation between write latenciesand disk queue length, indicating that disk contention (ei-ther from latency-sensitive services or other batch jobs)and the resulting queuing delays have a substantial im-pact on performance variation. Interestingly, this correla-tion is strong even though a packet write at each servercompletes as soon as it is written to the local buffer cache.Several HDFS blocks concurrently being written to thesame server are enough to overflow the buffer cache.(HDFS block reads and I/O load from the local latency-sensitive service may also put pressure on the cache.)Again, this effect is less likely to occur in smaller scalesystems with less contention/imbalance or in the absenceof co-located applications. The correlation between writelatencies and other DN resources is weaker.
0
40
80
120
160
0K 4K 8K 12K 16K
Tim
e (s
econ
ds)
Packets
Block 0
Block 1
Block 2
Block 3
(a) Write four 256MB blocks to a 1GB file.
0
20
40
60
80
100
0 256 512 768 1024
Tim
e (s
econ
ds)
Packets
Block 0
Block 1
Block 2
Block 3
(b) Read four 256MB blocks from a 1GB file.
Figure 4. Sample write and read timelines. Each colorrepresents a block. Each point depicts a set of bytestransferred during a write or read. Time is on the Y axis.
Figure 4a illustrates the write performance variation.It shows the observed latencies while writing the packetsof the four blocks in a file, each represented with a dif-ferent color. Block 3 suffers a huge slowdown becauseof high write latencies through its pipeline, taking morethan 2 minutes to complete. Two servers exhibit largedisk queues during the writing of this block. The 99thpercentile of packet write latencies is almost 100ms forthis block, but less than 16ms for the others.Reads. Like writes, our correlation analysis of read la-tencies and DN resource utilization shows that disk con-tention is a primary cause for performance variation (Ta-ble 1). Figure 4b shows the packet latencies while readingfour blocks. As we can see, block 2 takes significantlylonger (more than 1 minute) to read. However, long diskqueues are not the only reason. Another factor is server-side throttling that limits the overall DN throughput at60MB/s (instead of the many hundreds of MB/s we canget from the RAIDed storage devices), regardless of howmany clients are accessing the server. This effect wouldnot have occurred in dedicated clusters or other setupswhere there is no resource harvesting.Other sources. We find cases where contention for otherresources (e.g., CPU, network bandwidth) has an impacton performance, but they are rare.
5
3.5 SummaryWe find that: (1) job running times are highly variable andwithout clear slowdown patterns, such as time of day; (2)load from both latency-critical services and other batchjobs impacts performance; (3) data read and write ac-cesses exhibit the most performance variation, not meta-data operations; and (4) long disk queues and server-sidethrottling introduce the most variation, not the utilizationof the network, CPU or memory. These effects are morelikely to occur in large production systems.
As Figures 4a and 4b show, long disk queues and throt-tling can last for minutes, whereas other block accessestake seconds. In addition, although not seen in our charac-terization study, contention for other resources can causesimilar performance variation for data accesses, e.g., con-tention for CPU in erasure-coded systems and/or due tohigh demand from co-located CPU-bound applications.This means that, regardless of the source of the delay,it is important to react, i.e. direct accesses away fromthese slow servers. However, we need to react carefullyso (1) transient effects do not cause unneeded reactions;(2) older, less-performant servers can still be used; and(3) we avoid reactions when all servers are overloaded.
4 Managing tail latenciesIn this section, we present our techniques for tacklingthe sources of performance variability from Section 3.Throughout the section, we use the general terms “meta-data server” and “block server”, as our techniques applyto distributed file systems beyond just HDFS.
4.1 Basic principlesBoth techniques leverage information available at thedistributed file system client library to make decisions.At a high level, they proceed through the followingphases: track latency, check for slowness, decide whetherto act, and take action. In the track phase, the client storesthe packet and block latencies for each block server withwhich it is communicating. It then uses these tracked la-tencies in the check phase to determine whether a serveris slow. This check needs to be agnostic of the sourceof the delay and, simultaneously, loose enough to avoidreacting to transient conditions or older, less-performantservers. The client runs the check phase for the first timeafter it has collected enough latencies to make a meaning-ful decision. If the check determines that a server is slow,the client decides whether to take a mitigation action(i.e., a fail fast for a write or a hedge for a read). Thisdecision includes backing off from overloaded servers(reads) and avoiding actions that would not produce aclear latency benefit (writes). If the client decides that it
will be beneficial to act, it takes the action and goes backto the tracking phase.
Our approach adapts to dynamic load changes by onlyconsidering recent requests in the check phase (load mayhave changed recently at the servers), and by compar-ing the server’s request latency against those of otherservers (all servers may be highly loaded). Moreover, theapproach is agnostic to the reason for slowness, e.g. de-lays due to other file system requests, latency-sensitiveservice activity, or throttling.
Importantly, these basic principles conform to the con-straints of production environments. First, they enablea client to make local decisions and do not require anycentralized infrastructure in the decision-making process.Therefore, they do not pose any impediment to scalabil-ity. Second, they adapt to dynamic changes and do notmake any assumptions about the system, which makesthem amenable to run on harvested and heterogeneousresources. Third, they can be easily deployed and inte-grated into existing systems, since our techniques aresimple and do not require invasive server-side changes.
Below, we detail each technique and discuss the alter-nate approaches we considered in Section 4.4.
4.2 Fail fast for writesFail fast dynamically replaces the slowest server in adata write pipeline. The client treats the slowest serveras having failed (hence the name fail fast), and leveragesthe existing replication and fault-tolerance mechanismsin the file system for replacing the server.
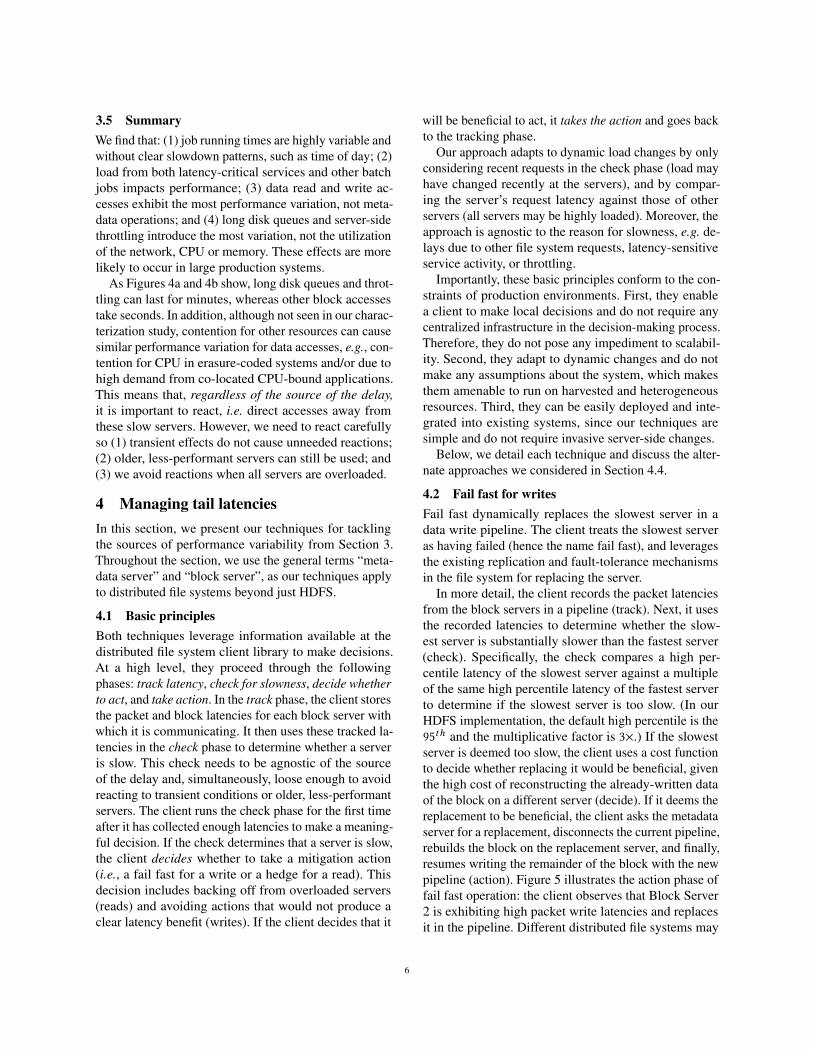
In more detail, the client records the packet latenciesfrom the block servers in a pipeline (track). Next, it usesthe recorded latencies to determine whether the slow-est server is substantially slower than the fastest server(check). Specifically, the check compares a high per-centile latency of the slowest server against a multipleof the same high percentile latency of the fastest serverto determine if the slowest server is too slow. (In ourHDFS implementation, the default high percentile is the95th and the multiplicative factor is 3×.) If the slowestserver is deemed too slow, the client uses a cost functionto decide whether replacing it would be beneficial, giventhe high cost of reconstructing the already-written dataof the block on a different server (decide). If it deems thereplacement to be beneficial, the client asks the metadataserver for a replacement, disconnects the current pipeline,rebuilds the block on the replacement server, and finally,resumes writing the remainder of the block with the newpipeline (action). Figure 5 illustrates the action phase offail fast operation: the client observes that Block Server2 is exhibiting high packet write latencies and replacesit in the pipeline. Different distributed file systems may
6
Packet write latencyPacket write request
Time
Rebuild
BlockServer 2
BlockServer 1
BlockServer 3
BlockServer 4
Client
MetadataManager
Replace Block Server 2
disconnect connect
Figure 5. Fail fast of write pipeline.
implement the replacement protocol slightly differently,but the principle is the same.
The cost function deserves more explanation. It pre-dicts two completion times for the write: without re-placement and with replacement of the slowest server.Assuming no replacement, we multiply the average writelatency of the slowest server by the number of packetsremaining to be written. For predicting completion timewith replacement, we first predict the time to reconstructthe committed data in the block on a new server. We com-pute this value using the latencies of the fastest server inthe pipeline as the source for reconstruction. Next, wecompute the time to complete the write with the newpipeline using the average of the write latencies of theremaining servers in the pipeline. The time to completethe write with replacement is the sum of these two pre-dicted values. The client replaces the slowest server if thepredicted completion time with replacement is less thanthe projected completion time for the current pipeline.
Under heavy load, the time for reconstructing the blockon the replacement server might substantially exceed theexpected time. In such cases, the action phase abortsthe current reconstruction and restarts with a new re-placement server. It also changes the source server andincreases the expected reconstruction time linearly witheach abort. Finally, we stop attempting a replacement af-ter a threshold number of unsuccessful tries. (By default,our HDFS deployments try 5 times before giving up.)
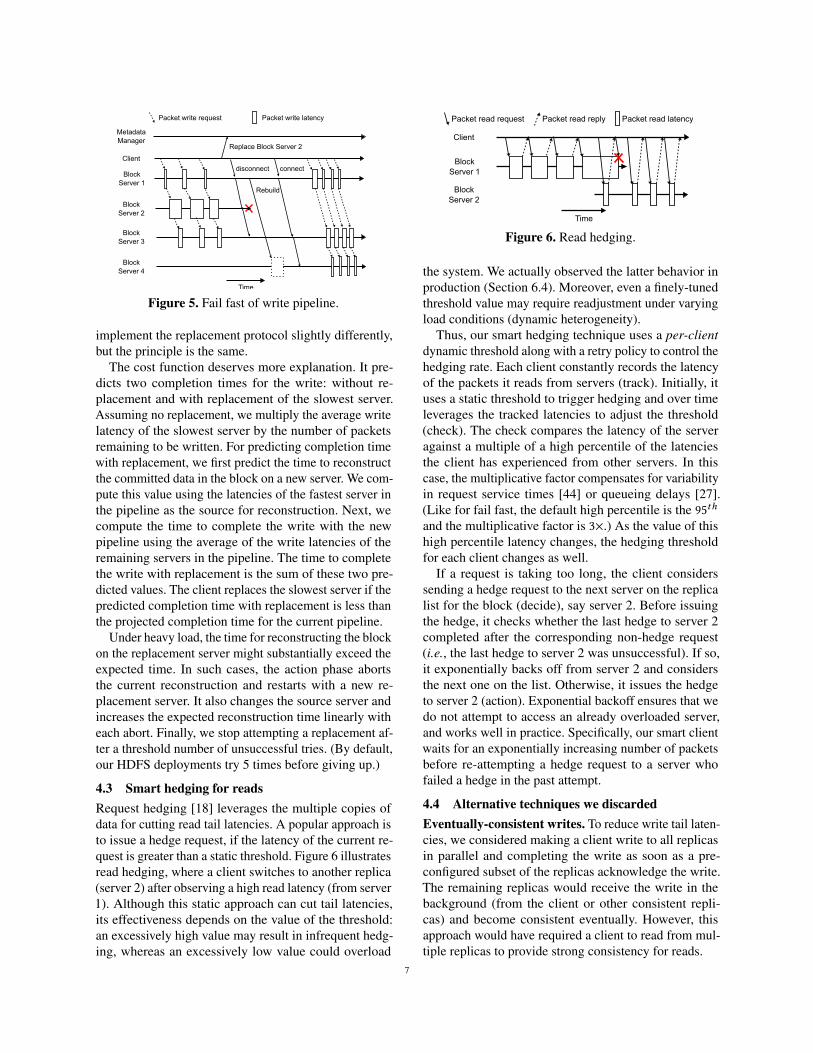
4.3 Smart hedging for readsRequest hedging [18] leverages the multiple copies ofdata for cutting read tail latencies. A popular approach isto issue a hedge request, if the latency of the current re-quest is greater than a static threshold. Figure 6 illustratesread hedging, where a client switches to another replica(server 2) after observing a high read latency (from server1). Although this static approach can cut tail latencies,its effectiveness depends on the value of the threshold:an excessively high value may result in infrequent hedg-ing, whereas an excessively low value could overload
Packet read latency
Time
BlockServer 2
BlockServer 1
Client
Packet read replyPacket read request
Figure 6. Read hedging.
the system. We actually observed the latter behavior inproduction (Section 6.4). Moreover, even a finely-tunedthreshold value may require readjustment under varyingload conditions (dynamic heterogeneity).
Thus, our smart hedging technique uses a per-clientdynamic threshold along with a retry policy to control thehedging rate. Each client constantly records the latencyof the packets it reads from servers (track). Initially, ituses a static threshold to trigger hedging and over timeleverages the tracked latencies to adjust the threshold(check). The check compares the latency of the serveragainst a multiple of a high percentile of the latenciesthe client has experienced from other servers. In thiscase, the multiplicative factor compensates for variabilityin request service times [44] or queueing delays [27].(Like for fail fast, the default high percentile is the 95thand the multiplicative factor is 3×.) As the value of thishigh percentile latency changes, the hedging thresholdfor each client changes as well.
If a request is taking too long, the client considerssending a hedge request to the next server on the replicalist for the block (decide), say server 2. Before issuingthe hedge, it checks whether the last hedge to server 2completed after the corresponding non-hedge request(i.e., the last hedge to server 2 was unsuccessful). If so,it exponentially backs off from server 2 and considersthe next one on the list. Otherwise, it issues the hedgeto server 2 (action). Exponential backoff ensures that wedo not attempt to access an already overloaded server,and works well in practice. Specifically, our smart clientwaits for an exponentially increasing number of packetsbefore re-attempting a hedge request to a server whofailed a hedge in the past attempt.
4.4 Alternative techniques we discardedEventually-consistent writes. To reduce write tail laten-cies, we considered making a client write to all replicasin parallel and completing the write as soon as a pre-configured subset of the replicas acknowledge the write.The remaining replicas would receive the write in thebackground (from the client or other consistent repli-cas) and become consistent eventually. However, thisapproach would have required a client to read from mul-tiple replicas to provide strong consistency for reads.
7
The extra reads would increase the system load andcould degrade the read tail latency. Moreover, with fewerconsistent replicas, consistency and durability could alsobecome concerns, especially in a resource-harvesting dat-acenter where a service operator can inadvertently wipeany replica before background replication is complete.For these reasons, we discarded this approach.Fail fast without replacement. To eliminate recreationof committed data, we considered just removing the slow-est server from a pipeline without adding any replace-ment and let the file system recreate the missing replicain the background. This approach differs from eventually-consistent writes because all remaining replicas are in aconsistent state, so a client can read the latest write fromany replica. However, like eventually-consistent writes,durability was a concern with this approach because ofthe reduced number of replicas.Cloning writes. We also considered writing to multiplepipelines at the same time and discarding those that com-plete the write late. We decided against this approachbecause it would generate a large amount of potentiallyunnecessary disk and metadata traffic.Variable-sized blocks. We considered using variable-sized blocks to avoid recreating committed data. In thisapproach, a client, upon observing slow packet writes,could seal the current block and start writing to a new onewith a new pipeline. Though this feature exists in somedistributed file systems, we decided against it for tworeasons: it could dramatically increase the metadata spacerequirement if premature sealing is frequent, and movethe bottleneck from data writes to metadata accesses.Centralized controller. Instead of making independent,local decisions about contention, the clients could accessthis information in a central repository maintained bythe metadata manager. However, this approach wouldbe highly dependent on the freshness of the load estima-tions. If the estimation window is too large, the managerwould provide stale data and may not reduce tail laten-cies. On the other hand, a small window could provideaccurate information but may overwhelm the manager.As others have observed in production [38], centralizedcomponents often harm scalability.OS-based improvements. A design goal of many large-scale distributed systems, such as HDFS or Spark, isto provide portability across platforms. Thus, we focuson improving file system performance in the user space,rather than modifying the underlying software or requir-ing features that few operating systems provide.
5 Implementation in HDFSWe implement our techniques in HDFS and call the re-sulting system “CurtailHDFS”. We create a new client
library that applications can use. The library allows eachtechnique to be enabled independently, which is key forassessing their benefits in production. Moreover, adop-tion can be incremental as users slowly deploy our client.
Our client keeps a configurable amount of the recenthistory of packet and block latencies. For fail fast, weuse the existing pipeline latency reporting mechanismto piggyback each DN packet processing latency witheach ack. On the client side, we determine the slowestDN and leverage the pipeline error-handling mechanismto perform a DN replacement. We enhance the error han-dling to select the fastest DN for reconstruction and usetimeouts for the reconstruction process. For smart hedg-ing, we extend HDFS’s static hedging option [54, 55].In both implementations, we avoid using any DN thathas flagged itself as “busy” (a latency-sensitive serviceneeds the server’s resources). We discuss the impact ofthe techniques’ parameters in Section 6.2.
Finally, our code is modular and easy to add/remove/-configure, as needed for maintainability in production.
6 EvaluationIn this section, we describe our experimental methodol-ogy and results. We conclude with a discussion of ourexperience bringing CurtailHDFS to production.
6.1 MethodologyExperimental setup. We evaluate CurtailHDFS in twoenvironments: the 4k-server experimental testbed we de-scribe in Section 3.2; and 3 large production deployments,each with 20k to 30k servers spread across 6 to 10 feder-ated sub-clusters. These deployments use the same serverconfigurations as the testbed, but exhibit more sharingwith latency-sensitive services. The replication factor is4 in the testbed and production deployments.
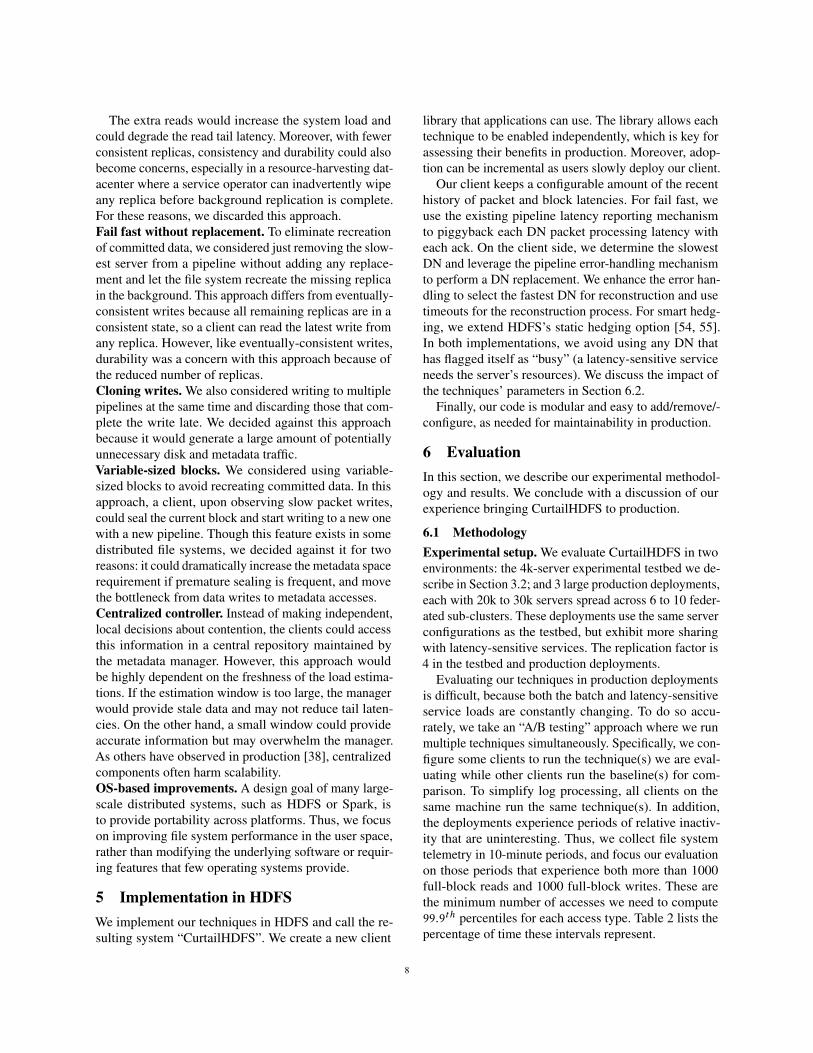
Evaluating our techniques in production deploymentsis difficult, because both the batch and latency-sensitiveservice loads are constantly changing. To do so accu-rately, we take an “A/B testing” approach where we runmultiple techniques simultaneously. Specifically, we con-figure some clients to run the technique(s) we are eval-uating while other clients run the baseline(s) for com-parison. To simplify log processing, all clients on thesame machine run the same technique(s). In addition,the deployments experience periods of relative inactiv-ity that are uninteresting. Thus, we collect file systemtelemetry in 10-minute periods, and focus our evaluationon those periods that experience both more than 1000full-block reads and 1000 full-block writes. These arethe minimum number of accesses we need to compute99.9th percentiles for each access type. Table 2 lists thepercentage of time these intervals represent.
8
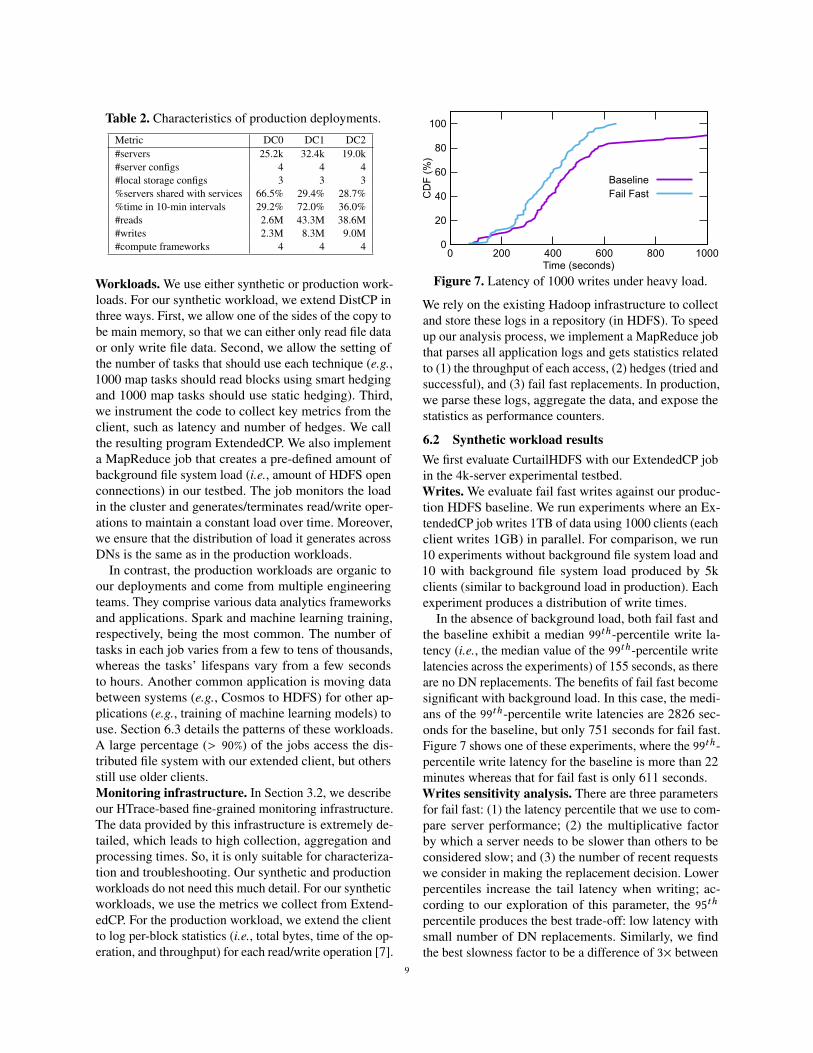
Table 2. Characteristics of production deployments.
Metric DC0 DC1 DC2#servers 25.2k 32.4k 19.0k#server configs 4 4 4#local storage configs 3 3 3%servers shared with services 66.5% 29.4% 28.7%%time in 10-min intervals 29.2% 72.0% 36.0%#reads 2.6M 43.3M 38.6M#writes 2.3M 8.3M 9.0M#compute frameworks 4 4 4
Workloads. We use either synthetic or production work-loads. For our synthetic workload, we extend DistCP inthree ways. First, we allow one of the sides of the copy tobe main memory, so that we can either only read file dataor only write file data. Second, we allow the setting ofthe number of tasks that should use each technique (e.g.,1000 map tasks should read blocks using smart hedgingand 1000 map tasks should use static hedging). Third,we instrument the code to collect key metrics from theclient, such as latency and number of hedges. We callthe resulting program ExtendedCP. We also implementa MapReduce job that creates a pre-defined amount ofbackground file system load (i.e., amount of HDFS openconnections) in our testbed. The job monitors the loadin the cluster and generates/terminates read/write oper-ations to maintain a constant load over time. Moreover,we ensure that the distribution of load it generates acrossDNs is the same as in the production workloads.
In contrast, the production workloads are organic toour deployments and come from multiple engineeringteams. They comprise various data analytics frameworksand applications. Spark and machine learning training,respectively, being the most common. The number oftasks in each job varies from a few to tens of thousands,whereas the tasks’ lifespans vary from a few secondsto hours. Another common application is moving databetween systems (e.g., Cosmos to HDFS) for other ap-plications (e.g., training of machine learning models) touse. Section 6.3 details the patterns of these workloads.A large percentage (> 90%) of the jobs access the dis-tributed file system with our extended client, but othersstill use older clients.Monitoring infrastructure. In Section 3.2, we describeour HTrace-based fine-grained monitoring infrastructure.The data provided by this infrastructure is extremely de-tailed, which leads to high collection, aggregation andprocessing times. So, it is only suitable for characteriza-tion and troubleshooting. Our synthetic and productionworkloads do not need this much detail. For our syntheticworkloads, we use the metrics we collect from Extend-edCP. For the production workload, we extend the clientto log per-block statistics (i.e., total bytes, time of the op-eration, and throughput) for each read/write operation [7].
0
20
40
60
80
100
0 200 400 600 800 1000
CD
F (
%)
Time (seconds)
BaselineFail Fast
Figure 7. Latency of 1000 writes under heavy load.
We rely on the existing Hadoop infrastructure to collectand store these logs in a repository (in HDFS). To speedup our analysis process, we implement a MapReduce jobthat parses all application logs and gets statistics relatedto (1) the throughput of each access, (2) hedges (tried andsuccessful), and (3) fail fast replacements. In production,we parse these logs, aggregate the data, and expose thestatistics as performance counters.
6.2 Synthetic workload resultsWe first evaluate CurtailHDFS with our ExtendedCP jobin the 4k-server experimental testbed.Writes. We evaluate fail fast writes against our produc-tion HDFS baseline. We run experiments where an Ex-tendedCP job writes 1TB of data using 1000 clients (eachclient writes 1GB) in parallel. For comparison, we run10 experiments without background file system load and10 with background file system load produced by 5kclients (similar to background load in production). Eachexperiment produces a distribution of write times.
In the absence of background load, both fail fast andthe baseline exhibit a median 99th-percentile write la-tency (i.e., the median value of the 99th-percentile writelatencies across the experiments) of 155 seconds, as thereare no DN replacements. The benefits of fail fast becomesignificant with background load. In this case, the medi-ans of the 99th-percentile write latencies are 2826 sec-onds for the baseline, but only 751 seconds for fail fast.Figure 7 shows one of these experiments, where the 99th-percentile write latency for the baseline is more than 22minutes whereas that for fail fast is only 611 seconds.Writes sensitivity analysis. There are three parametersfor fail fast: (1) the latency percentile that we use to com-pare server performance; (2) the multiplicative factorby which a server needs to be slower than others to beconsidered slow; and (3) the number of recent requestswe consider in making the replacement decision. Lowerpercentiles increase the tail latency when writing; ac-cording to our exploration of this parameter, the 95thpercentile produces the best trade-off: low latency withsmall number of DN replacements. Similarly, we findthe best slowness factor to be a difference of 3× between
9
0
20
40
60
80
100
0 100 200 300 400 500 600 700 800
CD
F (
%)
Time (secs)
Baseline
Static (100ms)
Smart
0
40
80
120
160
200
Total Success Total Success
Num
ber
of H
edg
es
Static (100ms) Smart
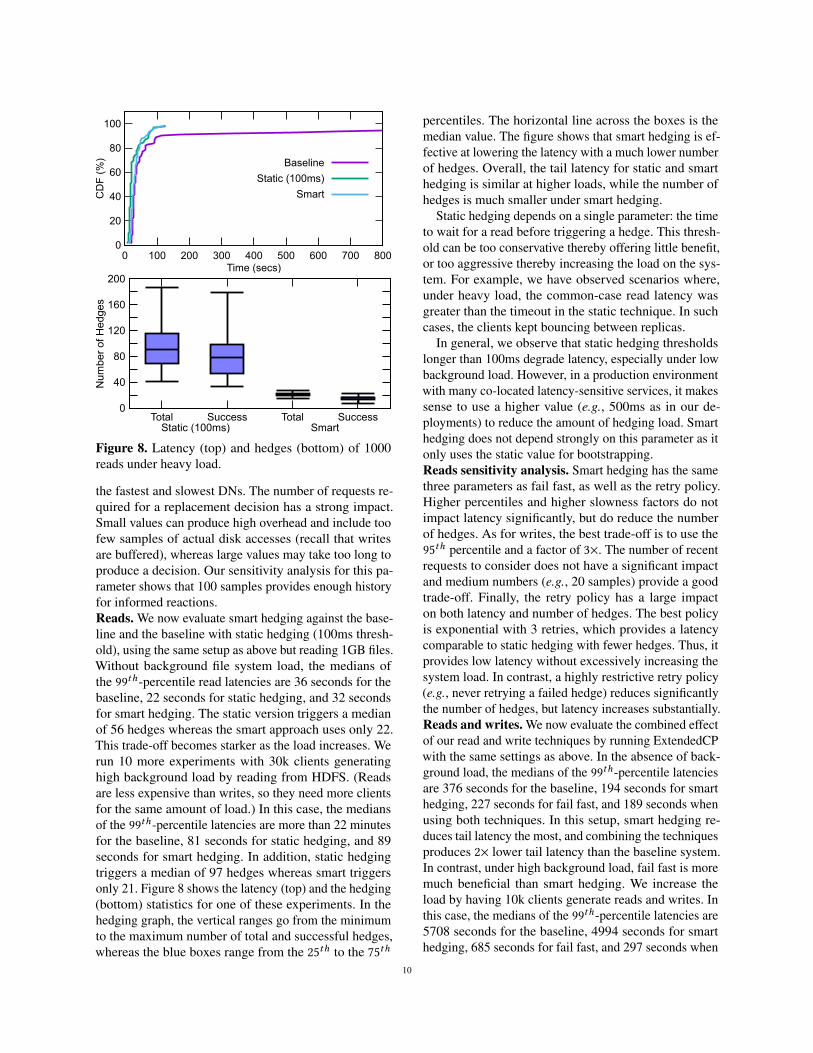
Figure 8. Latency (top) and hedges (bottom) of 1000reads under heavy load.
the fastest and slowest DNs. The number of requests re-quired for a replacement decision has a strong impact.Small values can produce high overhead and include toofew samples of actual disk accesses (recall that writesare buffered), whereas large values may take too long toproduce a decision. Our sensitivity analysis for this pa-rameter shows that 100 samples provides enough historyfor informed reactions.Reads. We now evaluate smart hedging against the base-line and the baseline with static hedging (100ms thresh-old), using the same setup as above but reading 1GB files.Without background file system load, the medians ofthe 99th-percentile read latencies are 36 seconds for thebaseline, 22 seconds for static hedging, and 32 secondsfor smart hedging. The static version triggers a medianof 56 hedges whereas the smart approach uses only 22.This trade-off becomes starker as the load increases. Werun 10 more experiments with 30k clients generatinghigh background load by reading from HDFS. (Readsare less expensive than writes, so they need more clientsfor the same amount of load.) In this case, the mediansof the 99th-percentile latencies are more than 22 minutesfor the baseline, 81 seconds for static hedging, and 89seconds for smart hedging. In addition, static hedgingtriggers a median of 97 hedges whereas smart triggersonly 21. Figure 8 shows the latency (top) and the hedging(bottom) statistics for one of these experiments. In thehedging graph, the vertical ranges go from the minimumto the maximum number of total and successful hedges,whereas the blue boxes range from the 25th to the 75th
percentiles. The horizontal line across the boxes is themedian value. The figure shows that smart hedging is ef-fective at lowering the latency with a much lower numberof hedges. Overall, the tail latency for static and smarthedging is similar at higher loads, while the number ofhedges is much smaller under smart hedging.
Static hedging depends on a single parameter: the timeto wait for a read before triggering a hedge. This thresh-old can be too conservative thereby offering little benefit,or too aggressive thereby increasing the load on the sys-tem. For example, we have observed scenarios where,under heavy load, the common-case read latency wasgreater than the timeout in the static technique. In suchcases, the clients kept bouncing between replicas.
In general, we observe that static hedging thresholdslonger than 100ms degrade latency, especially under lowbackground load. However, in a production environmentwith many co-located latency-sensitive services, it makessense to use a higher value (e.g., 500ms as in our de-ployments) to reduce the amount of hedging load. Smarthedging does not depend strongly on this parameter as itonly uses the static value for bootstrapping.Reads sensitivity analysis. Smart hedging has the samethree parameters as fail fast, as well as the retry policy.Higher percentiles and higher slowness factors do notimpact latency significantly, but do reduce the numberof hedges. As for writes, the best trade-off is to use the95th percentile and a factor of 3×. The number of recentrequests to consider does not have a significant impactand medium numbers (e.g., 20 samples) provide a goodtrade-off. Finally, the retry policy has a large impacton both latency and number of hedges. The best policyis exponential with 3 retries, which provides a latencycomparable to static hedging with fewer hedges. Thus, itprovides low latency without excessively increasing thesystem load. In contrast, a highly restrictive retry policy(e.g., never retrying a failed hedge) reduces significantlythe number of hedges, but latency increases substantially.Reads and writes. We now evaluate the combined effectof our read and write techniques by running ExtendedCPwith the same settings as above. In the absence of back-ground load, the medians of the 99th-percentile latenciesare 376 seconds for the baseline, 194 seconds for smarthedging, 227 seconds for fail fast, and 189 seconds whenusing both techniques. In this setup, smart hedging re-duces tail latency the most, and combining the techniquesproduces 2× lower tail latency than the baseline system.In contrast, under high background load, fail fast is moremuch beneficial than smart hedging. We increase theload by having 10k clients generate reads and writes. Inthis case, the medians of the 99th-percentile latencies are5708 seconds for the baseline, 4994 seconds for smarthedging, 685 seconds for fail fast, and 297 seconds when
10
0
20
40
60
80
100
0 200 400 600 800 1000
CD
F (
%)
Time (seconds)
BaselineSmart hedge
Fail FastCurtailHDFS
Figure 9. Latency of 1000 copies under heavy load.
100101102103104105106107
Num
ber
of jo
bs
Read
Write
Num
ber of reads/w
rites
Jobs
100101102103104105106107
DC0 DC1 DC2
Num
ber
of b
lock
s
DC0 DC1 DC2
Num
ber ofreads/writes
BlocksMin50th
90th
99th
Max
Read Write
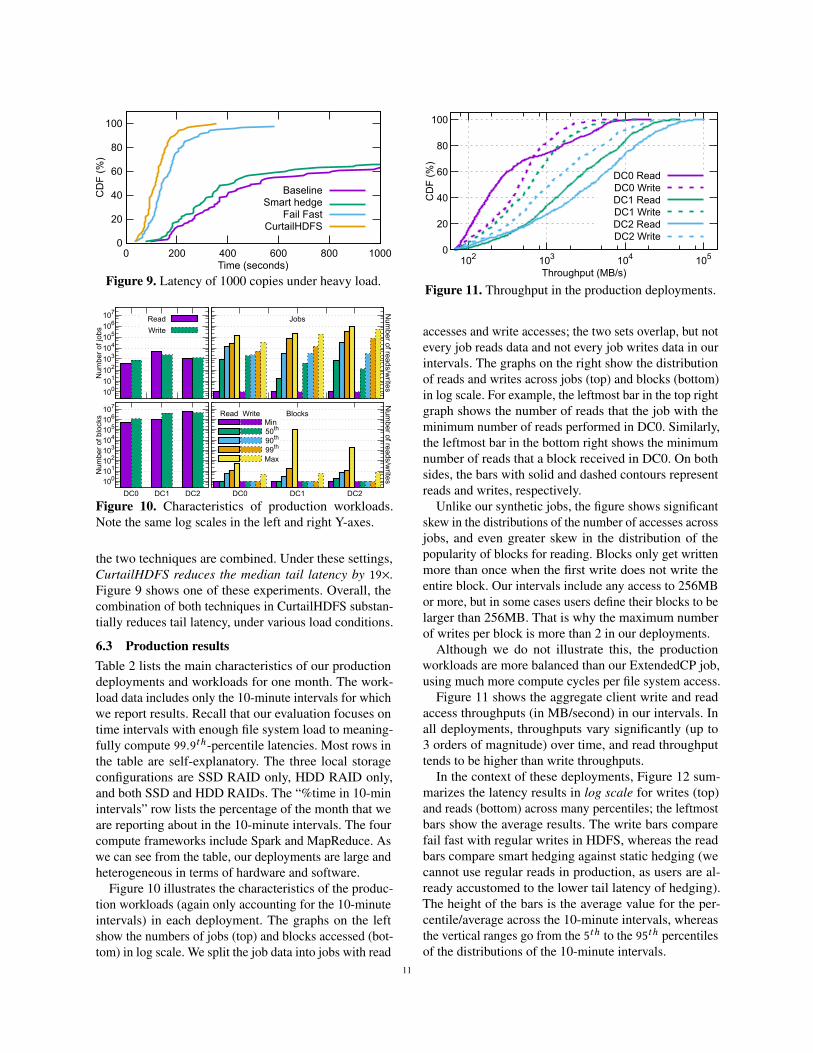
Figure 10. Characteristics of production workloads.Note the same log scales in the left and right Y-axes.
the two techniques are combined. Under these settings,CurtailHDFS reduces the median tail latency by 19×.Figure 9 shows one of these experiments. Overall, thecombination of both techniques in CurtailHDFS substan-tially reduces tail latency, under various load conditions.
6.3 Production resultsTable 2 lists the main characteristics of our productiondeployments and workloads for one month. The work-load data includes only the 10-minute intervals for whichwe report results. Recall that our evaluation focuses ontime intervals with enough file system load to meaning-fully compute 99.9th-percentile latencies. Most rows inthe table are self-explanatory. The three local storageconfigurations are SSD RAID only, HDD RAID only,and both SSD and HDD RAIDs. The “%time in 10-minintervals” row lists the percentage of the month that weare reporting about in the 10-minute intervals. The fourcompute frameworks include Spark and MapReduce. Aswe can see from the table, our deployments are large andheterogeneous in terms of hardware and software.
Figure 10 illustrates the characteristics of the produc-tion workloads (again only accounting for the 10-minuteintervals) in each deployment. The graphs on the leftshow the numbers of jobs (top) and blocks accessed (bot-tom) in log scale. We split the job data into jobs with read
0
20
40
60
80
100
102 103 104 105
CD
F (
%)
Throughput (MB/s)
DC0 ReadDC0 WriteDC1 ReadDC1 WriteDC2 ReadDC2 Write
Figure 11. Throughput in the production deployments.
accesses and write accesses; the two sets overlap, but notevery job reads data and not every job writes data in ourintervals. The graphs on the right show the distributionof reads and writes across jobs (top) and blocks (bottom)in log scale. For example, the leftmost bar in the top rightgraph shows the number of reads that the job with theminimum number of reads performed in DC0. Similarly,the leftmost bar in the bottom right shows the minimumnumber of reads that a block received in DC0. On bothsides, the bars with solid and dashed contours representreads and writes, respectively.
Unlike our synthetic jobs, the figure shows significantskew in the distributions of the number of accesses acrossjobs, and even greater skew in the distribution of thepopularity of blocks for reading. Blocks only get writtenmore than once when the first write does not write theentire block. Our intervals include any access to 256MBor more, but in some cases users define their blocks to belarger than 256MB. That is why the maximum numberof writes per block is more than 2 in our deployments.
Although we do not illustrate this, the productionworkloads are more balanced than our ExtendedCP job,using much more compute cycles per file system access.
Figure 11 shows the aggregate client write and readaccess throughputs (in MB/second) in our intervals. Inall deployments, throughputs vary significantly (up to3 orders of magnitude) over time, and read throughputtends to be higher than write throughputs.
In the context of these deployments, Figure 12 sum-marizes the latency results in log scale for writes (top)and reads (bottom) across many percentiles; the leftmostbars show the average results. The write bars comparefail fast with regular writes in HDFS, whereas the readbars compare smart hedging against static hedging (wecannot use regular reads in production, as users are al-ready accustomed to the lower tail latency of hedging).The height of the bars is the average value for the per-centile/average across the 10-minute intervals, whereasthe vertical ranges go from the 5th to the 95th percentilesof the distributions of the 10-minute intervals.
11
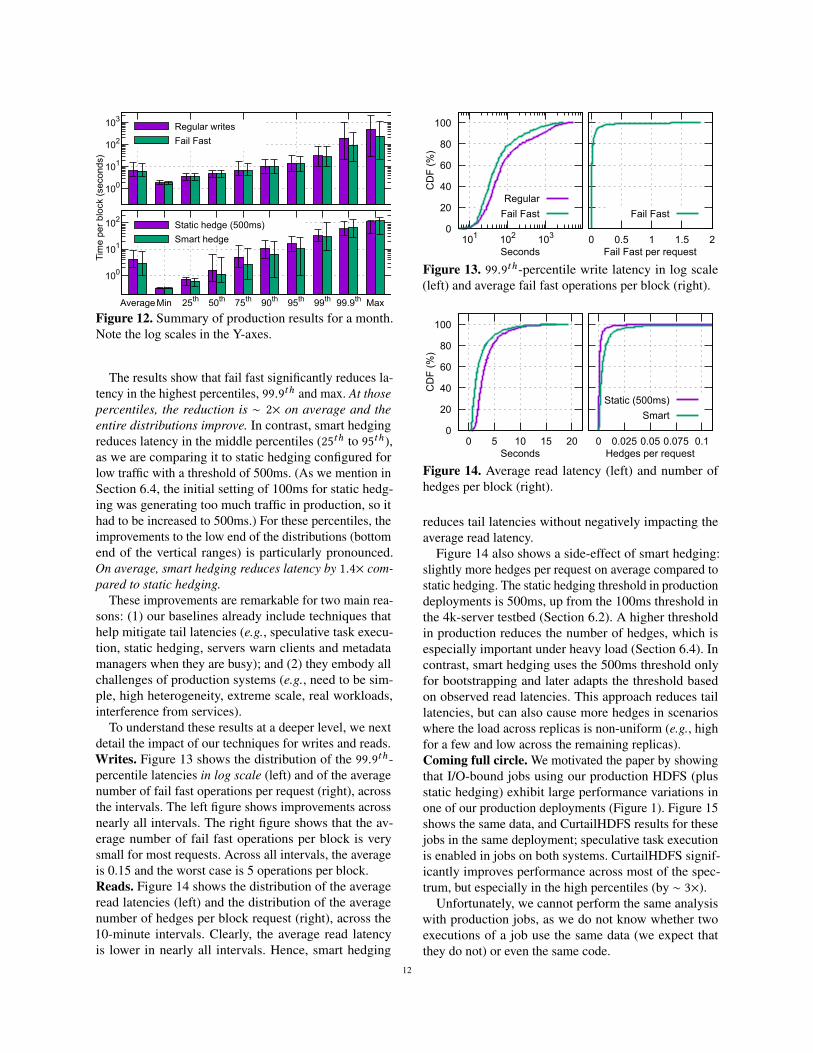
100
101
102
103
Tim
e pe
r bl
ock
(se
cond
s)
Regular writes
Fail Fast
100
101
102
AverageMin 25th 50th 75th 90th 95th 99th 99.9th Max
Static hedge (500ms)
Smart hedge
Figure 12. Summary of production results for a month.Note the log scales in the Y-axes.
The results show that fail fast significantly reduces la-tency in the highest percentiles, 99.9th and max. At thosepercentiles, the reduction is ∼ 2× on average and theentire distributions improve. In contrast, smart hedgingreduces latency in the middle percentiles (25th to 95th),as we are comparing it to static hedging configured forlow traffic with a threshold of 500ms. (As we mention inSection 6.4, the initial setting of 100ms for static hedg-ing was generating too much traffic in production, so ithad to be increased to 500ms.) For these percentiles, theimprovements to the low end of the distributions (bottomend of the vertical ranges) is particularly pronounced.On average, smart hedging reduces latency by 1.4× com-pared to static hedging.
These improvements are remarkable for two main rea-sons: (1) our baselines already include techniques thathelp mitigate tail latencies (e.g., speculative task execu-tion, static hedging, servers warn clients and metadatamanagers when they are busy); and (2) they embody allchallenges of production systems (e.g., need to be sim-ple, high heterogeneity, extreme scale, real workloads,interference from services).
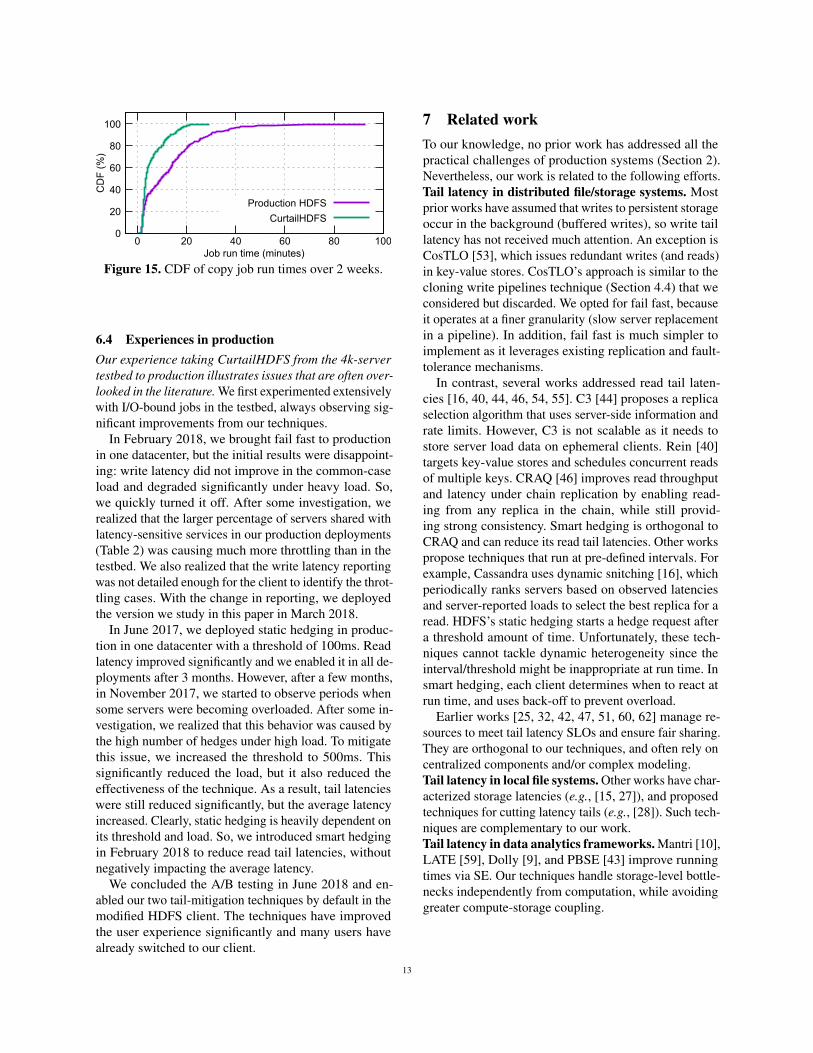
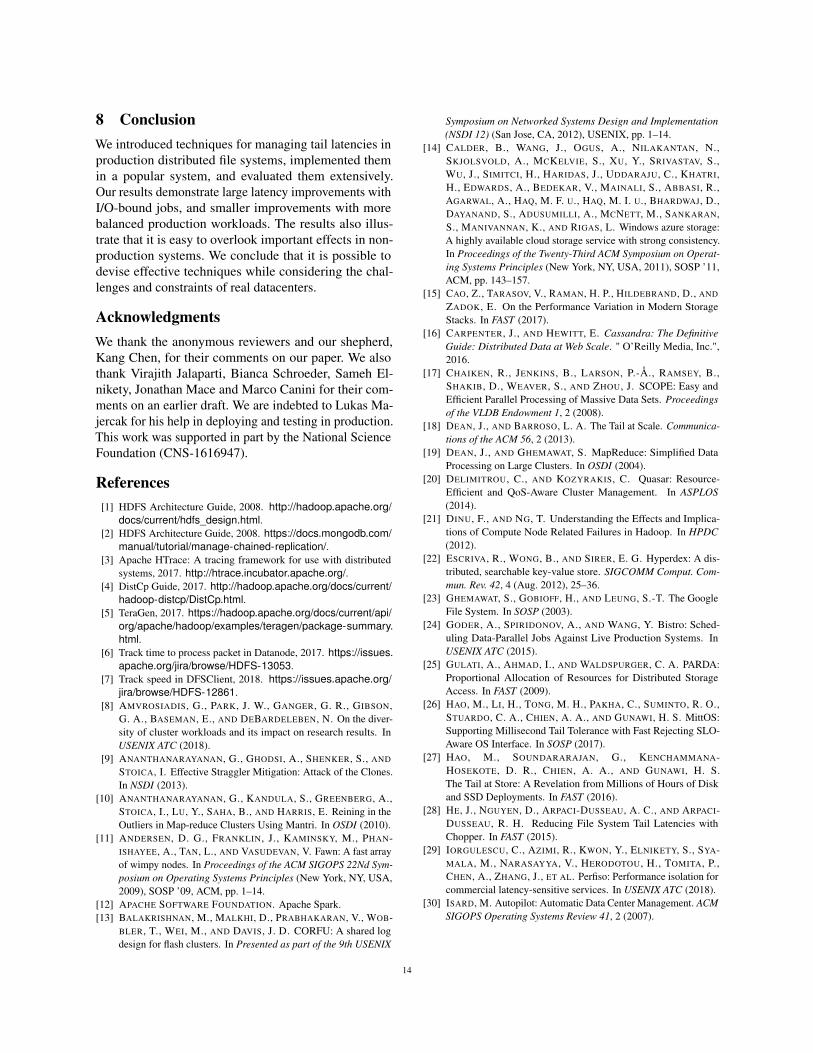
To understand these results at a deeper level, we nextdetail the impact of our techniques for writes and reads.Writes. Figure 13 shows the distribution of the 99.9th-percentile latencies in log scale (left) and of the averagenumber of fail fast operations per request (right), acrossthe intervals. The left figure shows improvements acrossnearly all intervals. The right figure shows that the av-erage number of fail fast operations per block is verysmall for most requests. Across all intervals, the averageis 0.15 and the worst case is 5 operations per block.Reads. Figure 14 shows the distribution of the averageread latencies (left) and the distribution of the averagenumber of hedges per block request (right), across the10-minute intervals. Clearly, the average read latencyis lower in nearly all intervals. Hence, smart hedging
0
20
40
60
80
100
101 102 103
CD
F (
%)
Seconds
Regular
Fail Fast
0 0.5 1 1.5 2Fail Fast per request
Fail Fast
Figure 13. 99.9th-percentile write latency in log scale(left) and average fail fast operations per block (right).
0
20
40
60
80
100
0 5 10 15 20C
DF
(%
)
Seconds0 0.025 0.05 0.075 0.1
Hedges per request
Static (500ms)
Smart
Figure 14. Average read latency (left) and number ofhedges per block (right).
reduces tail latencies without negatively impacting theaverage read latency.
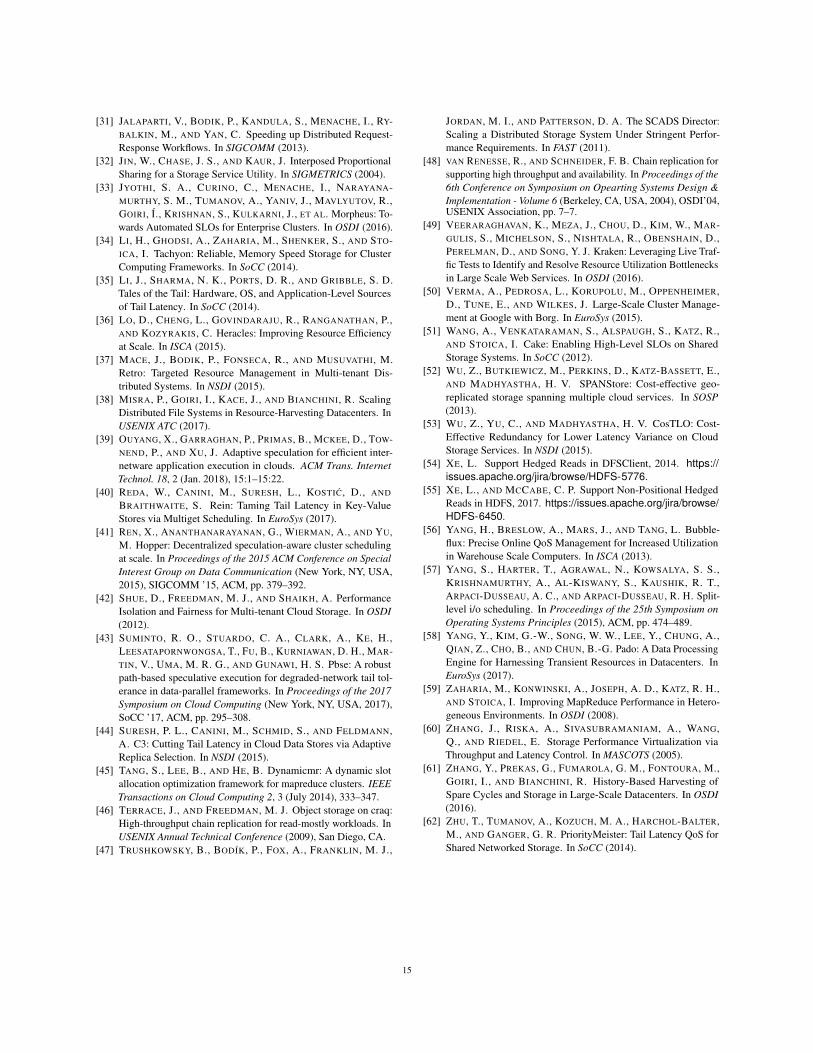
Figure 14 also shows a side-effect of smart hedging:slightly more hedges per request on average compared tostatic hedging. The static hedging threshold in productiondeployments is 500ms, up from the 100ms threshold inthe 4k-server testbed (Section 6.2). A higher thresholdin production reduces the number of hedges, which isespecially important under heavy load (Section 6.4). Incontrast, smart hedging uses the 500ms threshold onlyfor bootstrapping and later adapts the threshold basedon observed read latencies. This approach reduces taillatencies, but can also cause more hedges in scenarioswhere the load across replicas is non-uniform (e.g., highfor a few and low across the remaining replicas).Coming full circle. We motivated the paper by showingthat I/O-bound jobs using our production HDFS (plusstatic hedging) exhibit large performance variations inone of our production deployments (Figure 1). Figure 15shows the same data, and CurtailHDFS results for thesejobs in the same deployment; speculative task executionis enabled in jobs on both systems. CurtailHDFS signif-icantly improves performance across most of the spec-trum, but especially in the high percentiles (by ∼ 3×).
Unfortunately, we cannot perform the same analysiswith production jobs, as we do not know whether twoexecutions of a job use the same data (we expect thatthey do not) or even the same code.
12
0
20
40
60
80
100
0 20 40 60 80 100
CD
F (
%)
Job run time (minutes)
Production HDFS
CurtailHDFS
Figure 15. CDF of copy job run times over 2 weeks.
6.4 Experiences in productionOur experience taking CurtailHDFS from the 4k-servertestbed to production illustrates issues that are often over-looked in the literature. We first experimented extensivelywith I/O-bound jobs in the testbed, always observing sig-nificant improvements from our techniques.
In February 2018, we brought fail fast to productionin one datacenter, but the initial results were disappoint-ing: write latency did not improve in the common-caseload and degraded significantly under heavy load. So,we quickly turned it off. After some investigation, werealized that the larger percentage of servers shared withlatency-sensitive services in our production deployments(Table 2) was causing much more throttling than in thetestbed. We also realized that the write latency reportingwas not detailed enough for the client to identify the throt-tling cases. With the change in reporting, we deployedthe version we study in this paper in March 2018.
In June 2017, we deployed static hedging in produc-tion in one datacenter with a threshold of 100ms. Readlatency improved significantly and we enabled it in all de-ployments after 3 months. However, after a few months,in November 2017, we started to observe periods whensome servers were becoming overloaded. After some in-vestigation, we realized that this behavior was caused bythe high number of hedges under high load. To mitigatethis issue, we increased the threshold to 500ms. Thissignificantly reduced the load, but it also reduced theeffectiveness of the technique. As a result, tail latencieswere still reduced significantly, but the average latencyincreased. Clearly, static hedging is heavily dependent onits threshold and load. So, we introduced smart hedgingin February 2018 to reduce read tail latencies, withoutnegatively impacting the average latency.
We concluded the A/B testing in June 2018 and en-abled our two tail-mitigation techniques by default in themodified HDFS client. The techniques have improvedthe user experience significantly and many users havealready switched to our client.
7 Related workTo our knowledge, no prior work has addressed all thepractical challenges of production systems (Section 2).Nevertheless, our work is related to the following efforts.Tail latency in distributed file/storage systems. Mostprior works have assumed that writes to persistent storageoccur in the background (buffered writes), so write taillatency has not received much attention. An exception isCosTLO [53], which issues redundant writes (and reads)in key-value stores. CosTLO’s approach is similar to thecloning write pipelines technique (Section 4.4) that weconsidered but discarded. We opted for fail fast, becauseit operates at a finer granularity (slow server replacementin a pipeline). In addition, fail fast is much simpler toimplement as it leverages existing replication and fault-tolerance mechanisms.
In contrast, several works addressed read tail laten-cies [16, 40, 44, 46, 54, 55]. C3 [44] proposes a replicaselection algorithm that uses server-side information andrate limits. However, C3 is not scalable as it needs tostore server load data on ephemeral clients. Rein [40]targets key-value stores and schedules concurrent readsof multiple keys. CRAQ [46] improves read throughputand latency under chain replication by enabling read-ing from any replica in the chain, while still provid-ing strong consistency. Smart hedging is orthogonal toCRAQ and can reduce its read tail latencies. Other workspropose techniques that run at pre-defined intervals. Forexample, Cassandra uses dynamic snitching [16], whichperiodically ranks servers based on observed latenciesand server-reported loads to select the best replica for aread. HDFS’s static hedging starts a hedge request aftera threshold amount of time. Unfortunately, these tech-niques cannot tackle dynamic heterogeneity since theinterval/threshold might be inappropriate at run time. Insmart hedging, each client determines when to react atrun time, and uses back-off to prevent overload.
Earlier works [25, 32, 42, 47, 51, 60, 62] manage re-sources to meet tail latency SLOs and ensure fair sharing.They are orthogonal to our techniques, and often rely oncentralized components and/or complex modeling.Tail latency in local file systems. Other works have char-acterized storage latencies (e.g., [15, 27]), and proposedtechniques for cutting latency tails (e.g., [28]). Such tech-niques are complementary to our work.Tail latency in data analytics frameworks. Mantri [10],LATE [59], Dolly [9], and PBSE [43] improve runningtimes via SE. Our techniques handle storage-level bottle-necks independently from computation, while avoidinggreater compute-storage coupling.
13
8 ConclusionWe introduced techniques for managing tail latencies inproduction distributed file systems, implemented themin a popular system, and evaluated them extensively.Our results demonstrate large latency improvements withI/O-bound jobs, and smaller improvements with morebalanced production workloads. The results also illus-trate that it is easy to overlook important effects in non-production systems. We conclude that it is possible todevise effective techniques while considering the chal-lenges and constraints of real datacenters.
AcknowledgmentsWe thank the anonymous reviewers and our shepherd,Kang Chen, for their comments on our paper. We alsothank Virajith Jalaparti, Bianca Schroeder, Sameh El-nikety, Jonathan Mace and Marco Canini for their com-ments on an earlier draft. We are indebted to Lukas Ma-jercak for his help in deploying and testing in production.This work was supported in part by the National ScienceFoundation (CNS-1616947).
References[1] HDFS Architecture Guide, 2008. http://hadoop.apache.org/
docs/current/hdfs_design.html.[2] HDFS Architecture Guide, 2008. https://docs.mongodb.com/
manual/tutorial/manage-chained-replication/.[3] Apache HTrace: A tracing framework for use with distributed
systems, 2017. http://htrace.incubator.apache.org/.[4] DistCp Guide, 2017. http://hadoop.apache.org/docs/current/
hadoop-distcp/DistCp.html.[5] TeraGen, 2017. https://hadoop.apache.org/docs/current/api/
org/apache/hadoop/examples/teragen/package-summary.html.
[6] Track time to process packet in Datanode, 2017. https://issues.apache.org/jira/browse/HDFS-13053.
[7] Track speed in DFSClient, 2018. https://issues.apache.org/jira/browse/HDFS-12861.
[8] AMVROSIADIS, G., PARK, J. W., GANGER, G. R., GIBSON,G. A., BASEMAN, E., AND DEBARDELEBEN, N. On the diver-sity of cluster workloads and its impact on research results. InUSENIX ATC (2018).
[9] ANANTHANARAYANAN, G., GHODSI, A., SHENKER, S., AND
STOICA, I. Effective Straggler Mitigation: Attack of the Clones.In NSDI (2013).
[10] ANANTHANARAYANAN, G., KANDULA, S., GREENBERG, A.,STOICA, I., LU, Y., SAHA, B., AND HARRIS, E. Reining in theOutliers in Map-reduce Clusters Using Mantri. In OSDI (2010).
[11] ANDERSEN, D. G., FRANKLIN, J., KAMINSKY, M., PHAN-ISHAYEE, A., TAN, L., AND VASUDEVAN, V. Fawn: A fast arrayof wimpy nodes. In Proceedings of the ACM SIGOPS 22Nd Sym-posium on Operating Systems Principles (New York, NY, USA,2009), SOSP ’09, ACM, pp. 1–14.
[12] APACHE SOFTWARE FOUNDATION. Apache Spark.[13] BALAKRISHNAN, M., MALKHI, D., PRABHAKARAN, V., WOB-
BLER, T., WEI, M., AND DAVIS, J. D. CORFU: A shared logdesign for flash clusters. In Presented as part of the 9th USENIX
Symposium on Networked Systems Design and Implementation(NSDI 12) (San Jose, CA, 2012), USENIX, pp. 1–14.
[14] CALDER, B., WANG, J., OGUS, A., NILAKANTAN, N.,SKJOLSVOLD, A., MCKELVIE, S., XU, Y., SRIVASTAV, S.,WU, J., SIMITCI, H., HARIDAS, J., UDDARAJU, C., KHATRI,H., EDWARDS, A., BEDEKAR, V., MAINALI, S., ABBASI, R.,AGARWAL, A., HAQ, M. F. U., HAQ, M. I. U., BHARDWAJ, D.,DAYANAND, S., ADUSUMILLI, A., MCNETT, M., SANKARAN,S., MANIVANNAN, K., AND RIGAS, L. Windows azure storage:A highly available cloud storage service with strong consistency.In Proceedings of the Twenty-Third ACM Symposium on Operat-ing Systems Principles (New York, NY, USA, 2011), SOSP ’11,ACM, pp. 143–157.
[15] CAO, Z., TARASOV, V., RAMAN, H. P., HILDEBRAND, D., AND
ZADOK, E. On the Performance Variation in Modern StorageStacks. In FAST (2017).
[16] CARPENTER, J., AND HEWITT, E. Cassandra: The DefinitiveGuide: Distributed Data at Web Scale. " O’Reilly Media, Inc.",2016.
[17] CHAIKEN, R., JENKINS, B., LARSON, P.-Å., RAMSEY, B.,SHAKIB, D., WEAVER, S., AND ZHOU, J. SCOPE: Easy andEfficient Parallel Processing of Massive Data Sets. Proceedingsof the VLDB Endowment 1, 2 (2008).
[18] DEAN, J., AND BARROSO, L. A. The Tail at Scale. Communica-tions of the ACM 56, 2 (2013).
[19] DEAN, J., AND GHEMAWAT, S. MapReduce: Simplified DataProcessing on Large Clusters. In OSDI (2004).
[20] DELIMITROU, C., AND KOZYRAKIS, C. Quasar: Resource-Efficient and QoS-Aware Cluster Management. In ASPLOS(2014).
[21] DINU, F., AND NG, T. Understanding the Effects and Implica-tions of Compute Node Related Failures in Hadoop. In HPDC(2012).
[22] ESCRIVA, R., WONG, B., AND SIRER, E. G. Hyperdex: A dis-tributed, searchable key-value store. SIGCOMM Comput. Com-mun. Rev. 42, 4 (Aug. 2012), 25–36.
[23] GHEMAWAT, S., GOBIOFF, H., AND LEUNG, S.-T. The GoogleFile System. In SOSP (2003).
[24] GODER, A., SPIRIDONOV, A., AND WANG, Y. Bistro: Sched-uling Data-Parallel Jobs Against Live Production Systems. InUSENIX ATC (2015).
[25] GULATI, A., AHMAD, I., AND WALDSPURGER, C. A. PARDA:Proportional Allocation of Resources for Distributed StorageAccess. In FAST (2009).
[26] HAO, M., LI, H., TONG, M. H., PAKHA, C., SUMINTO, R. O.,STUARDO, C. A., CHIEN, A. A., AND GUNAWI, H. S. MittOS:Supporting Millisecond Tail Tolerance with Fast Rejecting SLO-Aware OS Interface. In SOSP (2017).
[27] HAO, M., SOUNDARARAJAN, G., KENCHAMMANA-HOSEKOTE, D. R., CHIEN, A. A., AND GUNAWI, H. S.The Tail at Store: A Revelation from Millions of Hours of Diskand SSD Deployments. In FAST (2016).
[28] HE, J., NGUYEN, D., ARPACI-DUSSEAU, A. C., AND ARPACI-DUSSEAU, R. H. Reducing File System Tail Latencies withChopper. In FAST (2015).
[29] IORGULESCU, C., AZIMI, R., KWON, Y., ELNIKETY, S., SYA-MALA, M., NARASAYYA, V., HERODOTOU, H., TOMITA, P.,CHEN, A., ZHANG, J., ET AL. Perfiso: Performance isolation forcommercial latency-sensitive services. In USENIX ATC (2018).
[30] ISARD, M. Autopilot: Automatic Data Center Management. ACMSIGOPS Operating Systems Review 41, 2 (2007).
14
[31] JALAPARTI, V., BODIK, P., KANDULA, S., MENACHE, I., RY-BALKIN, M., AND YAN, C. Speeding up Distributed Request-Response Workflows. In SIGCOMM (2013).
[32] JIN, W., CHASE, J. S., AND KAUR, J. Interposed ProportionalSharing for a Storage Service Utility. In SIGMETRICS (2004).
[33] JYOTHI, S. A., CURINO, C., MENACHE, I., NARAYANA-MURTHY, S. M., TUMANOV, A., YANIV, J., MAVLYUTOV, R.,GOIRI, Í., KRISHNAN, S., KULKARNI, J., ET AL. Morpheus: To-wards Automated SLOs for Enterprise Clusters. In OSDI (2016).
[34] LI, H., GHODSI, A., ZAHARIA, M., SHENKER, S., AND STO-ICA, I. Tachyon: Reliable, Memory Speed Storage for ClusterComputing Frameworks. In SoCC (2014).
[35] LI, J., SHARMA, N. K., PORTS, D. R., AND GRIBBLE, S. D.Tales of the Tail: Hardware, OS, and Application-Level Sourcesof Tail Latency. In SoCC (2014).
[36] LO, D., CHENG, L., GOVINDARAJU, R., RANGANATHAN, P.,AND KOZYRAKIS, C. Heracles: Improving Resource Efficiencyat Scale. In ISCA (2015).
[37] MACE, J., BODIK, P., FONSECA, R., AND MUSUVATHI, M.Retro: Targeted Resource Management in Multi-tenant Dis-tributed Systems. In NSDI (2015).
[38] MISRA, P., GOIRI, I., KACE, J., AND BIANCHINI, R. ScalingDistributed File Systems in Resource-Harvesting Datacenters. InUSENIX ATC (2017).
[39] OUYANG, X., GARRAGHAN, P., PRIMAS, B., MCKEE, D., TOW-NEND, P., AND XU, J. Adaptive speculation for efficient inter-netware application execution in clouds. ACM Trans. InternetTechnol. 18, 2 (Jan. 2018), 15:1–15:22.
[40] REDA, W., CANINI, M., SURESH, L., KOSTIC, D., AND
BRAITHWAITE, S. Rein: Taming Tail Latency in Key-ValueStores via Multiget Scheduling. In EuroSys (2017).
[41] REN, X., ANANTHANARAYANAN, G., WIERMAN, A., AND YU,M. Hopper: Decentralized speculation-aware cluster schedulingat scale. In Proceedings of the 2015 ACM Conference on SpecialInterest Group on Data Communication (New York, NY, USA,2015), SIGCOMM ’15, ACM, pp. 379–392.
[42] SHUE, D., FREEDMAN, M. J., AND SHAIKH, A. PerformanceIsolation and Fairness for Multi-tenant Cloud Storage. In OSDI(2012).
[43] SUMINTO, R. O., STUARDO, C. A., CLARK, A., KE, H.,LEESATAPORNWONGSA, T., FU, B., KURNIAWAN, D. H., MAR-TIN, V., UMA, M. R. G., AND GUNAWI, H. S. Pbse: A robustpath-based speculative execution for degraded-network tail tol-erance in data-parallel frameworks. In Proceedings of the 2017Symposium on Cloud Computing (New York, NY, USA, 2017),SoCC ’17, ACM, pp. 295–308.
[44] SURESH, P. L., CANINI, M., SCHMID, S., AND FELDMANN,A. C3: Cutting Tail Latency in Cloud Data Stores via AdaptiveReplica Selection. In NSDI (2015).
[45] TANG, S., LEE, B., AND HE, B. Dynamicmr: A dynamic slotallocation optimization framework for mapreduce clusters. IEEETransactions on Cloud Computing 2, 3 (July 2014), 333–347.
[46] TERRACE, J., AND FREEDMAN, M. J. Object storage on craq:High-throughput chain replication for read-mostly workloads. InUSENIX Annual Technical Conference (2009), San Diego, CA.
[47] TRUSHKOWSKY, B., BODÍK, P., FOX, A., FRANKLIN, M. J.,
JORDAN, M. I., AND PATTERSON, D. A. The SCADS Director:Scaling a Distributed Storage System Under Stringent Perfor-mance Requirements. In FAST (2011).
[48] VAN RENESSE, R., AND SCHNEIDER, F. B. Chain replication forsupporting high throughput and availability. In Proceedings of the6th Conference on Symposium on Opearting Systems Design &Implementation - Volume 6 (Berkeley, CA, USA, 2004), OSDI’04,USENIX Association, pp. 7–7.
[49] VEERARAGHAVAN, K., MEZA, J., CHOU, D., KIM, W., MAR-GULIS, S., MICHELSON, S., NISHTALA, R., OBENSHAIN, D.,PERELMAN, D., AND SONG, Y. J. Kraken: Leveraging Live Traf-fic Tests to Identify and Resolve Resource Utilization Bottlenecksin Large Scale Web Services. In OSDI (2016).
[50] VERMA, A., PEDROSA, L., KORUPOLU, M., OPPENHEIMER,D., TUNE, E., AND WILKES, J. Large-Scale Cluster Manage-ment at Google with Borg. In EuroSys (2015).
[51] WANG, A., VENKATARAMAN, S., ALSPAUGH, S., KATZ, R.,AND STOICA, I. Cake: Enabling High-Level SLOs on SharedStorage Systems. In SoCC (2012).
[52] WU, Z., BUTKIEWICZ, M., PERKINS, D., KATZ-BASSETT, E.,AND MADHYASTHA, H. V. SPANStore: Cost-effective geo-replicated storage spanning multiple cloud services. In SOSP(2013).
[53] WU, Z., YU, C., AND MADHYASTHA, H. V. CosTLO: Cost-Effective Redundancy for Lower Latency Variance on CloudStorage Services. In NSDI (2015).
[54] XE, L. Support Hedged Reads in DFSClient, 2014. https://issues.apache.org/jira/browse/HDFS-5776.
[55] XE, L., AND MCCABE, C. P. Support Non-Positional HedgedReads in HDFS, 2017. https://issues.apache.org/jira/browse/HDFS-6450.
[56] YANG, H., BRESLOW, A., MARS, J., AND TANG, L. Bubble-flux: Precise Online QoS Management for Increased Utilizationin Warehouse Scale Computers. In ISCA (2013).
[57] YANG, S., HARTER, T., AGRAWAL, N., KOWSALYA, S. S.,KRISHNAMURTHY, A., AL-KISWANY, S., KAUSHIK, R. T.,ARPACI-DUSSEAU, A. C., AND ARPACI-DUSSEAU, R. H. Split-level i/o scheduling. In Proceedings of the 25th Symposium onOperating Systems Principles (2015), ACM, pp. 474–489.
[58] YANG, Y., KIM, G.-W., SONG, W. W., LEE, Y., CHUNG, A.,QIAN, Z., CHO, B., AND CHUN, B.-G. Pado: A Data ProcessingEngine for Harnessing Transient Resources in Datacenters. InEuroSys (2017).
[59] ZAHARIA, M., KONWINSKI, A., JOSEPH, A. D., KATZ, R. H.,AND STOICA, I. Improving MapReduce Performance in Hetero-geneous Environments. In OSDI (2008).
[60] ZHANG, J., RISKA, A., SIVASUBRAMANIAM, A., WANG,Q., AND RIEDEL, E. Storage Performance Virtualization viaThroughput and Latency Control. In MASCOTS (2005).
[61] ZHANG, Y., PREKAS, G., FUMAROLA, G. M., FONTOURA, M.,GOIRI, I., AND BIANCHINI, R. History-Based Harvesting ofSpare Cycles and Storage in Large-Scale Datacenters. In OSDI(2016).
[62] ZHU, T., TUMANOV, A., KOZUCH, M. A., HARCHOL-BALTER,M., AND GANGER, G. R. PriorityMeister: Tail Latency QoS forShared Networked Storage. In SoCC (2014).
15