Lyman- forest as a precision cosmology probe · I Lyman- forest as a tracer of structure in the...
26
Lyman-α forest as a precision cosmology probe Anˇ ze Slosar IG matters, June 2014 1 / 26
Transcript of Lyman- forest as a precision cosmology probe · I Lyman- forest as a tracer of structure in the...
Lyman-α forest as a precisioncosmology probe
Anze Slosar
IG matters,June 2014
1 / 26
Introduction
I Lyman-α forest as a tracer of structure in the high-z universe
I Field revolutionized by BOSS
I Joint BOSS BAO constraintsI I will not talk about:
I Lyman-β forest power spectrum measurementsI PDF constraints
I This will be a very BOSS-centric talk
2 / 26
Measuring Density fields
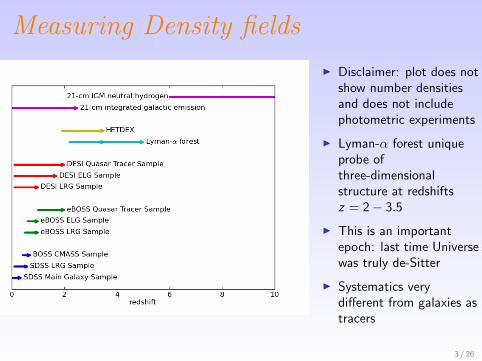
I Disclaimer: plot does notshow number densitiesand does not includephotometric experiments
I Lyman-α forest uniqueprobe ofthree-dimensionalstructure at redshiftsz = 2 − 3.5
I This is an importantepoch: last time Universewas truly de-Sitter
I Systematics verydifferent from galaxies astracers
3 / 26
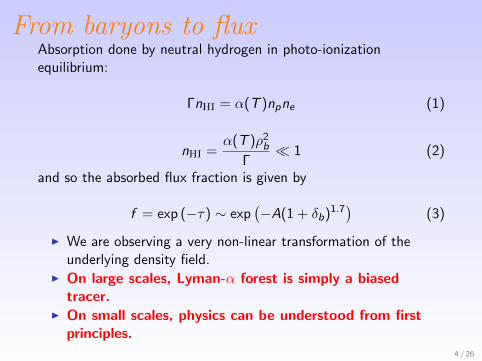
From baryons to fluxAbsorption done by neutral hydrogen in photo-ionizationequilibrium:
ΓnHI = α(T )npne (1)
nHI =α(T )ρ2
b
Γ 1 (2)
and so the absorbed flux fraction is given by
f = exp (−τ) ∼ exp(−A(1 + δb)1.7
)(3)
I We are observing a very non-linear transformation of theunderlying density field.
I On large scales, Lyman-α forest is simply a biasedtracer.
I On small scales, physics can be understood from firstprinciples.
4 / 26
1D vs 3D
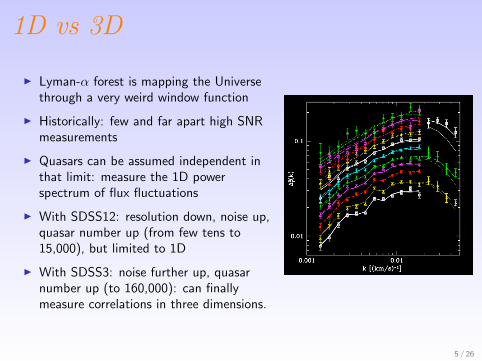
I Lyman-α forest is mapping the Universethrough a very weird window function
I Historically: few and far apart high SNRmeasurements
I Quasars can be assumed independent inthat limit: measure the 1D powerspectrum of flux fluctuations
I With SDSS12: resolution down, noise up,quasar number up (from few tens to15,000), but limited to 1D
I With SDSS3: noise further up, quasarnumber up (to 160,000): can finallymeasure correlations in three dimensions.
5 / 26
1D vs 3D
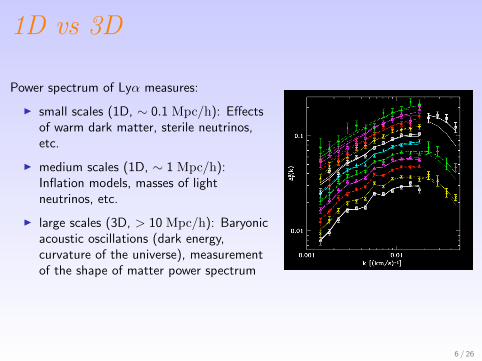
Power spectrum of Lyα measures:
I small scales (1D, ∼ 0.1 Mpc/h): Effectsof warm dark matter, sterile neutrinos,etc.
I medium scales (1D, ∼ 1 Mpc/h):Inflation models, masses of lightneutrinos, etc.
I large scales (3D, > 10 Mpc/h): Baryonicacoustic oscillations (dark energy,curvature of the universe), measurementof the shape of matter power spectrum
6 / 26
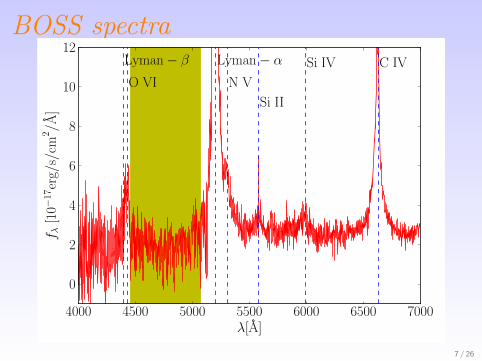
BOSS spectra
7 / 26
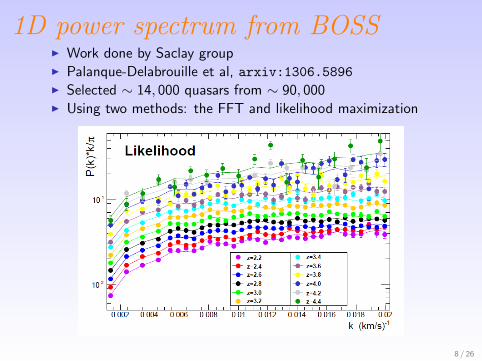
1D power spectrum from BOSSI Work done by Saclay groupI Palanque-Delabrouille et al, arxiv:1306.5896I Selected ∼ 14, 000 quasars from ∼ 90, 000I Using two methods: the FFT and likelihood maximization
8 / 26
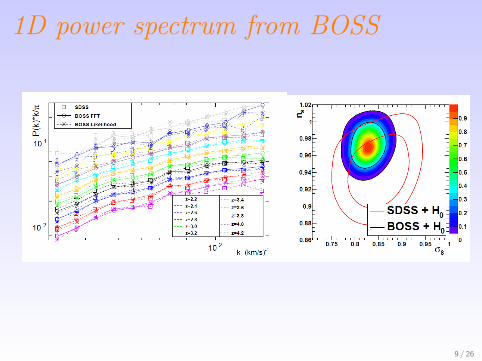
1D power spectrum from BOSS
9 / 26
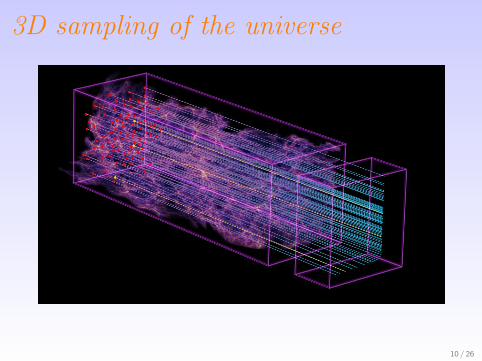
3D sampling of the universe
10 / 26
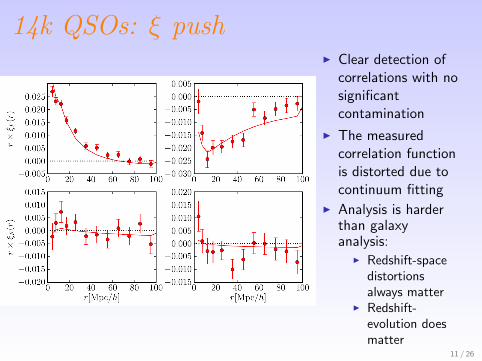
14k QSOs: ξ pushI Clear detection of
correlations with nosignificantcontamination
I The measuredcorrelation functionis distorted due tocontinuum fitting
I Analysis is harderthan galaxyanalysis:
I Redshift-spacedistortionsalways matter
I Redshift-evolution doesmatter
11 / 26
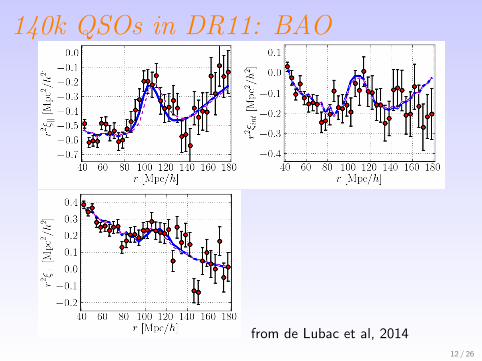
140k QSOs in DR11: BAO
from de Lubac et al, 201412 / 26
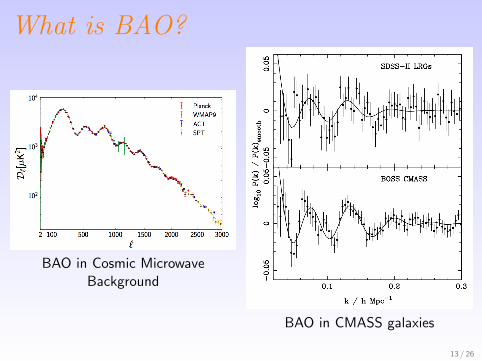
What is BAO?
BAO in Cosmic MicrowaveBackground
BAO in CMASS galaxies
13 / 26
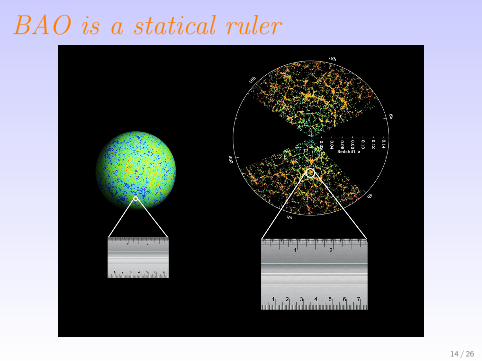
BAO is a statical ruler
14 / 26
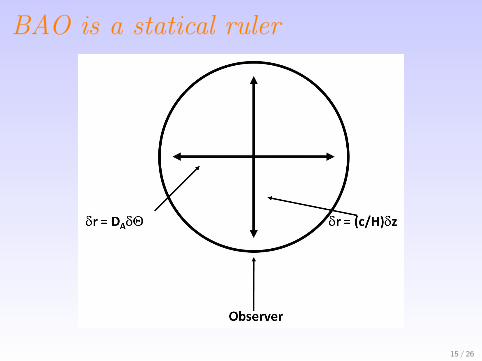
BAO is a statical ruler
15 / 26
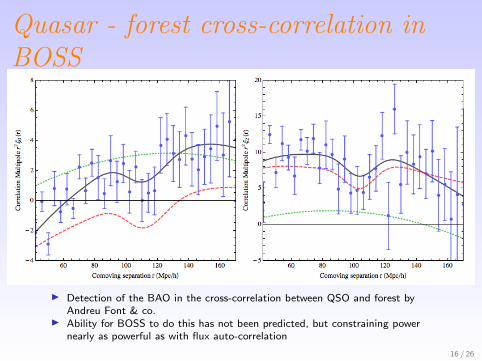
Quasar - forest cross-correlation inBOSS
I Detection of the BAO in the cross-correlation between QSO and forest byAndreu Font & co.
I Ability for BOSS to do this has not been predicted, but constraining powernearly as powerful as with flux auto-correlation
16 / 26
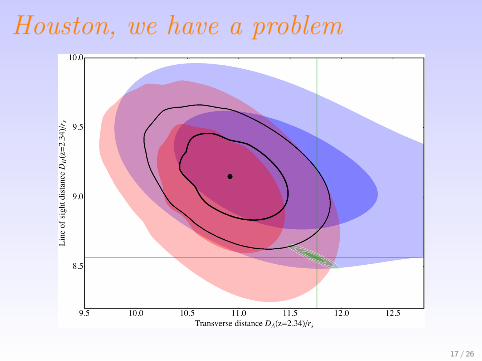
Houston, we have a problem
17 / 26
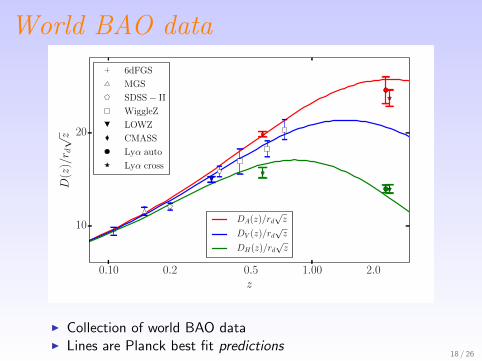
World BAO data
0.10 1.000.2 0.5 2.0z
10
20
D(z
)/r d√z
DA(z)/rd√z
DV (z)/rd√z
DH(z)/rd√z
6dFGS
MGS
SDSS− II
WiggleZ
LOWZ
CMASS
Lyα auto
Lyα cross
I Collection of world BAO dataI Lines are Planck best fit predictions
18 / 26
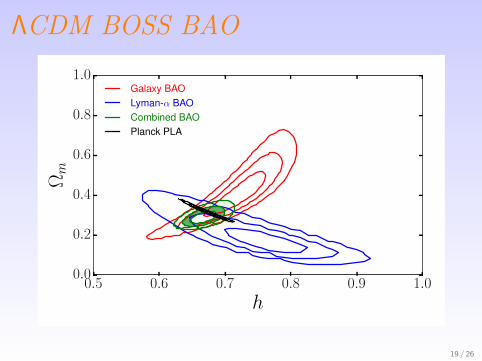
ΛCDM BOSS BAO
0.5 0.6 0.7 0.8 0.9 1.0
h
0.0
0.2
0.4
0.6
0.8
1.0Ωm
Galaxy BAOLyman-α BAOCombined BAOPlanck PLA
19 / 26
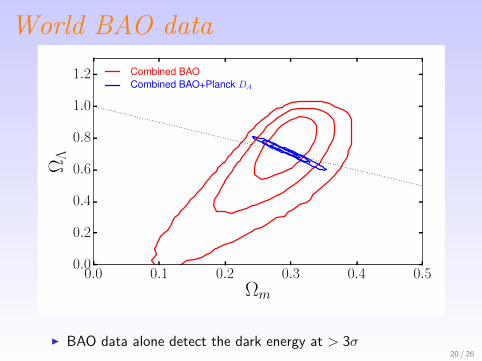
World BAO data
0.0 0.1 0.2 0.3 0.4 0.5Ωm
0.0
0.2
0.4
0.6
0.8
1.0
1.2Ω
ΛCombined BAOCombined BAO+Planck DA
I BAO data alone detect the dark energy at > 3σ20 / 26
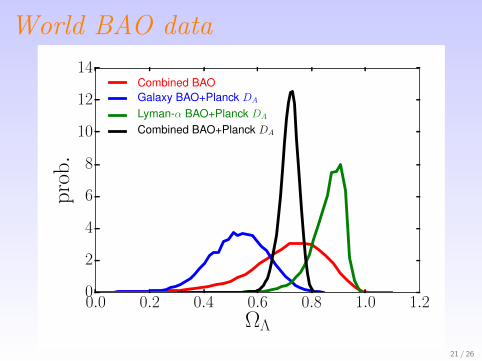
World BAO data
0.0 0.2 0.4 0.6 0.8 1.0 1.2ΩΛ
0
2
4
6
8
10
12
14p
rob.
Combined BAOGalaxy BAO+Planck DA
Lyman-α BAO+Planck DA
Combined BAO+Planck DA
I BAO data alone detect the dark energy at > 3σ
21 / 26
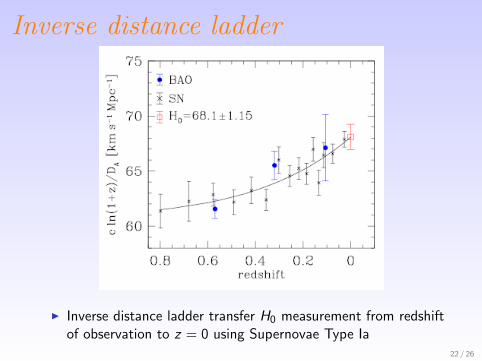
Inverse distance ladder
I Inverse distance ladder transfer H0 measurement from redshiftof observation to z = 0 using Supernovae Type Ia
22 / 26
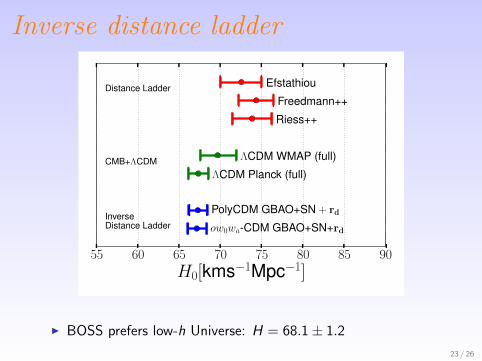
Inverse distance ladder
55 60 65 70 75 80 85 90
H0[kms−1Mpc−1]
ow0wa-CDM GBAO+SN+rd
PolyCDM GBAO+SN + rdInverseDistance Ladder
ΛCDM Planck (full)
ΛCDM WMAP (full)CMB+ΛCDM
Riess++
Freedmann++
EfstathiouDistance Ladder
I BOSS prefers low-h Universe: H = 68.1 ± 1.2
23 / 26
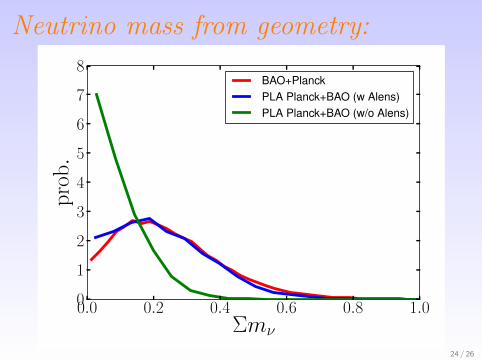
Neutrino mass from geometry:
0.0 0.2 0.4 0.6 0.8 1.0Σmν
0
1
2
3
4
5
6
7
8p
rob.
BAO+PlanckPLA Planck+BAO (w Alens)PLA Planck+BAO (w/o Alens)
24 / 26
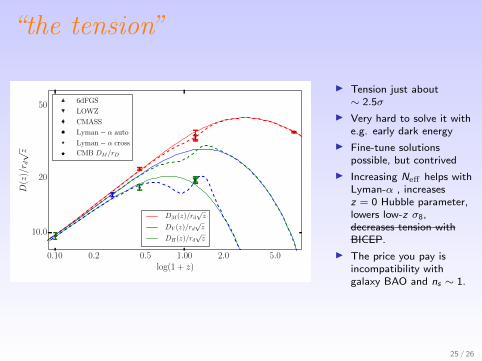
“the tension”
0.10 1.000.2 0.5 2.0 5.0log(1 + z)
10.0
20
50
D(z
)/r d√z
DM(z)/rd√z
DV (z)/rd√z
DH(z)/rd√z
6dFGS
LOWZ
CMASS
Lyman− α auto
Lyman− α cross
CMB DM/rD
I Tension just about∼ 2.5σ
I Very hard to solve it withe.g. early dark energy
I Fine-tune solutionspossible, but contrived
I Increasing Neff helps withLyman-α , increasesz = 0 Hubble parameter,lowers low-z σ8,decreases tension withBICEP.
I The price you pay isincompatibility withgalaxy BAO and ns ∼ 1.
25 / 26
Conclusions
I Life is good
I Lyman-α BAO exhibits a small tension with ΛCDM cosmologyI The future is bright, most promise in small scale P1D:
I Neutrino massI Neff
I running of spectral index
I More data on horizon: the 400 public hi resolution QSOspectra, eBOSS, DESI
26 / 26