4 Choose the camera mounting shoe and the number according ...
Loudness Measurement according to EBU-R128
Fons AdriaensenCasa della Musica, Parma
Linux Audio Conference 2011Maynooth, Ireland
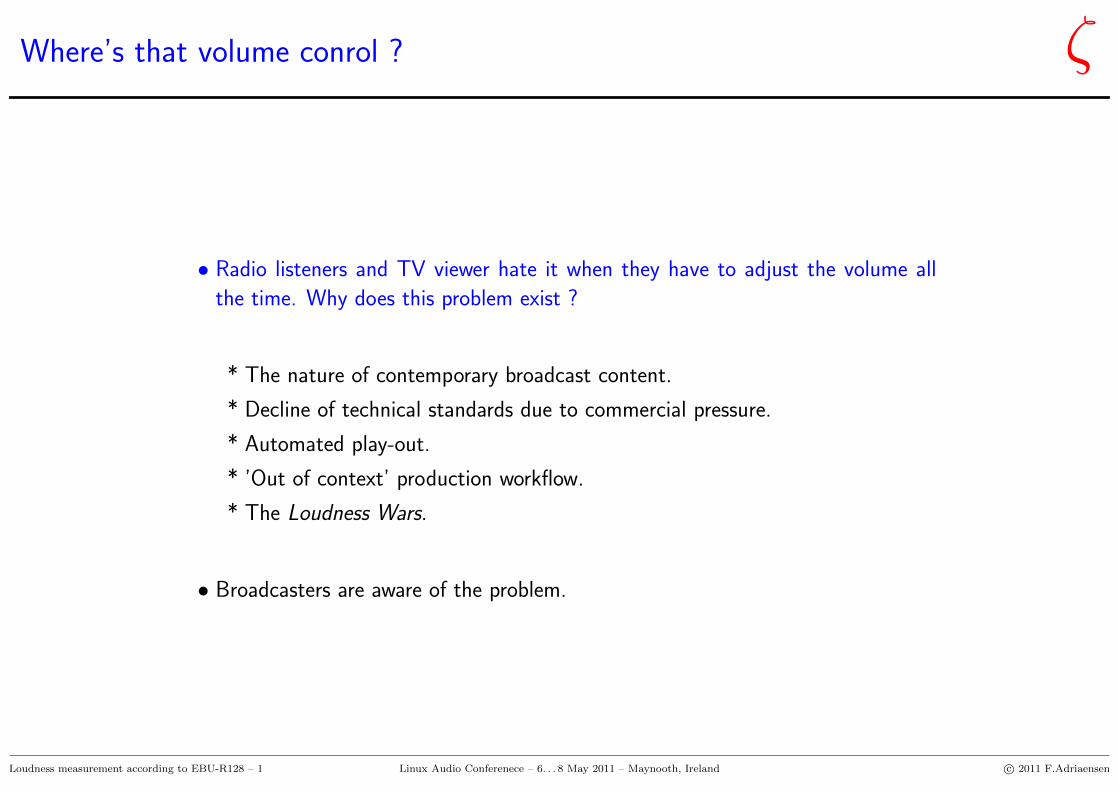
Where’s that volume conrol ? ζ
• Radio listeners and TV viewer hate it when they have to adjust the volume all
the time. Why does this problem exist ?
* The nature of contemporary broadcast content.
* Decline of technical standards due to commercial pressure.
* Automated play-out.
* ’Out of context’ production workflow.
* The Loudness Wars.
• Broadcasters are aware of the problem.
Loudness measurement according to EBU-R128 – 1 Linux Audio Conferenece – 6. . . 8 May 2011 – Maynooth, Ireland c© 2011 F.Adriaensen
What is missing ? ζ
• Automated loudness measurement that
* does not require human interpretation,
* can be applied to stored data before it is used,
* produces reliable results over e.g. a complete song, or a complete program.
• Technical standards.
• Consumer pressure and legislation.
Loudness measurement according to EBU-R128 – 2 Linux Audio Conferenece – 6. . . 8 May 2011 – Maynooth, Ireland c© 2011 F.Adriaensen
Possible benefits ζ
• A better listener and viewer experience.
• Maybe a solution for the Loudness Wars:
If broadcasters and consumer playback devices can measure loudness
before playing a song and apply an automatic level correction, then
there is nothing to be gained from pushing up recording levels at
the expense of quality.
Loudness measurement according to EBU-R128 – 3 Linux Audio Conferenece – 6. . . 8 May 2011 – Maynooth, Ireland c© 2011 F.Adriaensen
The state of the art ζ
• Very few professional tools seem to exist (e.g. Dolby LM100).
• The film industry seems to have its act together.
• The music industry, and radio and TV broadcasters absolutely not.
• Current level measurement practices do not provide a solution.
Loudness measurement according to EBU-R128 – 4 Linux Audio Conferenece – 6. . . 8 May 2011 – Maynooth, Ireland c© 2011 F.Adriaensen
Levels meters: Digital peak meter ζ
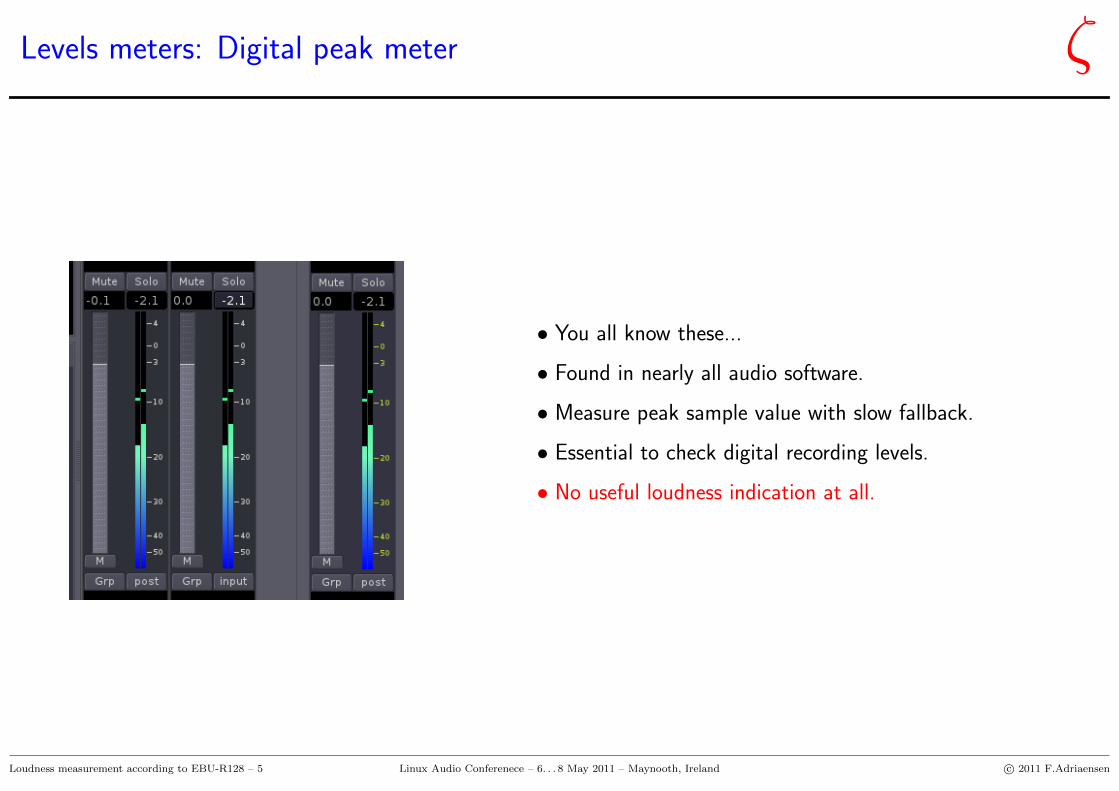
• You all know these...
• Found in nearly all audio software.
• Measure peak sample value with slow fallback.
• Essential to check digital recording levels.
• No useful loudness indication at all.
Loudness measurement according to EBU-R128 – 5 Linux Audio Conferenece – 6. . . 8 May 2011 – Maynooth, Ireland c© 2011 F.Adriaensen
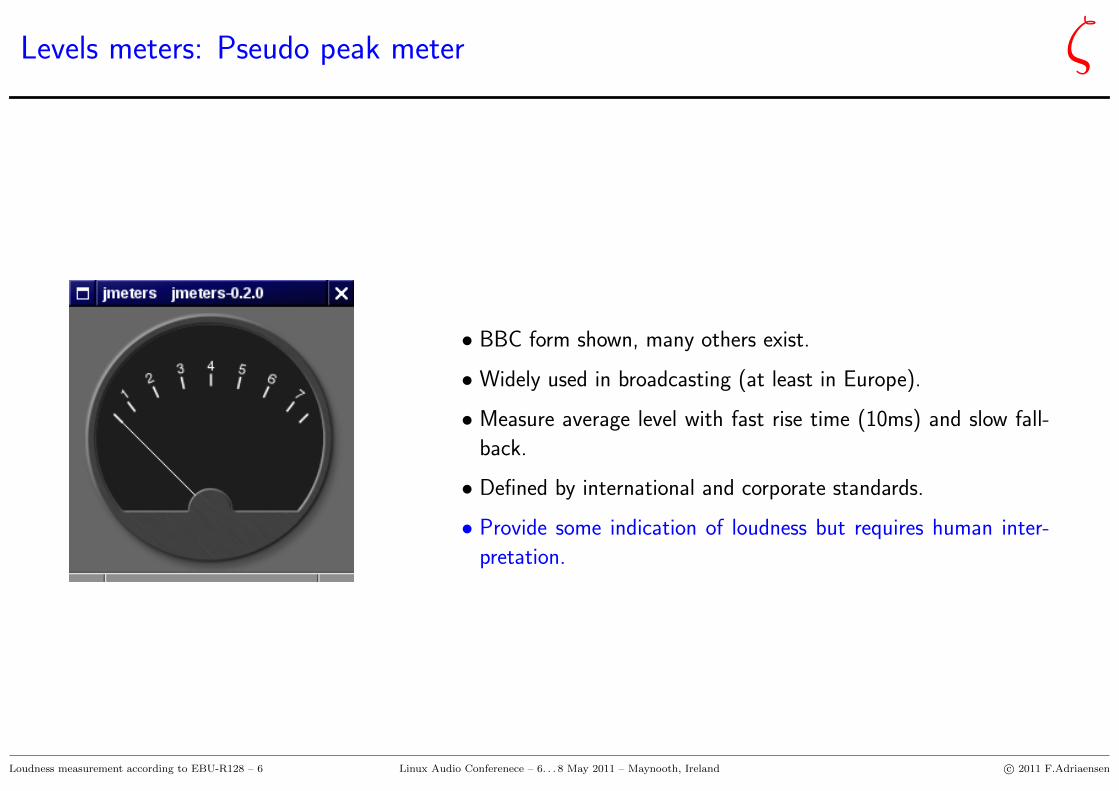
Levels meters: Pseudo peak meter ζ
• BBC form shown, many others exist.
• Widely used in broadcasting (at least in Europe).
• Measure average level with fast rise time (10ms) and slow fall-
back.
• Defined by international and corporate standards.
• Provide some indication of loudness but requires human inter-
pretation.
Loudness measurement according to EBU-R128 – 6 Linux Audio Conferenece – 6. . . 8 May 2011 – Maynooth, Ireland c© 2011 F.Adriaensen
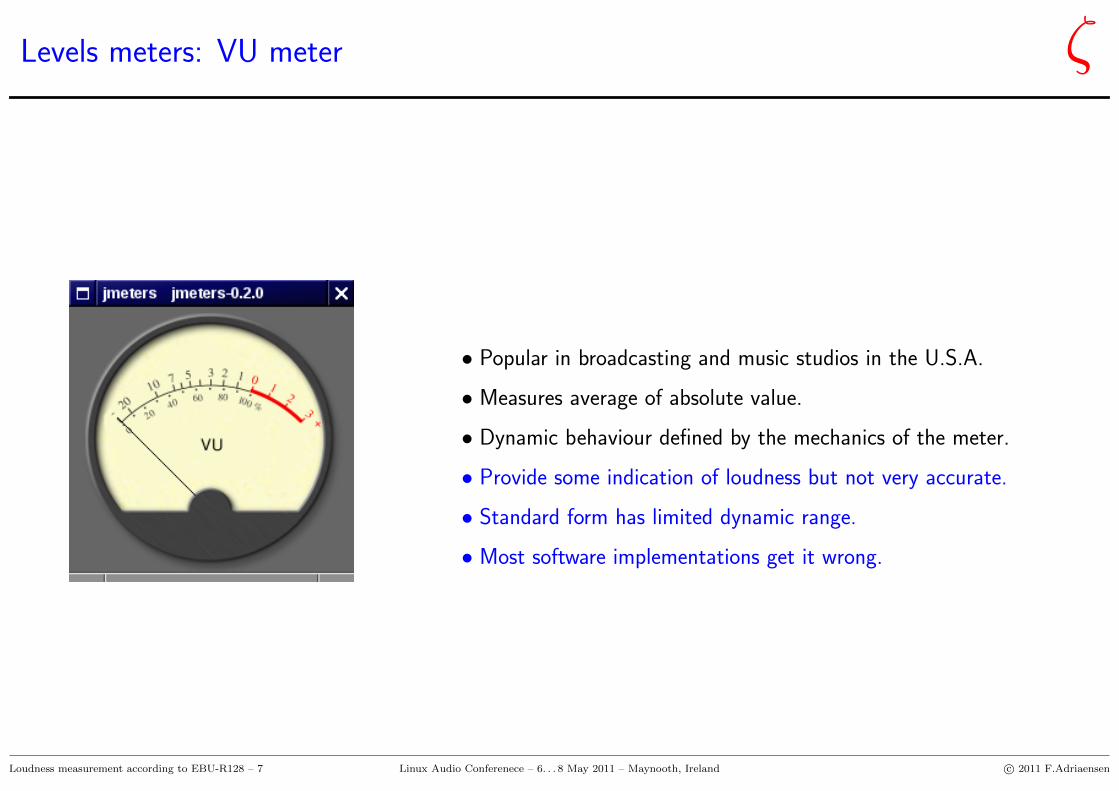
Levels meters: VU meter ζ
• Popular in broadcasting and music studios in the U.S.A.
• Measures average of absolute value.
• Dynamic behaviour defined by the mechanics of the meter.
• Provide some indication of loudness but not very accurate.
• Standard form has limited dynamic range.
• Most software implementations get it wrong.
Loudness measurement according to EBU-R128 – 7 Linux Audio Conferenece – 6. . . 8 May 2011 – Maynooth, Ireland c© 2011 F.Adriaensen
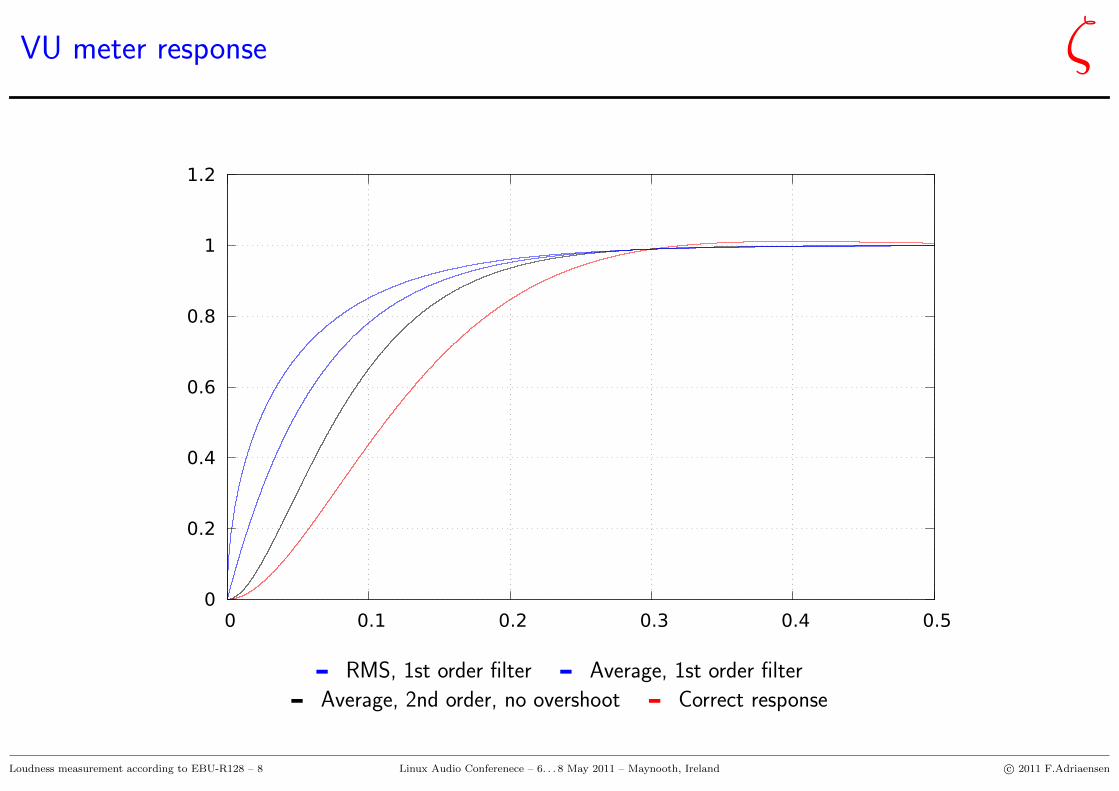
VU meter response ζ
0
0.2
0.4
0.6
0.8
1
1.2
0 0.1 0.2 0.3 0.4 0.5
RMS, 1st order filter Average, 1st order filter
Average, 2nd order, no overshoot Correct response
Loudness measurement according to EBU-R128 – 8 Linux Audio Conferenece – 6. . . 8 May 2011 – Maynooth, Ireland c© 2011 F.Adriaensen
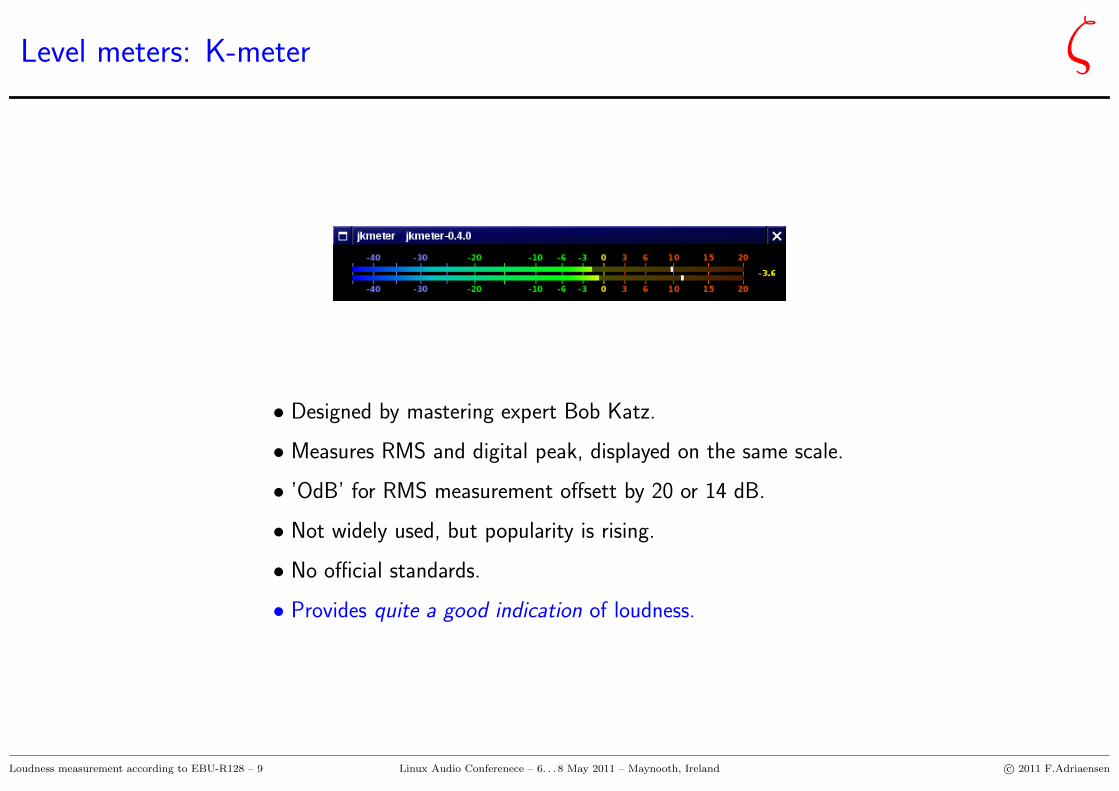
Level meters: K-meter ζ
• Designed by mastering expert Bob Katz.
• Measures RMS and digital peak, displayed on the same scale.
• ’OdB’ for RMS measurement offsett by 20 or 14 dB.
• Not widely used, but popularity is rising.
• No official standards.
• Provides quite a good indication of loudness.
Loudness measurement according to EBU-R128 – 9 Linux Audio Conferenece – 6. . . 8 May 2011 – Maynooth, Ireland c© 2011 F.Adriaensen
Level meters: Summary ζ
• With the exception of the K-meter, none of the currently used level
meters provide a reliable loudness indication.
• VU and PMM require human interpretation and skilled users.
• They only provide momentary values, there is no standard for integrated
measurement, nor for the determination of loudness range.
Loudness measurement according to EBU-R128 – 10 Linux Audio Conferenece – 6. . . 8 May 2011 – Maynooth, Ireland c© 2011 F.Adriaensen
The EBU initiative ζ
• Under the impulse of Florian Camerer (senior sound engineer at the ORF)
the European Broadcasting Union has taken the initiative to define a
loudness measurement standard.
• The PLOUD Working Group has produced Recommendation R-128,
which is in turn based on standards defined by the ITU.
• R-128 defines methods to measure integrated loudness and loudness
range, and some standards on how these values should be displayed.
• Implementation guidelines and audio test files are provided as well.
• Commercial equipment and software based on R-128 is starting to be-
come available. Linux Audio should follow !
Loudness measurement according to EBU-R128 – 11 Linux Audio Conferenece – 6. . . 8 May 2011 – Maynooth, Ireland c© 2011 F.Adriaensen
The ITU-R BS1770 recommendation ζ
• R-BS1770 defines the basic loudness measurement algorithm. It is based
on years of research by various institutions and members of the ITU.
• The algorithm has been validated by extensive listening tests which have
shown very good correlation between measured and subjective results.
• Key features of the algorithm are:
* Pre-detection filtering.
* RMS measurement on individual channels.
* Channel powers are summed.
* Per-channel weights for 5.1 surround.
• The ITU recommendation does not specify a reference level.
Loudness measurement according to EBU-R128 – 12 Linux Audio Conferenece – 6. . . 8 May 2011 – Maynooth, Ireland c© 2011 F.Adriaensen
The ITU filter ζ
-14
-12
-10
-8
-6
-4
-2
0
2
4
6
100 1000 10000
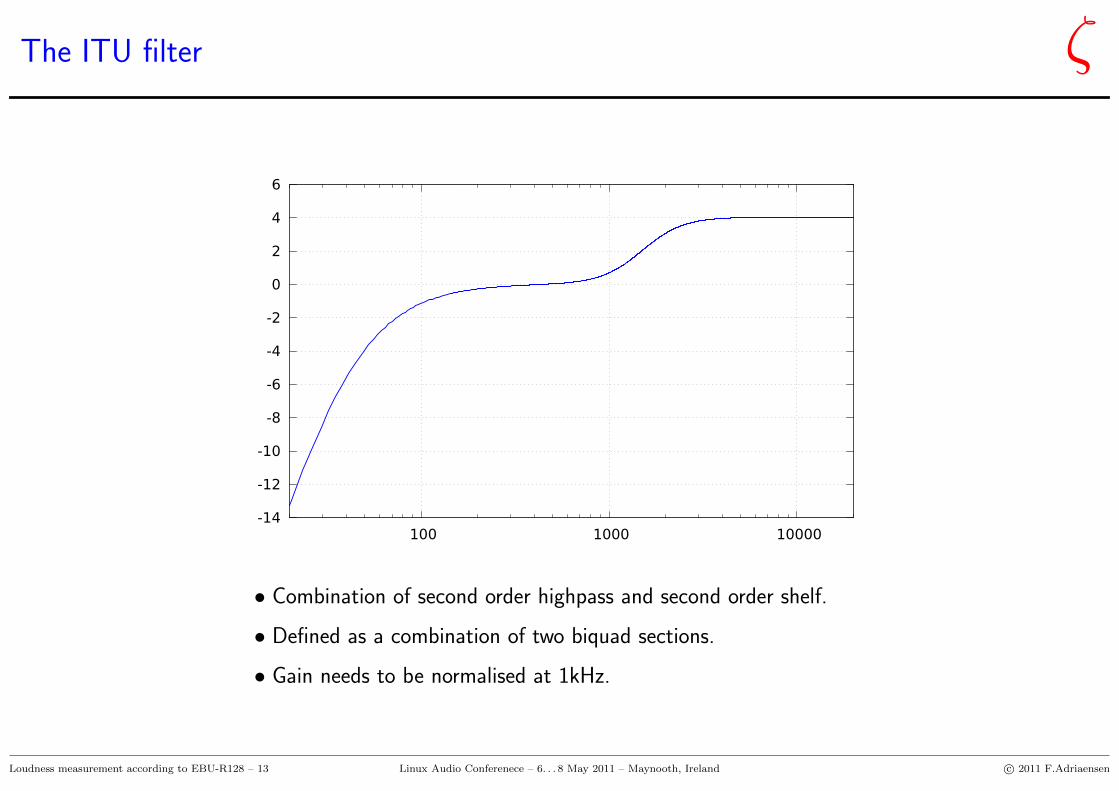
• Combination of second order highpass and second order shelf.
• Defined as a combination of two biquad sections.
• Gain needs to be normalised at 1kHz.
Loudness measurement according to EBU-R128 – 13 Linux Audio Conferenece – 6. . . 8 May 2011 – Maynooth, Ireland c© 2011 F.Adriaensen
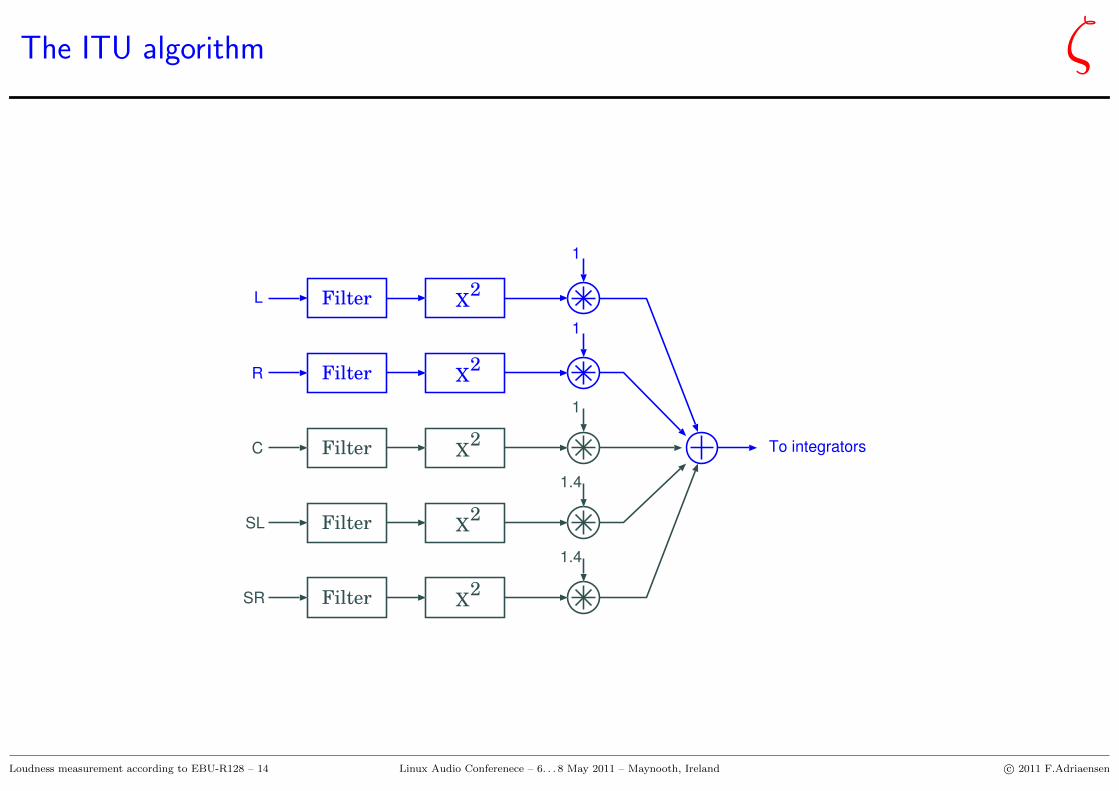
The ITU algorithm ζ
Filter X2
Filter X2
Filter X2
Filter X2
Filter X2
L
R
C
SL
SR
1
1
1
1.4
1.4
To integrators
Loudness measurement according to EBU-R128 – 14 Linux Audio Conferenece – 6. . . 8 May 2011 – Maynooth, Ireland c© 2011 F.Adriaensen
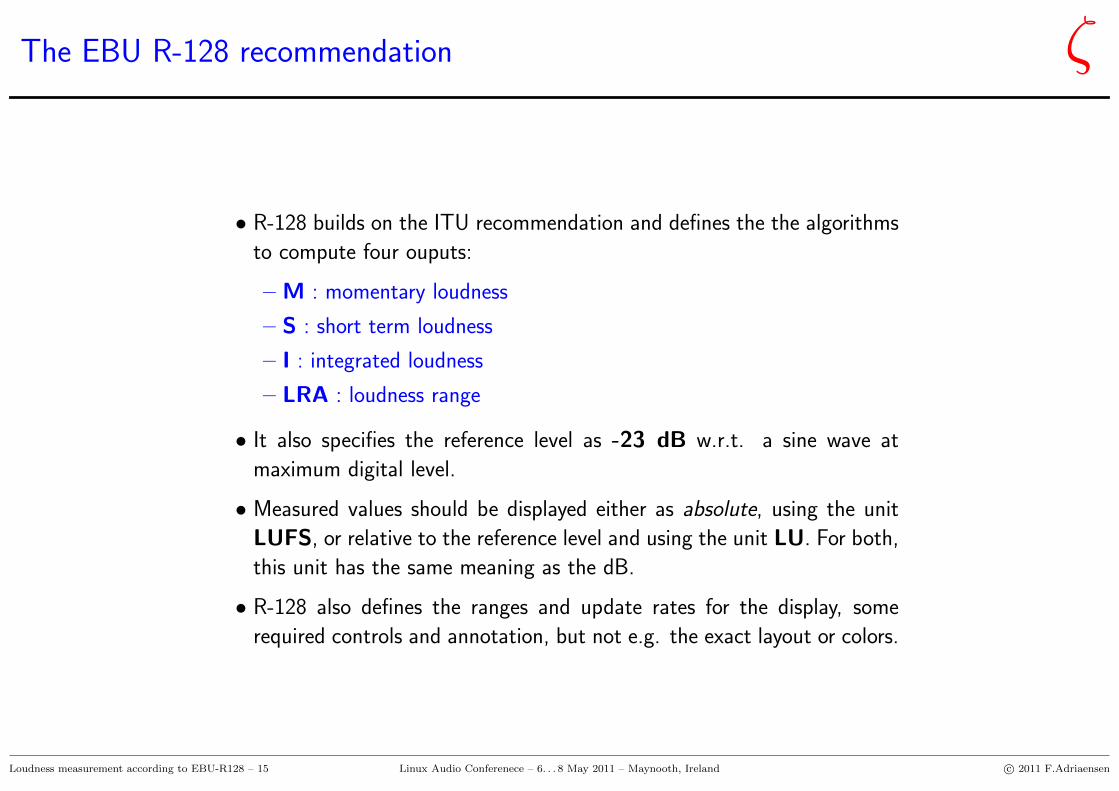
The EBU R-128 recommendation ζ
• R-128 builds on the ITU recommendation and defines the the algorithms
to compute four ouputs:
– M : momentary loudness
– S : short term loudness
– I : integrated loudness
– LRA : loudness range
• It also specifies the reference level as -23 dB w.r.t. a sine wave at
maximum digital level.
• Measured values should be displayed either as absolute, using the unit
LUFS, or relative to the reference level and using the unit LU. For both,
this unit has the same meaning as the dB.
• R-128 also defines the ranges and update rates for the display, some
required controls and annotation, but not e.g. the exact layout or colors.
Loudness measurement according to EBU-R128 – 15 Linux Audio Conferenece – 6. . . 8 May 2011 – Maynooth, Ireland c© 2011 F.Adriaensen
The M and S measurements ζ
• The M ouput is computed by integrating the sum of powers over a sliding rect-
angular window of 400 ms.
• The S ouput is computed by integrating the sum of powers over a sliding rect-
angular window of 3 seconds.
• An instrument or software application conforming to R-128 should allow the user
to display either M or S. Update rate must be at least 10 times per second.
• The maximum values for either must be displayed as well.
• For a graphical display two ranges should be provided: one from -18 to +9 LU,
the second from -36 to +18 LU.
• The user should be able to select either the relative (LU) scale, or the absolute
(LUFS) one.
Loudness measurement according to EBU-R128 – 16 Linux Audio Conferenece – 6. . . 8 May 2011 – Maynooth, Ireland c© 2011 F.Adriaensen
The integrated loudness algorithm ζ
• The I algorithm provides a loudness value averaged over an arbitrary long time
interval.
• It can be applied to either an audio file, or in interactive mode, controlled by
start, stop and reset commands. The same controls also enable and reset the
display of the maximum values of M or S.
• The measurement is based on the 400 ms windows used for the M display. The
integration periods must overlap by at least 200 ms.
• Given this input, the integrated loudness is computed in four steps:
* All inputs below -70 dB (re. full scale) are discarded.
* The average power of the remaining values is computed.
* All inputs lower than 8 dB below this average are discarded.
* The output is the average power of the remaining values.
Loudness measurement according to EBU-R128 – 17 Linux Audio Conferenece – 6. . . 8 May 2011 – Maynooth, Ireland c© 2011 F.Adriaensen
The loudness range algorithm - 1 ζ
• The LRA algorithm provides an indication of the loudness range over an arbitrary
long time interval. It can be used e.g. to determine if some compression is
required.
• It can be applied to either an audio file, or in interactive mode, using the same
controls as for the integrated measurement.
• The algorithm is designed to ignore periods of almost silence, and very loud but
short sounds (e.g. a gunshot in a movie).
• R-128 does not require endpoints of the range to be displayed, only their differ-
ence.
• The measurement is based on the 3 second windows used for the S display. The
integration periods must overlap by at least 2 seconds.
Loudness measurement according to EBU-R128 – 18 Linux Audio Conferenece – 6. . . 8 May 2011 – Maynooth, Ireland c© 2011 F.Adriaensen
The loudness range algorithm - 2 ζ
• Given the values used for the S measurement, the loudness range is calculated in
four steps:
* All values below -70 dB (re. full scale) are discarded.
* The average power of the remaining inputs is computed.
* All inputs lower than 20 dB below this average are discarded.
* The loudness range is then computed as the difference between the level that
is exceeded by 90% of the remaining values, and the one exceeded by 5% of
them.
• The use of percentiles to determine the final output provides for most ’robust’
estimation.
Loudness measurement according to EBU-R128 – 19 Linux Audio Conferenece – 6. . . 8 May 2011 – Maynooth, Ireland c© 2011 F.Adriaensen
Peak indicators ζ
• EBU-R128 also requires an indication of peak value going above limits.
• Inter-sample values easily exceed sample values.
• The ITU documents suggest to upsample by at least a factor of four to find the
real peak values.
Loudness measurement according to EBU-R128 – 20 Linux Audio Conferenece – 6. . . 8 May 2011 – Maynooth, Ireland c© 2011 F.Adriaensen
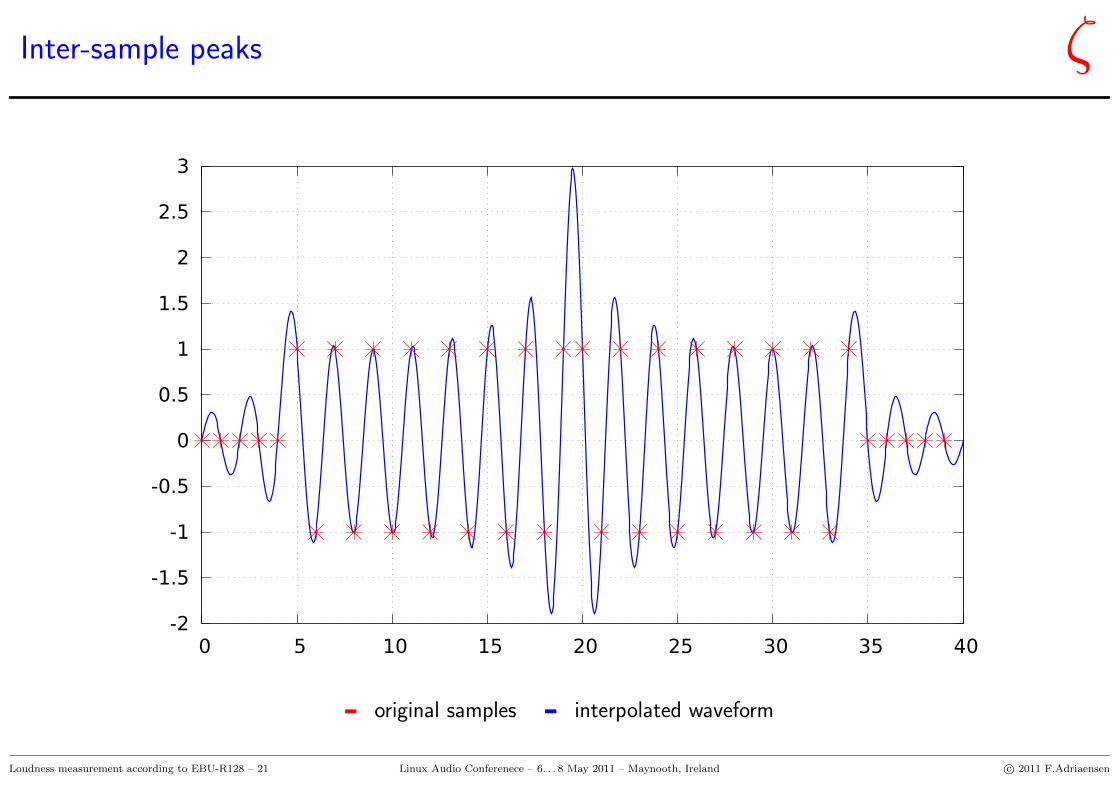
Inter-sample peaks ζ
-2
-1.5
-1
-0.5
0
0.5
1
1.5
2
2.5
3
0 5 10 15 20 25 30 35 40
original samples interpolated waveform
Loudness measurement according to EBU-R128 – 21 Linux Audio Conferenece – 6. . . 8 May 2011 – Maynooth, Ireland c© 2011 F.Adriaensen
Implementation of the EBU-R128 algorithms - 1 ζ
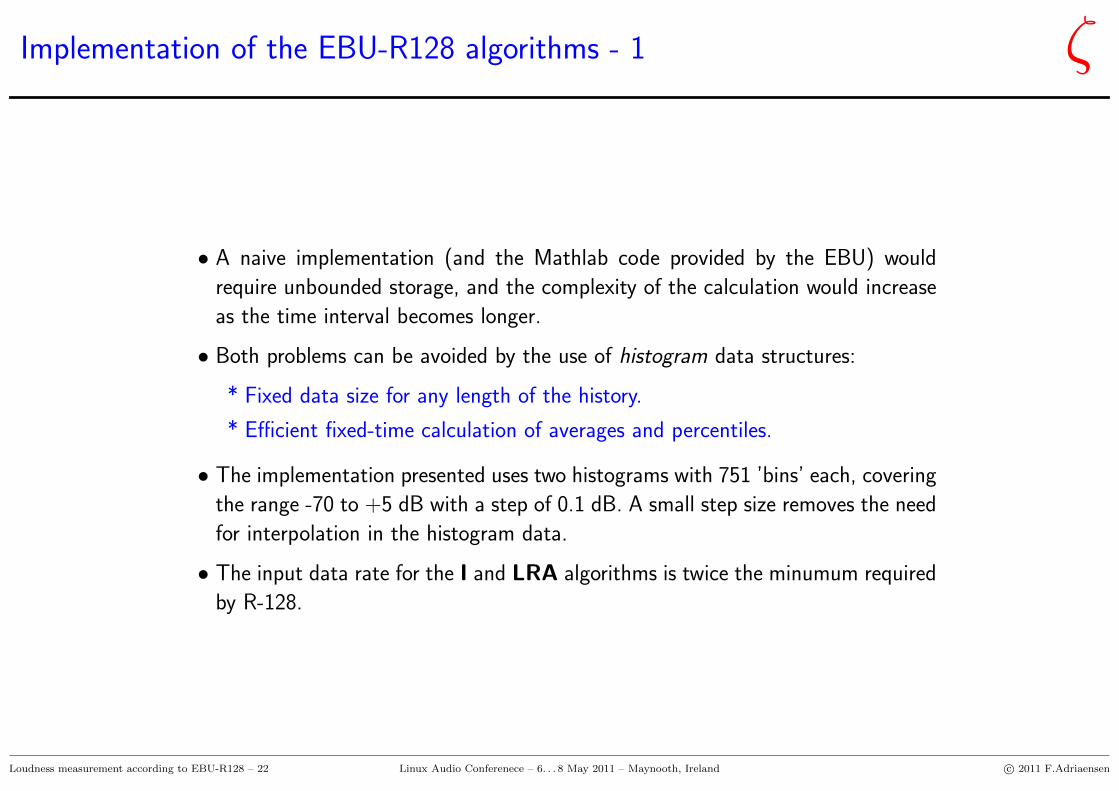
• A naive implementation (and the Mathlab code provided by the EBU) would
require unbounded storage, and the complexity of the calculation would increase
as the time interval becomes longer.
• Both problems can be avoided by the use of histogram data structures:
* Fixed data size for any length of the history.
* Efficient fixed-time calculation of averages and percentiles.
• The implementation presented uses two histograms with 751 ’bins’ each, covering
the range -70 to +5 dB with a step of 0.1 dB. A small step size removes the need
for interpolation in the histogram data.
• The input data rate for the I and LRA algorithms is twice the minumum required
by R-128.
Loudness measurement according to EBU-R128 – 22 Linux Audio Conferenece – 6. . . 8 May 2011 – Maynooth, Ireland c© 2011 F.Adriaensen
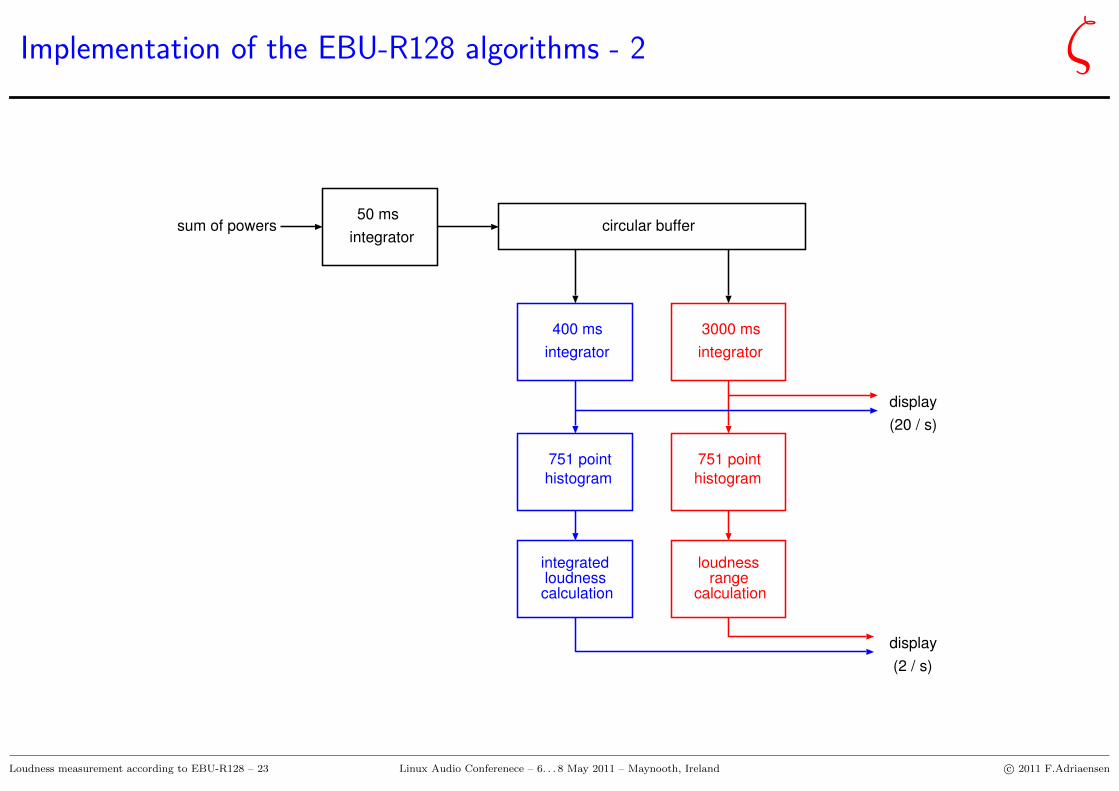
Implementation of the EBU-R128 algorithms - 2 ζ
3000 ms
integrator
400 ms
integrator
50 ms
integratorcircular buffer
display
751 point
histogram
751 point
histogram
integratedloudnesscalculation
loudnessrange
calculation
display
sum of powers
(20 / s)
(2 / s)
Loudness measurement according to EBU-R128 – 23 Linux Audio Conferenece – 6. . . 8 May 2011 – Maynooth, Ireland c© 2011 F.Adriaensen
The Linux programs ζ
• Two applications are provided in the first release:
• ebumeter
* Real-time measurment with GUI.
* First release does not have peak indicators.
* Future version may include graphical display of loudness history.
• ebur128
* Command line app to measure audio files.
* Provides some extra information (internal values).
* Optionally produces a cumulative probability data file that can be displayed
using Gnuplot.
Loudness measurement according to EBU-R128 – 24 Linux Audio Conferenece – 6. . . 8 May 2011 – Maynooth, Ireland c© 2011 F.Adriaensen
Some results ζ
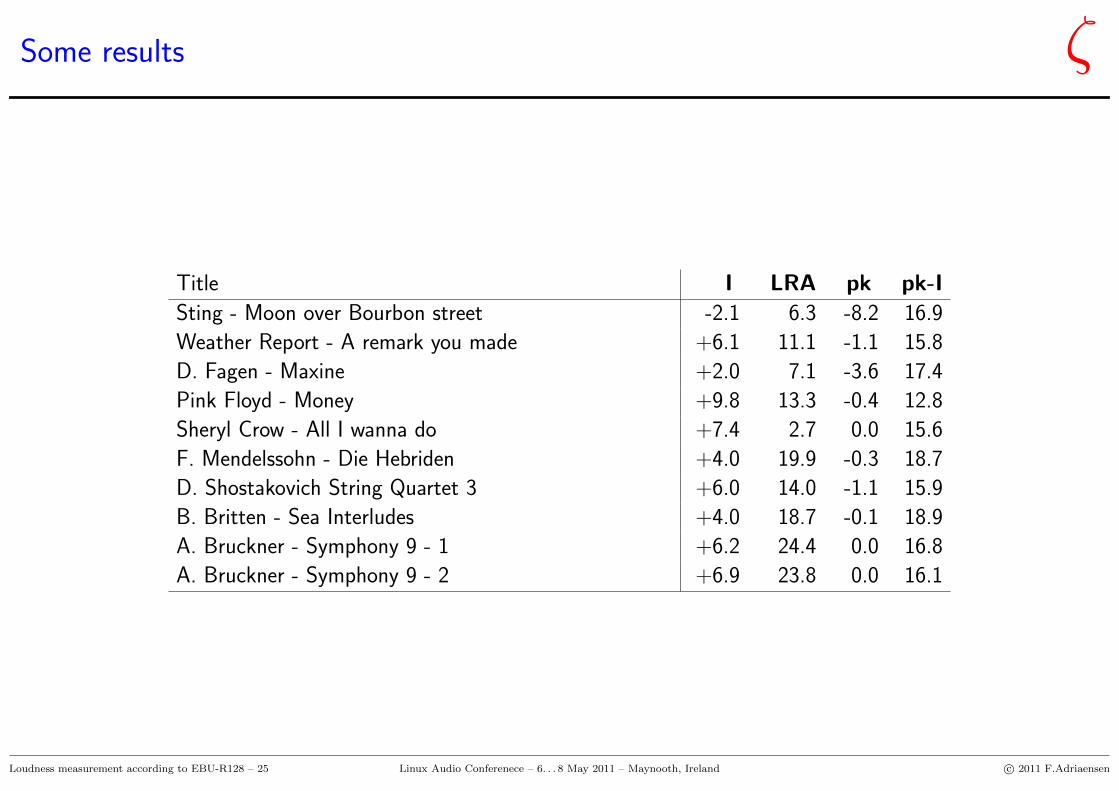
Title I LRA pk pk-I
Sting - Moon over Bourbon street -2.1 6.3 -8.2 16.9
Weather Report - A remark you made +6.1 11.1 -1.1 15.8
D. Fagen - Maxine +2.0 7.1 -3.6 17.4
Pink Floyd - Money +9.8 13.3 -0.4 12.8
Sheryl Crow - All I wanna do +7.4 2.7 0.0 15.6
F. Mendelssohn - Die Hebriden +4.0 19.9 -0.3 18.7
D. Shostakovich String Quartet 3 +6.0 14.0 -1.1 15.9
B. Britten - Sea Interludes +4.0 18.7 -0.1 18.9
A. Bruckner - Symphony 9 - 1 +6.2 24.4 0.0 16.8
A. Bruckner - Symphony 9 - 2 +6.9 23.8 0.0 16.1
Loudness measurement according to EBU-R128 – 25 Linux Audio Conferenece – 6. . . 8 May 2011 – Maynooth, Ireland c© 2011 F.Adriaensen
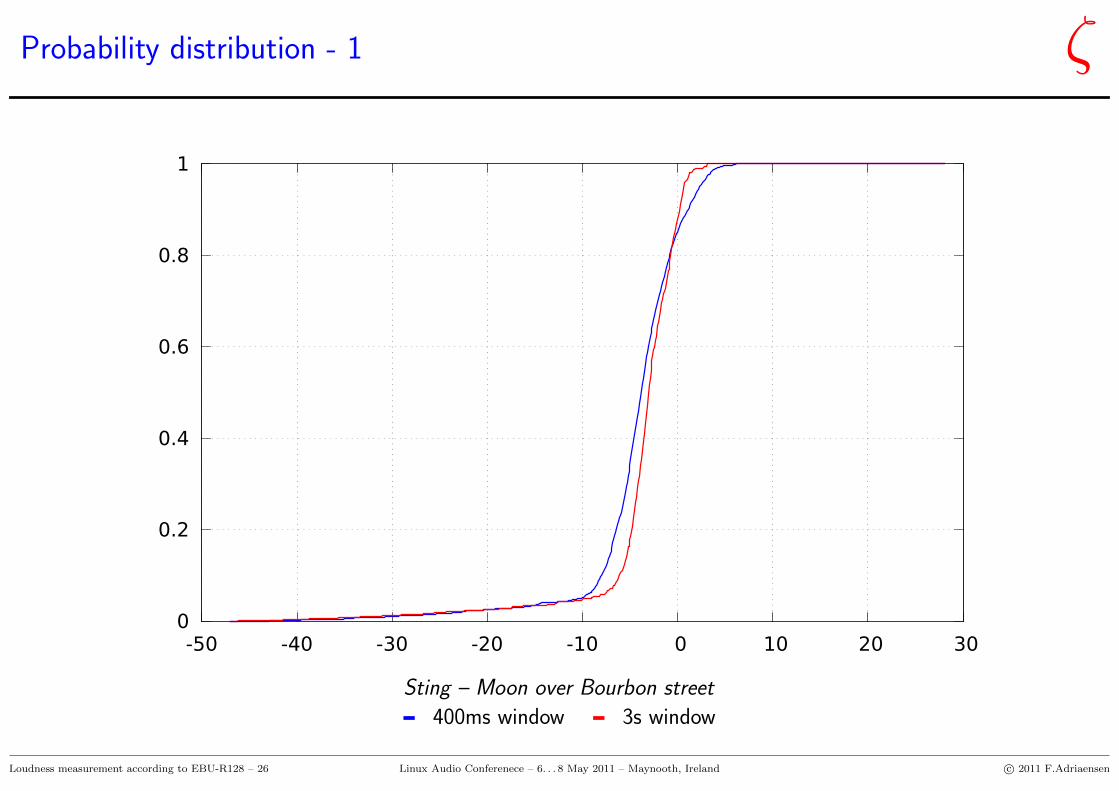
Probability distribution - 1 ζ
0
0.2
0.4
0.6
0.8
1
-50 -40 -30 -20 -10 0 10 20 30
Sting – Moon over Bourbon street
400ms window 3s window
Loudness measurement according to EBU-R128 – 26 Linux Audio Conferenece – 6. . . 8 May 2011 – Maynooth, Ireland c© 2011 F.Adriaensen
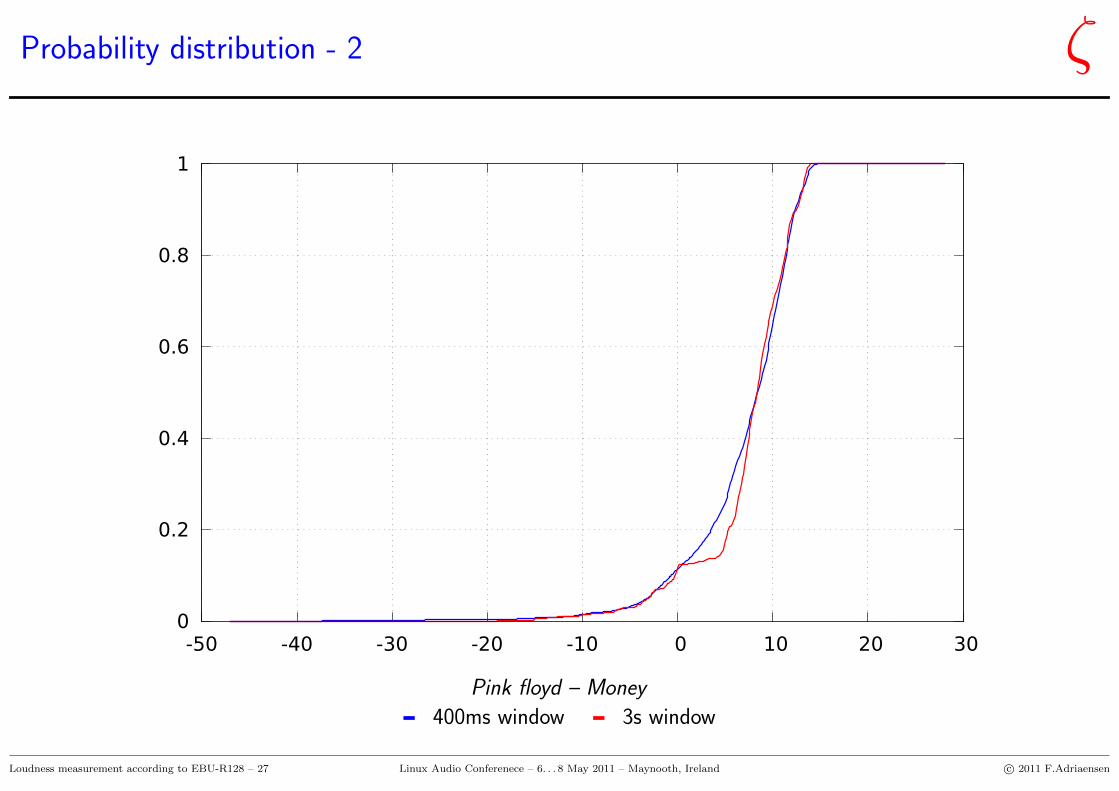
Probability distribution - 2 ζ
0
0.2
0.4
0.6
0.8
1
-50 -40 -30 -20 -10 0 10 20 30
Pink floyd – Money
400ms window 3s window
Loudness measurement according to EBU-R128 – 27 Linux Audio Conferenece – 6. . . 8 May 2011 – Maynooth, Ireland c© 2011 F.Adriaensen
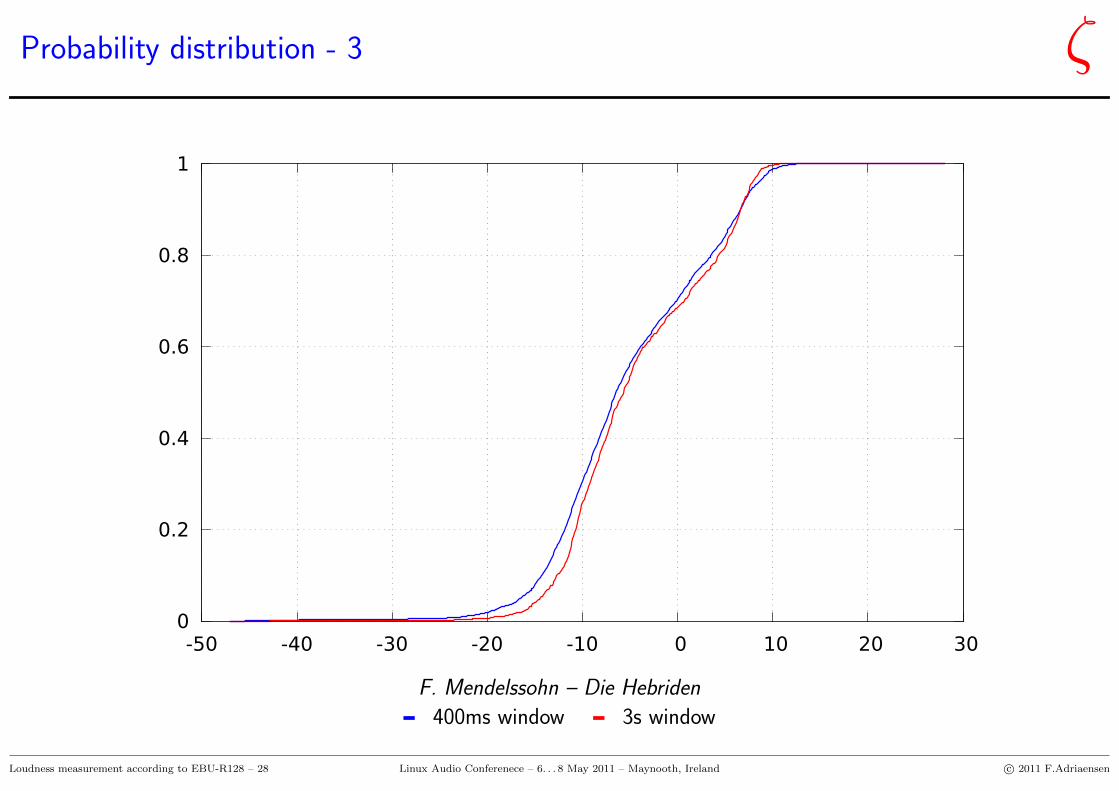
Probability distribution - 3 ζ
0
0.2
0.4
0.6
0.8
1
-50 -40 -30 -20 -10 0 10 20 30
F. Mendelssohn – Die Hebriden
400ms window 3s window
Loudness measurement according to EBU-R128 – 28 Linux Audio Conferenece – 6. . . 8 May 2011 – Maynooth, Ireland c© 2011 F.Adriaensen
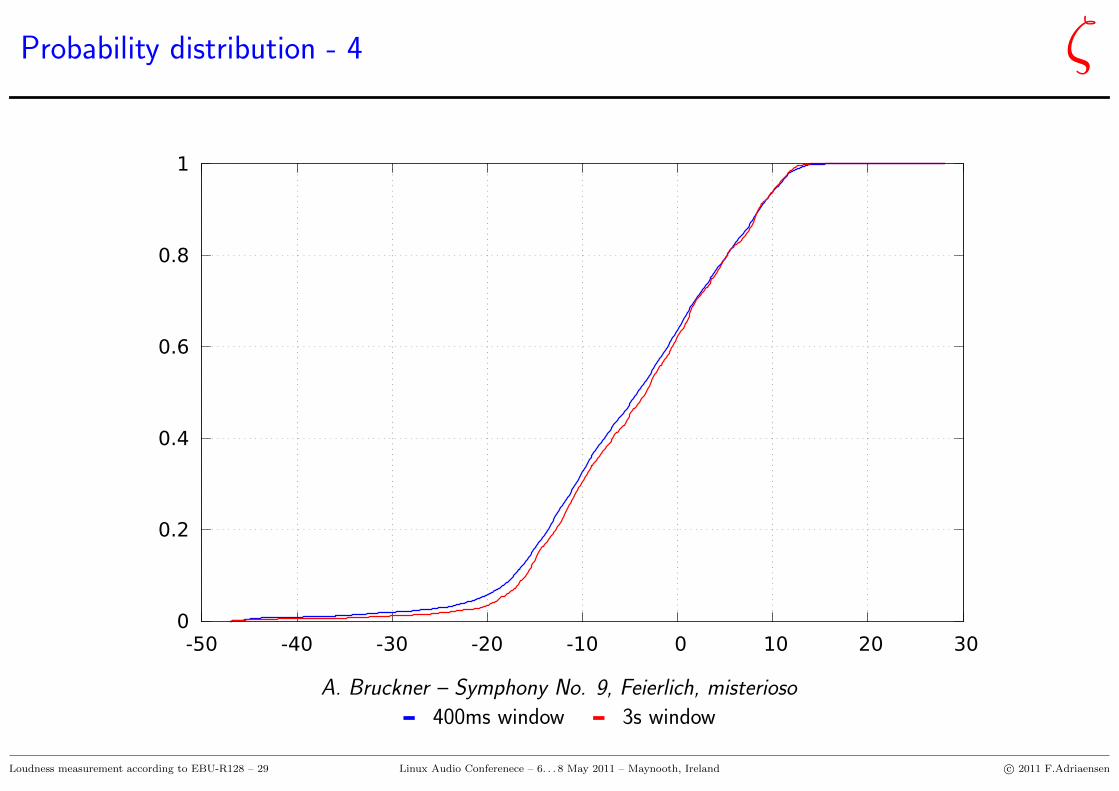
Probability distribution - 4 ζ
0
0.2
0.4
0.6
0.8
1
-50 -40 -30 -20 -10 0 10 20 30
A. Bruckner – Symphony No. 9, Feierlich, misterioso
400ms window 3s window
Loudness measurement according to EBU-R128 – 29 Linux Audio Conferenece – 6. . . 8 May 2011 – Maynooth, Ireland c© 2011 F.Adriaensen
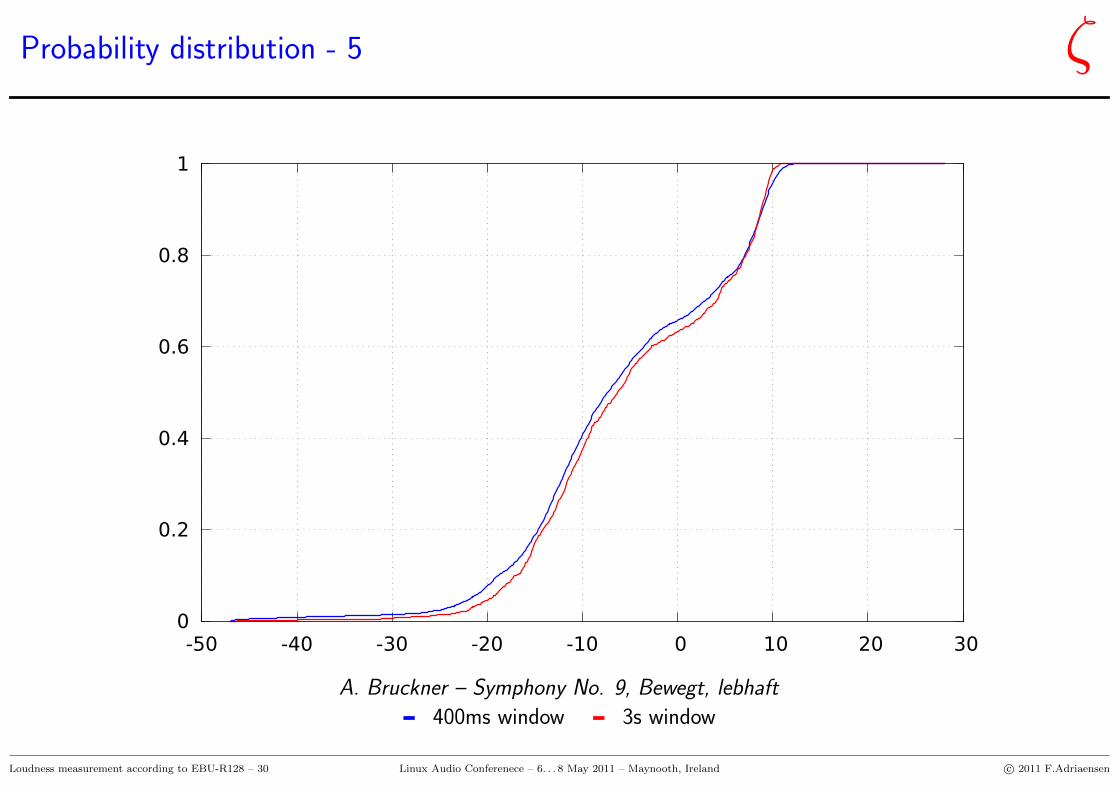
Probability distribution - 5 ζ
0
0.2
0.4
0.6
0.8
1
-50 -40 -30 -20 -10 0 10 20 30
A. Bruckner – Symphony No. 9, Bewegt, lebhaft
400ms window 3s window
Loudness measurement according to EBU-R128 – 30 Linux Audio Conferenece – 6. . . 8 May 2011 – Maynooth, Ireland c© 2011 F.Adriaensen
Questions and answers ζ
The end
Loudness measurement according to EBU-R128 – 31 Linux Audio Conferenece – 6. . . 8 May 2011 – Maynooth, Ireland c© 2011 F.Adriaensen