
Local structure analysis of BO6 (B = Fe, Cu) octahedron ...
9
Local structure analysis of BO 6 (B = Fe, Cu) octahedron correlated with the magnetic properties of Cu-doped Ba 0.5 Sr 0.5 FeO 3–d F FITRIANA 1 , M ZAINURI 1 , M A BAQIYA 1 , M KATO 2 , P KIDKHUNTHOD 3 and S SUASMORO 1, * 1 Department of Physics, Institute of Technology ‘Sepuluh Nopember’ Surabaya, Kampus ITS Sukolilo, Surabaya 60111, Indonesia 2 Department of Applied Physics, Tohoku University, 6-6-05, Aoba, Aramaki, Aoba-ku, Sendai 980-8579, Japan 3 Synchroton Light Research Institute (Public Organization), Nakhon Ratchasima 30000, Thailand *Author for correspondence ([email protected]) MS received 17 December 2019; accepted 10 May 2020 Abstract. Perovskite-based Ba 0.5 Sr 0.5 Fe 1–x Cu x O 3–d (BSFCO-x, x = 0–0.2) was synthesized by sol–gel self-combustion method. The crystallinity was evaluated through X-ray diffraction, besides further local structure analysis, using X-ray absorption spectroscopy (XAS) showed a cubic symmetry for x = 0.05; 0.10, which was tetragonal at higher values, x = 0.15; 0.20. XAS analysis predicted the oxidation state (OS) of Cu to be a mixture of 3? and 2?, while Fe includes 3? and 4?. Conversely, the OS of Fe and Cu in the octahedron site influence the number of an unpair electron that determine the magnetic properties of perovskite. In addition, the magnetization for Ba 0.5 Sr 0.5 FeO 3–d is 0.172 emu g -1 , originating from the ferromagnetic ordering Fe 3? (t 2g 3 e g 2 )–O (2p)–Fe 4? (t 2g 3 e g 1 ) interaction. This effect increase, due to the presence of oxygen vacancy in BSFCO-0.05, which weakens the d–p interaction of Fe-O, while the generation of higher Cu doping to increase the amount of Fe 4? leads to a decline in Cu 3? . Therefore, Cu doping is confirmed to play a role in the paramagnetic– ferromagnetic transition. Keywords. Perovskite; local structure; oxidation state; magnetic material. 1. Introduction Perovskite ABO 3 -doped material has attracted attention because of the remarkable versatile properties, including electronic transport, ferroelectric, photoelectric, and mag- netic properties [1,2]. For example, BaTiO 3 -based per- ovskite has been adopted in capacitance, CH 3 NH 3 PbI 3 for solar cell, and colossal magnetoresistance for magnetic application in the manganese-based perovskite (LaMnO 3 ). In addition, Mn and Co-based perovskites are widely investigated as magnetic materials, although others, including Co, Fe are also important (BiFeO 3 , LaCoO 3 )[3]. Perovskite oxide materials are usually multimorphemic in structures, distorted from ideal cubic nature to orthorhombic or tetragonal by temperature effect or the use of doping materials [4]. The magnetic properties are gen- erally related to the unpair electron in 3d-subshell of the B- site [5]. This characteristic, alongside electronic behaviours of the high spin d 5 (t 2g , e g ) transition-metal, has long cap- tivated investigative interests [5]. Iron-based oxides possess fascinating properties, which is due to the variation in the oxidation states (OS) of Fe, at ?2, ?3, ?4[6], giving rise to the distortion of crystal structures and stoichiometries. Also, BaFeO 3–d is considered to be a representative of an exceptional class of perovskite oxides AFeO 3–d (A = Ca, Sr, Ba), featuring iron in the valence state of Fe 4? /Fe 3? . The interaction of Fe-O-Fe is assumed to be ferromagnetic or antiferromagnetic, depending on the presence of double or super exchange spins. Studies on M–H hysteresis [7–9] of (Ba, Sr)FeO 3 showed magnetic moments that were rela- tively smaller than BaFeO 3 . However, substituting Sr has a partial advantage over Ba, based on the ability to signifi- cantly enhance coercivity (H c ). Ma et al [10] reported on the structure of copper sub- stituted in BaFeO 3 by up to 25%, which was cubic, as seen in similar previous work [11] with Ba 0.5 Sr 0.5 FeO 3 . The doping of A-site or B-site leads to varying impacts on the properties of perovskite oxide. For example, substitution at the A-site [12] causes increased oxygen deficiency, fol- lowed by a transition from the p-type semiconductor to semi-metallic. Conversely, the B-site substitution occurs with ions having an OS lower than 4?, where the oxygen vacancy forms and is further stabilized by holes in the oxygen sublattice [13]. Moreover, copper is categorized as a transition metal with 3d subshells and is expected to affect both magnetic and electrical properties, hence its substitu- tion in the B-site leads to similar modifications in local structure. Lu et al [14] reported on the ability of copper to Bull Mater Sci (2020) 43:152 Ó Indian Academy of Sciences https://doi.org/10.1007/s12034-020-02140-4
Transcript of Local structure analysis of BO6 (B = Fe, Cu) octahedron ...
Local structure analysis of BO6 (B = Fe, Cu) octahedron correlatedwith the magnetic properties of Cu-doped Ba0.5Sr0.5FeO3–d
F FITRIANA1, M ZAINURI1, M A BAQIYA1, M KATO2, P KIDKHUNTHOD3
and S SUASMORO1,*1 Department of Physics, Institute of Technology ‘Sepuluh Nopember’ Surabaya, Kampus ITS Sukolilo, Surabaya 60111,
Indonesia2 Department of Applied Physics, Tohoku University, 6-6-05, Aoba, Aramaki, Aoba-ku, Sendai 980-8579, Japan3 Synchroton Light Research Institute (Public Organization), Nakhon Ratchasima 30000, Thailand
*Author for correspondence ([email protected])
MS received 17 December 2019; accepted 10 May 2020
Abstract. Perovskite-based Ba0.5Sr0.5Fe1–xCuxO3–d (BSFCO-x, x = 0–0.2) was synthesized by sol–gel self-combustion
method. The crystallinity was evaluated through X-ray diffraction, besides further local structure analysis, using X-ray
absorption spectroscopy (XAS) showed a cubic symmetry for x = 0.05; 0.10, which was tetragonal at higher values, x =
0.15; 0.20. XAS analysis predicted the oxidation state (OS) of Cu to be a mixture of 3? and 2?, while Fe includes 3? and
4?. Conversely, the OS of Fe and Cu in the octahedron site influence the number of an unpair electron that determine the
magnetic properties of perovskite. In addition, the magnetization for Ba0.5Sr0.5FeO3–d is 0.172 emu g-1, originating from
the ferromagnetic ordering Fe3?(t2g3 eg
2)–O (2p)–Fe4?(t2g3 eg
1) interaction. This effect increase, due to the presence of oxygen
vacancy in BSFCO-0.05, which weakens the d–p interaction of Fe-O, while the generation of higher Cu doping to increase
the amount of Fe4? leads to a decline in Cu3?. Therefore, Cu doping is confirmed to play a role in the paramagnetic–
ferromagnetic transition.
Keywords. Perovskite; local structure; oxidation state; magnetic material.
1. Introduction
Perovskite ABO3-doped material has attracted attention
because of the remarkable versatile properties, including
electronic transport, ferroelectric, photoelectric, and mag-
netic properties [1,2]. For example, BaTiO3-based per-
ovskite has been adopted in capacitance, CH3NH3PbI3 for
solar cell, and colossal magnetoresistance for magnetic
application in the manganese-based perovskite (LaMnO3).
In addition, Mn and Co-based perovskites are widely
investigated as magnetic materials, although others,
including Co, Fe are also important (BiFeO3, LaCoO3) [3].
Perovskite oxide materials are usually multimorphemic
in structures, distorted from ideal cubic nature to
orthorhombic or tetragonal by temperature effect or the use
of doping materials [4]. The magnetic properties are gen-
erally related to the unpair electron in 3d-subshell of the B-
site [5]. This characteristic, alongside electronic behaviours
of the high spin d5 (t2g, eg) transition-metal, has long cap-
tivated investigative interests [5]. Iron-based oxides possess
fascinating properties, which is due to the variation in the
oxidation states (OS) of Fe, at ?2, ?3, ?4 [6], giving rise to
the distortion of crystal structures and stoichiometries. Also,
BaFeO3–d is considered to be a representative of an
exceptional class of perovskite oxides AFeO3–d (A = Ca, Sr,
Ba), featuring iron in the valence state of Fe4?/Fe3?. The
interaction of Fe-O-Fe is assumed to be ferromagnetic or
antiferromagnetic, depending on the presence of double or
super exchange spins. Studies on M–H hysteresis [7–9] of
(Ba, Sr)FeO3 showed magnetic moments that were rela-
tively smaller than BaFeO3. However, substituting Sr has a
partial advantage over Ba, based on the ability to signifi-
cantly enhance coercivity (Hc).
Ma et al [10] reported on the structure of copper sub-
stituted in BaFeO3 by up to 25%, which was cubic, as seen
in similar previous work [11] with Ba0.5Sr0.5FeO3. The
doping of A-site or B-site leads to varying impacts on the
properties of perovskite oxide. For example, substitution at
the A-site [12] causes increased oxygen deficiency, fol-
lowed by a transition from the p-type semiconductor to
semi-metallic. Conversely, the B-site substitution occurs
with ions having an OS lower than 4?, where the oxygen
vacancy forms and is further stabilized by holes in the
oxygen sublattice [13]. Moreover, copper is categorized as a
transition metal with 3d subshells and is expected to affect
both magnetic and electrical properties, hence its substitu-
tion in the B-site leads to similar modifications in local
structure. Lu et al [14] reported on the ability of copper to
Bull Mater Sci (2020) 43:152 � Indian Academy of Scienceshttps://doi.org/10.1007/s12034-020-02140-4Sadhana(0123456789().,-volV)FT3](0123456789().,-volV)
improve the electrochemical performance of cobalt-free
Pr1–xSrxFe1–yCuyO3–d, therefore further studies on the
magnetic properties of Cu-doped AFe1–xCuxO3–d is imper-
ative. This present investigation involves the synthesis and
characterization of perovskite oxide, with the composition
Ba0.5Sr0.5Fe1–xCuxO3–d. Furthermore, the effects of Cu
doping on the local structure, as well as the magnetic
properties of the sample are systematically investigated and
evaluated to improve knowledge.
2. Experimental
The synthesis of single-phase Ba0.5Sr0.5Fe1–xCuxO3–d was
performed using a sol–gel self-combustion method. The
BSFCO-x precursors were ground, followed by the sub-
jection to calcination at 850�C for 6 h and sintering at
1100�C for 6 h in air, subsequently creating the perovskite
oxide, then was verified by X-ray diffraction (XRD). Fur-
thermore, the local aspects of (Fe/Cu) ion in octahedron
BO6 sites were determined using X-ray absorption spec-
troscopy (XAS) experiments for Cu K-edge and Fe K-edge.
This was performed at SUT-NANOTECH-SLRI XAS (BL
5.2) [15], with electron energy: 1.2 GeV; bending magnet:
beam current 80–150 mA; 1.1 to 1.7 9 1011 photon s-1 in
fluorescence mode with 4-element silicon detector. Fur-
thermore, extended X-ray absorption fine structure
(EXAFS) spectroscopy was used to determine the local
structure, using the Athena and Artemis software [16].
The oxygen non-stoichiometries (3–d) of the samples
were determined by iodometric titration at room tempera-
ture. Therefore, a typical titration measurement required the
dissolution of approximately 27 mg of perovskite powders
mixed with KI into HCl solution (37%). Subsequently, the
fully dissolved sample was titrated by dilute standardized
thiosulphate (S2O32–), the processes was under Argon gas.
The magnetization vs. magnetic field of sample powder
was measured using Magnetic Property Measurement Sys-
tem (Quantum Design MPMS-0000) with superconducting
quantum interference devices (SQUID) Magnetometer at
300 K, with the intensity variation at –1 T B H B ?1 T.
3. Results and discussion
3.1 Local structure analysis
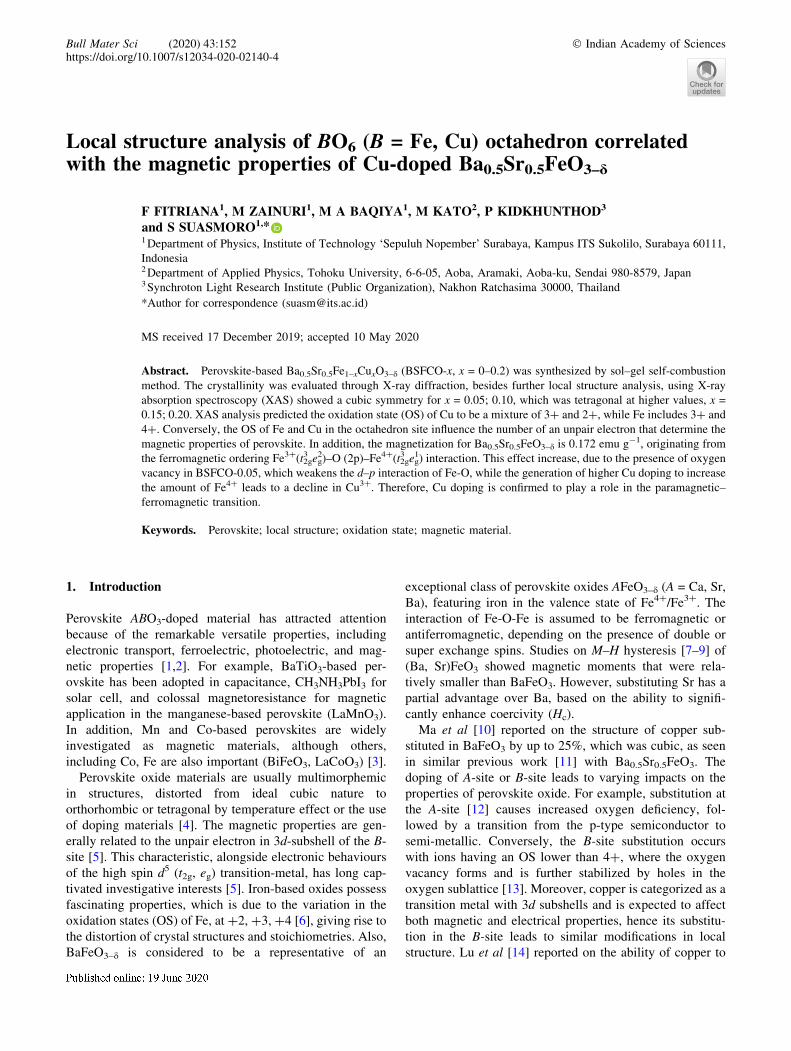
3.1a EXAFS analysis. Figure 1 presents XRD pattern of
BSF and 20 mol% Cu-doped BSF, both show a typical XRD
pattern of perovskite structure, indicating that copper
dissolves entirely in the BSF matrix. Though there is a
slight shift of diffraction peaks for BSFCO-0.2 to a smaller
diffraction angle, however, this signifies a modification that
took place in the environment of the BO6 octahedron after
Cu substitute Fe in B-site. Further detailed EXAFS analysis
was carried out to explore the local arrangement
surrounding Fe/Cu.
The standard EXAFS data analysis for structure factor is
generally described through equation [17]:
v kð Þ ¼X
j
S20Nj
kR2j
f effj k;Rj
� �������
sin 2kRj þ uijðkÞ� �
e�2r2j k
2
e�2Rj=kðkÞ;
where the summation goes over all paths j, Nj is the coor-
dination number, S02 denotes the amplitude reduction factor,
f effj is the curved-wave scattering amplitude, Rj depicts the
path length, k(k) is the electron mean path, r(k) the Debye–
Waller factor and u(k) accounts for the total phase shift. In
principle, obtaining the correct geometrical configuration
around the absorber atom leads to higher accuracy in fitting
structural parameters, including path length and coordina-
tion number.
EXAFS analysis of BSFCO-x samples uses an interactive
program called the IFEFFIT package [16], characterized by
background subtraction in the pre-edge and post-edge
regions. This generates a spline curve above the threshold
energy, while the oscillation is extracted by subtracting the
spline from the spectra, and the ATHENA program is
subsequently used to normalize the remaining. Furthermore,
to identify the structure around the substituted copper, the
EXAFS spectroscopy was performed on the Cu K-edge. The
fitting of EXAFS was performed in the k-space between 2
and 8 A-1, using the model structure BaFeO3 (Pm-3m/221)
for x = 0.04; 0.10, while BaTiO3 (P4mm/99) was used for
x = 0.15; 0.2, between 3 and 10.5 A-1. This structure model
was obtained, considering previous XRD results [11].
During the fitting process, path length R, Debye–Waller
factor r2, threshold energy E0 and amplitude-reduced factor
S02 parameters were taken as variables. Figure 2 shows the
Figure 1. XRD pattern of BSF and BSFCO-0.2.
152 Page 2 of 9 Bull Mater Sci (2020) 43:152
second-order k-weighted EXAFS functions, k2v(k), and the
best-fit curves for all samples.
Fourier transformation (FT) is used to obtain the real
space picture of EXAFS spectra ~v Rð Þ, as implemented in
the IFEFFIT package. This evaluation involves the appli-
cation of structural factors in the equation below [18]:
~v Rð Þ ¼ 1ffiffiffiffiffiffi2p
pZ 1
0
k2v kð ÞW kð Þei2kRdk: ð2Þ
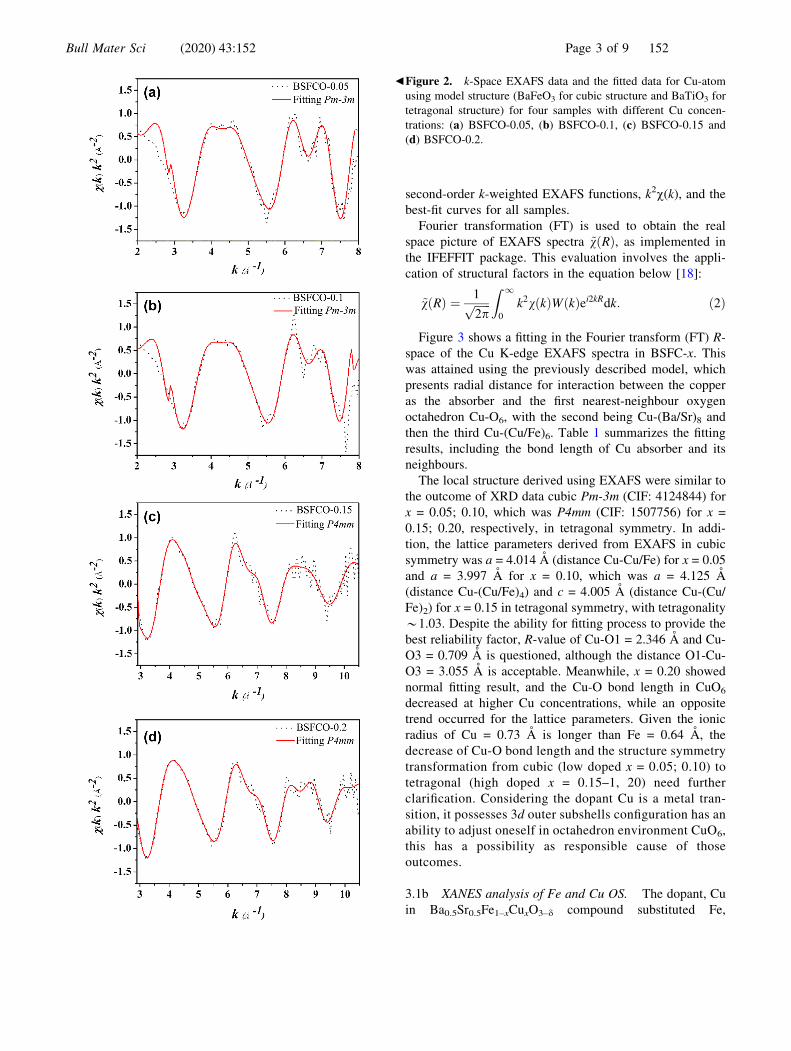
Figure 3 shows a fitting in the Fourier transform (FT) R-
space of the Cu K-edge EXAFS spectra in BSFC-x. This
was attained using the previously described model, which
presents radial distance for interaction between the copper
as the absorber and the first nearest-neighbour oxygen
octahedron Cu-O6, with the second being Cu-(Ba/Sr)8 and
then the third Cu-(Cu/Fe)6. Table 1 summarizes the fitting
results, including the bond length of Cu absorber and its
neighbours.
The local structure derived using EXAFS were similar to
the outcome of XRD data cubic Pm-3m (CIF: 4124844) for
x = 0.05; 0.10, which was P4mm (CIF: 1507756) for x =
0.15; 0.20, respectively, in tetragonal symmetry. In addi-
tion, the lattice parameters derived from EXAFS in cubic
symmetry was a = 4.014 A (distance Cu-Cu/Fe) for x = 0.05
and a = 3.997 A for x = 0.10, which was a = 4.125 A
(distance Cu-(Cu/Fe)4) and c = 4.005 A (distance Cu-(Cu/
Fe)2) for x = 0.15 in tetragonal symmetry, with tetragonality
*1.03. Despite the ability for fitting process to provide the
best reliability factor, R-value of Cu-O1 = 2.346 A and Cu-
O3 = 0.709 A is questioned, although the distance O1-Cu-
O3 = 3.055 A is acceptable. Meanwhile, x = 0.20 showed
normal fitting result, and the Cu-O bond length in CuO6
decreased at higher Cu concentrations, while an opposite
trend occurred for the lattice parameters. Given the ionic
radius of Cu = 0.73 A is longer than Fe = 0.64 A, the
decrease of Cu-O bond length and the structure symmetry
transformation from cubic (low doped x = 0.05; 0.10) to
tetragonal (high doped x = 0.15–1, 20) need further
clarification. Considering the dopant Cu is a metal tran-
sition, it possesses 3d outer subshells configuration has an
ability to adjust oneself in octahedron environment CuO6,
this has a possibility as responsible cause of those
outcomes.
3.1b XANES analysis of Fe and Cu OS. The dopant, Cu
in Ba0.5Sr0.5Fe1–xCuxO3–d compound substituted Fe,
bFigure 2. k-Space EXAFS data and the fitted data for Cu-atom
using model structure (BaFeO3 for cubic structure and BaTiO3 for
tetragonal structure) for four samples with different Cu concen-
trations: (a) BSFCO-0.05, (b) BSFCO-0.1, (c) BSFCO-0.15 and
(d) BSFCO-0.2.
Bull Mater Sci (2020) 43:152 Page 3 of 9 152
characterized by cubic symmetry, as described in the
previous analysis, for x = 0–0.10, while x = 0.15; 0.20 were
tetragonal. The succeeding X-ray absorption near-edge
structure (XANES) analysis on Fe K-edge was obtained on
x = 0, 0.10 and 0.20 representing structural symmetry. The
fitted curves using a Gaussian function approach are
presented in figure 4a and b, where Fe2O3 was used for
comparison. In this compound (Fe2O3), there are three
regions distinguished. The region I (7110–7120 eV) relates
to pre-edge absorption features 1s ? 3d transition, this
transition is formally electric dipole forbidden due to
centrosymmetric octahedron site, but gains intensity
through the allowed electric quadrupole transitions. The
region II (7120–7126 eV) formally has no transition,
although there is an experimental appearance of Fe2O3,
demonstrating the shoulder peaks resulting of the transition
3d-4s-4p mixing orbitals, as addressed by Chen et al [19].
Finally, the region III (7126–7135 eV) shows that the
maximum absorption relates to dipole transition 1s-4p,
bFigure 3. R-Space EXAFS data and the fitted data for Cu-atom
using model structure (BaFeO3 for cubic structure and BaTiO3 for
tetragonal structure) for four samples with different Cu concen-
trations: (a) BSFCO-0.05, (b) BSFCO-0.1, (c) BSFCO-0.15 and
(d) BSFCO-0.2.
Table 1. Fit Fourier transform (FFT)-derived interatomic dis-
tance from Cu core absorber to its neighbours using a model cubic
Pm-3m symmetry for BSFCO-0.05 and BSFCO-0.1 and a model
tetragonal P4mm symmetry for BSFCO-0.15 and BSFCO-0.2.
Shell N
Cubic symmetry
BSFCO-0.05 BSFCO-0.1
R (A) S02 r2 (A) R (A) S0
2 r2 (A)
Cu-O 6 1.907 0.540 0.004 1.894 0.524 0.001
Cu-Ba/Sr 8 3.344 0.540 0.008 3.321 0.524 0.009
Cu-Cu/Fe 6 4.014 0.540 0.001 3.997 0.524 0.004
Shell N
Tetragonal symmetry
BSFCO-0.15 BSFCO-0.2
R (A) S02 r2 (A) R (A) S0
2 r2 (A)
Cu-O1 1 2.346 0.725 0.017 1.754 0.742 0.001
Cu-O2 4 1.936 0.725 0.002 1.932 0.742 0.001
Cu-O3 1 0.709 0.725 0.003 1.526 0.742 0.011
Cu-Ba/Sr 1 4 4.148 0.725 0.024 3.247 0.742 0.030
Cu-Ba/Sr 2 4 3.294 0.725 0.013 3.340 0.742 0.016
Cu-Cu/Fe 1 4 4.125 0.725 0.019 3.977 0.742 0.007
Cu-Cu/Fe 2 2 4.005 0.725 0.014 4.176 0.742 0.013
152 Page 4 of 9 Bull Mater Sci (2020) 43:152
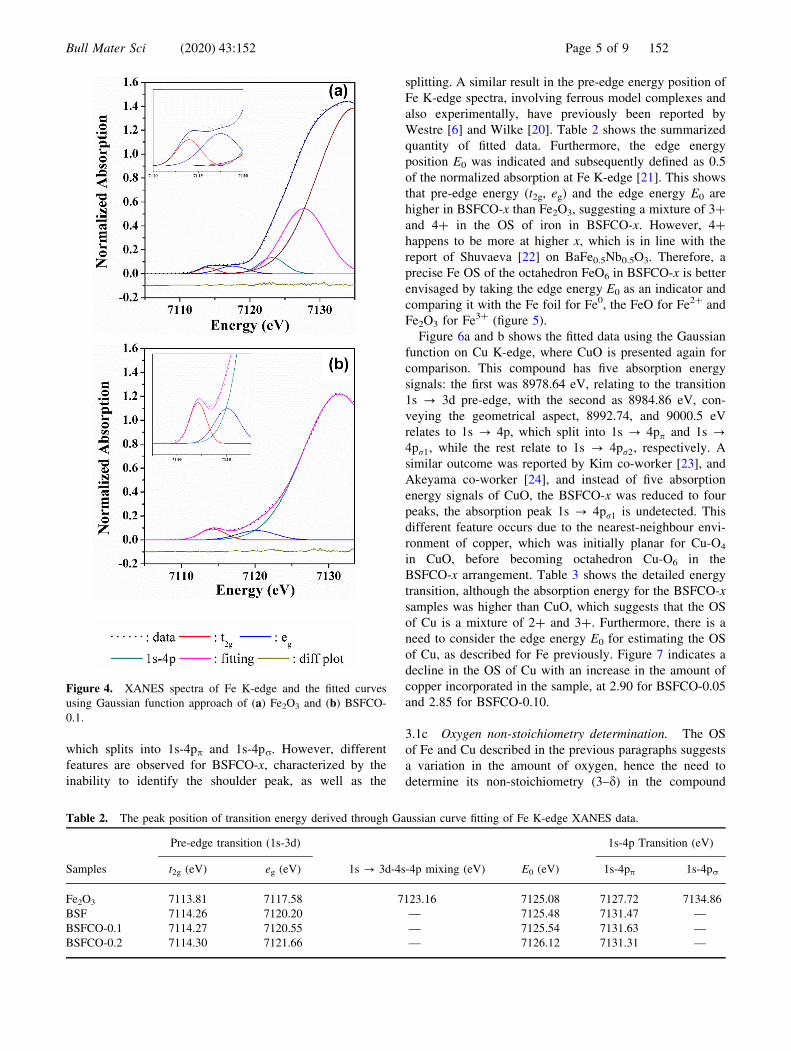
which splits into 1s-4pp and 1s-4pr. However, different
features are observed for BSFCO-x, characterized by the
inability to identify the shoulder peak, as well as the
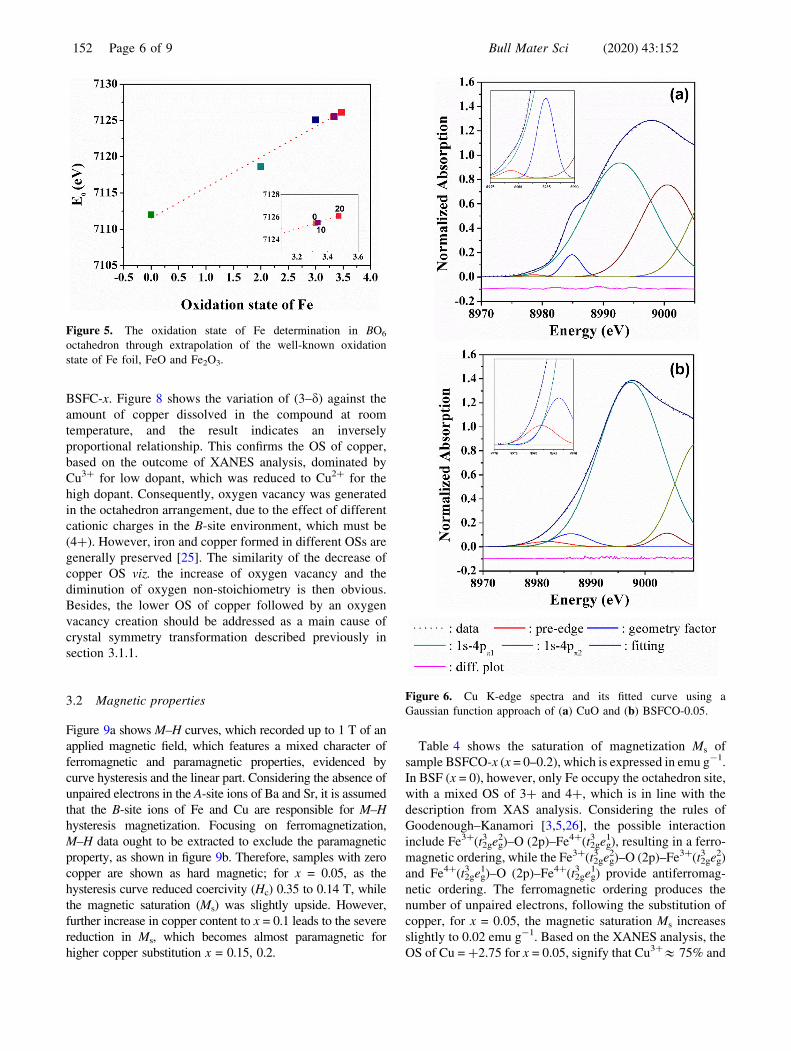
splitting. A similar result in the pre-edge energy position of
Fe K-edge spectra, involving ferrous model complexes and
also experimentally, have previously been reported by
Westre [6] and Wilke [20]. Table 2 shows the summarized
quantity of fitted data. Furthermore, the edge energy
position E0 was indicated and subsequently defined as 0.5
of the normalized absorption at Fe K-edge [21]. This shows
that pre-edge energy (t2g, eg) and the edge energy E0 are
higher in BSFCO-x than Fe2O3, suggesting a mixture of 3?
and 4? in the OS of iron in BSFCO-x. However, 4?
happens to be more at higher x, which is in line with the
report of Shuvaeva [22] on BaFe0.5Nb0.5O3. Therefore, a
precise Fe OS of the octahedron FeO6 in BSFCO-x is better
envisaged by taking the edge energy E0 as an indicator and
comparing it with the Fe foil for Fe0, the FeO for Fe2? and
Fe2O3 for Fe3? (figure 5).
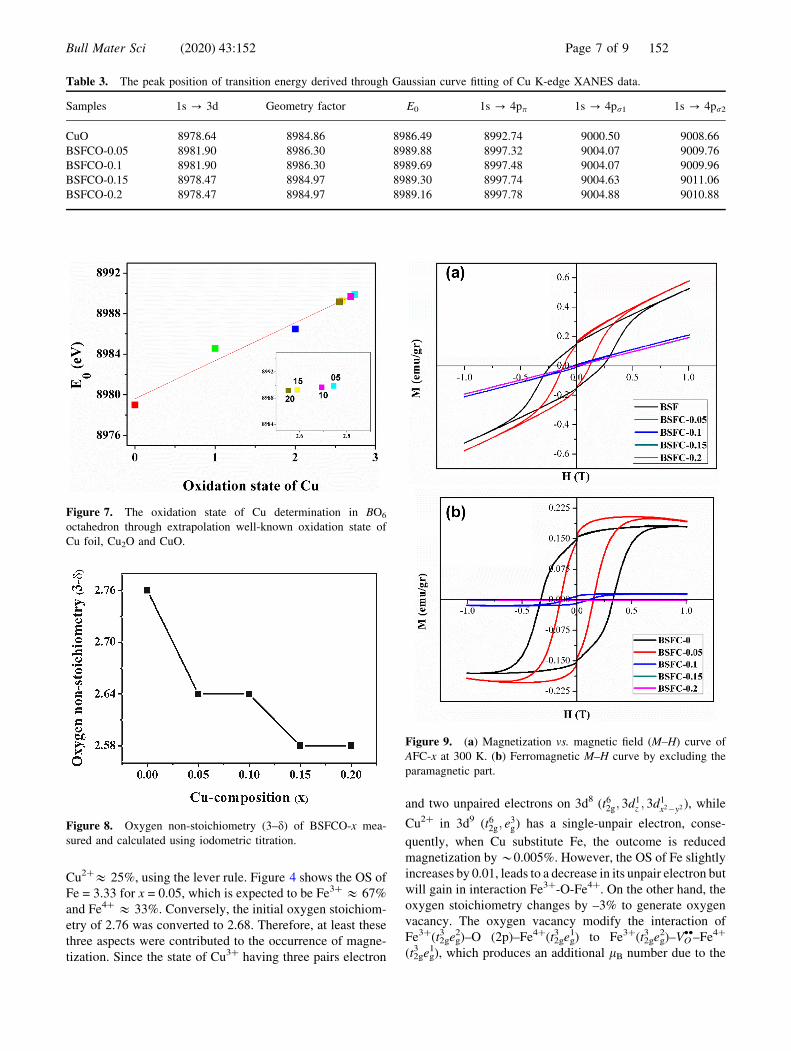
Figure 6a and b shows the fitted data using the Gaussian
function on Cu K-edge, where CuO is presented again for
comparison. This compound has five absorption energy
signals: the first was 8978.64 eV, relating to the transition
1s ? 3d pre-edge, with the second as 8984.86 eV, con-
veying the geometrical aspect, 8992.74, and 9000.5 eV
relates to 1s ? 4p, which split into 1s ? 4pp and 1s ?4pr1, while the rest relate to 1s ? 4pr2, respectively. A
similar outcome was reported by Kim co-worker [23], and
Akeyama co-worker [24], and instead of five absorption
energy signals of CuO, the BSFCO-x was reduced to four
peaks, the absorption peak 1s ? 4pr1 is undetected. This
different feature occurs due to the nearest-neighbour envi-
ronment of copper, which was initially planar for Cu-O4
in CuO, before becoming octahedron Cu-O6 in the
BSFCO-x arrangement. Table 3 shows the detailed energy
transition, although the absorption energy for the BSFCO-x
samples was higher than CuO, which suggests that the OS
of Cu is a mixture of 2? and 3?. Furthermore, there is a
need to consider the edge energy E0 for estimating the OS
of Cu, as described for Fe previously. Figure 7 indicates a
decline in the OS of Cu with an increase in the amount of
copper incorporated in the sample, at 2.90 for BSFCO-0.05
and 2.85 for BSFCO-0.10.
3.1c Oxygen non-stoichiometry determination. The OS
of Fe and Cu described in the previous paragraphs suggests
a variation in the amount of oxygen, hence the need to
determine its non-stoichiometry (3–d) in the compound
Figure 4. XANES spectra of Fe K-edge and the fitted curves
using Gaussian function approach of (a) Fe2O3 and (b) BSFCO-
0.1.
Table 2. The peak position of transition energy derived through Gaussian curve fitting of Fe K-edge XANES data.
Samples
Pre-edge transition (1s-3d)
1s ? 3d-4s-4p mixing (eV) E0 (eV)
1s-4p Transition (eV)
t2g (eV) eg (eV) 1s-4pp 1s-4pr
Fe2O3 7113.81 7117.58 7123.16 7125.08 7127.72 7134.86
BSF 7114.26 7120.20 — 7125.48 7131.47 —
BSFCO-0.1 7114.27 7120.55 — 7125.54 7131.63 —
BSFCO-0.2 7114.30 7121.66 — 7126.12 7131.31 —
Bull Mater Sci (2020) 43:152 Page 5 of 9 152
BSFC-x. Figure 8 shows the variation of (3–d) against the
amount of copper dissolved in the compound at room
temperature, and the result indicates an inversely
proportional relationship. This confirms the OS of copper,
based on the outcome of XANES analysis, dominated by
Cu3? for low dopant, which was reduced to Cu2? for the
high dopant. Consequently, oxygen vacancy was generated
in the octahedron arrangement, due to the effect of different
cationic charges in the B-site environment, which must be
(4?). However, iron and copper formed in different OSs are
generally preserved [25]. The similarity of the decrease of
copper OS viz. the increase of oxygen vacancy and the
diminution of oxygen non-stoichiometry is then obvious.
Besides, the lower OS of copper followed by an oxygen
vacancy creation should be addressed as a main cause of
crystal symmetry transformation described previously in
section 3.1.1.
3.2 Magnetic properties
Figure 9a shows M–H curves, which recorded up to 1 T of an
applied magnetic field, which features a mixed character of
ferromagnetic and paramagnetic properties, evidenced by
curve hysteresis and the linear part. Considering the absence of
unpaired electrons in the A-site ions of Ba and Sr, it is assumed
that the B-site ions of Fe and Cu are responsible for M–H
hysteresis magnetization. Focusing on ferromagnetization,
M–H data ought to be extracted to exclude the paramagnetic
property, as shown in figure 9b. Therefore, samples with zero
copper are shown as hard magnetic; for x = 0.05, as the
hysteresis curve reduced coercivity (Hc) 0.35 to 0.14 T, while
the magnetic saturation (Ms) was slightly upside. However,
further increase in copper content to x = 0.1 leads to the severe
reduction in Ms, which becomes almost paramagnetic for
higher copper substitution x = 0.15, 0.2.
Table 4 shows the saturation of magnetization Ms of
sample BSFCO-x (x = 0–0.2), which is expressed in emu g-1.
In BSF (x = 0), however, only Fe occupy the octahedron site,
with a mixed OS of 3? and 4?, which is in line with the
description from XAS analysis. Considering the rules of
Goodenough–Kanamori [3,5,26], the possible interaction
include Fe3?(t2g3 eg
2)–O (2p)–Fe4?(t2g3 eg
1), resulting in a ferro-
magnetic ordering, while the Fe3?(t2g3 eg
2)–O (2p)–Fe3?(t2g3 eg
2)
and Fe4?(t2g3 eg
1)–O (2p)–Fe4?(t2g3 eg
1) provide antiferromag-
netic ordering. The ferromagnetic ordering produces the
number of unpaired electrons, following the substitution of
copper, for x = 0.05, the magnetic saturation Ms increases
slightly to 0.02 emu g-1. Based on the XANES analysis, the
OS of Cu = ?2.75 for x = 0.05, signify that Cu3?& 75% and
Figure 5. The oxidation state of Fe determination in BO6
octahedron through extrapolation of the well-known oxidation
state of Fe foil, FeO and Fe2O3.
Figure 6. Cu K-edge spectra and its fitted curve using a
Gaussian function approach of (a) CuO and (b) BSFCO-0.05.
152 Page 6 of 9 Bull Mater Sci (2020) 43:152
Cu2?& 25%, using the lever rule. Figure 4 shows the OS of
Fe = 3.33 for x = 0.05, which is expected to be Fe3? & 67%
and Fe4? & 33%. Conversely, the initial oxygen stoichiom-
etry of 2.76 was converted to 2.68. Therefore, at least these
three aspects were contributed to the occurrence of magne-
tization. Since the state of Cu3? having three pairs electron
and two unpaired electrons on 3d8 (t62g; 3d1z ; 3d1
x2�y2 ), while
Cu2? in 3d9 (t62g; e3g) has a single-unpair electron, conse-
quently, when Cu substitute Fe, the outcome is reduced
magnetization by *0.005%. However, the OS of Fe slightly
increases by 0.01, leads to a decrease in its unpair electron but
will gain in interaction Fe3?-O-Fe4?. On the other hand, the
oxygen stoichiometry changes by –3% to generate oxygen
vacancy. The oxygen vacancy modify the interaction of
Fe3?(t2g3 eg
2)–O (2p)–Fe4?(t2g3 eg
1) to Fe3?(t2g3 eg
2)–VO••–Fe4?
(t2g3 eg
1), which produces an additional lB number due to the
Table 3. The peak position of transition energy derived through Gaussian curve fitting of Cu K-edge XANES data.
Samples 1s ? 3d Geometry factor E0 1s ? 4pp 1s ? 4pr1 1s ? 4pr2
CuO 8978.64 8984.86 8986.49 8992.74 9000.50 9008.66
BSFCO-0.05 8981.90 8986.30 8989.88 8997.32 9004.07 9009.76
BSFCO-0.1 8981.90 8986.30 8989.69 8997.48 9004.07 9009.96
BSFCO-0.15 8978.47 8984.97 8989.30 8997.74 9004.63 9011.06
BSFCO-0.2 8978.47 8984.97 8989.16 8997.78 9004.88 9010.88
Figure 7. The oxidation state of Cu determination in BO6
octahedron through extrapolation well-known oxidation state of
Cu foil, Cu2O and CuO.
Figure 8. Oxygen non-stoichiometry (3–d) of BSFCO-x mea-
sured and calculated using iodometric titration.
Figure 9. (a) Magnetization vs. magnetic field (M–H) curve of
AFC-x at 300 K. (b) Ferromagnetic M–H curve by excluding the
paramagnetic part.
Bull Mater Sci (2020) 43:152 Page 7 of 9 152
disappearance of the d–p interaction of Fe-O. Hence, the
slight upside of the magnetic saturation should be addressed,
caused mainly by oxygen vacancy. Moreover, the presence of
copper softens magnetization.
An increase in Cu to x = 0.1 leads to a consistent sig-
nificant decline in magnetization (&–92%), up to unde-
tectable levels for higher x. Based on the XAS analysis,
there is an increase in the OS of Fe in the B sites from
?3.32 for x = 0 to ?3.34 for x = 0.1, and ?3.47 for x = 0.2,
accordingly. Hence, Fe3? is assumed to decrease, while
Fe4? increases, consequently promoting antiferromagnetic
ordering Fe4?(t2g3 eg
1)–O (2p)–Fe4?(t2g3 eg
1), while magnetic
saturation (Ms) reduces. The OS of Cu was ?2.69 for x =
0.1, and ?2.55 for x = 0.2, indicating Cu3? & 69% and
Cu2? & 31% for x = 0.1, while Cu3? & 55% and Cu2? &45% for x = 0.2. This led to a shift from 3d8
(t62g; 3d1z ; 3d1
x2�y2 ) ? 3d9 (t62g; e3g), implying a decline in
magnetization, while the oxygen content 2.68 for x = 0.1,
which is almost similar to x = 0.05 then drops to 2.56 for
x C 0.15. Therefore, these three aspects collectively reduced
magnetization saturation Ms by –92%, and vanish for x C
0.15. Also, Cu was deduced at this point to play a role in the
paramagnetic–ferromagnetic transition.
4. Conclusions
The local structure and magnetic properties of Cu-doped
Ba0.5Sr0.5FeO3–d were studied. EXAFS analysis showed the
presence of cubic symmetry at the composition range 0 B
x B 0.1, which was tetragonal for 0.15 B x B 0.2. Besides,
evaluation using XANES confirmed the OS of Cu to be a
mixture of 3? and 2?, which was a combination of 3? and
4? for Fe. This valence composition impacts on the mag-
netic properties of BSFCO-x, as SQUIDS measurement
showed a mix of paramagnetic and ferromagnetic charac-
teristics. In addition, the magnetization on BSF was origi-
nated by the interaction Fe3?(t2g3 eg
2)–O (2p)–Fe4?(t2g3 eg
1) of
adjoining BO6 octahedron. The oxygen vacancy is advan-
tageous in the aspect of increased magnetization, which
modifies the interaction of Fe3?(t2g3 eg
2)–O (2p)–Fe4?(t2g3 eg
1)
to Fe3?(t2g3 eg
2)–VO••–Fe4?(t2g
3 eg1). Higher Cu doping induced
to the higher OS of Fe, while Cu decreases, then made up an
antiferromagnetic ordering for high Cu doping (x C 0.1).
Acknowledgements
This research was financed by the Indonesian Ministry of
Research and Higher Education through the PMDSU
program. We would like to thank the SUT-NANOTEC-
SLRI joint research facility for synchrotron utilization,
Thailand, for XAS beamtime. Also, Low-Temperature
Physics and Superconductivity Laboratory, for SQUID
measurement, Department of Applied Physics, Tohoku
University, Japan.
References
[1] Djurisic A B, Liu F Z, Tam H W, Wong M K, Ng A, Surya C
et al 2017 Prog. Quantum Electron 53 1
[2] Sutherland B R and Sargent E H 2016 Nat. Photonics 10 295
[3] Kanamori J 1958 J. Phys. Chem. Solids 10 87
[4] Hayashi N, Yamamoto T, Kageyama H, Nishi M, Watanabe
Y, Kawakami T et al 2011 Angew. Chemie. 50 12547
[5] Goodenough B J 1958 J. Phys. Chem. Solids 6 287
[6] Westre T E, Kennepohl P, DeWitt J G, Hedman B, Hodgson
K O and Solomon E I 1997 J. Am. Chem. Soc. 119 6297
[7] Takeda Y 1992 J. Magn. Magn. Mater. 1 1973
[8] Chakraverty S, Matsuda T, Ogawa N, Wadati H, Ikenaga E
and Kawasaki M 2013 Appl. Phys. Lett. 142416 1
[9] Hong N H, Kanoun M B, Kim J, Atabaev T S, Konishi K,
Noguchi S et al 2018 J. Phys. Chem. C 122 2983
[10] Ma Z, Yin J, Yin Y, Lu J, Zhang C and Nguyen M 2014 J.
Phys. Chem. C 44
[11] Fitriana F, Anjarwati D Z, Baity P S N and Suasmoro S 2018
IOP Conf. Ser. Mater. Sci. Eng. 395 3
[12] Dong F, Chen D, Chen Y, Zhao Q and Shao Z 2012 J. Mater.
Chem. 22 15071
[13] Kim D, Miyoshi S, Tsuchiya T and Yamaguchi S 2014
Chem. Mater. 26 927
[14] Lu Y, Zhao H, Cheng X, Jia Y, Du X, Fang M et al 2015 J.
Mater. Chem. A 3 6202
[15] Kidkhunthod P 2017 Adv. Nat. Sci. Nanosci. Nanotechnol. 8035007
[16] Ravel B and Newville M 2005 J. Synchrotron Radiat. 12 537
[17] Prasoetsopha N, Pinitsoontorn S, Bootchanont A, Kid-
khunthod P, Srepusharawoot P, Kamwanna T et al 2013 J.
Solid State Chem. 204 257
[18] Tongraar A, Thienprasert J T, Rujirawat S and Limpijum-
nong S 2010 Phys. Chem. Chem. Phys. 12 10876
[19] Chen L X, Liu T, Thurnauer M C, Csencsits R and Rajh T
2002 J. Phys. Chem. B 106 8539
Table 4. Magnetic behaviour, coercivity (Hc), remanence (Mr) and saturation magnetization (Ms) of BSFCO-x samples.
Samples Magnetic behaviour Coercivity, Hc (T) Remanence, Mr (emu g-1) Saturation magnetization, Ms (emu g-1)
BSFCO-0.0 Ferro/Para 0.35 0.152 0.172
BSFCO-0.05 Ferro/Para 0.14 0.157 0.195
BSFCO-0.1 Ferro/Para 0.12 0.001 0.014
BSFCO-0.15 Para — — —
BSFCO-0.2 Para — — —
152 Page 8 of 9 Bull Mater Sci (2020) 43:152

[20] Wilke M, Farges F, Petit P E, Brown G E and Martin F 2001
Am. Mineral. 86 714
[21] Itoh T, Idemoto Y and Imai H 2018 J. Solid State Chem. 258702
[22] Shuvaeva V A, Raevski I P, Polozhentsev O E, Zubavichus
Y V, Vlasenko V G, Raevskaya S I et al 2017 Mater. Chem.
Phys. 193 260
[23] Choy J H, Kim D K, Hwang S H and Demazeau G 1994
Phys. Rev. B 50 16631
[24] Kuroda H, Akeyama K and Kosugi N 1993 Jpn. J. Appl.
Phys. 32 98
[25] Wang J, Lam K Y, Saccoccio M, Gao Y, Chen D and Ciucci
F 2016 J. Power Sources 324 224
[26] Goodenough J B 1995 Phys. Rev. 100 564
Bull Mater Sci (2020) 43:152 Page 9 of 9 152


![9 Interconnect Cu - Stanford University Cu Slides.pdfLow ρ (Resistivity) Me tal Ag Cu Au Al W BulkRes ivy[µΩ•cm] 1.63 1.67 2.35 2.67 5.6 Cu is the second best conducting element](https://static.fdocument.org/doc/165x107/5ac473af7f8b9a57528d29c4/9-interconnect-cu-stanford-university-cu-slidespdflow-resistivity-me-tal.jpg)


![Local function vs. local closure function · Local function vs. local closure function ... Let ˝be a topology on X. Then Cl (A) ... [Kuratowski 1933]. Local closure function](https://static.fdocument.org/doc/165x107/5afec8997f8b9a256b8d8ccd/local-function-vs-local-closure-function-vs-local-closure-function-let-be.jpg)