Linear Methods for Classification - Columbia Universitymadigan/DM08/linearClassification.ppt.pdf ·...
33
Linear Methods for Classification Based on Chapter 4 of Hastie, Tibshirani, and Friedman David Madigan
Transcript of Linear Methods for Classification - Columbia Universitymadigan/DM08/linearClassification.ppt.pdf ·...
Linear Methods for Classification
Based on Chapter 4 of Hastie, Tibshirani, and Friedman
David Madigan
Predictive ModelingGoal: learn a mapping: y = f(x;θ)
Need: 1. A model structure
2. A score function
3. An optimization strategy
Categorical y ∈ {c1,…,cm}: classification
Real-valued y: regression
Note: usually assume {c1,…,cm} are mutually exclusive andexhaustive
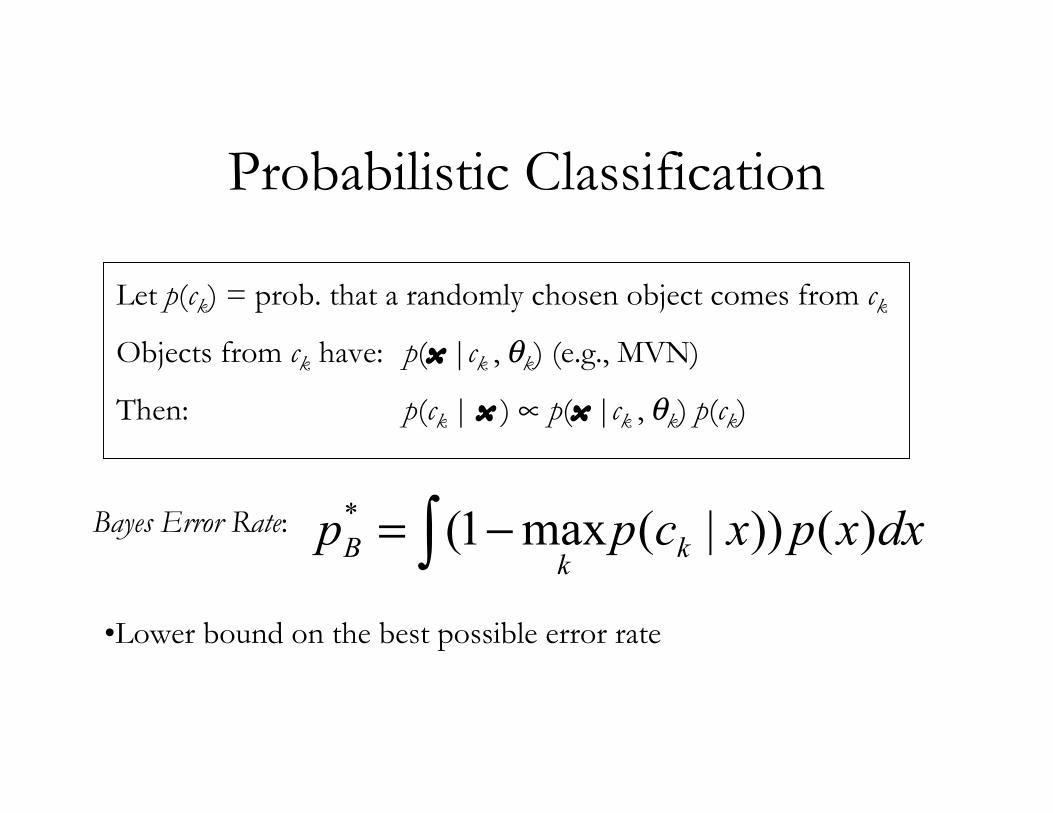
Probabilistic Classification
Let p(ck) = prob. that a randomly chosen object comes from ck
Objects from ck have: p(x |ck , θk) (e.g., MVN)
Then: p(ck | x ) ∝ p(x |ck , θk) p(ck)
Bayes Error Rate: dxxpxcpp kk
B )())|(max1(*
! "=
•Lower bound on the best possible error rate
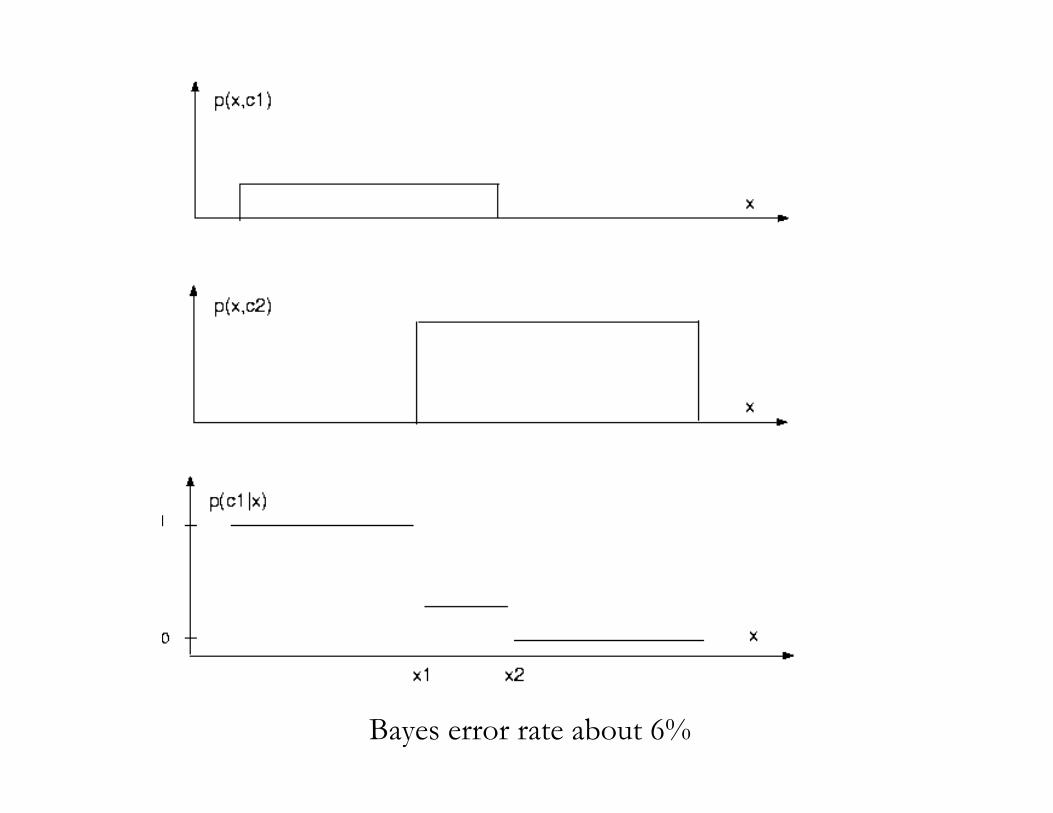
Bayes error rate about 6%
Classifier Types
Discriminative: model p(ck | x )
- e.g. logistic regression, CART
Generative: model p(x |ck , θk)
- e.g. “Bayesian classifiers”, LDA
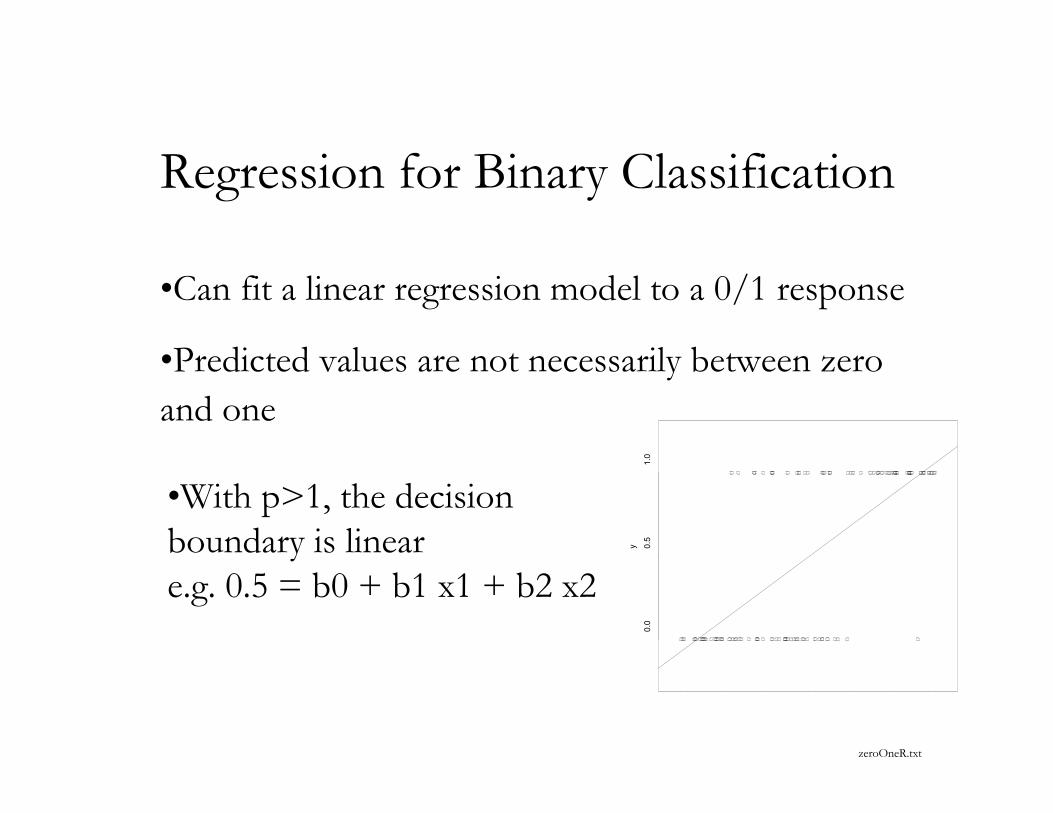
Regression for Binary Classification
•Can fit a linear regression model to a 0/1 response
•Predicted values are not necessarily between zeroand one
-3 -2 -1 0 1 2 3
0.0
0.5
1.0
x
y
zeroOneR.txt
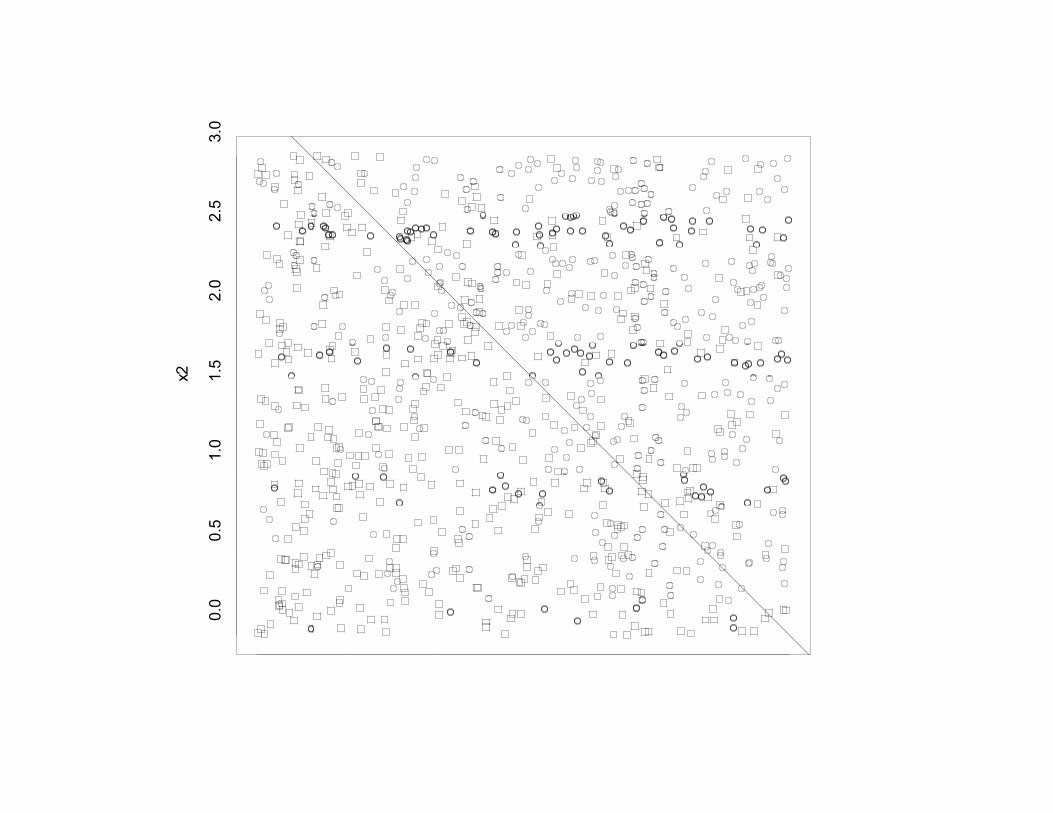
•With p>1, the decisionboundary is lineare.g. 0.5 = b0 + b1 x1 + b2 x2
0.0 0.5 1.0 1.5 2.0 2.5 3.0
0.0
0.5
1.0
1.5
2.0
2.5
3.0
x1
x2
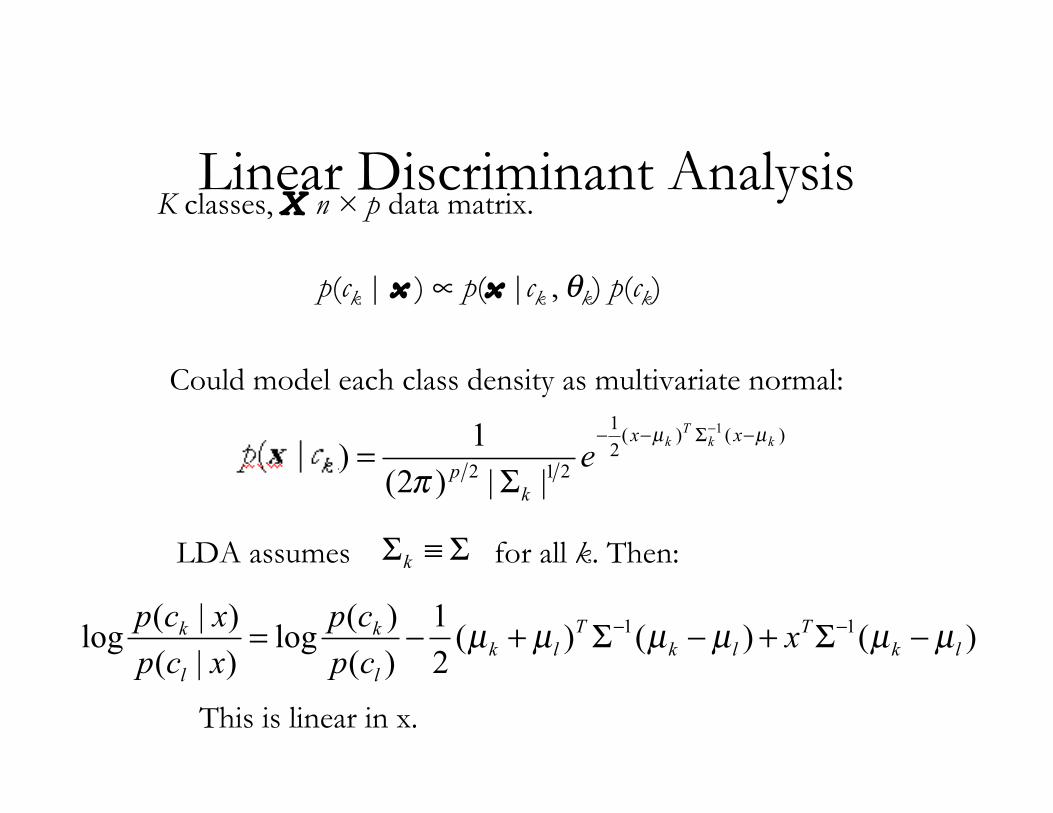
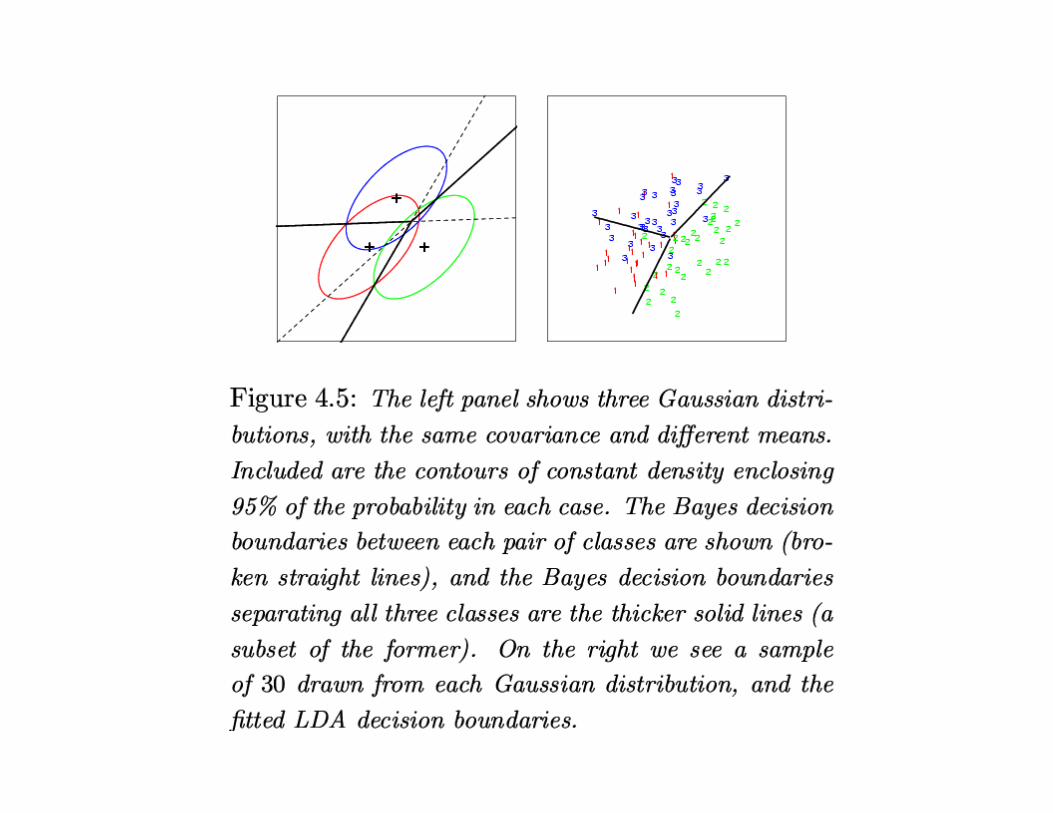
Linear Discriminant AnalysisK classes, X n × p data matrix.
p(ck | x ) ∝ p(x |ck , θk) p(ck)
Could model each class density as multivariate normal:
)()(2
1
212
1
||)2(
1)|(
kkT
k xx
k
pk excpµµ
!
"#"""
#=
LDA assumes for all k. Then:!"!k
)()()(2
1
)(
)(log
)|(
)|(log 11
lk
T
lk
T
lk
l
k
l
k xcp
cp
xcp
xcpµµµµµµ !"+!"+!=
!!
This is linear in x.
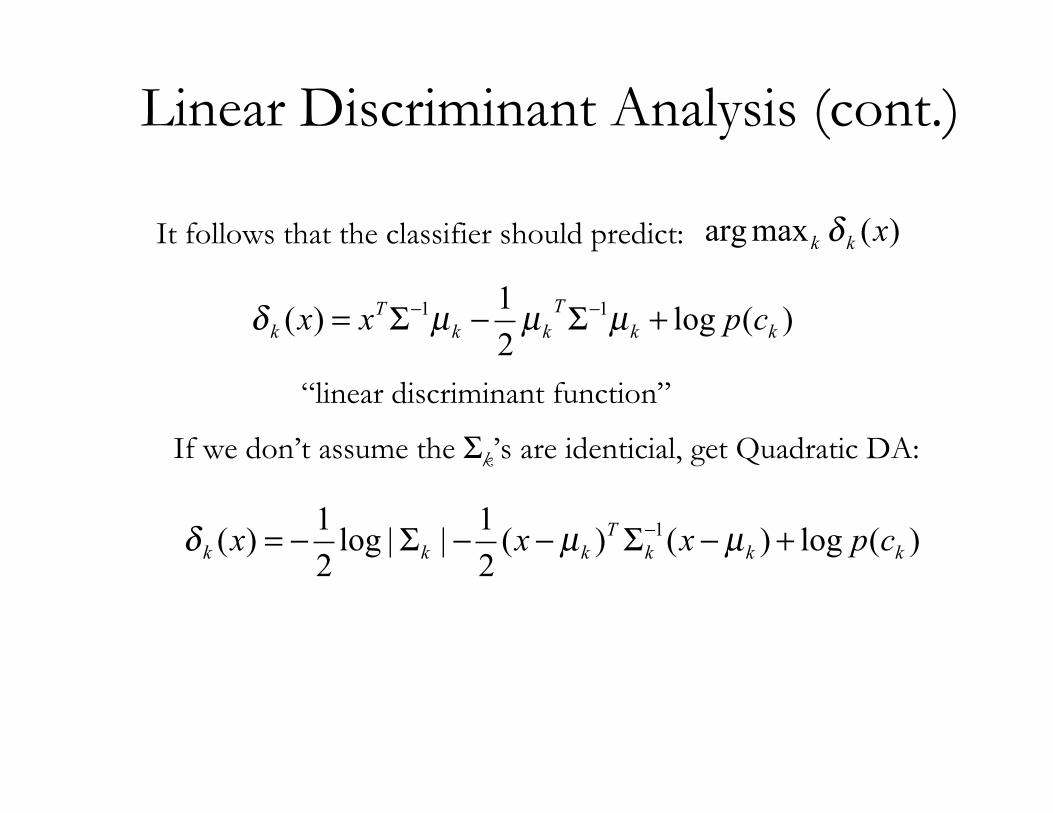
Linear Discriminant Analysis (cont.)
It follows that the classifier should predict: )(maxarg xkk
!
)(log2
1)( 11
kk
T
kk
T
k cpxx +!"!="" µµµ#
“linear discriminant function”
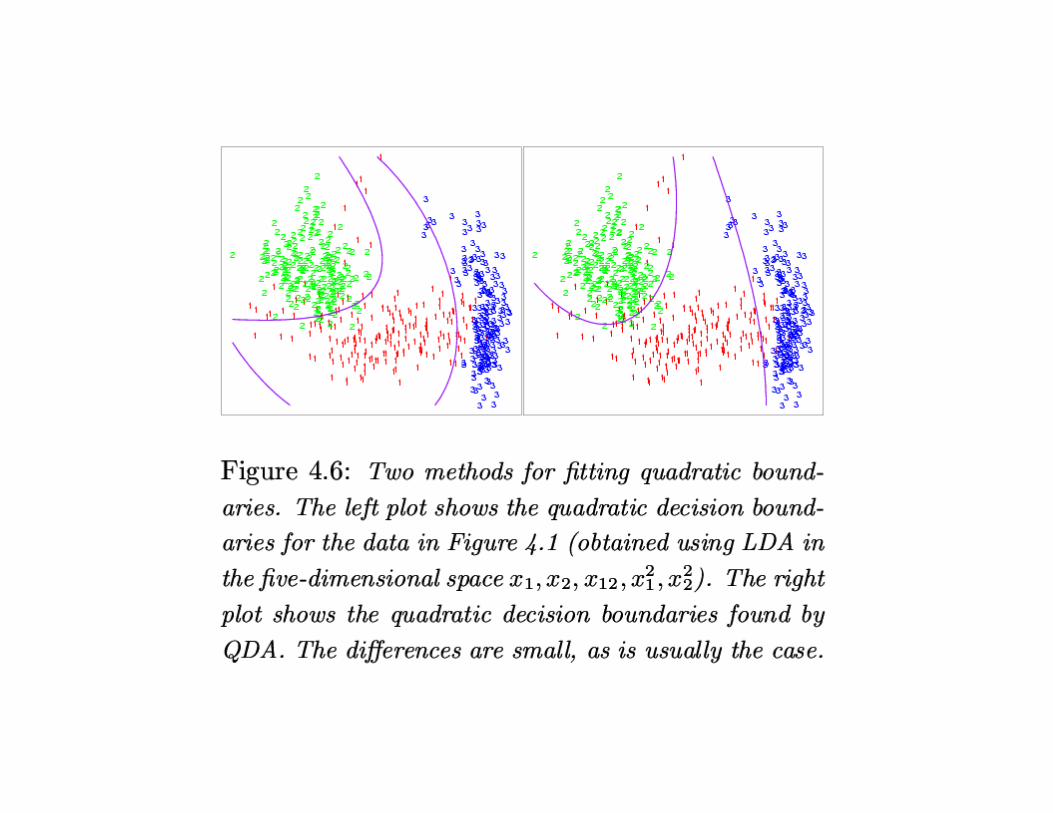
If we don’t assume the Σk’s are identicial, get Quadratic DA:
)(log)()(2
1||log
2
1)( 1
kkk
T
kkk cpxxx +!"!!"!=! µµ#
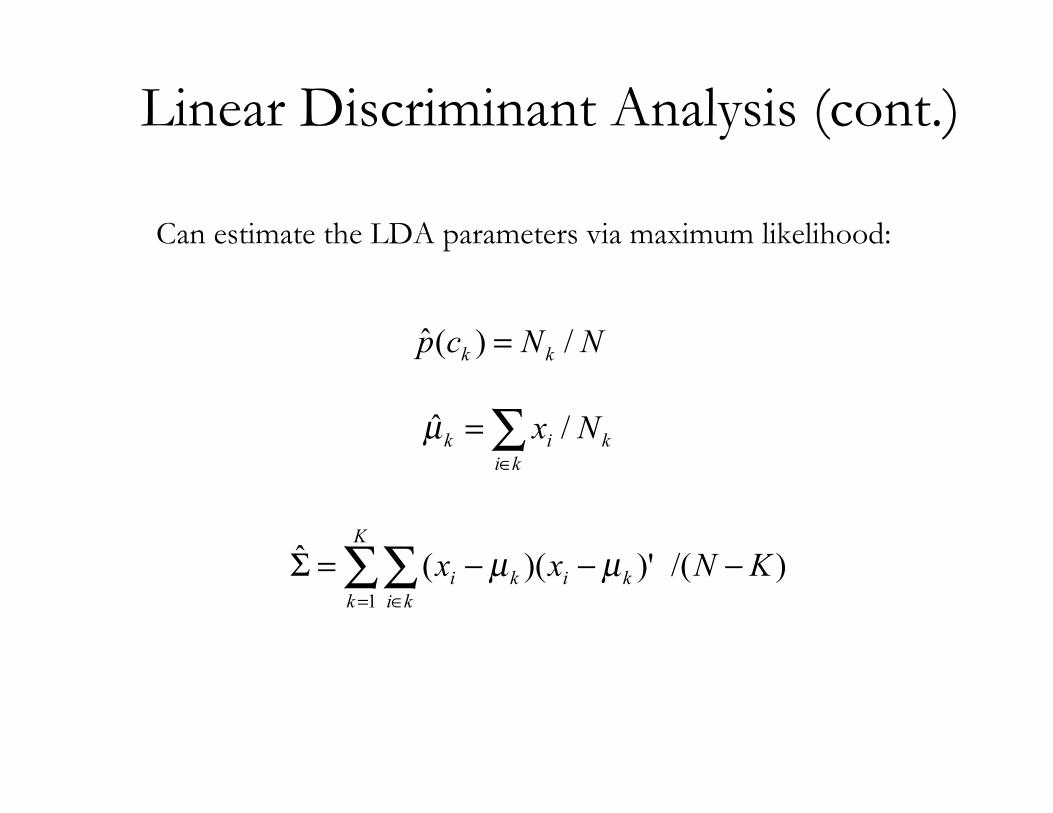
Linear Discriminant Analysis (cont.)
Can estimate the LDA parameters via maximum likelihood:
k
ki
ikNx /ˆ !
"
=µ
NNcp kk /)(ˆ =
)/()')((ˆ
1
KNxx
K
k ki
kiki!!!=" ##
= $
µµ
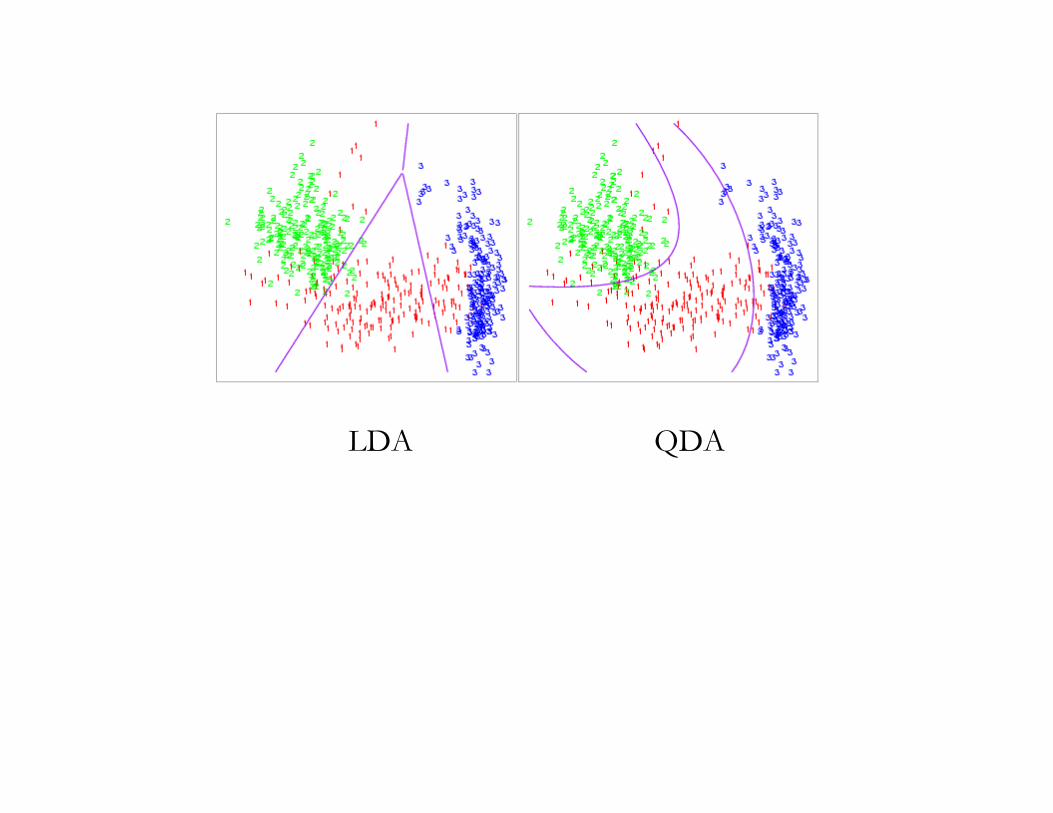
LDA QDA
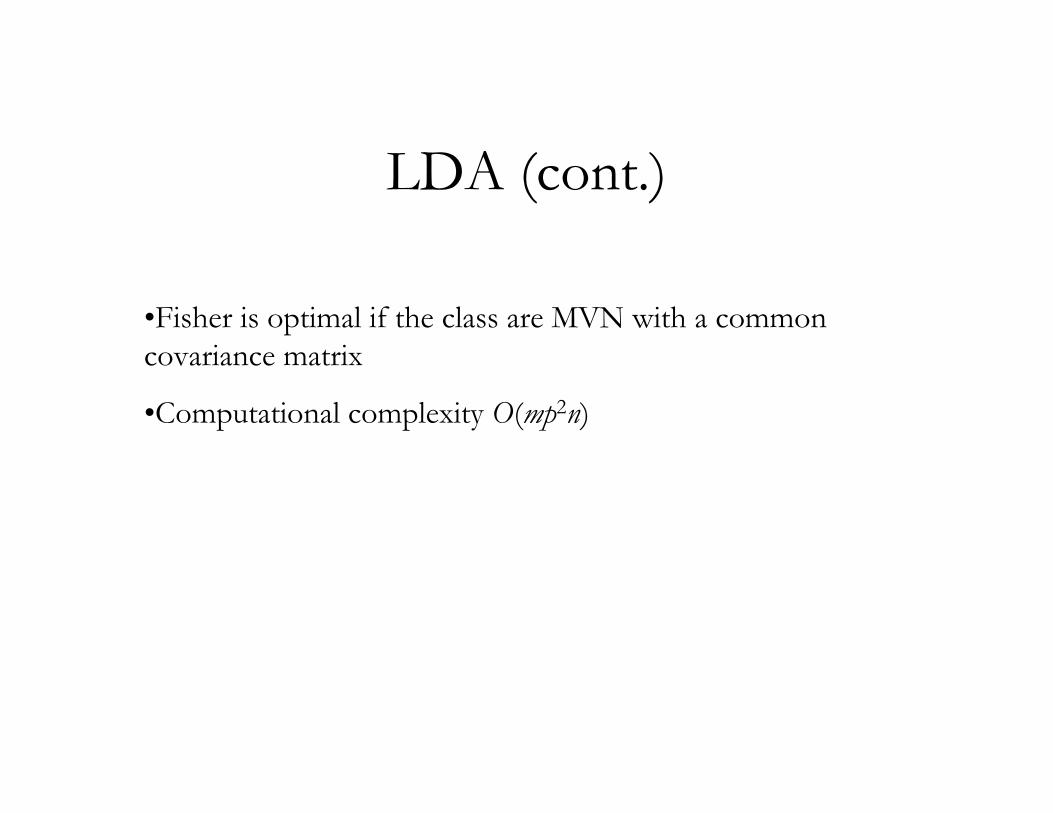
LDA (cont.)
•Fisher is optimal if the class are MVN with a commoncovariance matrix
•Computational complexity O(mp2n)
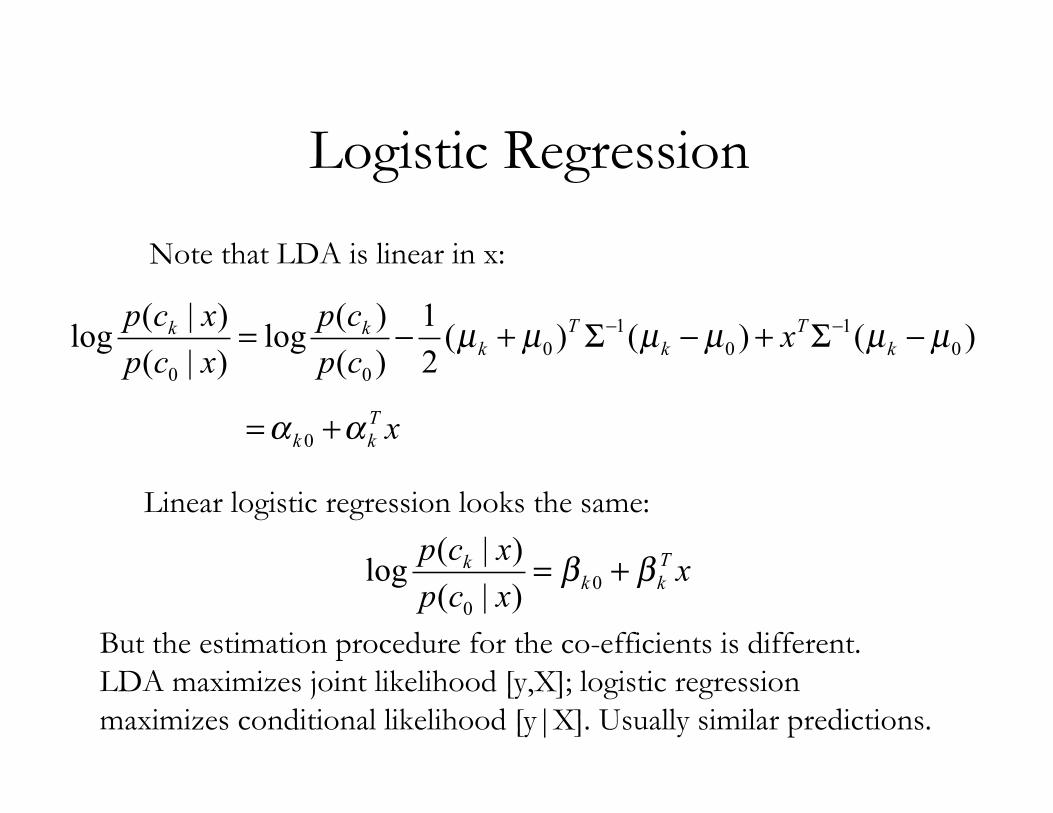
Logistic Regression
Note that LDA is linear in x:
)()()(2
1
)(
)(log
)|(
)|(log 0
1
0
1
0
00
µµµµµµ !"+!"+!=!!
k
T
k
T
kkk xcp
cp
xcp
xcp
xT
kk!! +=
0
Linear logistic regression looks the same:
xxcp
xcp T
kkk !! += 0
0 )|(
)|(log
But the estimation procedure for the co-efficients is different.LDA maximizes joint likelihood [y,X]; logistic regressionmaximizes conditional likelihood [y|X]. Usually similar predictions.
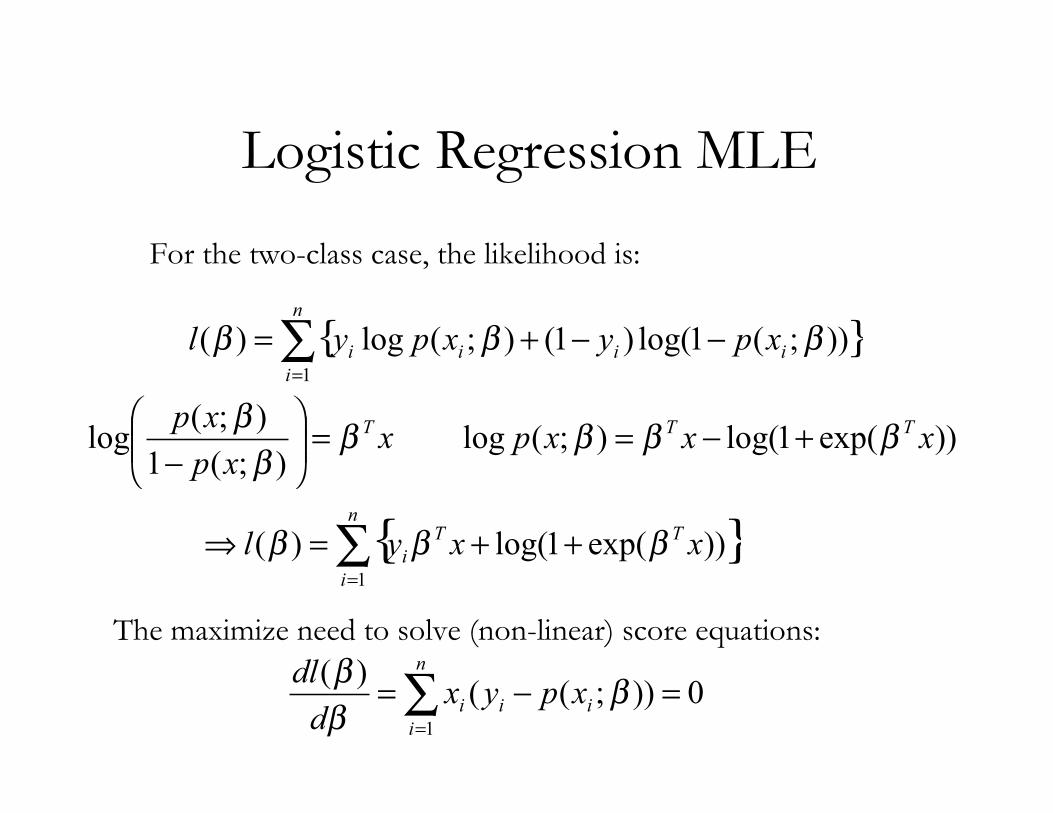
Logistic Regression MLE
For the two-class case, the likelihood is:
{ }!=
""+=n
i
iiii xpyxpyl1
));(1log()1();(log)( ###
xxp
xp T!!
!=""
#
$%%&
'( );(1
);(log ))exp(1log();(log xxxp
TT !!! +"=
{ }!=
++="n
i
TT
i xxyl1
))exp(1log()( ###
The maximize need to solve (non-linear) score equations:
!=
="=
n
i
iii xpyxd
dl
1
0));(()(
##
#
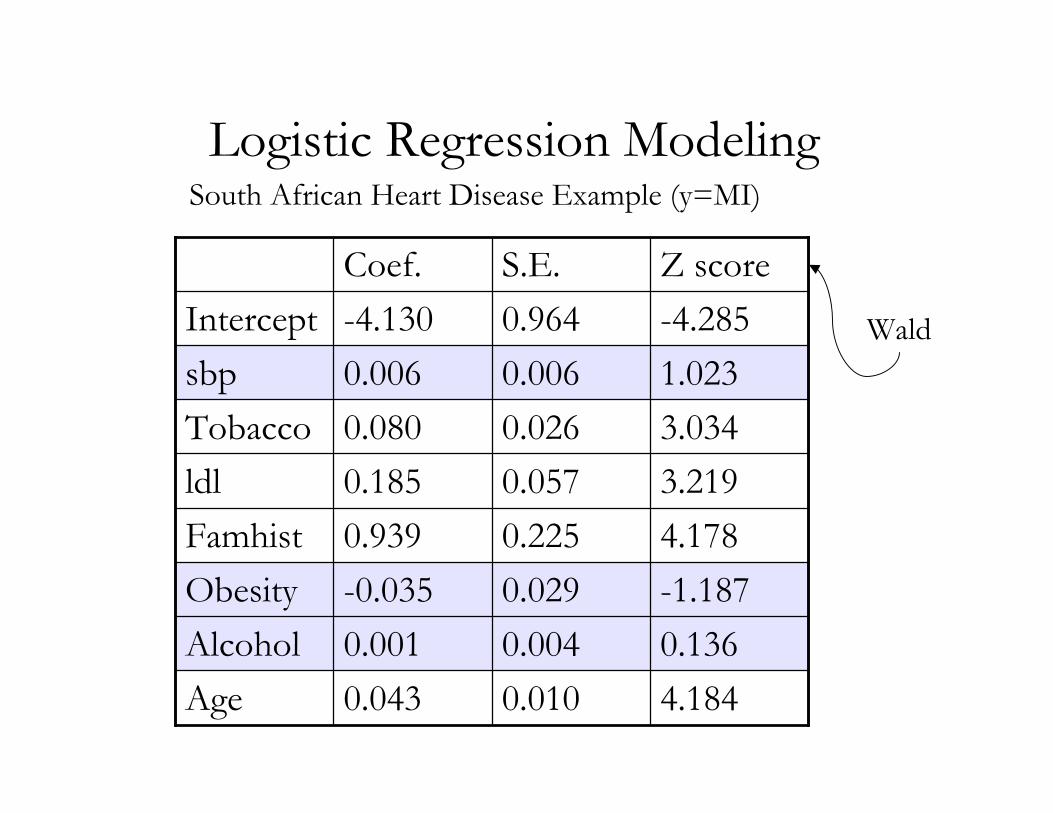
Logistic Regression ModelingSouth African Heart Disease Example (y=MI)
4.1840.0100.043Age0.1360.0040.001Alcohol-1.1870.029-0.035Obesity4.1780.2250.939Famhist3.2190.0570.185ldl3.0340.0260.080Tobacco1.0230.0060.006sbp-4.2850.964-4.130InterceptZ scoreS.E.Coef.
Wald
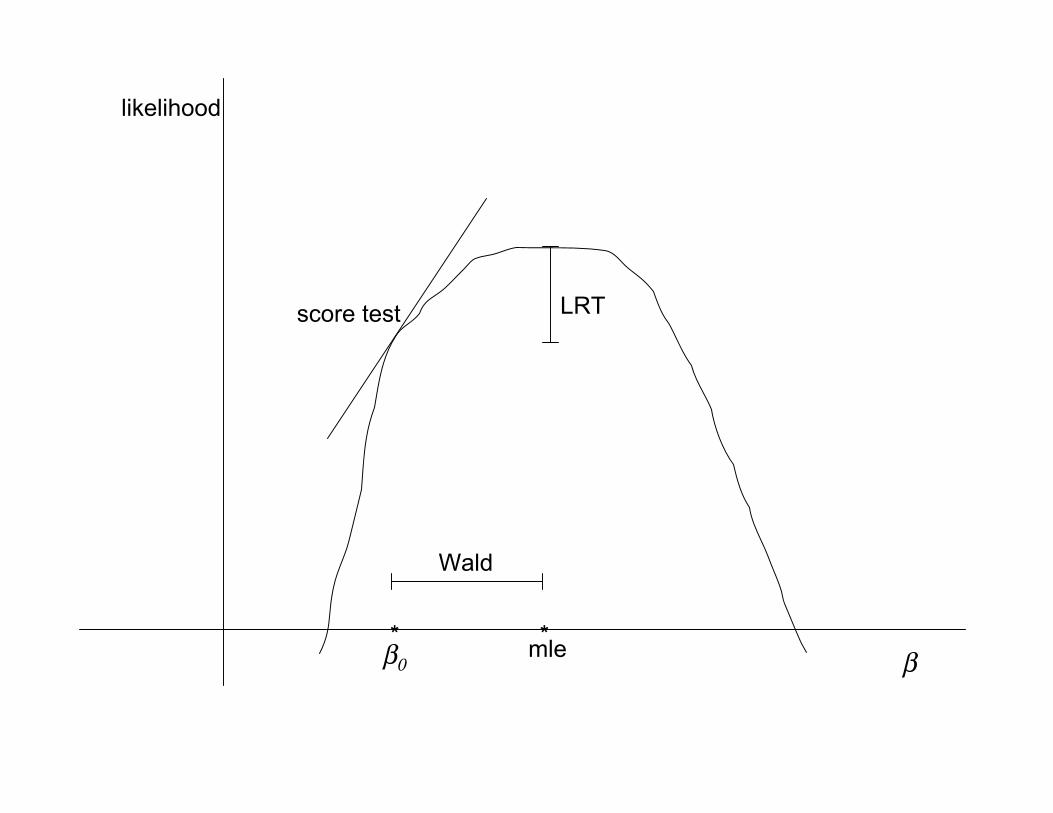
β
likelihood
*mle*β0
score test
Wald
LRT
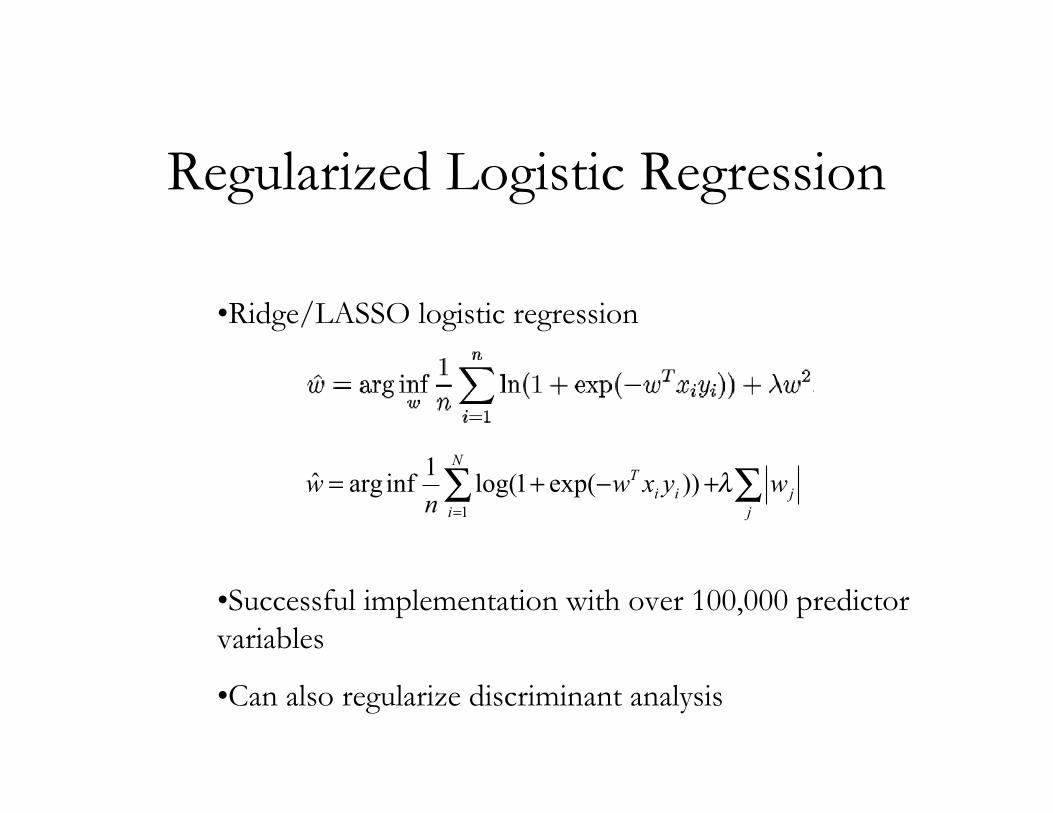
Regularized Logistic Regression
•Ridge/LASSO logistic regression
•Successful implementation with over 100,000 predictorvariables
•Can also regularize discriminant analysis
!!=
+"+=
j
j
N
i
ii
Twyxw
nw #
1
))exp(1log(1
infargˆ
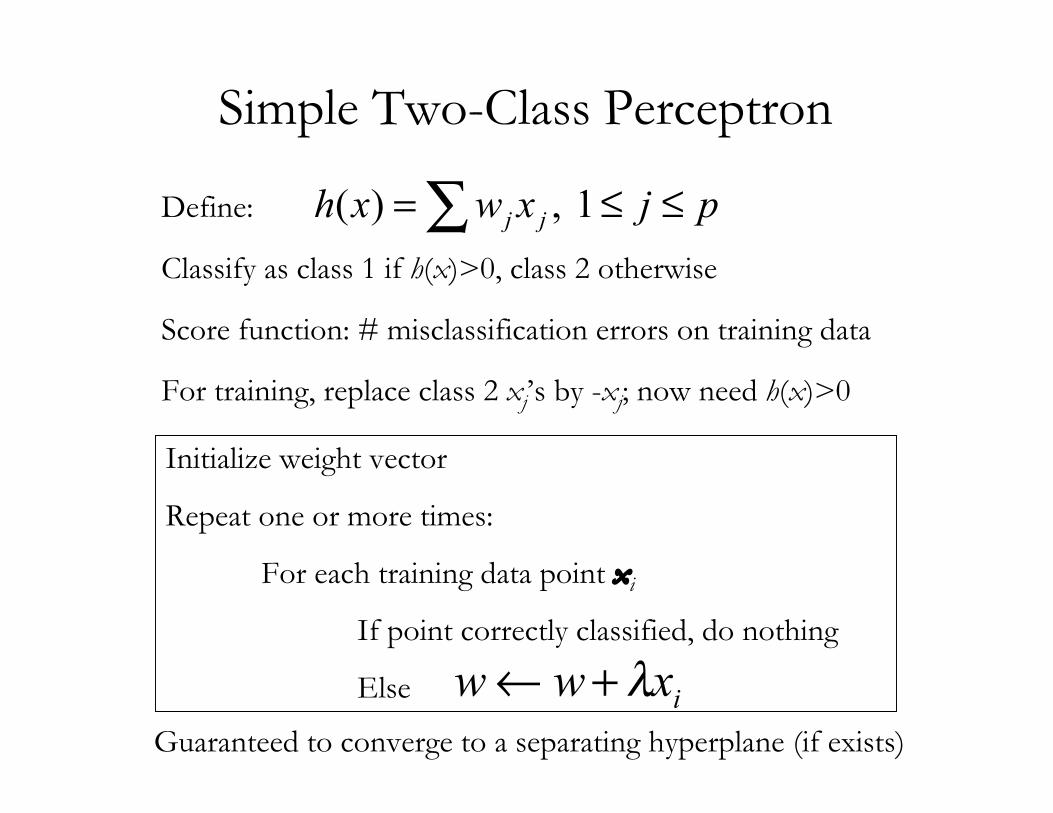
Simple Two-Class Perceptron
Define:
Classify as class 1 if h(x)>0, class 2 otherwise
Score function: # misclassification errors on training data
For training, replace class 2 xj’s by -xj; now need h(x)>0
! ""= pjxwxh jj 1,)(
Initialize weight vector
Repeat one or more times:
For each training data point xi
If point correctly classified, do nothing
Elseixww !+"
Guaranteed to converge to a separating hyperplane (if exists)
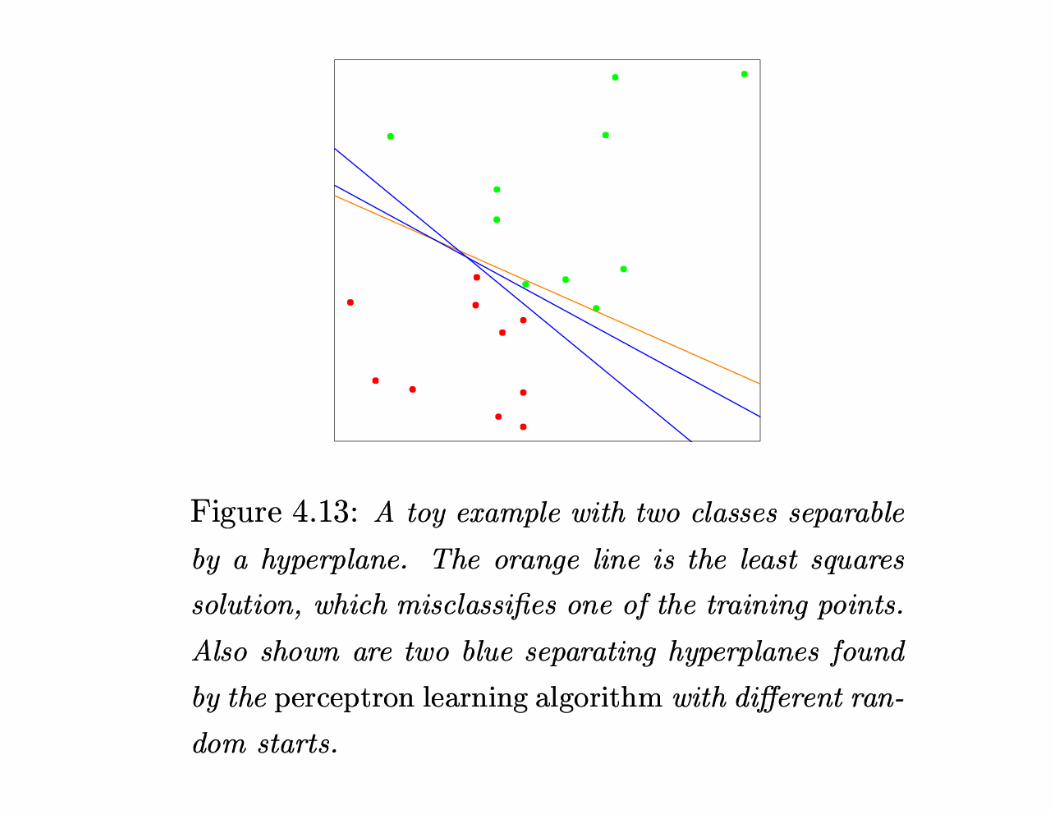
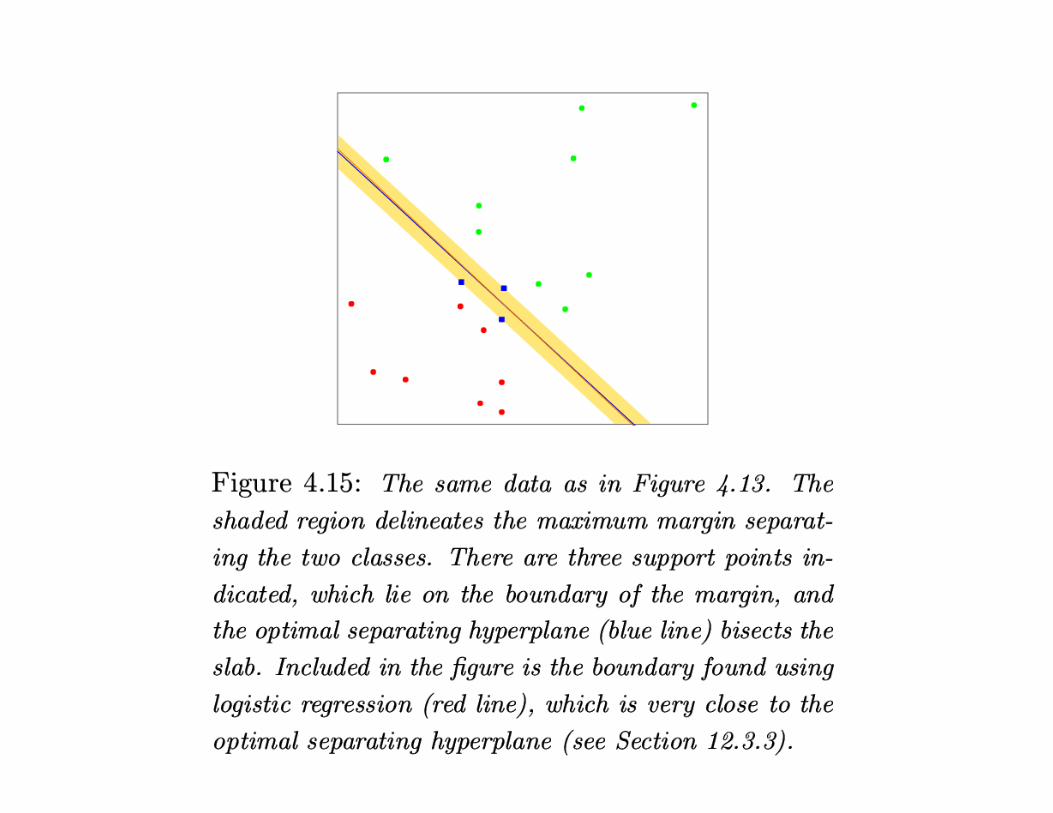
“Optimal” Hyperplane
The “optimal” hyperplane separates the two classes andmaximizes the distance to the closest point from either class.
Finding this hyperplane is a convex optimization problem.
This notion plays an important role in support vectormachines
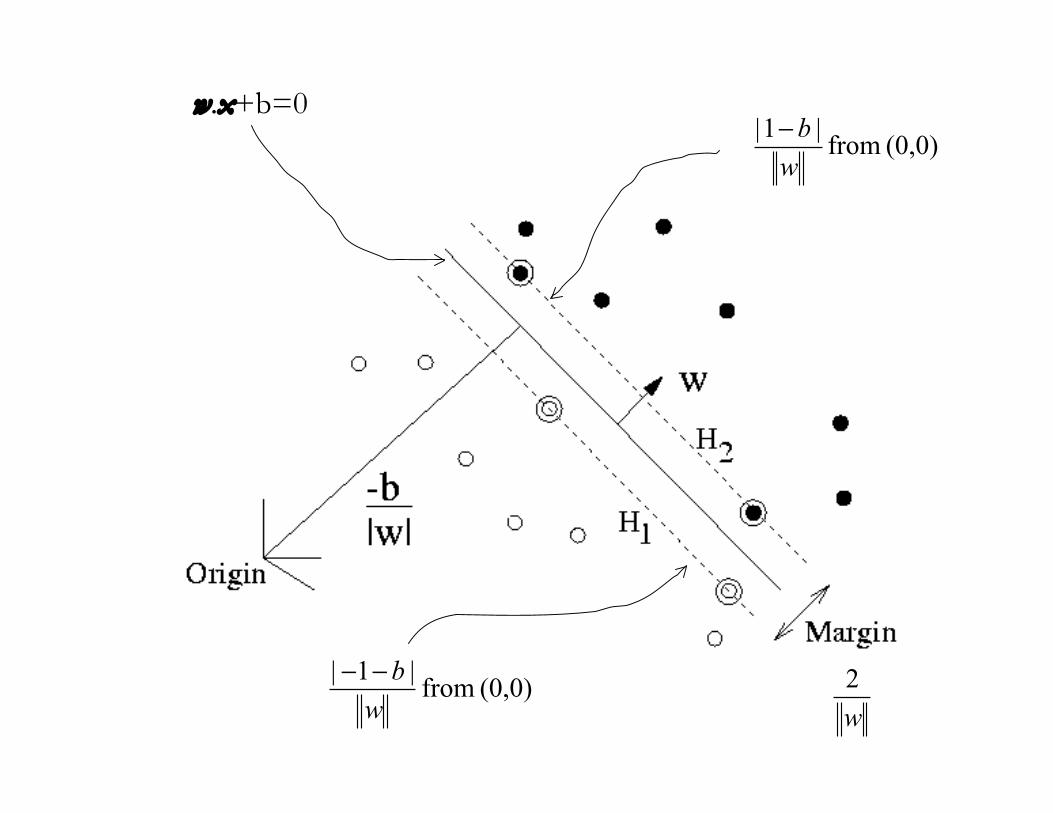
w.x+b=0(0,0) from
|1|
w
b!
(0,0) from |1|
w
b!!
w
2
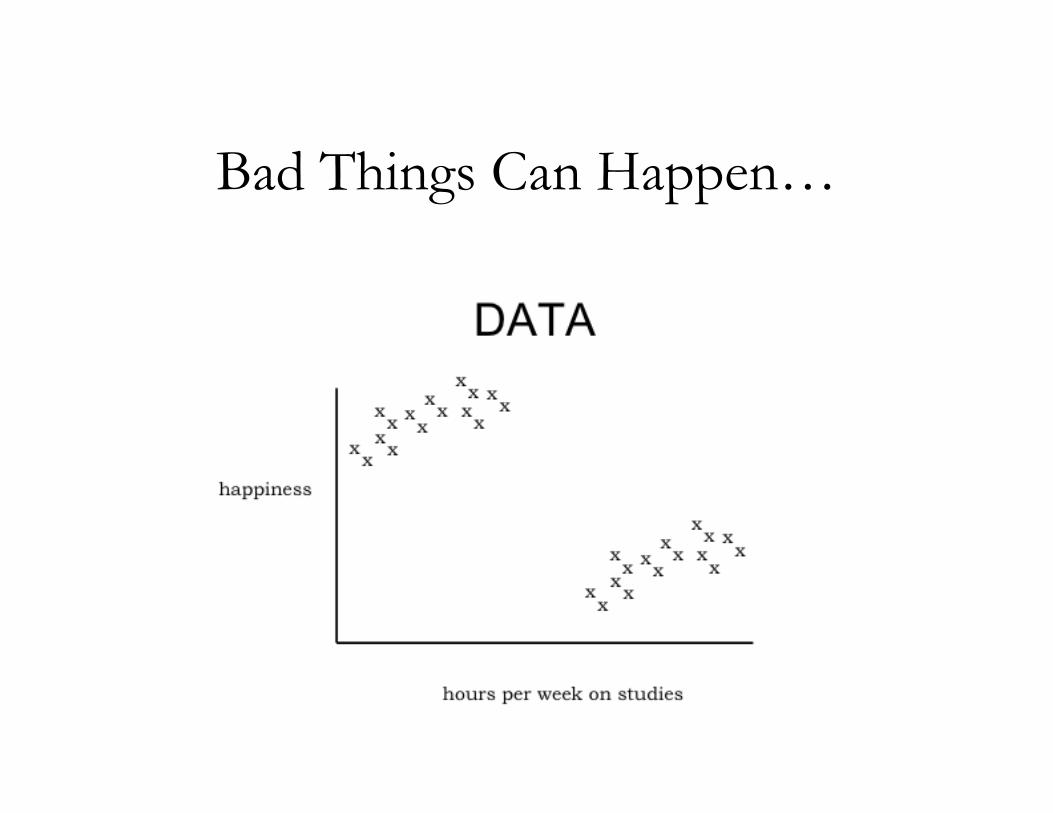
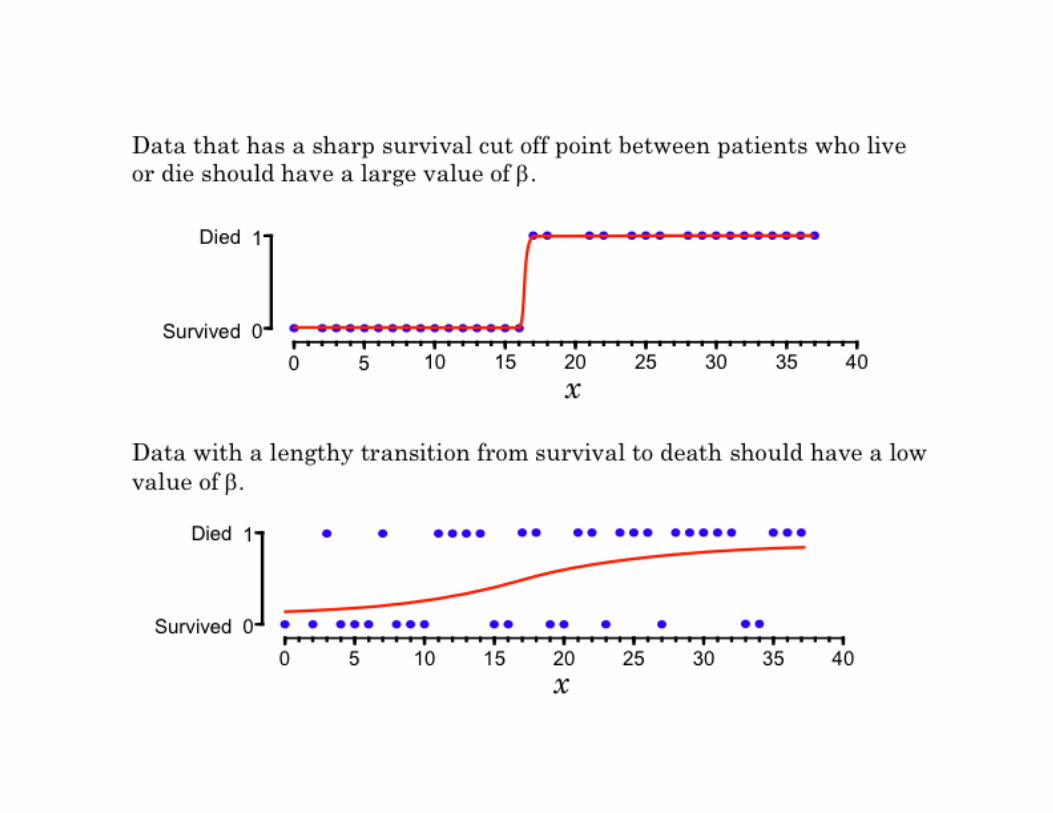
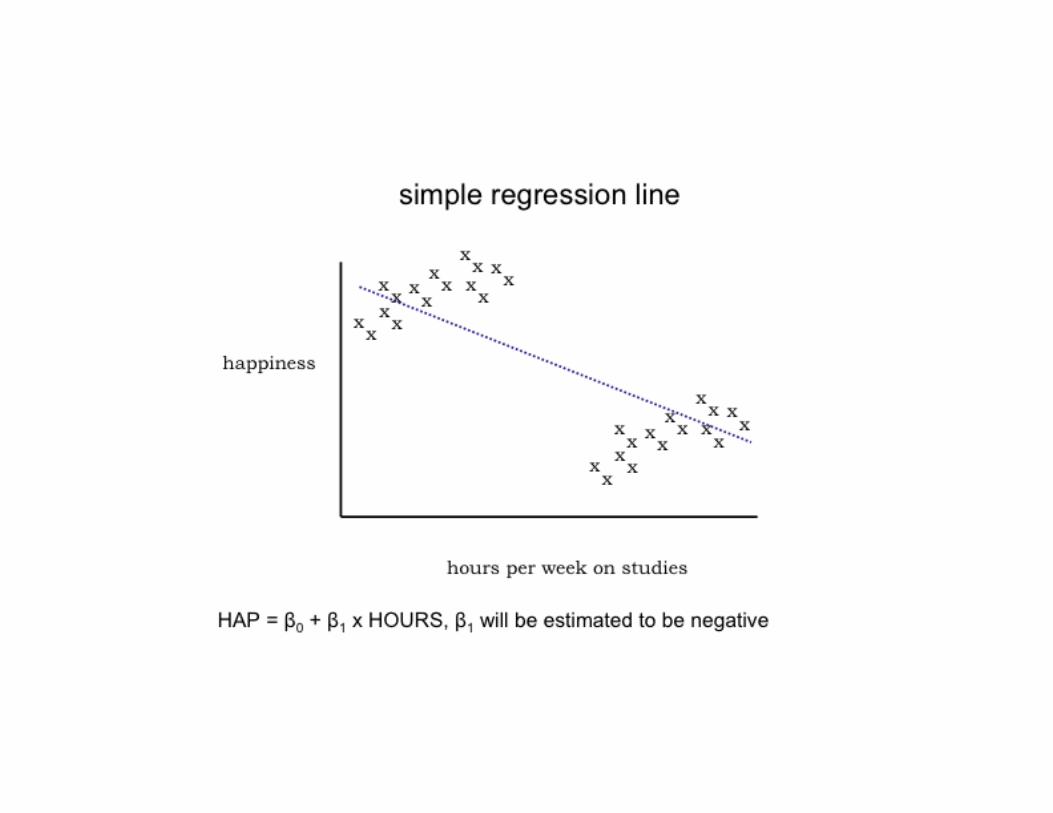
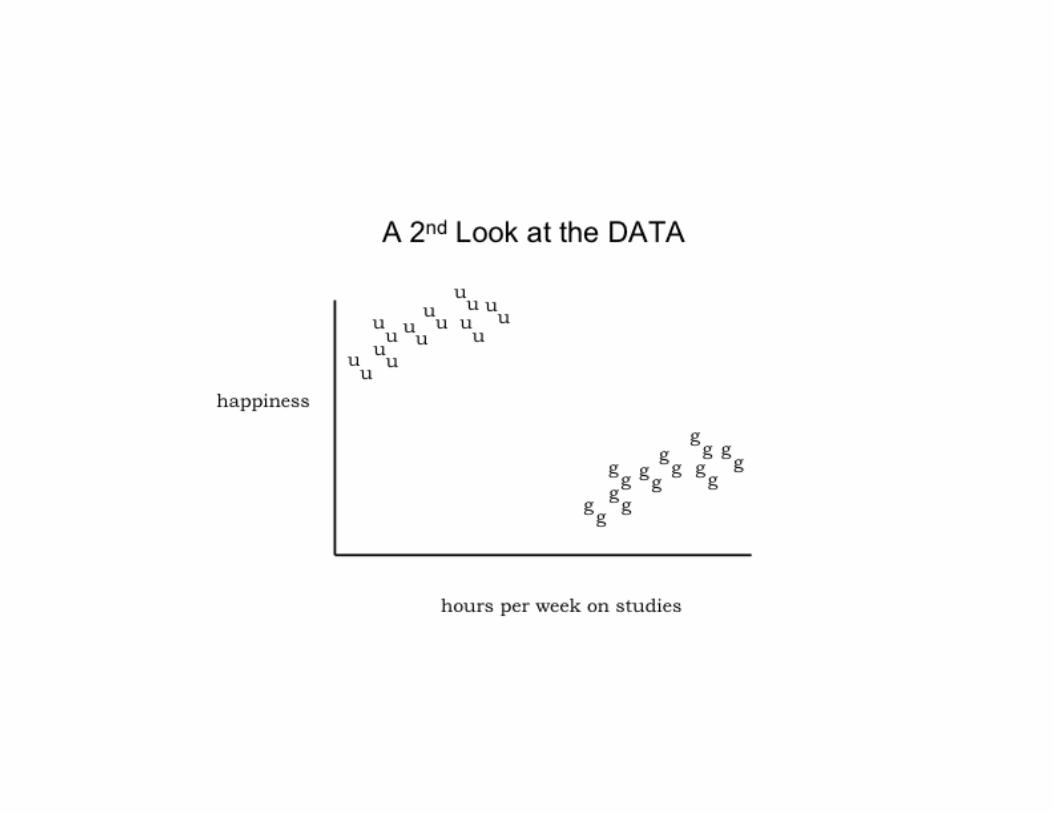
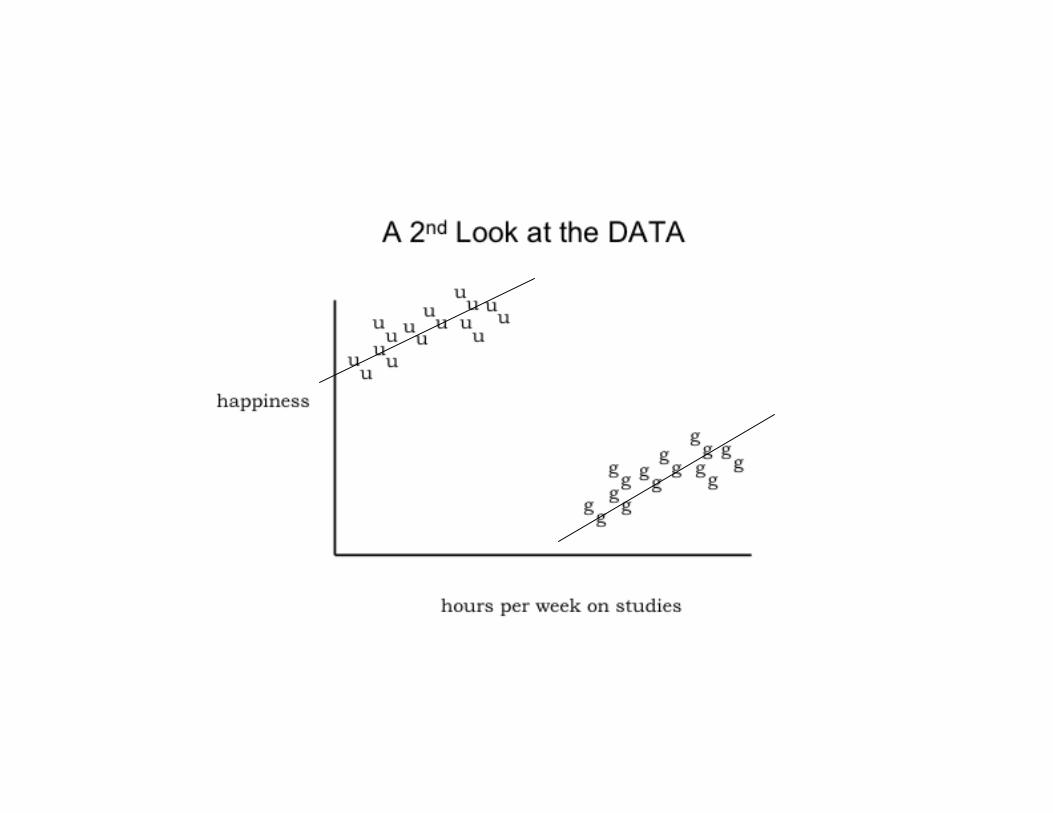
Bad Things Can Happen…
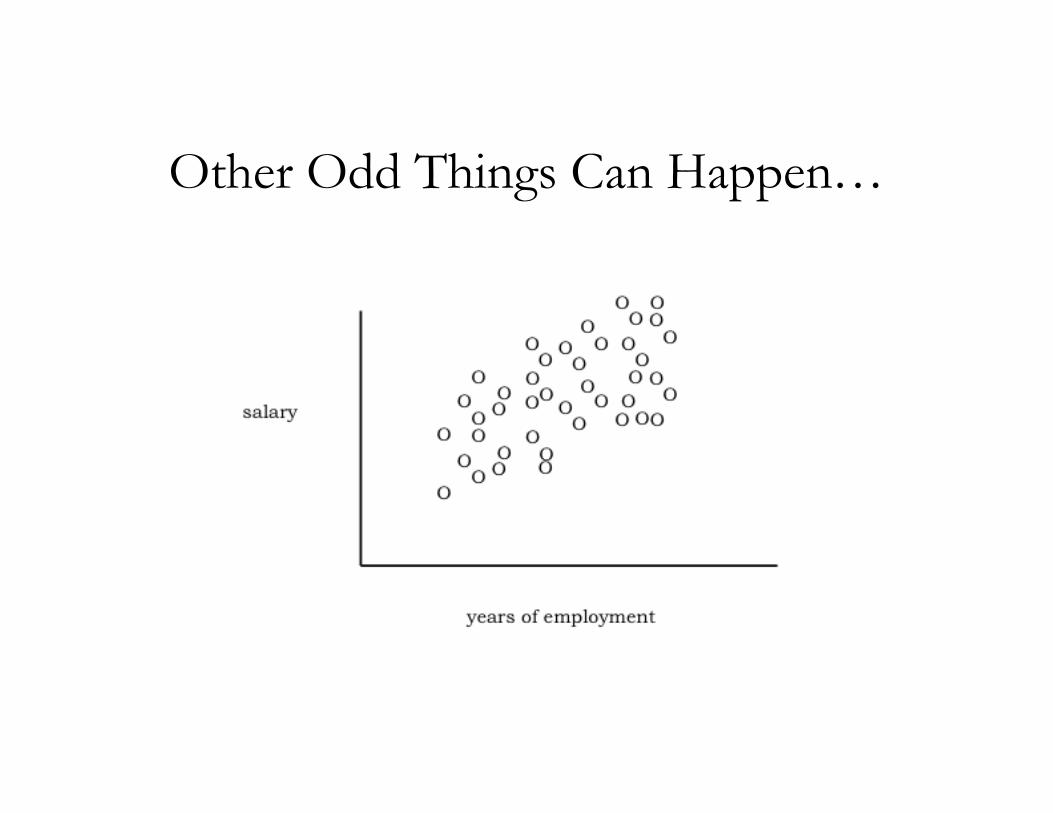
Other Odd Things Can Happen…
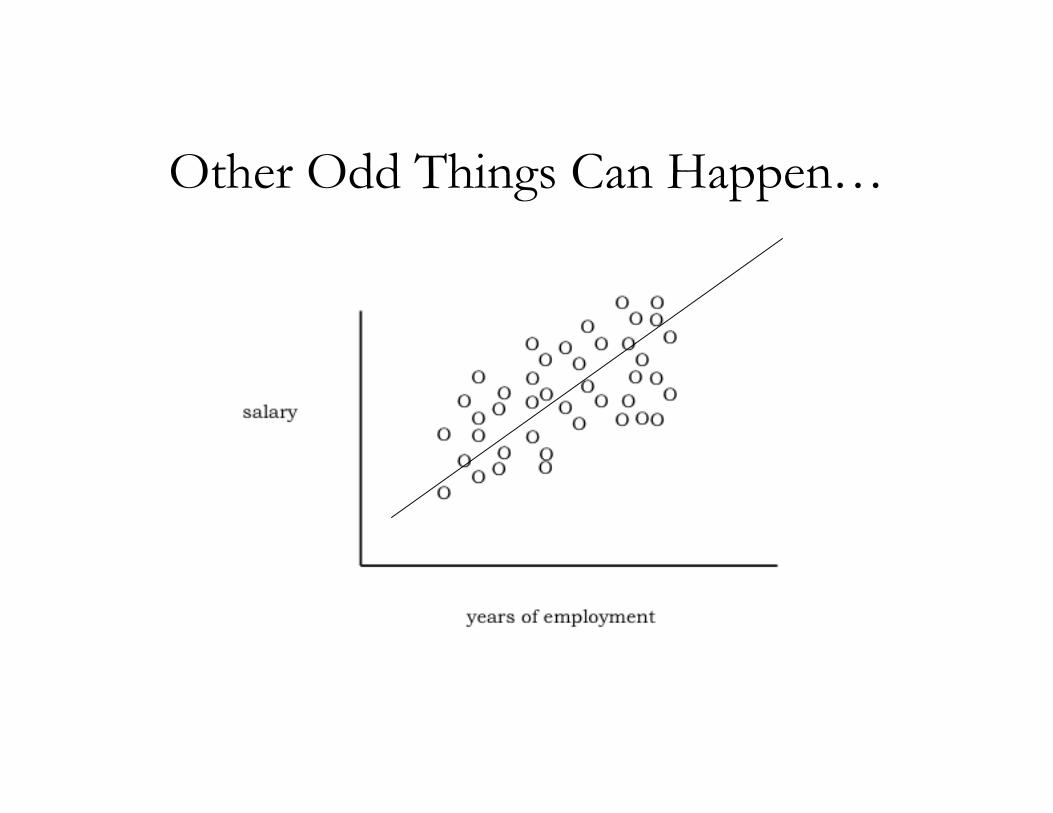
Other Odd Things Can Happen…
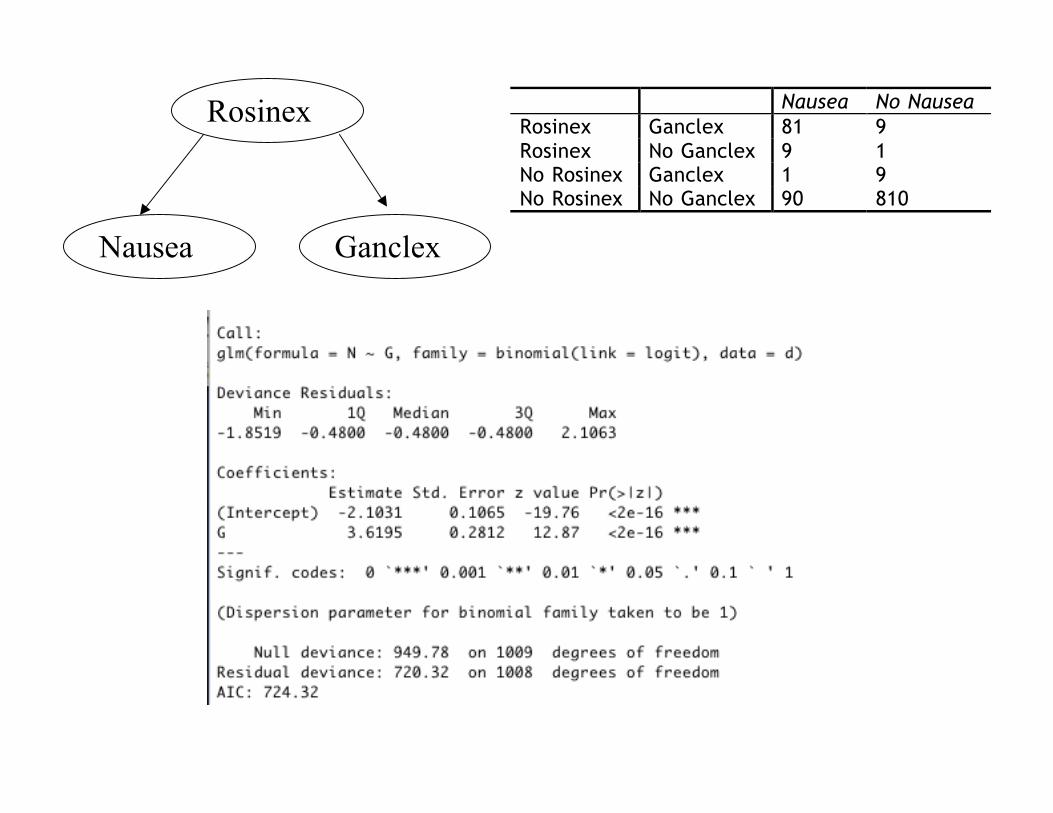
Rosinex
Nausea Ganclex
Nausea No Nausea
Rosinex Ganclex 81 9
Rosinex No Ganclex 9 1
No Rosinex Ganclex 1 9
No Rosinex No Ganclex 90 810