Letter a-Al2O3 V3
8
Elucidating the High-k Insulator α-Al 2 O 3 Direct/Indirect Energy Band Gap Type Through Density Functional Theory Computations R. C. R. Santos, 1 E. Longhinotti, 1 V. N. Freire 2 , R. B. Reimberg 3 , E. W. S. Caetano 3 1 Departamento de Qu´ ımica Anal´ ıtica e F´ ısico-Qu´ ımica, Universidade Federal do Cear´a, 60455-900 Fortaleza, CE, Brazil 2 Departamento de F´ ısica, Universidade Federal do Cear´ a, 60455-760 Fortaleza, CE, Brazil and 3 Instituto Federal de Educa¸ c˜ ao, Ciˆ encia e Tecnologia do Cear´ a, 60040-531 Fortaleza, CE, Brazil (Dated: June 10, 2015) The measured energy band gap of the high-k insulator α-Al2O3 is direct (Γ → Γ) and equal to 8.80 eV, while DFT-calculated estimates are not conclusive regarding its direct/indirect character, with values ranging from 6.29 to 9.2 eV. In view of this, we have performed state of the art den- sity functional theory (DFT) computations of the structural and electronic properties of α-Al2O3 employing several exchange-correlation functionals, namely the local density approximation (LDA), the generalized gradient approximation (GGA: PBE, RPBE, PBESOL); hybrid functionals (PBE0, HSE06, B3LYP); and the LDA screened exchange approach (sX-LDA). In order to evaluate the band gaps from the ”pure” DFT functionals (LDA, GGA), the Δ-sol scheme was also adopted as it allows to improve band gap estimates with low computational cost. For the functionals tested in this work, we have obtained Δ-sol gaps ranging from 7.703eV (direct, RPBE) to 8.530 eV (direct, LDA), while for the hybrid functionals the best figure in comparison with experiment was obtained for the B3LYP gap (8.674 eV, direct). The sX-LDA calculation, in contrast, predicts that α-Al2O3 is an indirect gap material with band gap of 8.826 eV, but with a very close direct Γ → Γ energy of 8.835 eV (a difference of only 9 meV), in excellent agreement with experimental data. The dependence of the band gap type of α-Al2O3 as a function of the lattice parameters was investigated as well, and our results suggest a subtle direct to indirect gap transition in α-Al2O3 for temperatures above 400 K due to thermal expansion. The aggressive scaling of gate length and equivalent gate oxide thickness demanded by the International Tech- nology Roadmap for Semiconductors [1] have turned alu- minum oxide α-Al 2 O 3 (sapphire or corundum) into an in- teresting material to replace standard SiO 2 technologies. It has an experimental wide direct band gap of 8.8 [2– 6] and a 2.8 eV conduction band offset (similar to SiO 2 ) [7, 8]. Efforts to increase its modest dielectric constant (κ ∼ 9.0) by appropriate doping are being undertaken [9]. Among its applications, α-Al 2 O 3 is used as a substrate for the growth of silicon and gallium nitride, and as an active medium in lasers when doped with chromium or titanium. A detailed description of the α-Al 2 O 3 crys- tal structure was given by Batra [10]: its primitive unit cell is rhombohedral (space group R-3C), containing two Al 2 O 3 units, but it can also be described using a hexago- nal unit cell [11, 12] with lattice parameters a =4.756 ˚ A and c = 12.982 ˚ A [13] at 4.5 K and containing 12 six- coordinated Al atoms and 18 four-coordinated O atoms. Barrier height (associated to the gap energy and band offset) and charge carrier effective masses are key param- eters to model the tunneling mechanism which describes charge injection through a perfect dielectric layer, be- ing estimated through electronic band structure calcula- tions. In the case of α-Al 2 O 3 , the pioneer calculations for the crystal were non-self-consistent or semiempirical in nature, but some were developed for small clusters, as reviewed briefly by Xu and Chin [14]. The first α- Al 2 O 3 self-consistent band structure was obtained in a preliminary way by French [16], soon followed by the landmark work of Xu and Chin [14] (see also [15]) in which the first-principles orthogonalized linear combina- tion of atomic orbitals method (OLCAO) in the local density approximation (LDA) within the density func- tional formalism (DFT) was used. They have obtained an indirect band gap of 6.29 eV involving a transition from the top of the valence band at a point at 20% of the Γ-X line and the bottom of the conduction band at Γ [14]; effective masses obtained for the electrons were 0.16 along the Γ → X direction, 0.45 along Γ → Z , 0.40 along Γ → A and 0.38 along Γ → D (values given in units of the free electron mass, m o ), while the hole effective masses were not evaluated due to the flatness of the va- lence band [14]. Theoretical DFT works on the α-Al 2 O 3 electronic structure published afterwards have obtained similar estimates for the gap energy (all of them, how- ever, with direct main gaps) and carrier effective masses [5, 6, 17–21]. Samantaray et al. have found a direct band gap of 6.1 eV for α-Al 2 O 3 at the Γ point [4] using the LDA exchange-correlation potential, while Mousavi et al. [22], using the Full Potential Linearized Augmented Plane Wave (FP-LAPW) approach employing the Engle- Vosko approximation (EVA) have found a direct band gap of 7.2 eV. The electronic structure calculated for a thin film of α-Al 2 O 3 , by the way, has revealed a band gap of only 2.6 eV [23], much smaller than the bulk. The electronic structure of amorphous alumina was in- vestigated using classical molecular dynamics and Xα exchange potentials [24], being shown a local oxygen de- ficiency around Al atoms. On the other hand, GW calcu- lations performed by Marinopoulos and Gr¨ uning predict a direct band gap of 9.36 eV for α-alumina [25], while another study by Choi et al. [26], using the hybrid HSE exchange-correlation functional, predicted a band gap of
-
Upload
ewerton-caetano -
Category
Documents
-
view
247 -
download
2
description
Improving the band structure of a-Al2O3
Transcript of Letter a-Al2O3 V3
Elucidating the High-k Insulator α-Al2O3 Direct/Indirect Energy Band Gap TypeThrough Density Functional Theory Computations
R. C. R. Santos,1 E. Longhinotti,1 V. N. Freire2, R. B. Reimberg3, E. W. S. Caetano31Departamento de Quımica Analıtica e Fısico-Quımica,
Universidade Federal do Ceara, 60455-900 Fortaleza, CE, Brazil2Departamento de Fısica, Universidade Federal do Ceara, 60455-760 Fortaleza, CE, Brazil and3Instituto Federal de Educacao, Ciencia e Tecnologia do Ceara, 60040-531 Fortaleza, CE, Brazil
(Dated: June 10, 2015)
The measured energy band gap of the high-k insulator α-Al2O3 is direct (Γ → Γ) and equal to8.80 eV, while DFT-calculated estimates are not conclusive regarding its direct/indirect character,with values ranging from 6.29 to 9.2 eV. In view of this, we have performed state of the art den-sity functional theory (DFT) computations of the structural and electronic properties of α-Al2O3
employing several exchange-correlation functionals, namely the local density approximation (LDA),the generalized gradient approximation (GGA: PBE, RPBE, PBESOL); hybrid functionals (PBE0,HSE06, B3LYP); and the LDA screened exchange approach (sX-LDA). In order to evaluate theband gaps from the ”pure” DFT functionals (LDA, GGA), the ∆-sol scheme was also adopted as itallows to improve band gap estimates with low computational cost. For the functionals tested in thiswork, we have obtained ∆-sol gaps ranging from 7.703 eV (direct, RPBE) to 8.530 eV (direct, LDA),while for the hybrid functionals the best figure in comparison with experiment was obtained for theB3LYP gap (8.674 eV, direct). The sX-LDA calculation, in contrast, predicts that α-Al2O3 is anindirect gap material with band gap of 8.826 eV, but with a very close direct Γ → Γ energy of 8.835eV (a difference of only 9 meV), in excellent agreement with experimental data. The dependence ofthe band gap type of α-Al2O3 as a function of the lattice parameters was investigated as well, andour results suggest a subtle direct to indirect gap transition in α-Al2O3 for temperatures above 400K due to thermal expansion.
The aggressive scaling of gate length and equivalentgate oxide thickness demanded by the International Tech-nology Roadmap for Semiconductors [1] have turned alu-minum oxide α-Al2O3 (sapphire or corundum) into an in-teresting material to replace standard SiO2 technologies.It has an experimental wide direct band gap of 8.8 [2–6] and a 2.8 eV conduction band offset (similar to SiO2)[7, 8]. Efforts to increase its modest dielectric constant(κ ∼ 9.0) by appropriate doping are being undertaken [9].Among its applications, α-Al2O3 is used as a substratefor the growth of silicon and gallium nitride, and as anactive medium in lasers when doped with chromium ortitanium. A detailed description of the α-Al2O3 crys-tal structure was given by Batra [10]: its primitive unitcell is rhombohedral (space group R-3C), containing twoAl2O3 units, but it can also be described using a hexago-nal unit cell [11, 12] with lattice parameters a = 4.756 Aand c = 12.982 A [13] at 4.5 K and containing 12 six-coordinated Al atoms and 18 four-coordinated O atoms.
Barrier height (associated to the gap energy and bandoffset) and charge carrier effective masses are key param-eters to model the tunneling mechanism which describescharge injection through a perfect dielectric layer, be-ing estimated through electronic band structure calcula-tions. In the case of α-Al2O3, the pioneer calculationsfor the crystal were non-self-consistent or semiempiricalin nature, but some were developed for small clusters,as reviewed briefly by Xu and Chin [14]. The first α-Al2O3 self-consistent band structure was obtained in apreliminary way by French [16], soon followed by thelandmark work of Xu and Chin [14] (see also [15]) inwhich the first-principles orthogonalized linear combina-
tion of atomic orbitals method (OLCAO) in the localdensity approximation (LDA) within the density func-tional formalism (DFT) was used. They have obtainedan indirect band gap of 6.29 eV involving a transitionfrom the top of the valence band at a point at 20% ofthe Γ−X line and the bottom of the conduction band atΓ [14]; effective masses obtained for the electrons were0.16 along the Γ→ X direction, 0.45 along Γ→ Z, 0.40along Γ→ A and 0.38 along Γ→ D (values given in unitsof the free electron mass, mo), while the hole effectivemasses were not evaluated due to the flatness of the va-lence band [14]. Theoretical DFT works on the α-Al2O3
electronic structure published afterwards have obtainedsimilar estimates for the gap energy (all of them, how-ever, with direct main gaps) and carrier effective masses[5, 6, 17–21]. Samantaray et al. have found a directband gap of 6.1 eV for α-Al2O3 at the Γ point [4] usingthe LDA exchange-correlation potential, while Mousaviet al. [22], using the Full Potential Linearized AugmentedPlane Wave (FP-LAPW) approach employing the Engle-Vosko approximation (EVA) have found a direct bandgap of 7.2 eV. The electronic structure calculated for athin film of α-Al2O3, by the way, has revealed a bandgap of only 2.6 eV [23], much smaller than the bulk.The electronic structure of amorphous alumina was in-vestigated using classical molecular dynamics and Xαexchange potentials [24], being shown a local oxygen de-ficiency around Al atoms. On the other hand, GW calcu-lations performed by Marinopoulos and Gruning predicta direct band gap of 9.36 eV for α-alumina [25], whileanother study by Choi et al. [26], using the hybrid HSEexchange-correlation functional, predicted a band gap of
2
9.2 eV. A calculated B3LYP band gap of 8.5 eV for α-Al2O3, in contrast, was obtained by Muscat et al. [27],while a mBJ band gap of approximately 9.0 eV was foundby Lima et al. [9].
In this work, we have performed a series of simula-tions within the density functional theory formalism toimprove the understanding of the nature of the α-Al2O3
main energy band gap. At room temperature, all exper-imental data available indicate that this material has awide direct band gap, and all theoretical studies agreethat the top of the valence band of α-Al2O3 is very flat.Such valence band flatness seems to imply that the exactnature of the band gap of alumina is strongly sensitive tovariations in its lattice parameters. As a matter of fact,some theoretical reports have found an indirect band gap[14–16] for α-Al2O3.
The computations we carried out used as initial struc-ture the unit cell lattice parameters at 4.5 K for aluminafound in reference [13], which employed the Mossbauerwavelength standard to achieve very precise measure-ments. Geometry optimizations were performed tak-ing into account four parametrizations for the exchange-correlation functional: the local density approximation(LDA) model of Ceperley and Alder [28], and the gener-alized gradient approximation (GGA) models of Perdew-Burke-Ernzerhof [29] (PBE), the revised PBE model(RPBE [30]), and the PBESOL model [31] (optimiza-tion for the solid state). As it is known, the Kohn-Shamband gaps obtained from pure DFT calculations are usu-ally well below experimental values [32]. In order toaddress this issue, single point energy calculations wereworked out for the optimized structures using the hy-brid functionals PBE0 [33] (PBE optimized geometry),HSE06 [34](PBESOL optimized unit cell), and B3LYP[35] (PBESOL optimized unit cell) in order to improvethe band gap estimate (hybrid functional simulations,while computationally much more expensive than pureDFT implementations, predict much better band gaps,comparable to those obtained using more sophisticatedmethods such as the QMC and GW approaches [27]). Wehave also employed the screened exchange LDA scheme(sX-LDA [32]) to estimate more accurately the band gapof the LDA-optimized geometry. In the sX-LDA method,the exchange contribution to the total energy is splittedinto two parts: a screened, nonlocal and a local densitycomponent. Lastly, we have also applied the ∆-sol tech-nique [36] to obtain gap estimates directly from the pureDFT exchange-correlation functionals. Overall, we havefound a total of 12 band gap estimates to be discussedand compared with the experimental value.
In order to perform all the calculations, the plane-wavebasis set CASTEP code [37] was used together with onthe fly generated ultrasoft pseudopotentials (applied forthe geometry optimizations and electronic band struc-ture computations in the LDA and GGA frameworks)and norm-conserving pseudopotentials (applied when us-ing hybrid functionals and the LDA screened exchangeapproach) for the description of the core electrons, with
valence electronic configurations for the oxygen and alu-minium atoms being 2s22p2 and 3s23p1, in this order. AMonkhorst-Pack 3 × 3 × 2 (4 × 4 × 4) grid was adoptedto evaluate integrals in reciprocal space for the hexago-nal (rhombohedral) α-Al2O3 unit cell, while the planewave cutoff energy was set to 610 eV (750 eV) whenusing the ultrasoft (norm-conserving) pseudopotentials,ensuring a very good quality for the electronic struc-ture – it is about twice the cutoff energy values usedin the previous works on the DFT-calculated α-Al2O3
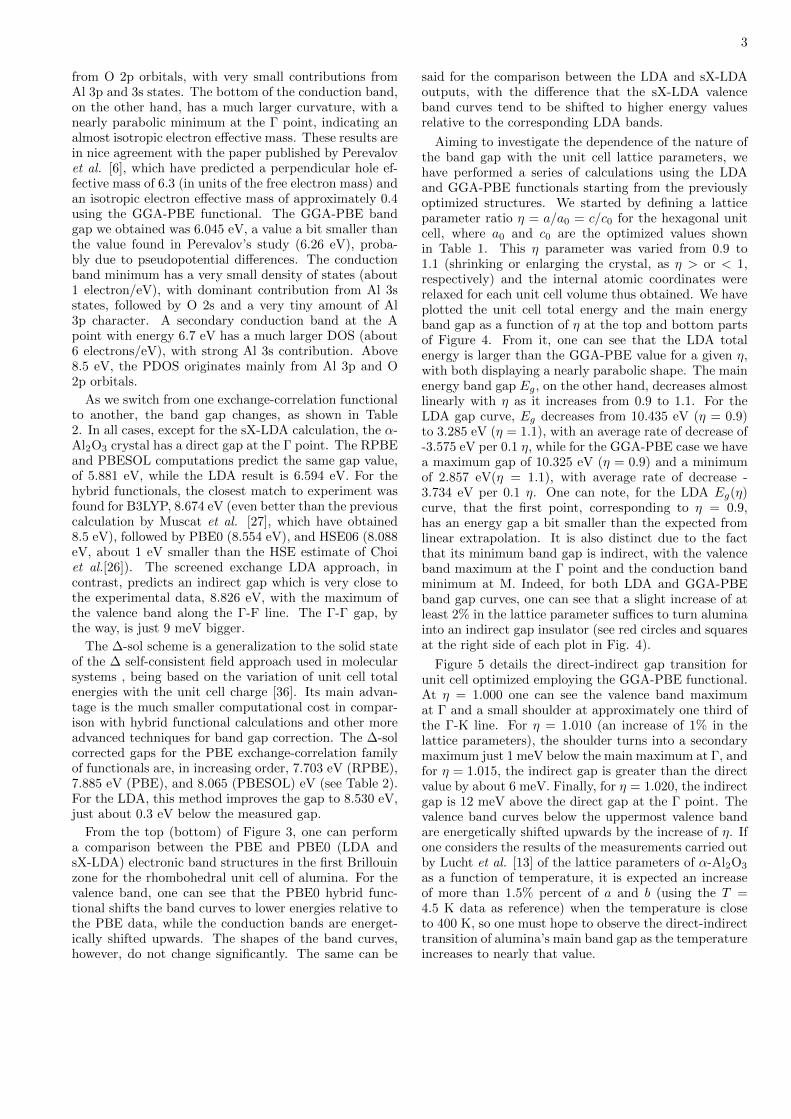
structural and electronic properties. The geometry op-timization convergence thresholds were: energy varia-tion smaller than 5.0 × 10⁻⁶ eV/atom, maximum forcesmaller than 0.01 eV/A, maximum stress smaller than0.02 GPa and maximum atomic displacement smallerthan 5.0× 10⁻⁴ A. Both the internal atomic coordinatesand the unit cell lattice parameters were relaxed, withquality of the plane wave basis set being kept fixed. Theself-consistent field energy convergence tolerance was setto 5.0 × 10⁻⁷ eV/atom with a convergence window of 3iterations. The pure DFT calculations were carried outusing the larger hexagonal unit cell of alumina, whilethe hybrid, sX-LDA calculations were performed usingthe smaller rhombohedral unit cell to decrease the com-putational cost (both cells and the corresponding firstBrillouin zones are shown in Figure 1).
The lattice parameters resulting from the DFT geome-try optimization procedures are shown in Table I, whereboth the hexagonal and rhombohedral unit cell data arepresented. For the hexagonal structure, the ah (ch) LDAlattice parameter is 0.98% (1.0%) smaller than the exper-imental value, while the volume Vh is 3.0% smaller. Thisis not surprising, as the LDA exchange-correlation energytends to overestimate the strength of the atomic bind-ing. The GGA results, on the other hand, exhibit latticeparameters larger than the measured ones (GGA func-tionals in general underestimates the binding strengthin solids), with the worst figures being obtained for theRPBE unit cell: 1.3% larger for ah and 1.4% larger forch. In the PBE case, ah and ch are, respectively, 0.59%and 0.66% larger than the X-ray data. Indeed, the bestagreement with the experimental parameters is found forthe PBESOL converged unit cell, with the theoreticalvalues ah and ch being only 0.11% and 0.15% smaller,respectively (in this case, the PBESOL seems to slightlyoverestimate the binding of the atoms, against typicalGGA behaviour). The α angle for the rhombohedralunit cell, in contrast, is overestimated by both the LDA(0.05%) and PBESOL (0.03%) approaches, and underes-timated when using the PBE (-0.06%) and RPBE (-0.1%)exchange-correlation energies.
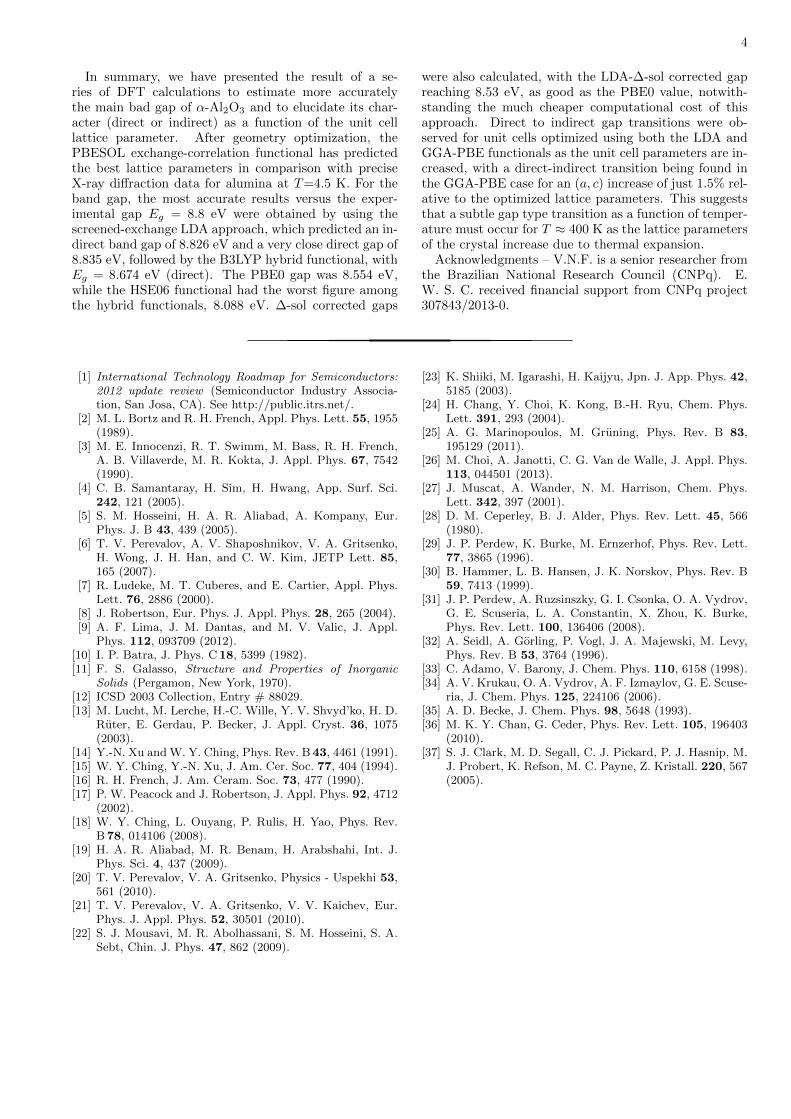
In Figure 2, we have a close-up of the Kohn-Sham bandstructure near the main band gap of α-Al2O3 for thehexagonal unit cell. One can see that the uppermostvalence band has its maximum at the Γ point with verysmall dispersion except along the Γ-A line, which means alarge and anisotropic hole effective mass for this material.The valence band electronic states are mainly originated
3
from O 2p orbitals, with very small contributions fromAl 3p and 3s states. The bottom of the conduction band,on the other hand, has a much larger curvature, with anearly parabolic minimum at the Γ point, indicating analmost isotropic electron effective mass. These results arein nice agreement with the paper published by Perevalovet al. [6], which have predicted a perpendicular hole ef-fective mass of 6.3 (in units of the free electron mass) andan isotropic electron effective mass of approximately 0.4using the GGA-PBE functional. The GGA-PBE bandgap we obtained was 6.045 eV, a value a bit smaller thanthe value found in Perevalov’s study (6.26 eV), proba-bly due to pseudopotential differences. The conductionband minimum has a very small density of states (about1 electron/eV), with dominant contribution from Al 3sstates, followed by O 2s and a very tiny amount of Al3p character. A secondary conduction band at the Apoint with energy 6.7 eV has a much larger DOS (about6 electrons/eV), with strong Al 3s contribution. Above8.5 eV, the PDOS originates mainly from Al 3p and O2p orbitals.
As we switch from one exchange-correlation functionalto another, the band gap changes, as shown in Table2. In all cases, except for the sX-LDA calculation, the α-Al2O3 crystal has a direct gap at the Γ point. The RPBEand PBESOL computations predict the same gap value,of 5.881 eV, while the LDA result is 6.594 eV. For thehybrid functionals, the closest match to experiment wasfound for B3LYP, 8.674 eV (even better than the previouscalculation by Muscat et al. [27], which have obtained8.5 eV), followed by PBE0 (8.554 eV), and HSE06 (8.088eV, about 1 eV smaller than the HSE estimate of Choiet al.[26]). The screened exchange LDA approach, incontrast, predicts an indirect gap which is very close tothe experimental data, 8.826 eV, with the maximum ofthe valence band along the Γ-F line. The Γ-Γ gap, bythe way, is just 9 meV bigger.
The ∆-sol scheme is a generalization to the solid stateof the ∆ self-consistent field approach used in molecularsystems , being based on the variation of unit cell totalenergies with the unit cell charge [36]. Its main advan-tage is the much smaller computational cost in compar-ison with hybrid functional calculations and other moreadvanced techniques for band gap correction. The ∆-solcorrected gaps for the PBE exchange-correlation familyof functionals are, in increasing order, 7.703 eV (RPBE),7.885 eV (PBE), and 8.065 (PBESOL) eV (see Table 2).For the LDA, this method improves the gap to 8.530 eV,just about 0.3 eV below the measured gap.
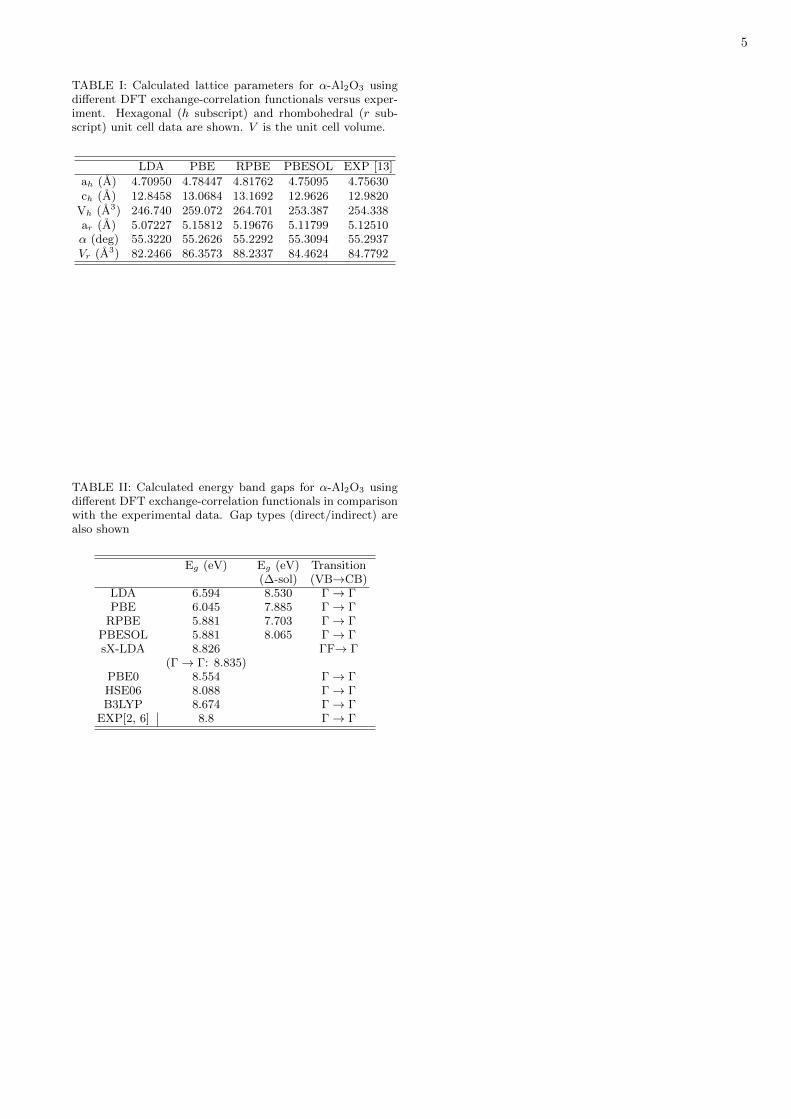
From the top (bottom) of Figure 3, one can performa comparison between the PBE and PBE0 (LDA andsX-LDA) electronic band structures in the first Brillouinzone for the rhombohedral unit cell of alumina. For thevalence band, one can see that the PBE0 hybrid func-tional shifts the band curves to lower energies relative tothe PBE data, while the conduction bands are energet-ically shifted upwards. The shapes of the band curves,however, do not change significantly. The same can be
said for the comparison between the LDA and sX-LDAoutputs, with the difference that the sX-LDA valenceband curves tend to be shifted to higher energy valuesrelative to the corresponding LDA bands.
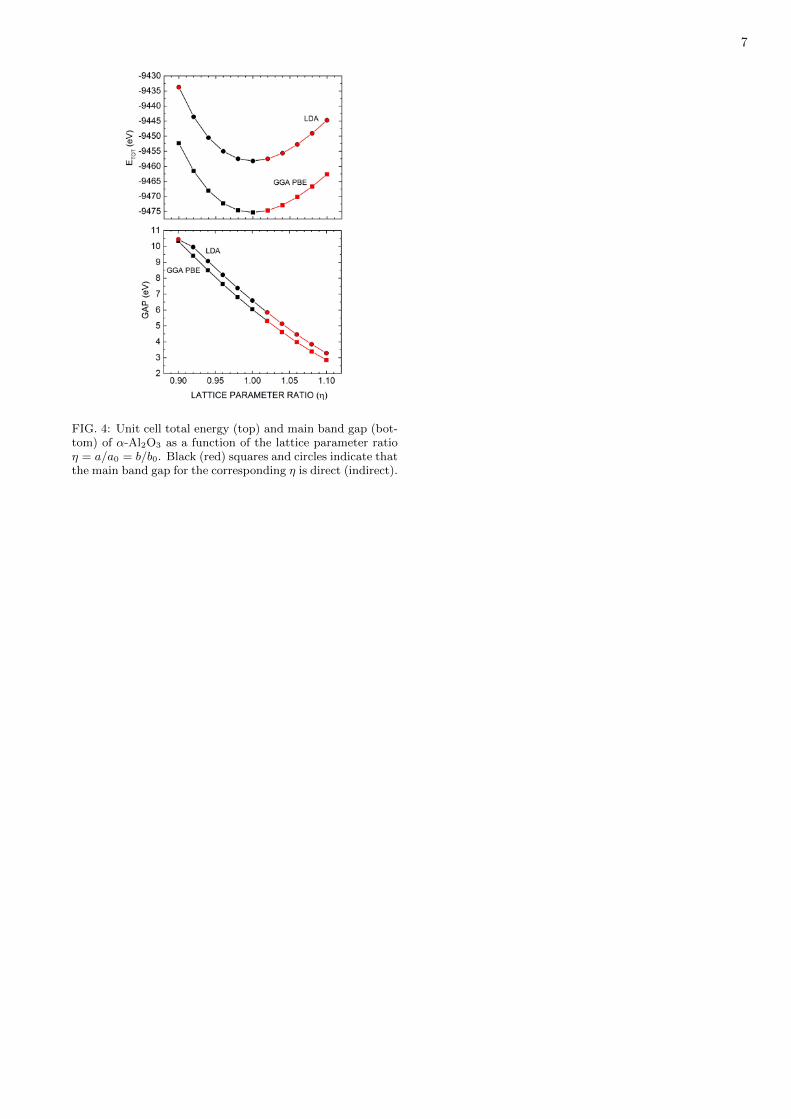
Aiming to investigate the dependence of the nature ofthe band gap with the unit cell lattice parameters, wehave performed a series of calculations using the LDAand GGA-PBE functionals starting from the previouslyoptimized structures. We started by defining a latticeparameter ratio η = a/a0 = c/c0 for the hexagonal unitcell, where a0 and c0 are the optimized values shownin Table 1. This η parameter was varied from 0.9 to1.1 (shrinking or enlarging the crystal, as η > or < 1,respectively) and the internal atomic coordinates wererelaxed for each unit cell volume thus obtained. We haveplotted the unit cell total energy and the main energyband gap as a function of η at the top and bottom partsof Figure 4. From it, one can see that the LDA totalenergy is larger than the GGA-PBE value for a given η,with both displaying a nearly parabolic shape. The mainenergy band gap Eg, on the other hand, decreases almostlinearly with η as it increases from 0.9 to 1.1. For theLDA gap curve, Eg decreases from 10.435 eV (η = 0.9)to 3.285 eV (η = 1.1), with an average rate of decrease of-3.575 eV per 0.1 η, while for the GGA-PBE case we havea maximum gap of 10.325 eV (η = 0.9) and a minimumof 2.857 eV(η = 1.1), with average rate of decrease -3.734 eV per 0.1 η. One can note, for the LDA Eg(η)curve, that the first point, corresponding to η = 0.9,has an energy gap a bit smaller than the expected fromlinear extrapolation. It is also distinct due to the factthat its minimum band gap is indirect, with the valenceband maximum at the Γ point and the conduction bandminimum at M. Indeed, for both LDA and GGA-PBEband gap curves, one can see that a slight increase of atleast 2% in the lattice parameter suffices to turn aluminainto an indirect gap insulator (see red circles and squaresat the right side of each plot in Fig. 4).
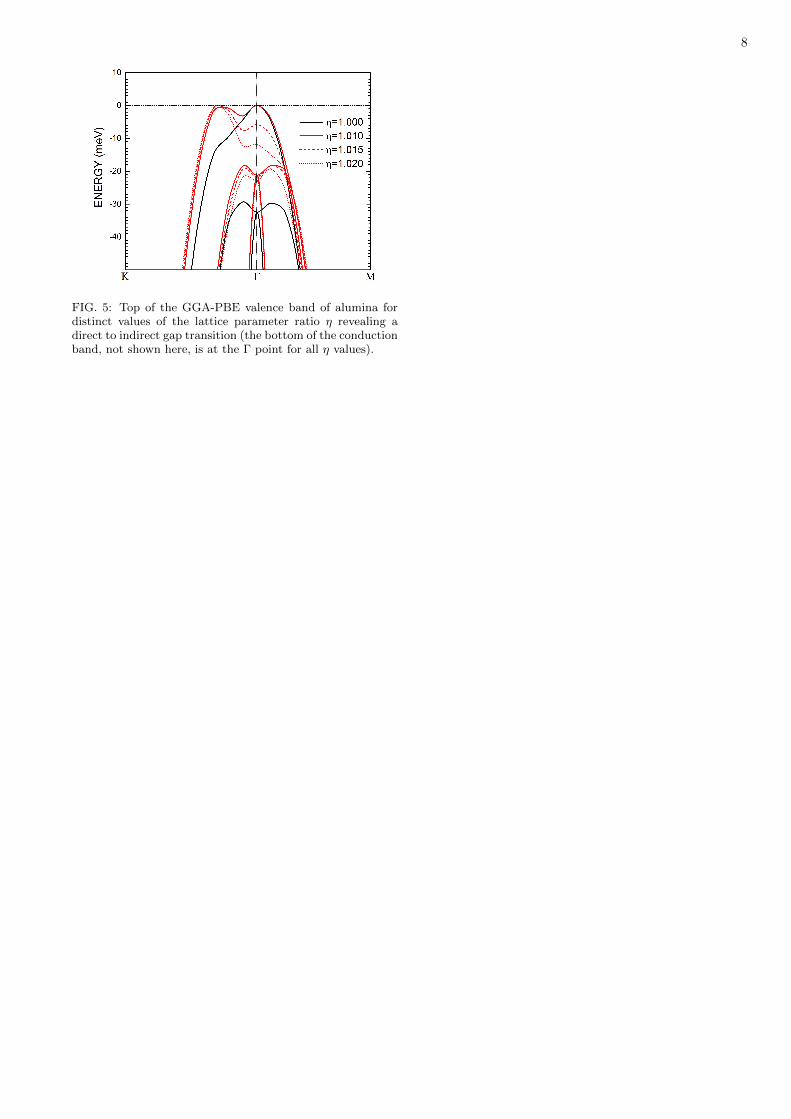
Figure 5 details the direct-indirect gap transition forunit cell optimized employing the GGA-PBE functional.At η = 1.000 one can see the valence band maximumat Γ and a small shoulder at approximately one third ofthe Γ-K line. For η = 1.010 (an increase of 1% in thelattice parameters), the shoulder turns into a secondarymaximum just 1 meV below the main maximum at Γ, andfor η = 1.015, the indirect gap is greater than the directvalue by about 6 meV. Finally, for η = 1.020, the indirectgap is 12 meV above the direct gap at the Γ point. Thevalence band curves below the uppermost valence bandare energetically shifted upwards by the increase of η. Ifone considers the results of the measurements carried outby Lucht et al. [13] of the lattice parameters of α-Al2O3
as a function of temperature, it is expected an increaseof more than 1.5% percent of a and b (using the T =4.5 K data as reference) when the temperature is closeto 400 K, so one must hope to observe the direct-indirecttransition of alumina’s main band gap as the temperatureincreases to nearly that value.
4
In summary, we have presented the result of a se-ries of DFT calculations to estimate more accuratelythe main bad gap of α-Al2O3 and to elucidate its char-acter (direct or indirect) as a function of the unit celllattice parameter. After geometry optimization, thePBESOL exchange-correlation functional has predictedthe best lattice parameters in comparison with preciseX-ray diffraction data for alumina at T=4.5 K. For theband gap, the most accurate results versus the exper-imental gap Eg = 8.8 eV were obtained by using thescreened-exchange LDA approach, which predicted an in-direct band gap of 8.826 eV and a very close direct gap of8.835 eV, followed by the B3LYP hybrid functional, withEg = 8.674 eV (direct). The PBE0 gap was 8.554 eV,while the HSE06 functional had the worst figure amongthe hybrid functionals, 8.088 eV. ∆-sol corrected gaps
were also calculated, with the LDA-∆-sol corrected gapreaching 8.53 eV, as good as the PBE0 value, notwith-standing the much cheaper computational cost of thisapproach. Direct to indirect gap transitions were ob-served for unit cells optimized using both the LDA andGGA-PBE functionals as the unit cell parameters are in-creased, with a direct-indirect transition being found inthe GGA-PBE case for an (a, c) increase of just 1.5% rel-ative to the optimized lattice parameters. This suggeststhat a subtle gap type transition as a function of temper-ature must occur for T ≈ 400 K as the lattice parametersof the crystal increase due to thermal expansion.
Acknowledgments – V.N.F. is a senior researcher fromthe Brazilian National Research Council (CNPq). E.W. S. C. received financial support from CNPq project307843/2013-0.
[1] International Technology Roadmap for Semiconductors:2012 update review (Semiconductor Industry Associa-tion, San Josa, CA). See http://public.itrs.net/.
[2] M. L. Bortz and R. H. French, Appl. Phys. Lett. 55, 1955(1989).
[3] M. E. Innocenzi, R. T. Swimm, M. Bass, R. H. French,A. B. Villaverde, M. R. Kokta, J. Appl. Phys. 67, 7542(1990).
[4] C. B. Samantaray, H. Sim, H. Hwang, App. Surf. Sci.242, 121 (2005).
[5] S. M. Hosseini, H. A. R. Aliabad, A. Kompany, Eur.Phys. J. B 43, 439 (2005).
[6] T. V. Perevalov, A. V. Shaposhnikov, V. A. Gritsenko,H. Wong, J. H. Han, and C. W. Kim, JETP Lett. 85,165 (2007).
[7] R. Ludeke, M. T. Cuberes, and E. Cartier, Appl. Phys.Lett. 76, 2886 (2000).
[8] J. Robertson, Eur. Phys. J. Appl. Phys. 28, 265 (2004).[9] A. F. Lima, J. M. Dantas, and M. V. Valic, J. Appl.
Phys. 112, 093709 (2012).[10] I. P. Batra, J. Phys. C18, 5399 (1982).[11] F. S. Galasso, Structure and Properties of Inorganic
Solids (Pergamon, New York, 1970).[12] ICSD 2003 Collection, Entry # 88029.[13] M. Lucht, M. Lerche, H.-C. Wille, Y. V. Shvyd’ko, H. D.
Ruter, E. Gerdau, P. Becker, J. Appl. Cryst. 36, 1075(2003).
[14] Y.-N. Xu and W. Y. Ching, Phys. Rev. B43, 4461 (1991).[15] W. Y. Ching, Y.-N. Xu, J. Am. Cer. Soc. 77, 404 (1994).[16] R. H. French, J. Am. Ceram. Soc. 73, 477 (1990).[17] P. W. Peacock and J. Robertson, J. Appl. Phys. 92, 4712
(2002).[18] W. Y. Ching, L. Ouyang, P. Rulis, H. Yao, Phys. Rev.
B78, 014106 (2008).[19] H. A. R. Aliabad, M. R. Benam, H. Arabshahi, Int. J.
Phys. Sci. 4, 437 (2009).[20] T. V. Perevalov, V. A. Gritsenko, Physics - Uspekhi 53,
561 (2010).[21] T. V. Perevalov, V. A. Gritsenko, V. V. Kaichev, Eur.
Phys. J. Appl. Phys. 52, 30501 (2010).[22] S. J. Mousavi, M. R. Abolhassani, S. M. Hosseini, S. A.
Sebt, Chin. J. Phys. 47, 862 (2009).
[23] K. Shiiki, M. Igarashi, H. Kaijyu, Jpn. J. App. Phys. 42,5185 (2003).
[24] H. Chang, Y. Choi, K. Kong, B.-H. Ryu, Chem. Phys.Lett. 391, 293 (2004).
[25] A. G. Marinopoulos, M. Gruning, Phys. Rev. B 83,195129 (2011).
[26] M. Choi, A. Janotti, C. G. Van de Walle, J. Appl. Phys.113, 044501 (2013).
[27] J. Muscat, A. Wander, N. M. Harrison, Chem. Phys.Lett. 342, 397 (2001).
[28] D. M. Ceperley, B. J. Alder, Phys. Rev. Lett. 45, 566(1980).
[29] J. P. Perdew, K. Burke, M. Ernzerhof, Phys. Rev. Lett.77, 3865 (1996).
[30] B. Hammer, L. B. Hansen, J. K. Norskov, Phys. Rev. B59, 7413 (1999).
[31] J. P. Perdew, A. Ruzsinszky, G. I. Csonka, O. A. Vydrov,G. E. Scuseria, L. A. Constantin, X. Zhou, K. Burke,Phys. Rev. Lett. 100, 136406 (2008).
[32] A. Seidl, A. Gorling, P. Vogl, J. A. Majewski, M. Levy,Phys. Rev. B 53, 3764 (1996).
[33] C. Adamo, V. Barony, J. Chem. Phys. 110, 6158 (1998).[34] A. V. Krukau, O. A. Vydrov, A. F. Izmaylov, G. E. Scuse-
ria, J. Chem. Phys. 125, 224106 (2006).[35] A. D. Becke, J. Chem. Phys. 98, 5648 (1993).[36] M. K. Y. Chan, G. Ceder, Phys. Rev. Lett. 105, 196403
(2010).[37] S. J. Clark, M. D. Segall, C. J. Pickard, P. J. Hasnip, M.
J. Probert, K. Refson, M. C. Payne, Z. Kristall. 220, 567(2005).
5
TABLE I: Calculated lattice parameters for α-Al2O3 usingdifferent DFT exchange-correlation functionals versus exper-iment. Hexagonal (h subscript) and rhombohedral (r sub-script) unit cell data are shown. V is the unit cell volume.
LDA PBE RPBE PBESOL EXP [13]
ah (A) 4.70950 4.78447 4.81762 4.75095 4.75630ch (A) 12.8458 13.0684 13.1692 12.9626 12.9820
Vh (A3) 246.740 259.072 264.701 253.387 254.338ar (A) 5.07227 5.15812 5.19676 5.11799 5.12510α (deg) 55.3220 55.2626 55.2292 55.3094 55.2937Vr (A3) 82.2466 86.3573 88.2337 84.4624 84.7792
TABLE II: Calculated energy band gaps for α-Al2O3 usingdifferent DFT exchange-correlation functionals in comparisonwith the experimental data. Gap types (direct/indirect) arealso shown
Eg (eV) Eg (eV) Transition(∆-sol) (VB→CB)
LDA 6.594 8.530 Γ → ΓPBE 6.045 7.885 Γ → Γ
RPBE 5.881 7.703 Γ → ΓPBESOL 5.881 8.065 Γ → ΓsX-LDA 8.826 ΓF→ Γ
(Γ → Γ: 8.835)PBE0 8.554 Γ → ΓHSE06 8.088 Γ → ΓB3LYP 8.674 Γ → Γ
EXP[2, 6] 8.8 Γ → Γ
6
FIG. 1: Hexagonal (top) and rhombohedral (bottom) unit cellrepresentations of α-Al2O3 are shown at the left side, whilethe corresponding first Brillouin zones are shown at the rightside. High symmetry points and reciprocal lattice axis aredepicted as well.
FIG. 2: Close-up of the GGA-PBE Kohn-Sham band struc-ture (left) and respective partial density of states (right) nearthe main band gap of α-Al2O3 (hexagonal unit cell).
FIG. 3: Top: PBE and PBE0 band structures near the mainband gap of α-Al2O3 (rhombohedral unit cell). Bottom: thesame for the LDA and sX-LDA band structures.
7
FIG. 4: Unit cell total energy (top) and main band gap (bot-tom) of α-Al2O3 as a function of the lattice parameter ratioη = a/a0 = b/b0. Black (red) squares and circles indicate thatthe main band gap for the corresponding η is direct (indirect).
8
FIG. 5: Top of the GGA-PBE valence band of alumina fordistinct values of the lattice parameter ratio η revealing adirect to indirect gap transition (the bottom of the conductionband, not shown here, is at the Γ point for all η values).