Lecture on the 'Greek economic crisis' to UNAM and 4 other Latin American universities
42
Stavros D. Mavroudeas Dept. of Economics University of Macedonia e-mail: [email protected] Web: http//stavrosmavroudeas.wordpress.com 29/4/2015 UNAM - Universidad Nacional Autonoma de Mexico UCA - Centro America University (at El Salvador) Universidade Federal de Mato Grosso Sul (Brazil) Universidad Central de Venezuela Universidad Bolivariana de Venezuela
-
Upload
stavros-mavroudeas -
Category
Economy & Finance
-
view
1.024 -
download
1
Transcript of Lecture on the 'Greek economic crisis' to UNAM and 4 other Latin American universities
Stavros D. MavroudeasDept. of Economics
University of Macedoniae-mail: [email protected]
Web: http//stavrosmavroudeas.wordpress.com
29/4/2015UNAM - Universidad Nacional Autonoma de MexicoUCA - Centro America University (at El Salvador) Universidade Federal de Mato Grosso Sul (Brazil)Universidad Central de VenezuelaUniversidad Bolivariana de Venezuela
Based on
Mavroudeas S. & Paitaridis D. (2014), ‘The Greek crisis: a dual crisis of overaccumulation and imperialist exploitation’
in
Mavroudeas S. (ed.), Greek capitalism in crisis: Marxist Analyses, London: Routledge

Structure of the lecture
(1) Competing explanations of the Greek crisis
(2) A Marxist explanation: basic features
(3) An empirical investigation based on profitability
(4) An analysis of empirical findings
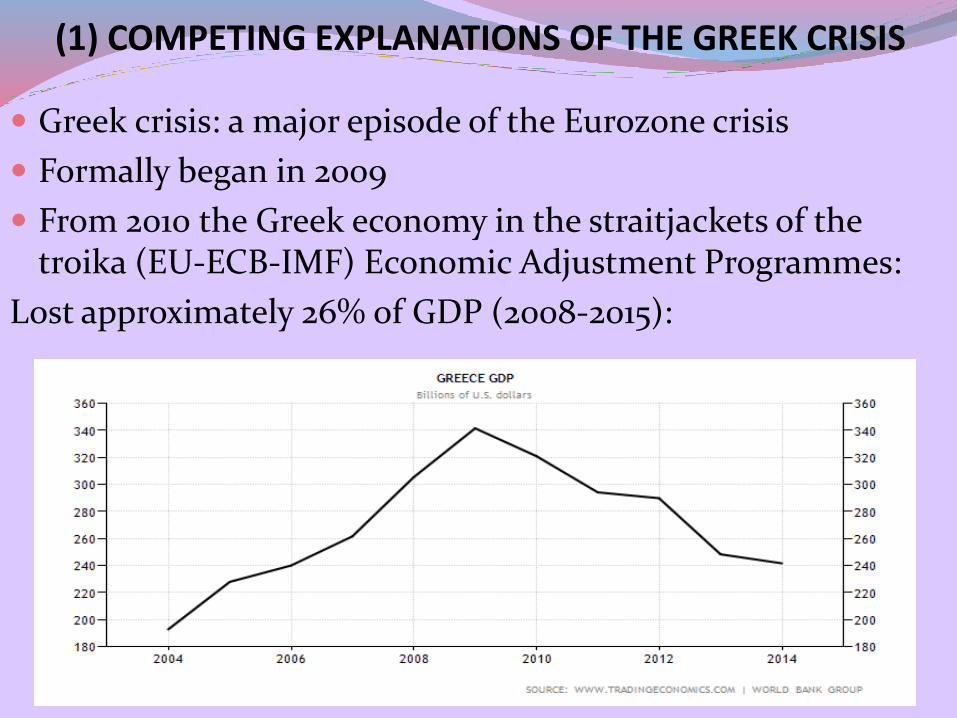
(1) COMPETING EXPLANATIONS OF THE GREEK CRISIS
Greek crisis: a major episode of the Eurozone crisis
Formally began in 2009
From 2010 the Greek economy in the straitjackets of the troika (EU-ECB-IMF) Economic Adjustment Programmes:
Lost approximately 26% of GDP (2008-2015):
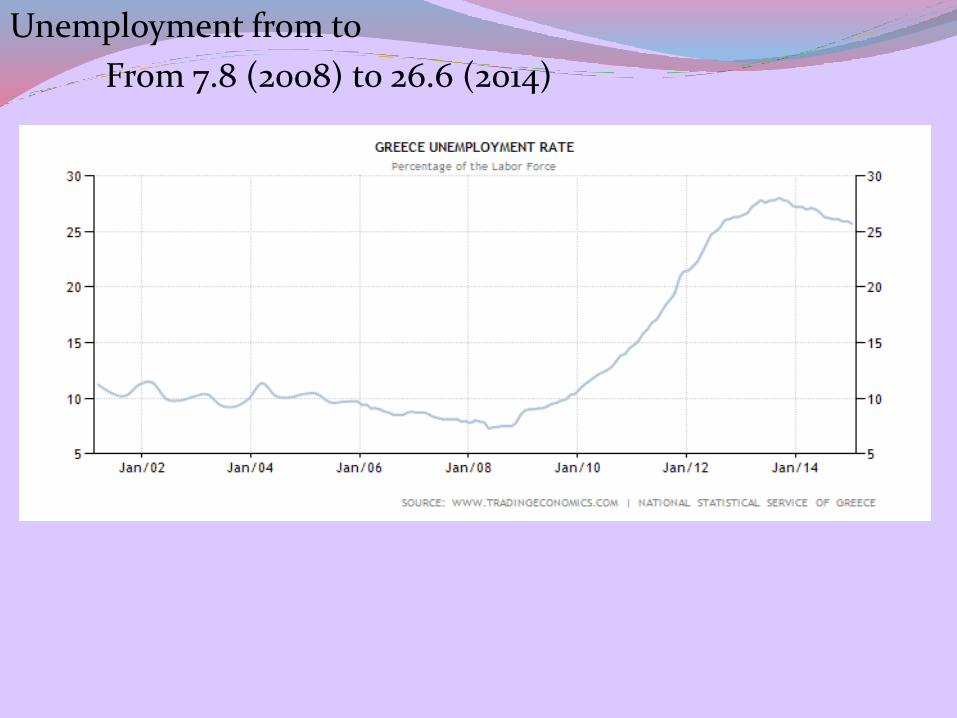
Unemployment from to
From 7.8 (2008) to 26.6 (2014)
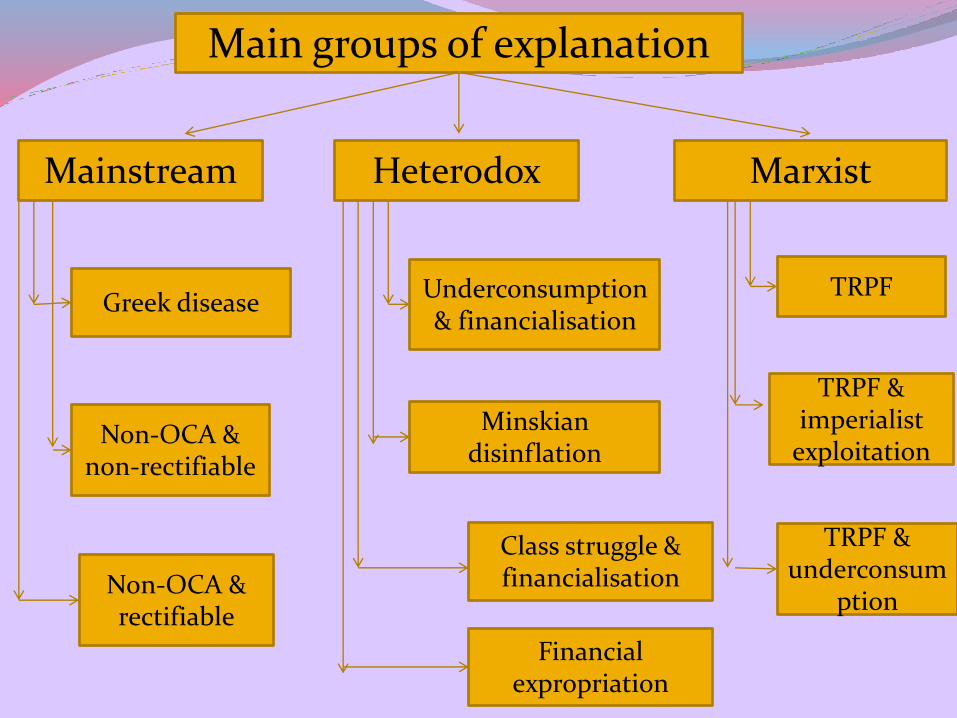
Main groups of explanation
Mainstream
Greek disease
Heterodox Marxist
Non-OCA & rectifiable
Non-OCA & non-rectifiable
Financial expropriation
Class struggle & financialisation
Minskiandisinflation
Underconsumption& financialisation
TRPF & underconsum
ption
TRPF
TRPF & imperialist
exploitation
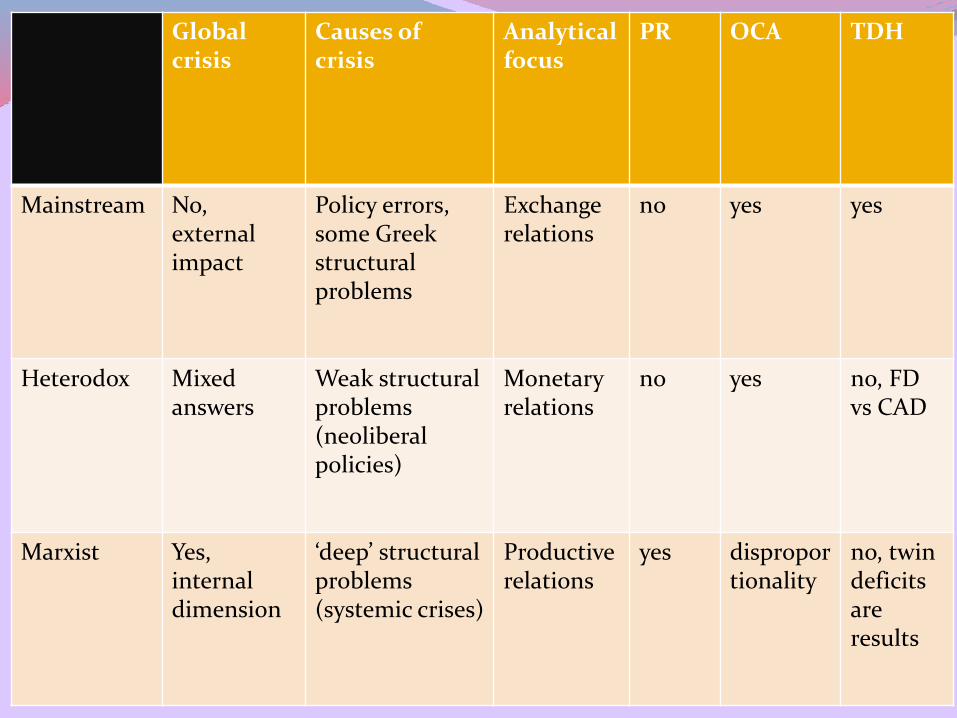
Global crisis
Causes of crisis
Analytical focus
PR OCA TDH
Mainstream No, external impact
Policy errors, some Greek structuralproblems
Exchange relations
no yes yes
Heterodox Mixed answers
Weak structural problems (neoliberal policies)
Monetary relations
no yes no, FDvs CAD
Marxist Yes, internal dimension
‘deep’ structural problems (systemic crises)
Productive relations
yes disproportionality
no, twin deficits are results
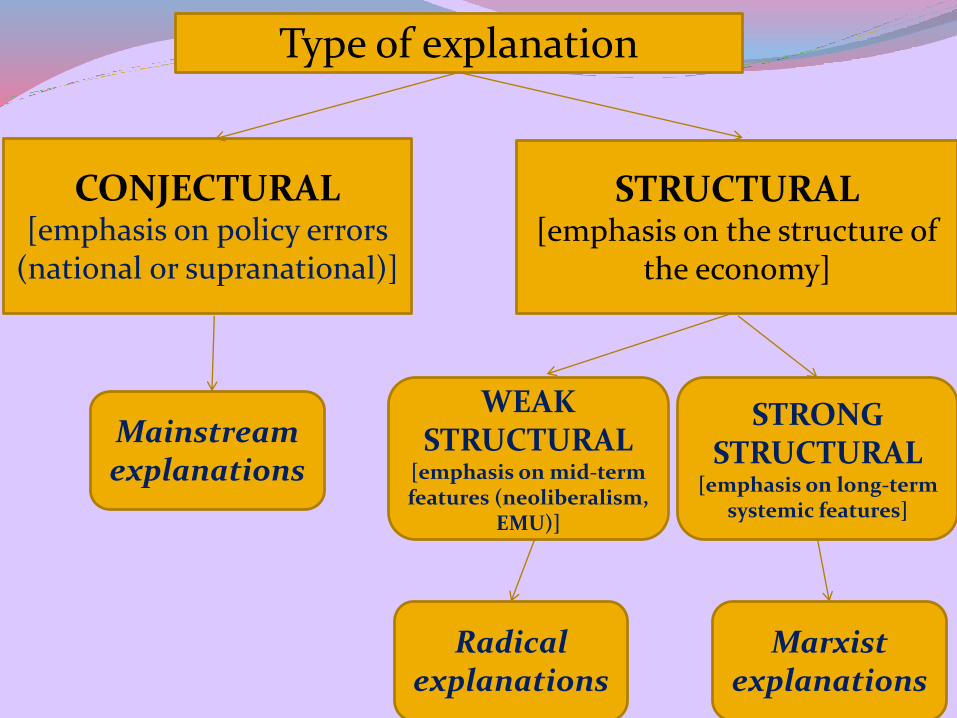
Type of explanation
CONJECTURAL[emphasis on policy errors
(national or supranational)]
STRUCTURAL[emphasis on the structure of
the economy]
Mainstream explanations
WEAK STRUCTURAL
[emphasis on mid-term features (neoliberalism,
EMU)]
STRONG STRUCTURAL
[emphasis on long-term systemic features]
Radical explanations
Marxist explanations
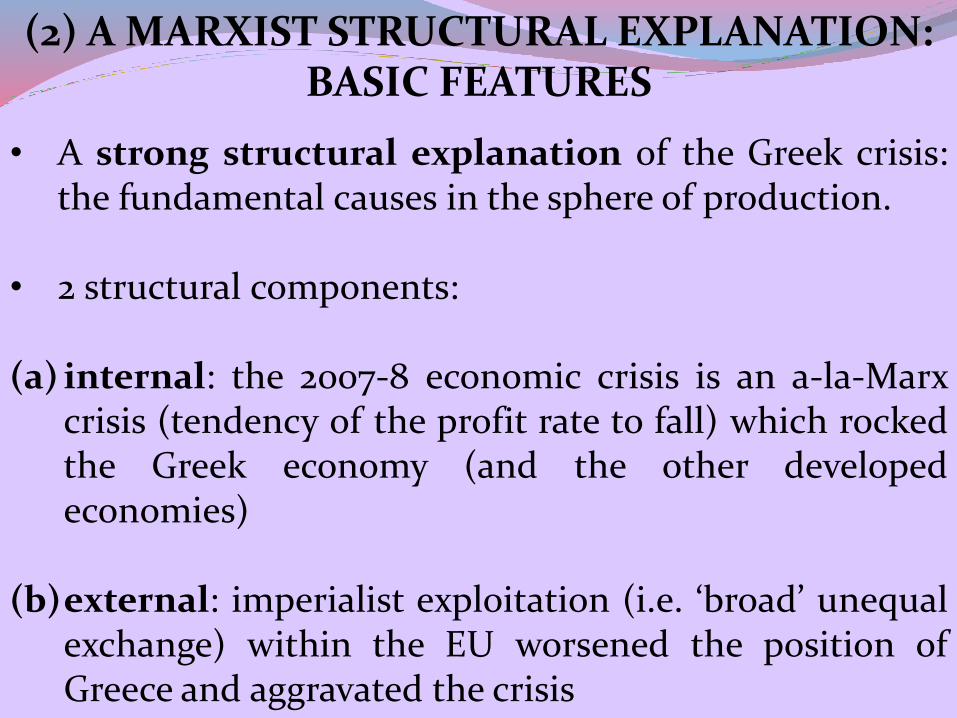
(2) A MARXIST STRUCTURAL EXPLANATION:BASIC FEATURES
• A strong structural explanation of the Greek crisis:the fundamental causes in the sphere of production.
• 2 structural components:
(a) internal: the 2007-8 economic crisis is an a-la-Marxcrisis (tendency of the profit rate to fall) which rockedthe Greek economy (and the other developedeconomies)
(b)external: imperialist exploitation (i.e. ‘broad’ unequalexchange) within the EU worsened the position ofGreece and aggravated the crisis
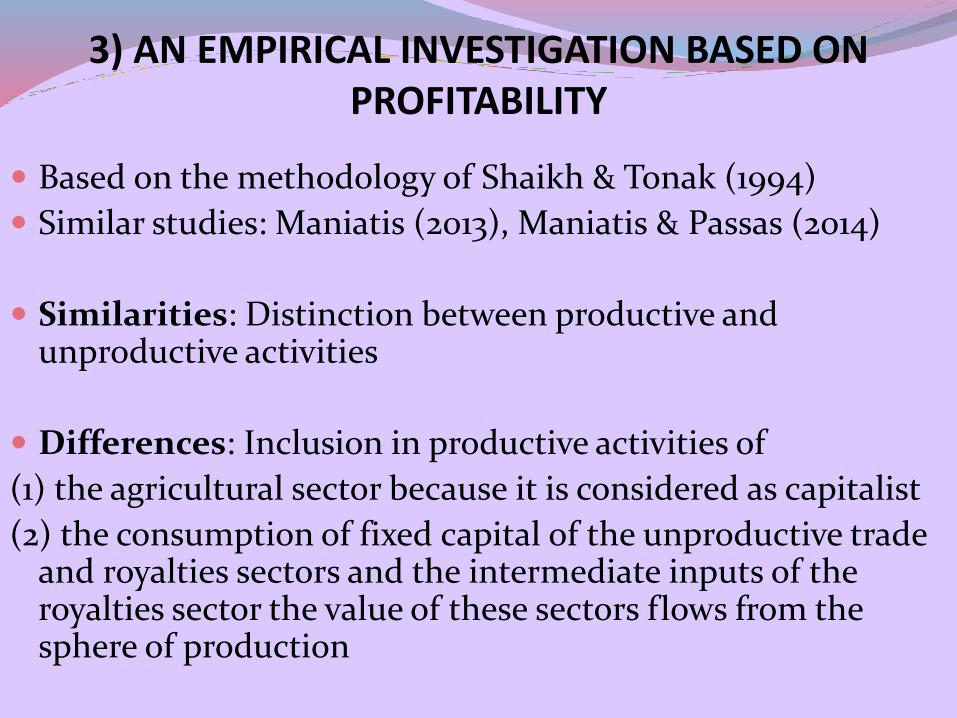
3) AN EMPIRICAL INVESTIGATION BASED ON PROFITABILITY
Based on the methodology of Shaikh & Tonak (1994)
Similar studies: Maniatis (2013), Maniatis & Passas (2014)
Similarities: Distinction between productive and unproductive activities
Differences: Inclusion in productive activities of
(1) the agricultural sector because it is considered as capitalist
(2) the consumption of fixed capital of the unproductive trade and royalties sectors and the intermediate inputs of the royalties sector the value of these sectors flows from the sphere of production
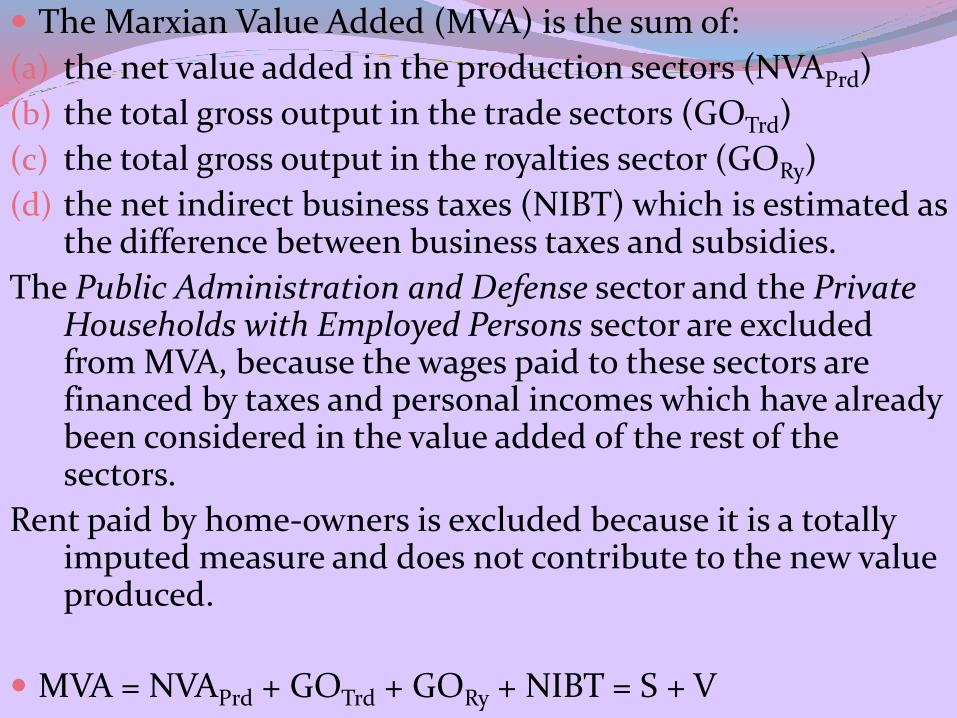
The Marxian Value Added (MVA) is the sum of:
(a) the net value added in the production sectors (NVAPrd)
(b) the total gross output in the trade sectors (GOTrd)
(c) the total gross output in the royalties sector (GORy)
(d) the net indirect business taxes (NIBT) which is estimated as the difference between business taxes and subsidies.
The Public Administration and Defense sector and the Private Households with Employed Persons sector are excluded from MVA, because the wages paid to these sectors are financed by taxes and personal incomes which have already been considered in the value added of the rest of the sectors.
Rent paid by home-owners is excluded because it is a totally imputed measure and does not contribute to the new value produced.
MVA = NVAPrd + GOTrd + GORy + NIBT = S + V
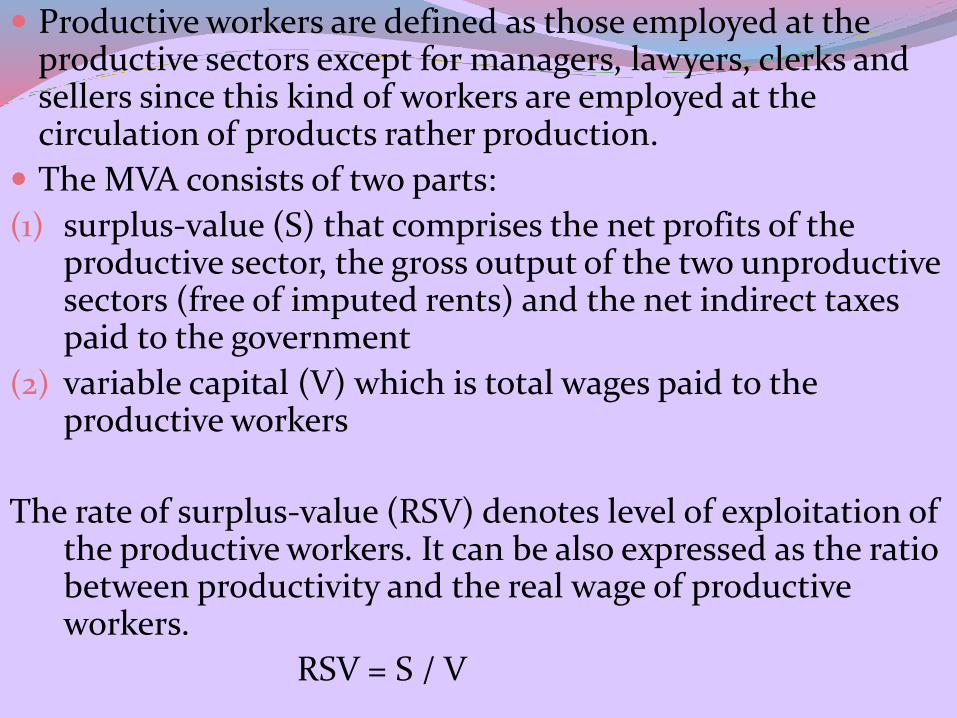
Productive workers are defined as those employed at the productive sectors except for managers, lawyers, clerks and sellers since this kind of workers are employed at the circulation of products rather production.
The MVA consists of two parts:
(1) surplus-value (S) that comprises the net profits of the productive sector, the gross output of the two unproductive sectors (free of imputed rents) and the net indirect taxes paid to the government
(2) variable capital (V) which is total wages paid to the productive workers
The rate of surplus-value (RSV) denotes level of exploitation of the productive workers. It can be also expressed as the ratio between productivity and the real wage of productive workers.
RSV = S / V
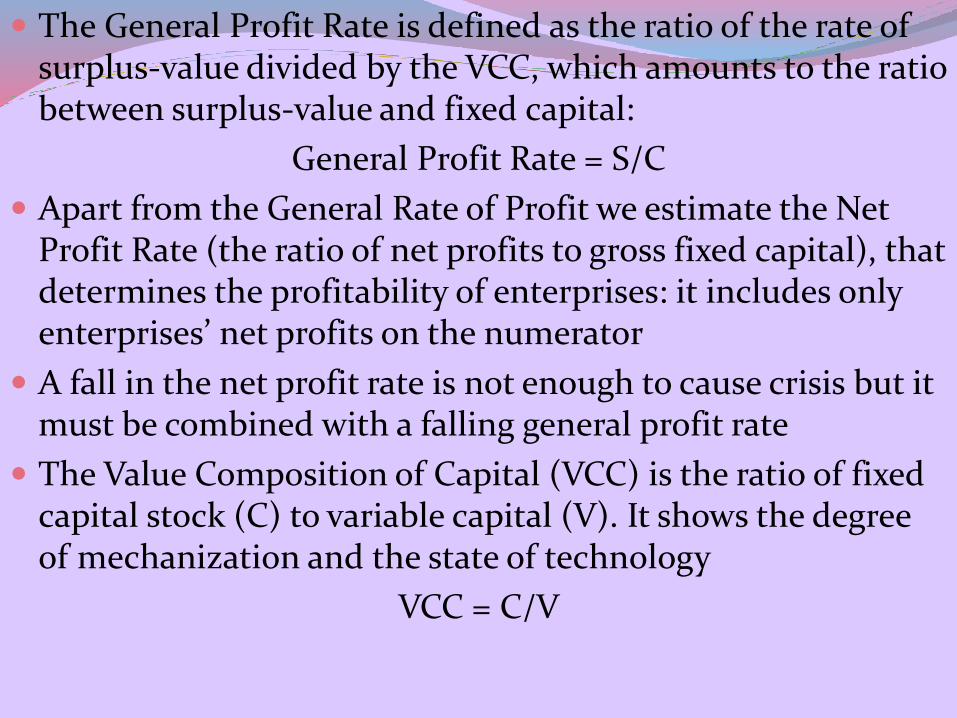
The General Profit Rate is defined as the ratio of the rate of surplus-value divided by the VCC, which amounts to the ratio between surplus-value and fixed capital:
General Profit Rate = S/C
Apart from the General Rate of Profit we estimate the Net Profit Rate (the ratio of net profits to gross fixed capital), that determines the profitability of enterprises: it includes only enterprises’ net profits on the numerator
A fall in the net profit rate is not enough to cause crisis but it must be combined with a falling general profit rate
The Value Composition of Capital (VCC) is the ratio of fixed capital stock (C) to variable capital (V). It shows the degree of mechanization and the state of technology
VCC = C/V
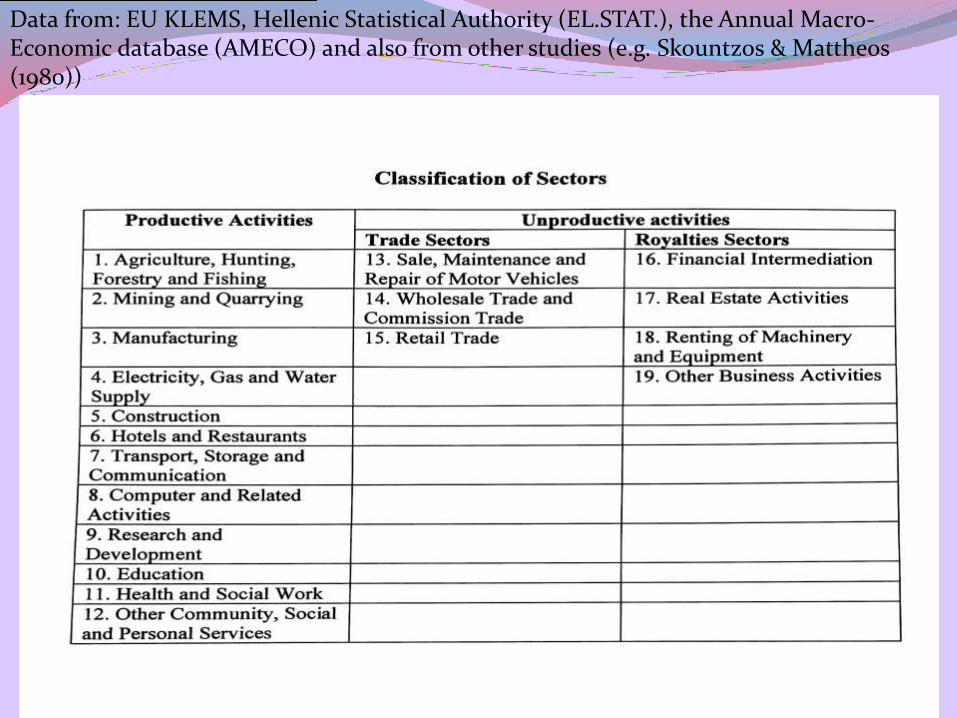
Data from: EU KLEMS, Hellenic Statistical Authority (EL.STAT.), the Annual Macro-Economic database (AMECO) and also from other studies (e.g. Skountzos & Mattheos(1980))
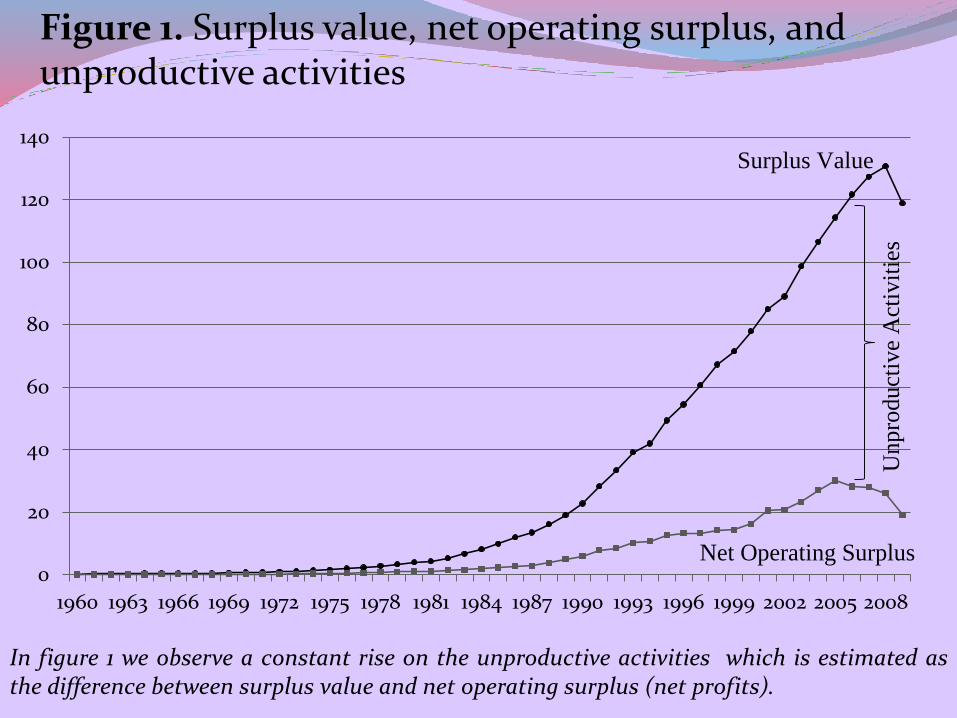
Figure 1. Surplus value, net operating surplus, and unproductive activities
0
20
40
60
80
100
120
140
1960 1963 1966 1969 1972 1975 1978 1981 1984 1987 1990 1993 1996 1999 2002 2005 2008
Surplus Value
Net Operating Surplus
Unpro
duct
ive
Act
ivit
ies
In figure 1 we observe a constant rise on the unproductive activities which is estimated asthe difference between surplus value and net operating surplus (net profits).
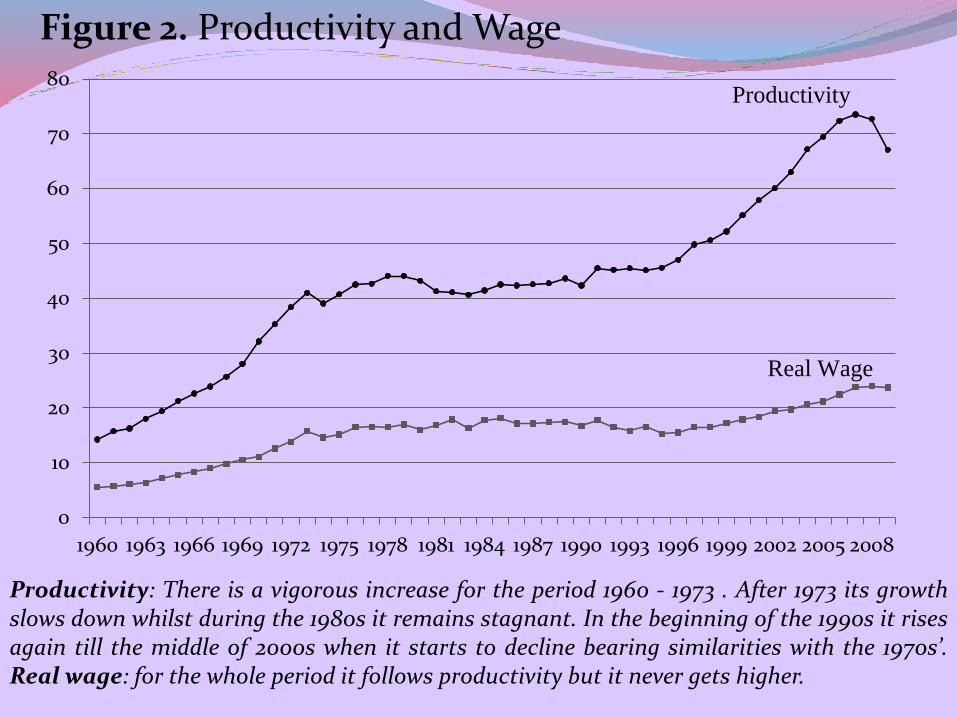
Figure 2. Productivity and Wage
0
10
20
30
40
50
60
70
80
1960 1963 1966 1969 1972 1975 1978 1981 1984 1987 1990 1993 1996 1999 2002 2005 2008
Productivity
Real Wage
Productivity: There is a vigorous increase for the period 1960 - 1973 . After 1973 its growthslows down whilst during the 1980s it remains stagnant. In the beginning of the 1990s it risesagain till the middle of 2000s when it starts to decline bearing similarities with the 1970s’.Real wage: for the whole period it follows productivity but it never gets higher.
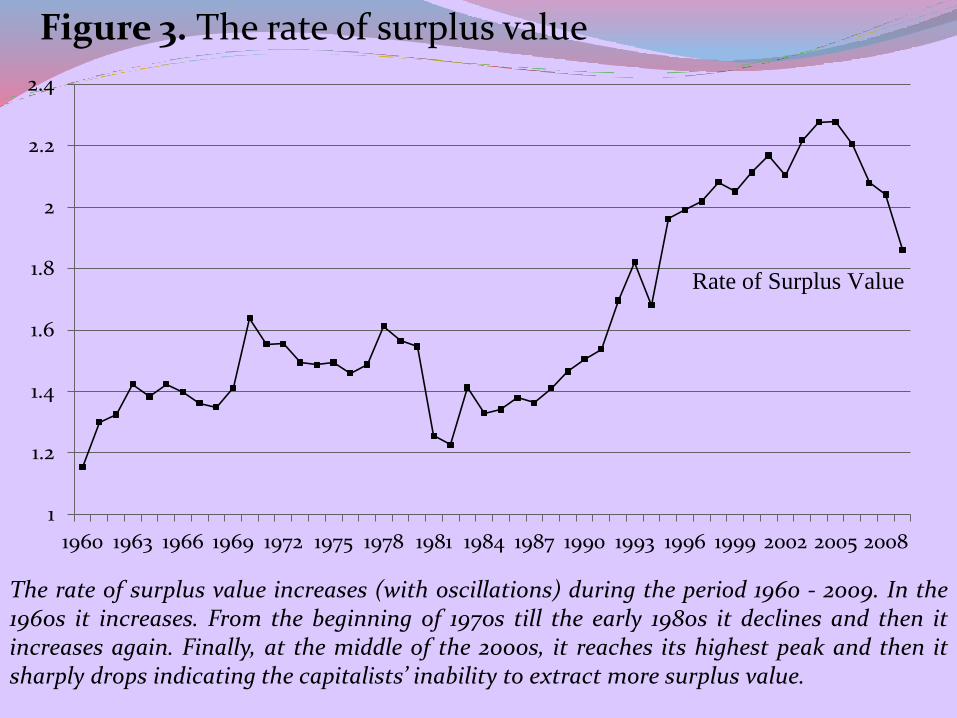
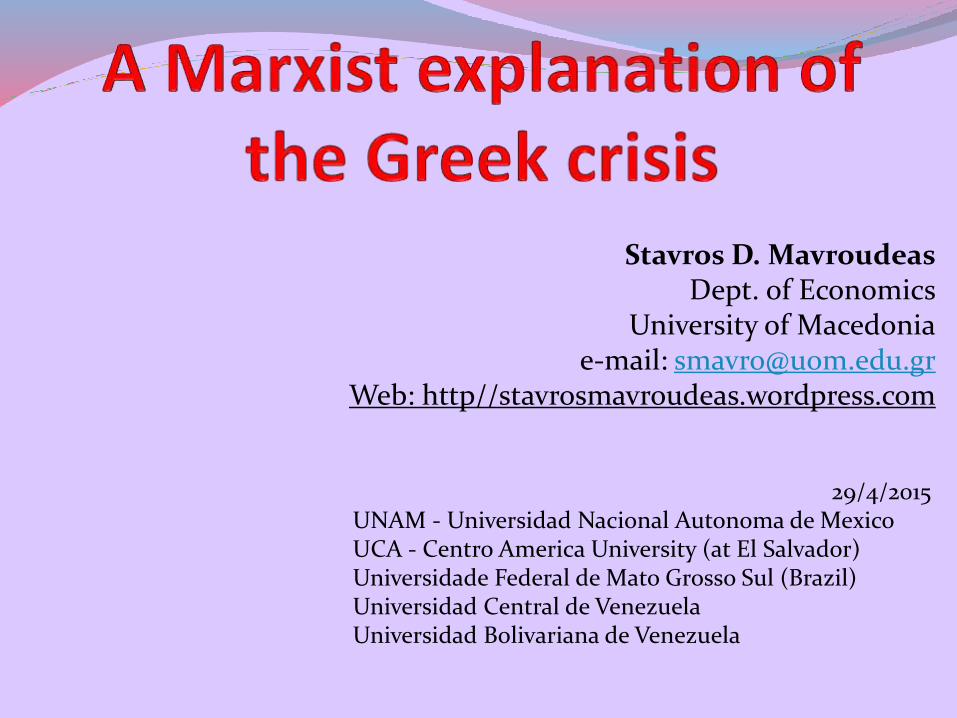
Figure 3. The rate of surplus value
1
1.2
1.4
1.6
1.8
2
2.2
2.4
1960 1963 1966 1969 1972 1975 1978 1981 1984 1987 1990 1993 1996 1999 2002 2005 2008
Rate of Surplus Value
The rate of surplus value increases (with oscillations) during the period 1960 - 2009. In the1960s it increases. From the beginning of 1970s till the early 1980s it declines and then itincreases again. Finally, at the middle of the 2000s, it reaches its highest peak and then itsharply drops indicating the capitalists’ inability to extract more surplus value.
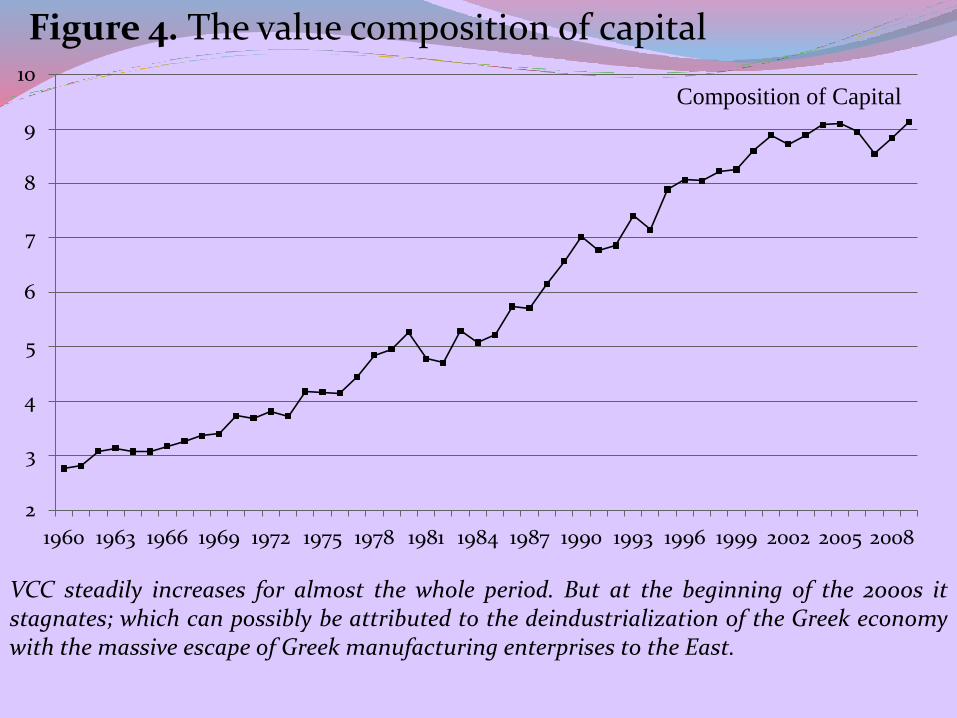
Figure 4. The value composition of capital
2
3
4
5
6
7
8
9
10
1960 1963 1966 1969 1972 1975 1978 1981 1984 1987 1990 1993 1996 1999 2002 2005 2008
Composition of Capital
VCC steadily increases for almost the whole period. But at the beginning of the 2000s itstagnates; which can possibly be attributed to the deindustrialization of the Greek economywith the massive escape of Greek manufacturing enterprises to the East.
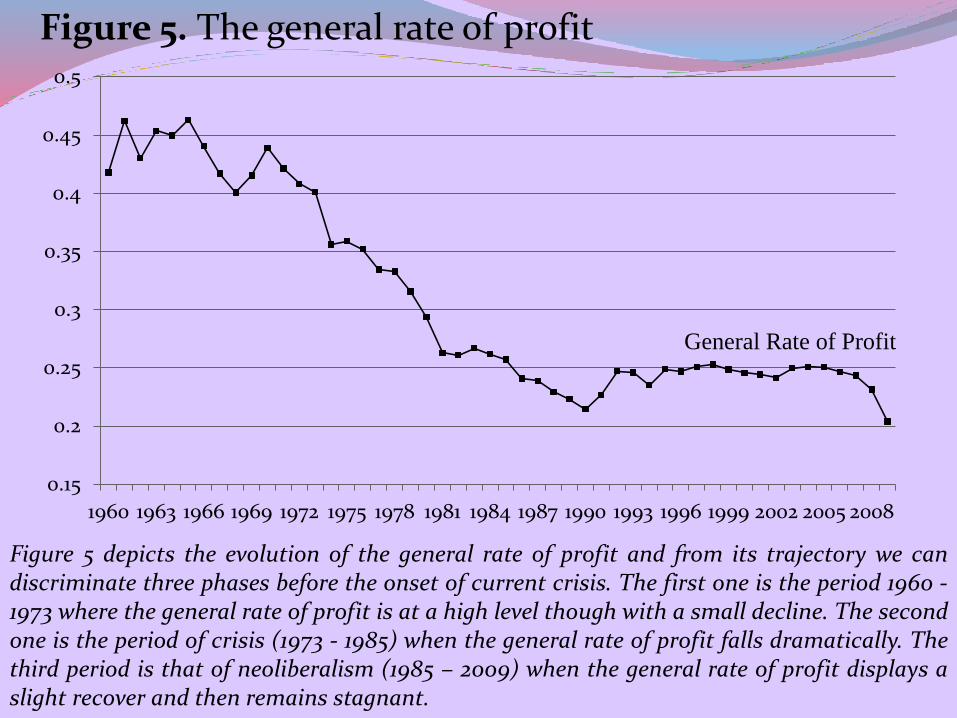
Figure 5. The general rate of profit
0.15
0.2
0.25
0.3
0.35
0.4
0.45
0.5
1960 1963 1966 1969 1972 1975 1978 1981 1984 1987 1990 1993 1996 1999 2002 2005 2008
General Rate of Profit
Figure 5 depicts the evolution of the general rate of profit and from its trajectory we candiscriminate three phases before the onset of current crisis. The first one is the period 1960 -1973 where the general rate of profit is at a high level though with a small decline. The secondone is the period of crisis (1973 - 1985) when the general rate of profit falls dramatically. Thethird period is that of neoliberalism (1985 – 2009) when the general rate of profit displays aslight recover and then remains stagnant.
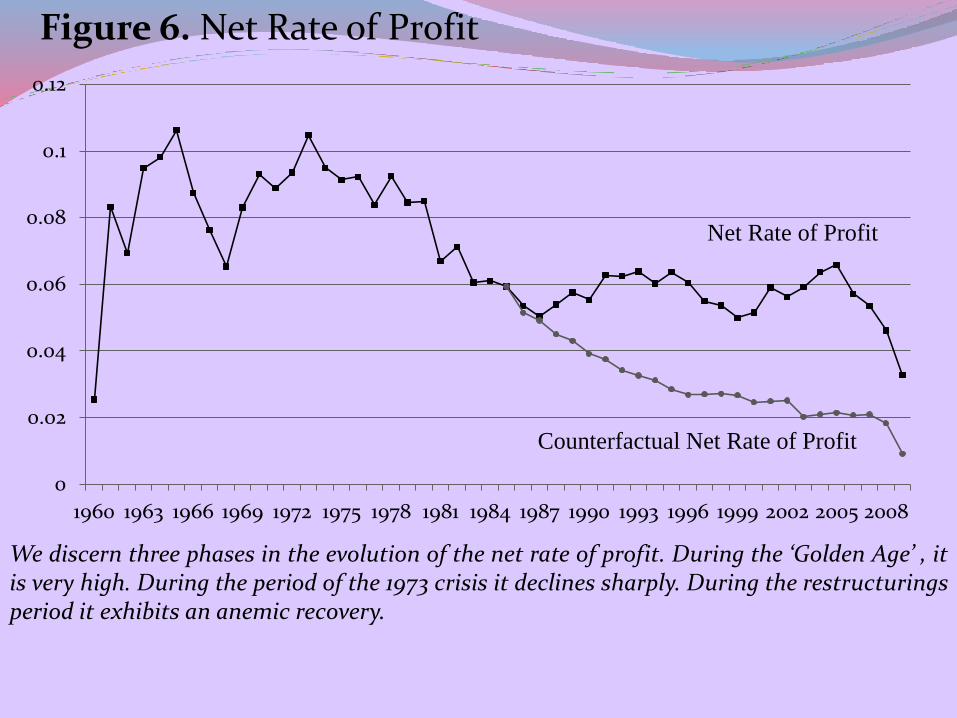
Figure 6. Net Rate of Profit
0
0.02
0.04
0.06
0.08
0.1
0.12
1960 1963 1966 1969 1972 1975 1978 1981 1984 1987 1990 1993 1996 1999 2002 2005 2008
Net Rate of Profit
Counterfactual Net Rate of Profit
We discern three phases in the evolution of the net rate of profit. During the ‘Golden Age’ , itis very high. During the period of the 1973 crisis it declines sharply. During the restructuringsperiod it exhibits an anemic recovery.
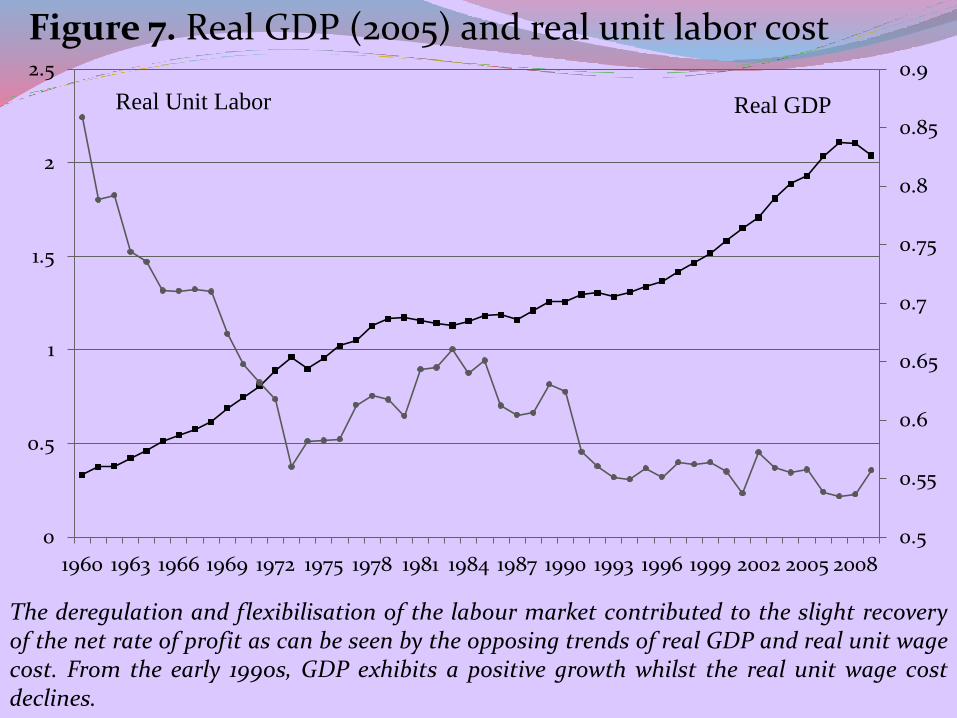
Figure 7. Real GDP (2005) and real unit labor cost
0.5
0.55
0.6
0.65
0.7
0.75
0.8
0.85
0.9
0
0.5
1
1.5
2
2.5
1960 1963 1966 1969 1972 1975 1978 1981 1984 1987 1990 1993 1996 1999 2002 2005 2008
Real GDPReal Unit Labor
The deregulation and flexibilisation of the labour market contributed to the slight recoveryof the net rate of profit as can be seen by the opposing trends of real GDP and real unit wagecost. From the early 1990s, GDP exhibits a positive growth whilst the real unit wage costdeclines.

Figure 8. Net operating surplus and net investment at 2005 prices
0
5000
10000
15000
20000
25000
30000
35000
1960 1963 1966 1969 1972 1975 1978 1981 1984 1987 1990 1993 1996 1999 2002 2005 2008
Net Operating Surplus
Net Investment
The net investment (measured at 2005 prices) increased considerably in the mid-1990s,reaching its highest peak at 2007. At the same time an analogous growth is exhibited by thenet operating surplus (measured at 2005 prices). Eventually, net investment falls in 2007 andit is associated with the stagnation on the mass of profits. Concluding, a fall in the net rateof profit is not enough to cause crisis but it must be combined with a falling general rate ofprofit.
The external dimensionThe ‘internal’ cause of Greek capitalism’s crisis was aggravated by the ‘external’ imperialist economic exploitation from the more developed euro-core countries. This took place through two conduits:
(a) A structural channel: Greek capitals compete within the Common Market with more developed capitals. This results in a ‘broad’ qual exchange (Emmanouel (1972)) that benefits the latter.
(b) A policy channel: By, directly or indirectly, ceding the control of monetary, fiscal and trade policy to the EU Greek capitalism lost critical means for supporting its competitiveness and development.

The structural channelIt results from the significant differences between Greek
capitalism’s and its euro-core peers productive structuresThe equalization of the rates of profit redistributes the
surplus value produced among capitalists, either from capitalists with lower OCC to those with higher OCC or from capitalists with higher to those with lower rates of exploitation (Carchedi (2001))
This holds within a national economy and within a multi-national common market like the EU
Greek capitalism has a lower OCC and a higher rate of exploitation
Consequently, euro-core capitals reap extra-profits through the value transfers from their euro-periphery competitors
This ‘broad’ unequal exchange is reflected in the Terms of Trade (ToT) between them and in a worsening trade balance for the latter
This channel is additional reinforced by the dominance of euro-core oligopolies in the Common Market that reap also monopolist extra-profits.
The policy channel
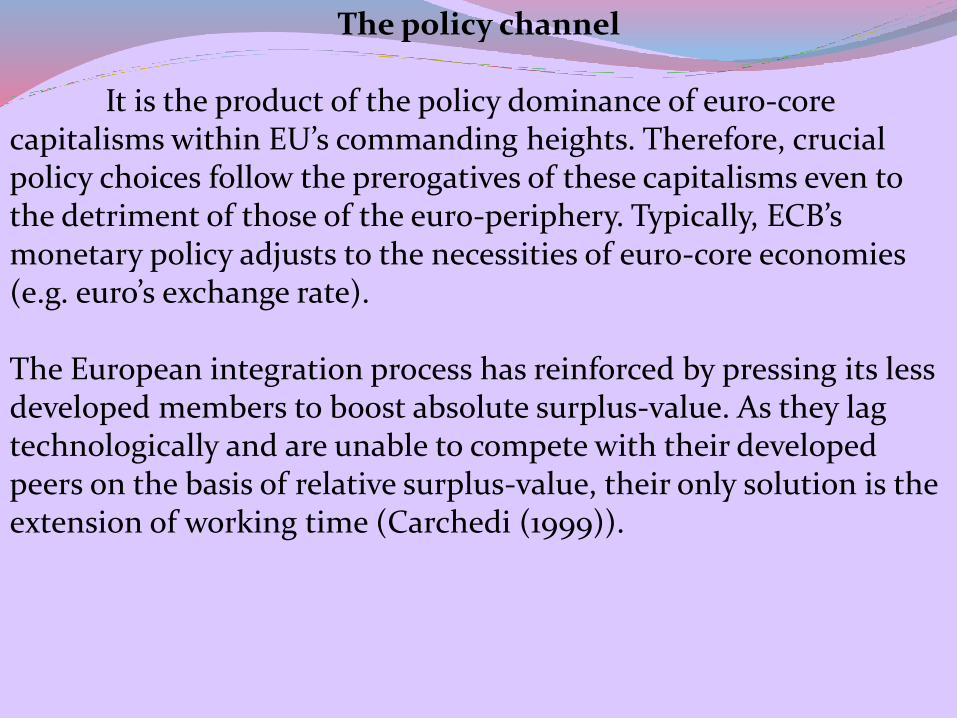
It is the product of the policy dominance of euro-core capitalisms within EU’s commanding heights. Therefore, crucial policy choices follow the prerogatives of these capitalisms even to the detriment of those of the euro-periphery. Typically, ECB’s monetary policy adjusts to the necessities of euro-core economies (e.g. euro’s exchange rate).
The European integration process has reinforced by pressing its less developed members to boost absolute surplus-value. As they lag technologically and are unable to compete with their developed peers on the basis of relative surplus-value, their only solution is the extension of working time (Carchedi (1999)).
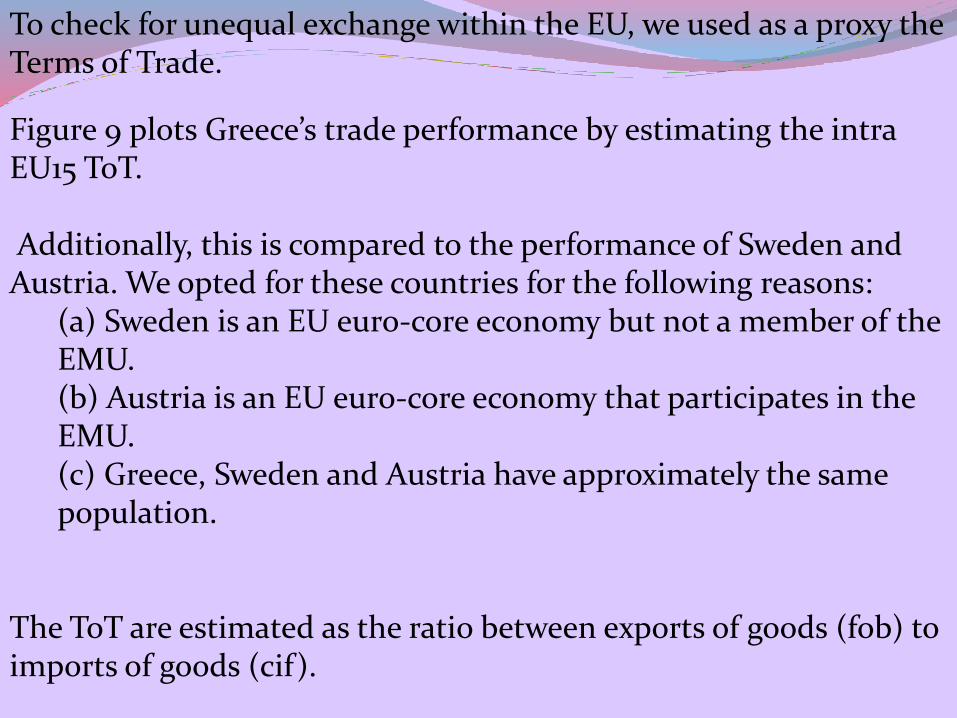
To check for unequal exchange within the EU, we used as a proxy the Terms of Trade.
Figure 9 plots Greece’s trade performance by estimating the intra EU15 ToT.
Additionally, this is compared to the performance of Sweden and Austria. We opted for these countries for the following reasons:
(a) Sweden is an EU euro-core economy but not a member of the EMU.(b) Austria is an EU euro-core economy that participates in the EMU.(c) Greece, Sweden and Austria have approximately the same population.
The ToT are estimated as the ratio between exports of goods (fob) to imports of goods (cif).

Figure 9. Intra EU15 terms of trade
0.2
0.3
0.4
0.5
0.6
0.7
0.8
0.9
1
1.1
1.2
1963 1966 1969 1972 1975 1978 1981 1984 1987 1990 1993 1996 1999 2002 2005 2008
Sweden
Austria
Greece
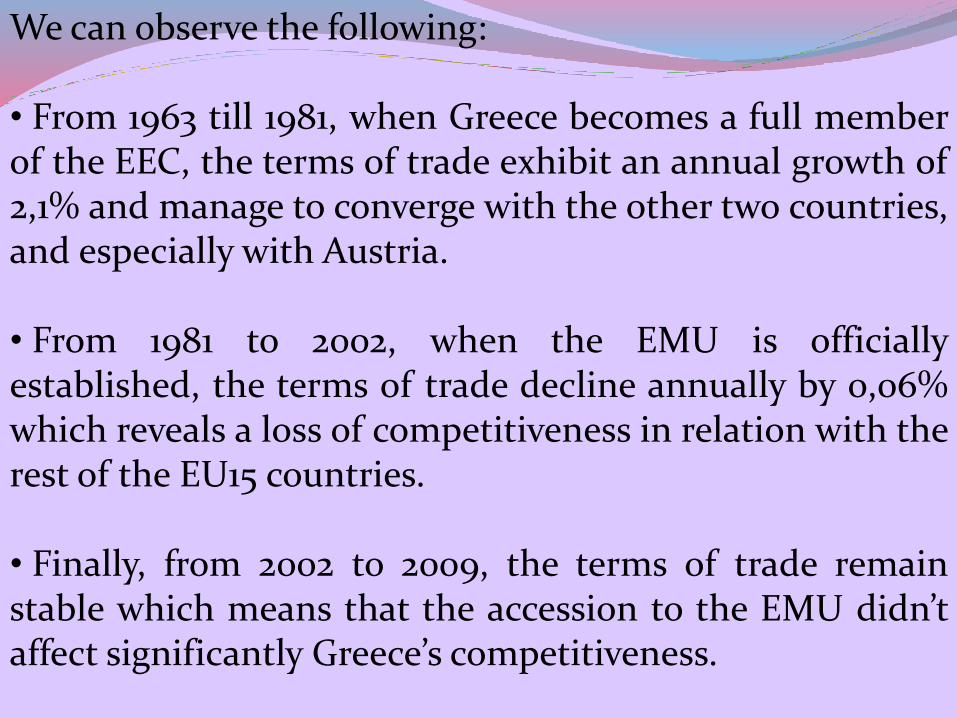
We can observe the following:
• From 1963 till 1981, when Greece becomes a full memberof the EEC, the terms of trade exhibit an annual growth of2,1% and manage to converge with the other two countries,and especially with Austria.
• From 1981 to 2002, when the EMU is officiallyestablished, the terms of trade decline annually by 0,06%which reveals a loss of competitiveness in relation with therest of the EU15 countries.
• Finally, from 2002 to 2009, the terms of trade remainstable which means that the accession to the EMU didn’taffect significantly Greece’s competitiveness.
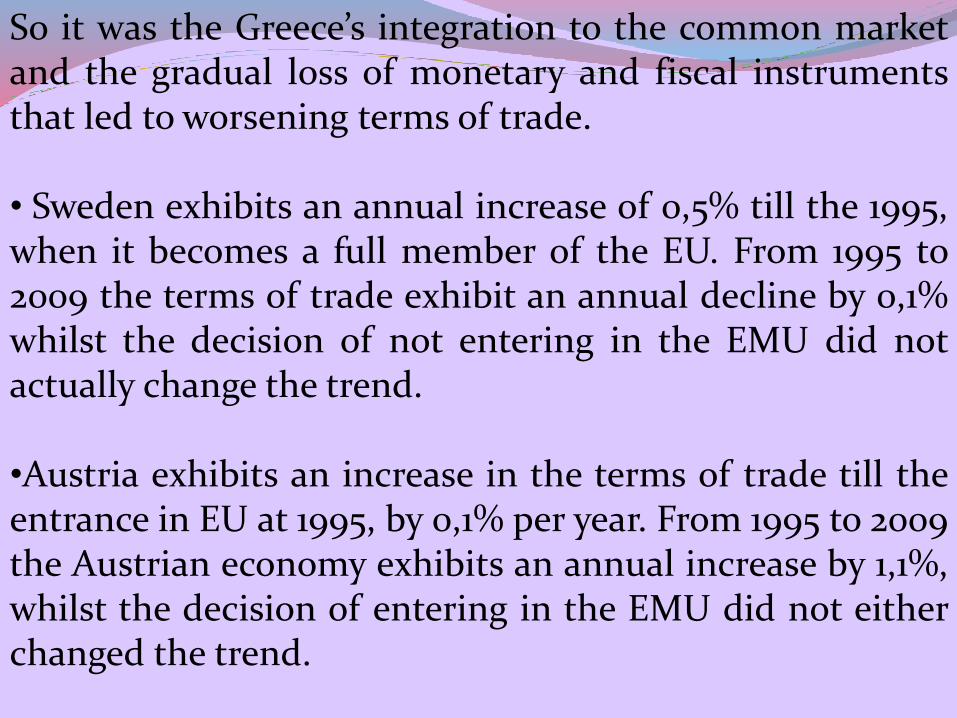
So it was the Greece’s integration to the common marketand the gradual loss of monetary and fiscal instrumentsthat led to worsening terms of trade.
• Sweden exhibits an annual increase of 0,5% till the 1995,when it becomes a full member of the EU. From 1995 to2009 the terms of trade exhibit an annual decline by 0,1%whilst the decision of not entering in the EMU did notactually change the trend.
•Austria exhibits an increase in the terms of trade till theentrance in EU at 1995, by 0,1% per year. From 1995 to 2009the Austrian economy exhibits an annual increase by 1,1%,whilst the decision of entering in the EMU did not eitherchanged the trend.
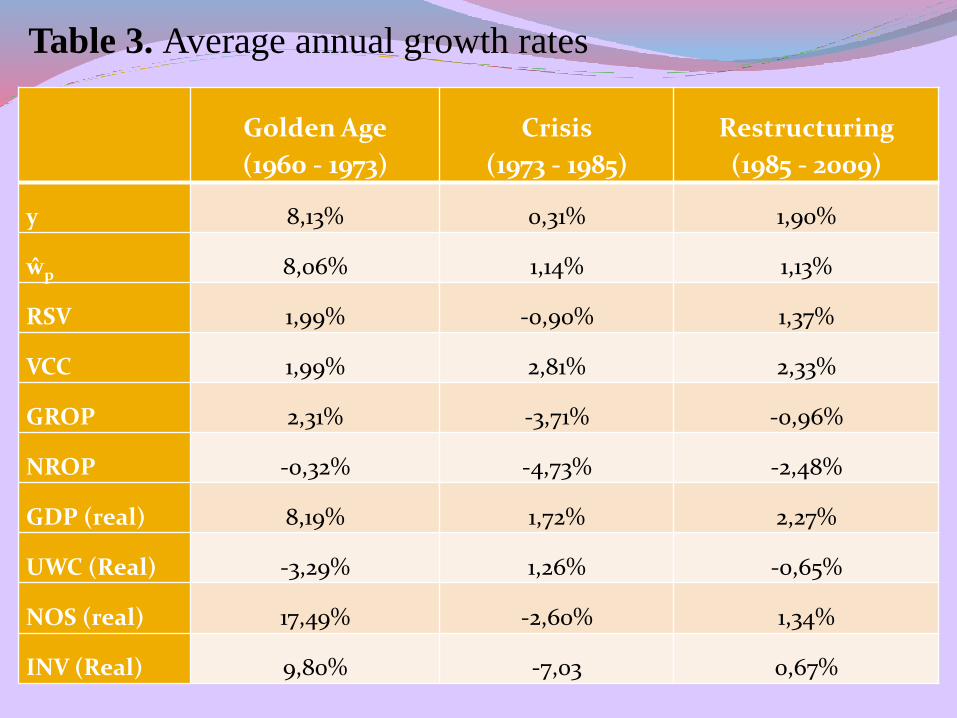
Table 3. Average annual growth rates
Golden Age
(1960 - 1973)
Crisis
(1973 - 1985)
Restructuring
(1985 - 2009)
y 8,13% 0,31% 1,90%
ŵp 8,06% 1,14% 1,13%
RSV 1,99% -0,90% 1,37%
VCC 1,99% 2,81% 2,33%
GROP 2,31% -3,71% -0,96%
NROP -0,32% -4,73% -2,48%
GDP (real) 8,19% 1,72% 2,27%
UWC (Real) -3,29% 1,26% -0,65%
NOS (real) 17,49% -2,60% 1,34%
INV (Real) 9,80% -7,03 0,67%
(4) AN ANALYSIS OF EMPIRICAL FINDINGS
► 1973-5 crisis:
• 3rd global crisis
• crisis of overaccumulation of capital caused by a falling profit rate due to the increase of the OCC
• structural crisis: requires a restructuring of the internal and external (international) systemic architecture
►global waves of capitalist restructuring :
(1) conservative Keynesian policies
(2) monetarism (national economy)
(3) open-economy neoliberalism (‘globalisation’)
However, there are national differences and variations to the global trends.

► Successes and failures: ‘silent depression’• Partial recovery of profitability & accumulation via
increased exploitation• Reinvigoration of absolute surplus-value extraction• ‘Globalisation’• Failure to solve the systemic problem and
overaccumulation/ the flight ahead: ‘financialization’
►The 1973 crisis and capitalist restructuring in Greece• a doubly onerous crisis: overaccumulation crisis plus
post-dictatorship radicalism• Contrary to international trends, the belated
implementation of progressive Keynesian policies, ‘social-mania’ and the creation of welfare state/ growth and progressive income redistribution
• Failure: a successful prescription at a wrong time
►Neoliberal restructuring policies
• 1990 ND government: mixed introduction of monetarist and neoliberal measures/ catching up with the international trends
• Restrictive macroeconomic policies and regressive income redistribution/ privatizations, opening of the economy, deregulation of labour relations, welfare cuts etc.
• PASOK Simitis’ governments: continuation plus religious adherence to the EMU requirements/ the two ‘robberies’: (a) stock-exchange, (b) post-euro mass consumption goods’ inflation
• The Balkan ‘Edorado’ and the artificial growth of the 2004 Olympics
►Conservative Keynesian capitalist restructuringand the shift to neoliberal directions
• 2nd PASOK governement’s 1985 stability programme: decisive conservative turn→conservative Keynesian restructuring reinforced subsequently
• EU accession: promises & dangers• From 1985: gradual increase of actual work-time
(broader phenomenon reinforced by Southern specificities)
►Ambiguous esults of Greek capitalist restructuringwaves:A partial recovery of profitability (mainly throughincreased exploitation).An insufficient devalorisation of capital

►Conservative Keynesian capitalist restructuringand the shift to neoliberal directions
• 2nd PASOK government's 1985 stability programme: decisive conservative turn → conservative Keynesian restructuring reinforced subsequently
• EU accession: promises & dangers
• From 1985: gradual increase of actual work-time (broader phenomenon reinforced by Southern specificities)
►Results of Greek capitalist restructuring waves:Ambiguous as elsewhere
► Greece: from the EEC to EU and the EMU• Securing the system after the dictatorship• Imperialist upgrading & the vital space• Danger of the opening the economy and dismantling a
coherent productive model• Accession at a lucky moment: political willingness and
sweeteners (aid packages etc.)• Grey times: faltering of capital accumulation,
expansion to the East and the beginning of troubles
► EU and the EMU• regional imperialist bloc with pyramidoid structure• Competition with the other major imperialist blocs,
internal rivalries and co-operation, exploitation of other countries
• Internal hierarchical pyramid: North and South
The ‘external’ cause: EU ‘broad’ unequal exchange
►EU’s North-South divide:
• Competition on the basis of absolute advantage• ‘broad’ unequal exchange: capitals from more
developed economies (i.e. higher OCC) competing within the same market with capitals from less developed economies (lower OCC) reap extra profits through unequal exchange with the latter.
• The ‘commanding heights’ (EC, ECB etc.) follow the prerogatives of the dominant Northern economies to the detriment of the South. Thus, the conduct of crucial policies (monetary, trade, exchange rate etc.) and the institutional arrangements favor the North.
► Greece in the EU: Greek capital’s modern ‘Big Idea’
• Loss of competitiveness within the EU (competition with more developed capitals without protectionism)
• Erosion of Greece’s productive structure: Greek capitals could not compete with Western ones since accession to the Common Market. Several industrial sectors hit hard. The agricultural sector was irrationally restructured via the Common Agricultural Policy (CAP): initially thrived through subsidies and then was shrink abnormally. Greek capital’s retreat to the quasi-protected area of non-internationally tradable goods and creation of oligopolistic structures.
• 1990s - a period of grace: the Balkan ‘Eldorado’: the
collapse of the Eastern bloc and the imperialist expansion
to the Balkans and Central and Eastern Europe
• accession to the EMU (2001): celebrated as the ‘national
goal’ of participation in the top EU league. However,
underneath the euphoric accounts structural problems
continued to amass and worsen (e.g. trade and current
account balances). The strong Euro diminished further
Greek exports, increased import penetration and weakened
domestic production. These were covered through the
cheap credit gained because of the EMU.
• the 2007-8 global crisis and the subsequent EU crisis blew
this house of cards apart.
► The eruption of the crisis• The 2007-8 crisis in the developed economies triggered
the latent structural problems of Greek capitalism: the unresolved profitability and overaccumulation problems re-emerged and the imperialist ‘subsidies’ from the Balkans diminished rapidly.
• State subsidization of faltering capital accumulation (and not excessive wages) → fiscal deficit/ the current crisis increased the need for such counter-cyclical measures but made them more expensive (because of the upheaval in finance)/ competition with other capitalisms over the burdens of the counter-crisis measures → fiscal crisis
• Fiscal deficit financed through external debt (because EMU effectively prohibits internal borrowing, e.g. national bonds etc.)
• The loss of competitiveness aggravated both
REFERENCES Carchedi G. (2001), For Another Europe: A Class Analysis of
European Economic Integration, London: Verso.
Emmanuel A. (1972), Unequal Exchange: A Study of the Imperialism of Trade, New York & London: Monthly Review Press
Maniatis Τ. & Passas C. (2013), ‘Profitability, capital accumulation and crisis in the Greek economy 1958-2009: A Marxist analysis’, Review of Political Economics 25(4)
Maniatis Τhanassis & Passas Costas (2014), ‘The Law of the Falling Rate of Profit in the post-war Greek Economy’ in Mavroudeas S. (ed.), Greek capitalism in crisis: Marxist Analyses, London: Routledge
Mavroudeas S. (2013), ‘Development and Crisis: The turbulent course of Greek Capitalism’, International Critical Thought 3(3)

Shaikh A & Tonak A. (1994), Measuring the wealth of nations: The political economy of national accounts, New York: Cambridge University PressSkountzos T. & Mattheos M. (1980), Input - Output Tables of the Greek Economy, 1958 - 1977, Athens: Centre of Planning and Economic Research