Lecture 20 Nutrients in Fresh Water Systems - … · 1 GG325, L20, F2013 Lecture 20 Nutrients in...
17
1 GG325, L20, F2013 Lecture 20 Nutrients in Fresh Water Systems Reading for this week: BB Ch6 (236-263) Today – 1. Nutrients, eutrophism in lakes and rivers GG325, L20, F2013 The Terrestrial Aquatic N and P cycles, revisited. The concentrations of N, P C and O in the hydrosphere are intricately related by the Redfield relationship. ΔN (+)/ΔP (+) = 16 ΔCO 2 (+)/ΔP (+) =106 ΔCO 2 (+)/ΔN (+) = 6.6 ΔO 2 (+)/ΔP(-) = 138 ΔO 2 (+)/ΔN(-) = 8.6 ΔO 2 (+)/ΔCO 2 (-) = 1.3
Transcript of Lecture 20 Nutrients in Fresh Water Systems - … · 1 GG325, L20, F2013 Lecture 20 Nutrients in...
1
GG325, L20, F2013
Lecture 20
Nutrients in Fresh Water Systems
Reading for this week: BB Ch6 (236-263)
Today –
1. Nutrients, eutrophism in lakes and rivers
GG325, L20, F2013
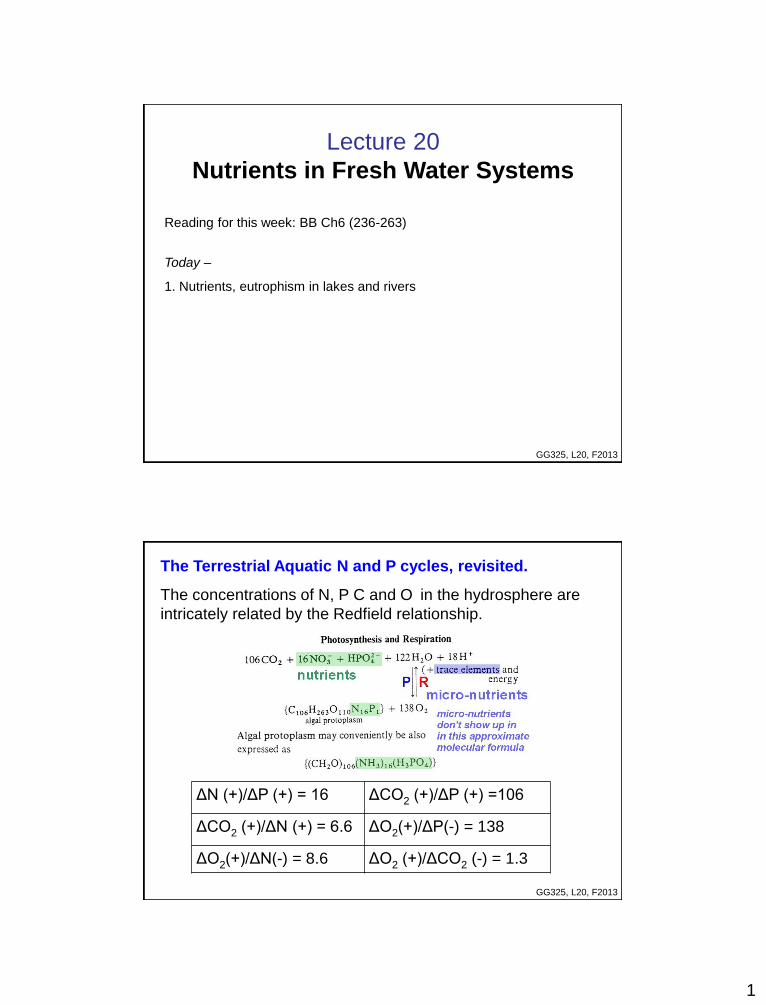
The Terrestrial Aquatic N and P cycles, revisited.
The concentrations of N, P C and O in the hydrosphere are
intricately related by the Redfield relationship.
ΔN (+)/ΔP (+) = 16
ΔCO2 (+)/ΔP (+) =106
ΔCO2 (+)/ΔN (+) = 6.6
ΔO2(+)/ΔP(-) = 138
ΔO2(+)/ΔN(-) = 8.6 ΔO2 (+)/ΔCO2 (-) = 1.3
2
GG325, L20, F2013
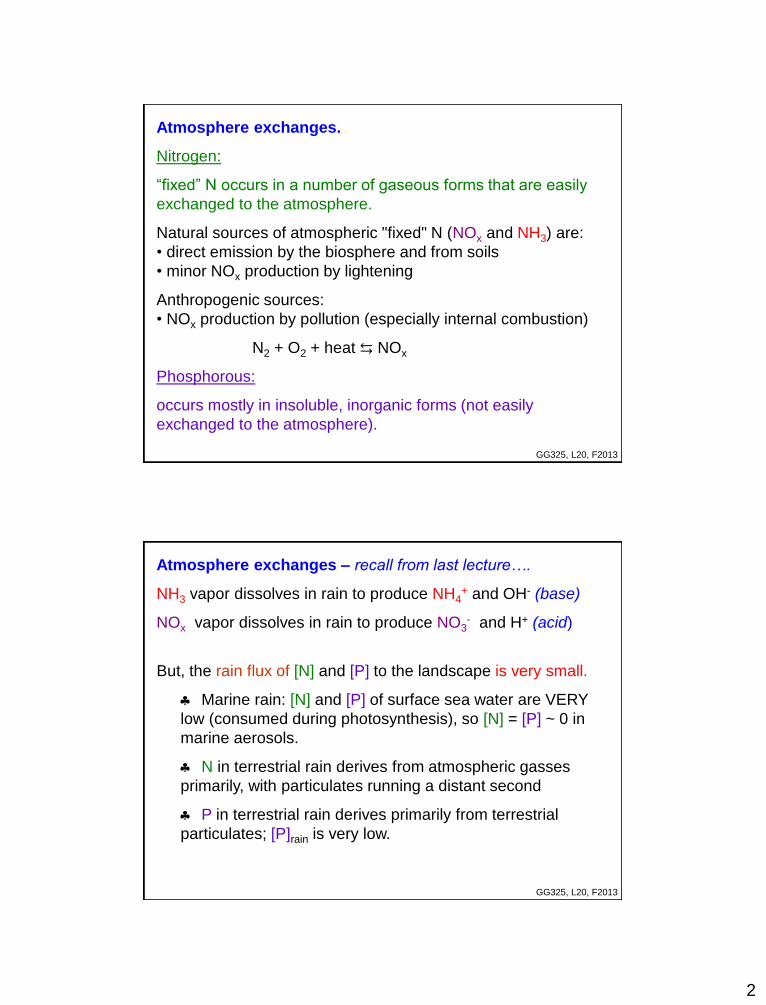
Atmosphere exchanges.
Nitrogen:
“fixed” N occurs in a number of gaseous forms that are easily
exchanged to the atmosphere.
Natural sources of atmospheric "fixed" N (NOx and NH3) are:
• direct emission by the biosphere and from soils
• minor NOx production by lightening
Anthropogenic sources:
• NOx production by pollution (especially internal combustion)
N2 + O2 + heat ⇆ NOx
Phosphorous:
occurs mostly in insoluble, inorganic forms (not easily
exchanged to the atmosphere).
GG325, L20, F2013
Atmosphere exchanges – recall from last lecture….
NH3 vapor dissolves in rain to produce NH4+ and OH- (base)
NOx vapor dissolves in rain to produce NO3- and H+ (acid)
But, the rain flux of [N] and [P] to the landscape is very small.
Marine rain: [N] and [P] of surface sea water are VERY
low (consumed during photosynthesis), so [N] = [P] ~ 0 in
marine aerosols.
N in terrestrial rain derives from atmospheric gasses
primarily, with particulates running a distant second
P in terrestrial rain derives primarily from terrestrial
particulates; [P]rain is very low.
3
GG325, L20, F2013
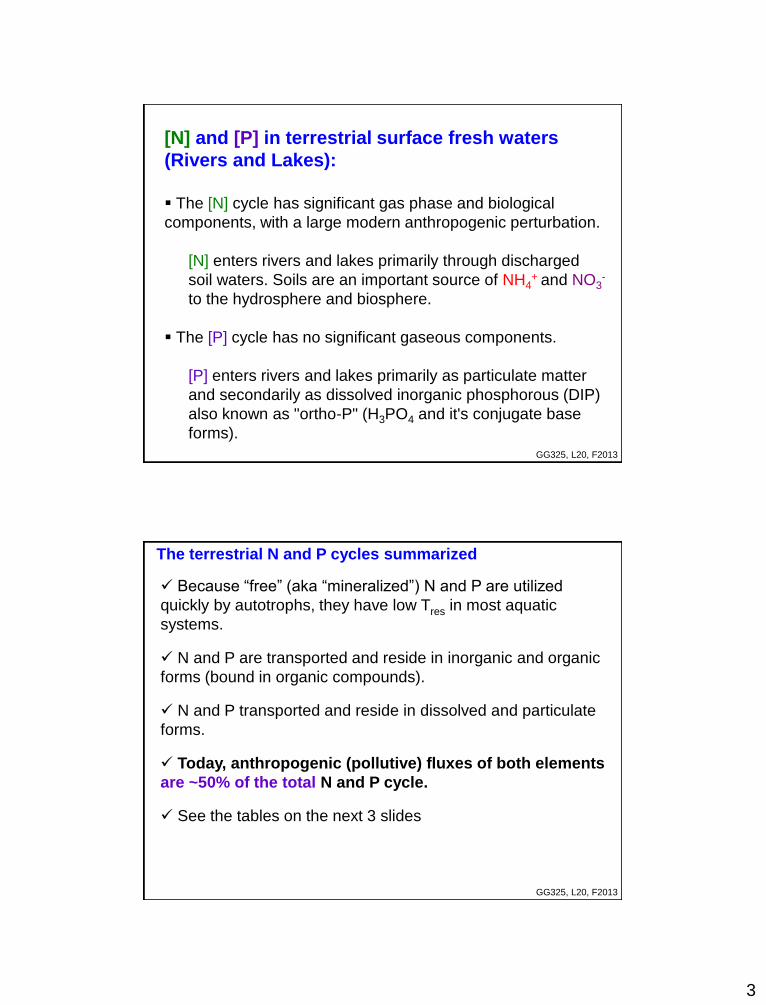
[N] and [P] in terrestrial surface fresh waters
(Rivers and Lakes):
The [N] cycle has significant gas phase and biological
components, with a large modern anthropogenic perturbation.
[N] enters rivers and lakes primarily through discharged
soil waters. Soils are an important source of NH4+ and NO3
-
to the hydrosphere and biosphere.
The [P] cycle has no significant gaseous components.
[P] enters rivers and lakes primarily as particulate matter
and secondarily as dissolved inorganic phosphorous (DIP)
also known as "ortho-P" (H3PO4 and it's conjugate base
forms).
GG325, L20, F2013
The terrestrial N and P cycles summarized
Because “free” (aka “mineralized”) N and P are utilized
quickly by autotrophs, they have low Tres in most aquatic
systems.
N and P are transported and reside in inorganic and organic
forms (bound in organic compounds).
N and P transported and reside in dissolved and particulate
forms.
Today, anthropogenic (pollutive) fluxes of both elements
are ~50% of the total N and P cycle.
See the tables on the next 3 slides
4
GG325, L20, F2013
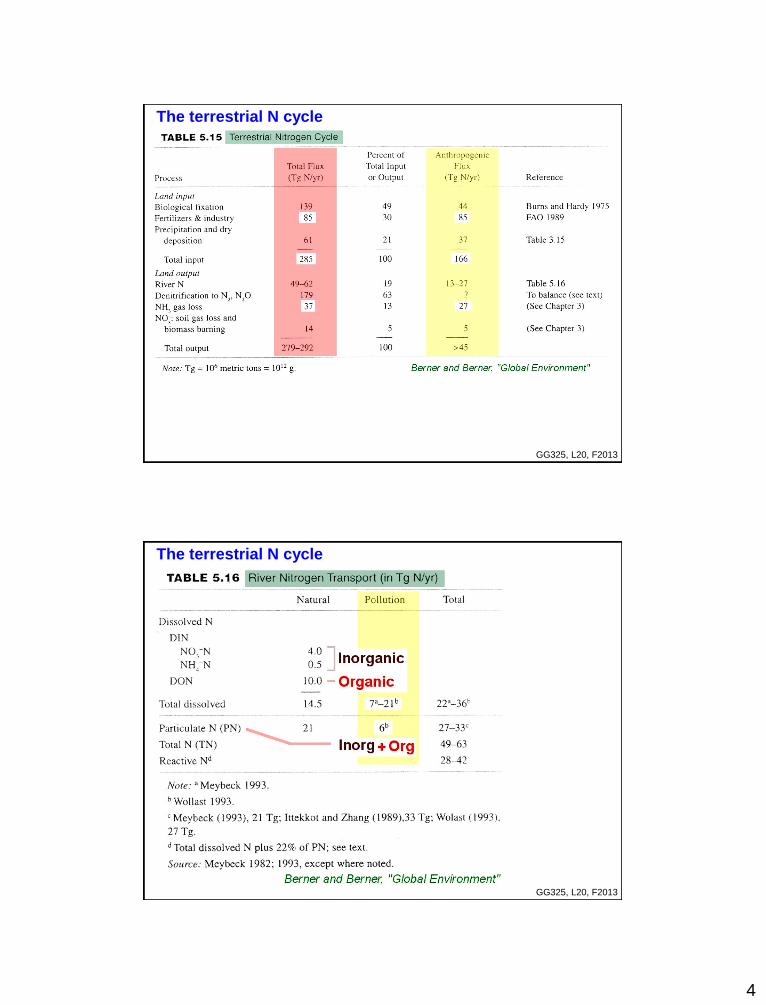
The terrestrial N cycle
GG325, L20, F2013
The terrestrial N cycle
5
GG325, L20, F2013
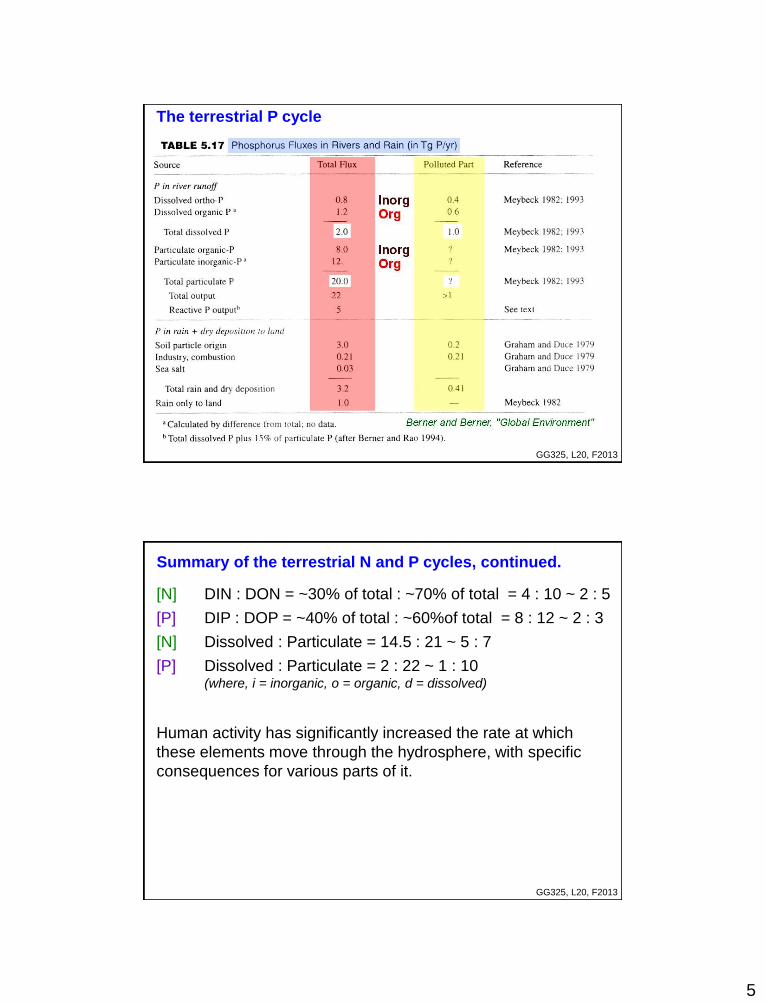
The terrestrial P cycle
GG325, L20, F2013
Summary of the terrestrial N and P cycles, continued.
[N] DIN : DON = ~30% of total : ~70% of total = 4 : 10 ~ 2 : 5
[P] DIP : DOP = ~40% of total : ~60%of total = 8 : 12 ~ 2 : 3
[N] Dissolved : Particulate = 14.5 : 21 ~ 5 : 7
[P] Dissolved : Particulate = 2 : 22 ~ 1 : 10 (where, i = inorganic, o = organic, d = dissolved)
Human activity has significantly increased the rate at which
these elements move through the hydrosphere, with specific
consequences for various parts of it.
6
GG325, L20, F2013
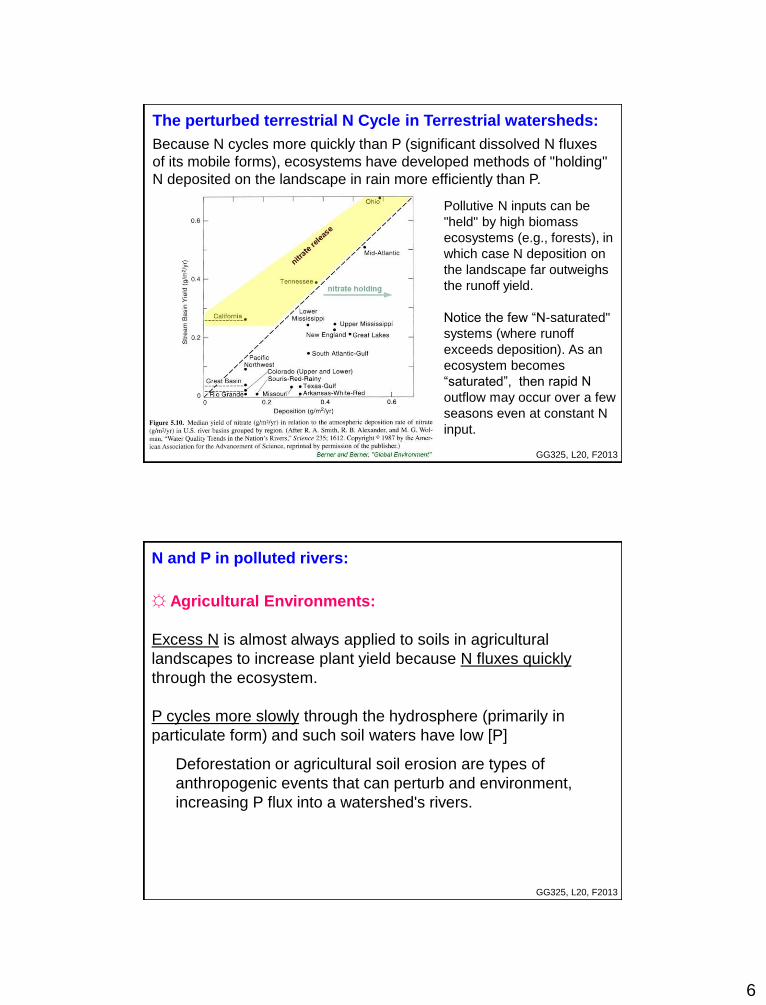
The perturbed terrestrial N Cycle in Terrestrial watersheds:
Because N cycles more quickly than P (significant dissolved N fluxes
of its mobile forms), ecosystems have developed methods of "holding"
N deposited on the landscape in rain more efficiently than P.
Pollutive N inputs can be
"held" by high biomass
ecosystems (e.g., forests), in
which case N deposition on
the landscape far outweighs
the runoff yield.
Notice the few “N-saturated"
systems (where runoff
exceeds deposition). As an
ecosystem becomes
“saturated”, then rapid N
outflow may occur over a few
seasons even at constant N
input.
GG325, L20, F2013
N and P in polluted rivers:
☼ Agricultural Environments:
Excess N is almost always applied to soils in agricultural
landscapes to increase plant yield because N fluxes quickly
through the ecosystem.
P cycles more slowly through the hydrosphere (primarily in
particulate form) and such soil waters have low [P]
Deforestation or agricultural soil erosion are types of
anthropogenic events that can perturb and environment,
increasing P flux into a watershed's rivers.

7
GG325, L20, F2013
N and P in polluted rivers:
☼ Urban Environments:
industrial and household use of detergents and cleaners leads to
a dissolved pollutive P flux to rivers that is generally proportional
to watershed population.
Careful management has allowed this source of pollution to be
reduced significantly in recent decades in much of the world.
Anthropogenic "forcing" of N and P have led to 2 types of rivers
that deviate significantly from Redfield ratio control on N : P, as
we see on the next slide.
GG325, L20, F2013
N and P in polluted rivers:
☼ "Agricultural rivers" have N : P > 16 ☼ "Industrial rivers" have N : P < 16 : 1
8
GG325, L20, F2013
Nutrient cycles in Lakes Photosynthesis and Respiration in
stratified bodies of waters result in
Nutrient Profile relationships.
Lake stratification causes
concentration gradients in
DIN, DIP and DOx from
excess photosynthesis in
surface waters and excess
respiration in light-limited
deep waters
Rivers typically don't show
similar concentration
profiles because they are
well-mixed during flow.
Lake outflow and inflow
tells us about the net effect
of that lake on watershed
output.
GG325, L20, F2013
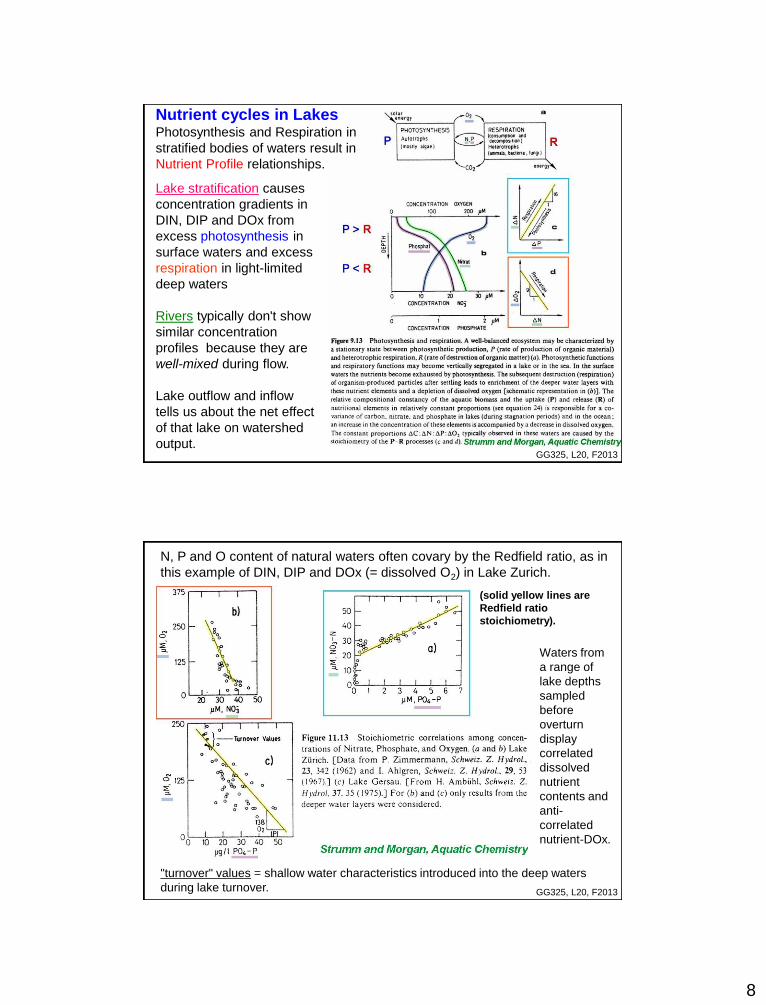
N, P and O content of natural waters often covary by the Redfield ratio, as in
this example of DIN, DIP and DOx (= dissolved O2) in Lake Zurich.
Waters from
a range of
lake depths
sampled
before
overturn
display
correlated
dissolved
nutrient
contents and
anti-
correlated
nutrient-DOx.
(solid yellow lines are
Redfield ratio
stoichiometry).
"turnover" values = shallow water characteristics introduced into the deep waters
during lake turnover.
9
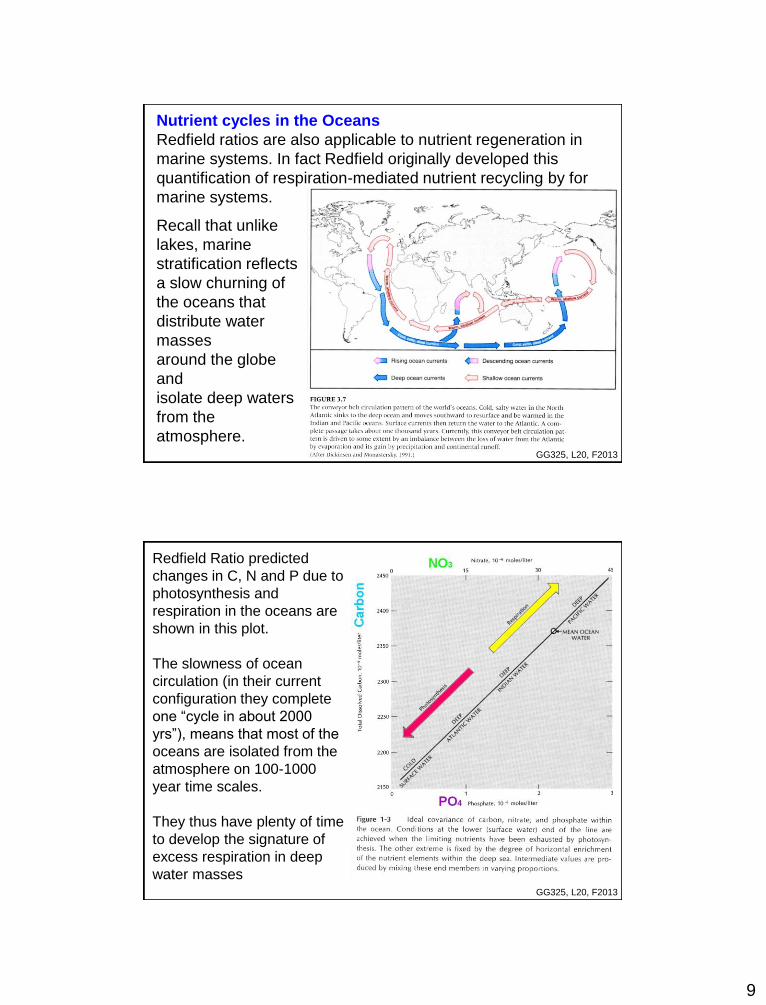
Nutrient cycles in the Oceans
Redfield ratios are also applicable to nutrient regeneration in
marine systems. In fact Redfield originally developed this
quantification of respiration-mediated nutrient recycling by for
marine systems.
Recall that unlike
lakes, marine
stratification reflects
a slow churning of
the oceans that
distribute water
masses
around the globe
and
isolate deep waters
from the
atmosphere. GG325, L20, F2013
GG325, L20, F2013
Redfield Ratio predicted
changes in C, N and P due to
photosynthesis and
respiration in the oceans are
shown in this plot.
The slowness of ocean
circulation (in their current
configuration they complete
one “cycle in about 2000
yrs”), means that most of the
oceans are isolated from the
atmosphere on 100-1000
year time scales.
They thus have plenty of time
to develop the signature of
excess respiration in deep
water masses
10
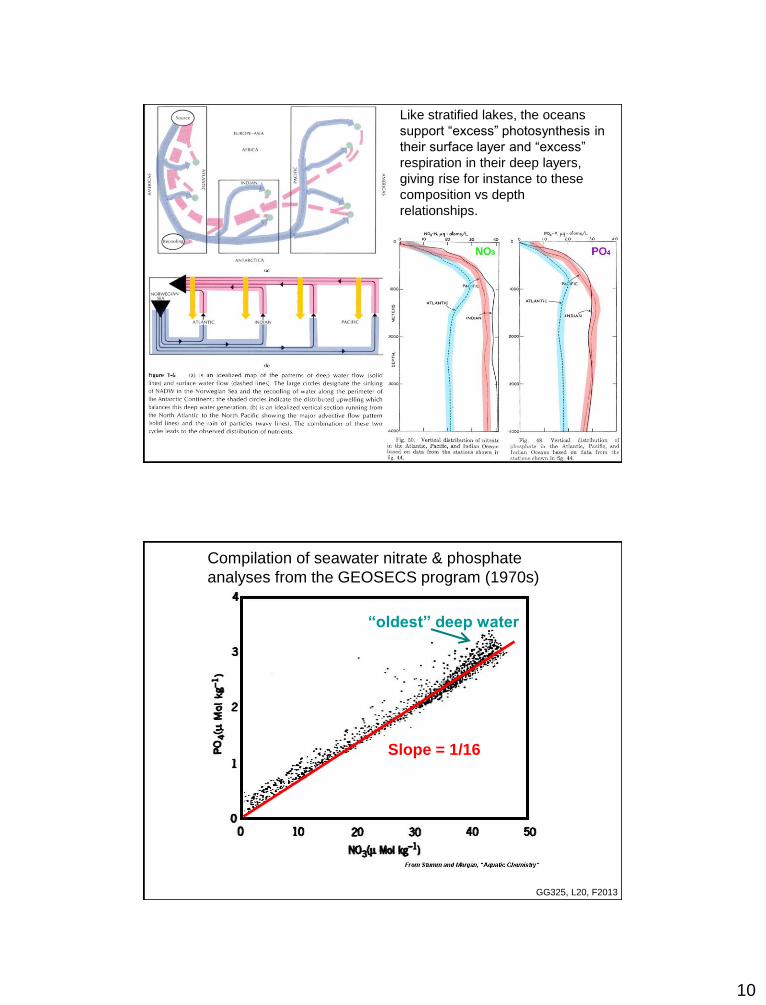
GG325, L20, F2013
Like stratified lakes, the oceans
support “excess” photosynthesis in
their surface layer and “excess”
respiration in their deep layers,
giving rise for instance to these
composition vs depth
relationships.
GG325, L20, F2013
“oldest” deep water
Slope = 1/16
Compilation of seawater nitrate & phosphate
analyses from the GEOSECS program (1970s)
11
GG325, L20, F2013
Lake data fit the Redfield paradigm less well than marine
data because in the open ocean the particulate organic
carbon of the surface oceans is dominated by phytoplankton
that follow Redfield stoichiometry and there are few other
sources of N or P
Terrigenous organic matter with higher C/P and C/N can
contribute significantly to the pool of organic carbon available
for remineralization to offset the C:N:P ratio in some lakes.
Also, bacterial denitrification and N-fixation can affect N/P
ratios.
GG325, L20, F2013
• The least available nutrient in any system is considered to
be the limiting nutrient for the total amount of
photosynthetic C-fixation a system can sustain.
• This is a stoichiometric concept that presumes that one
nutrient is totally consumed before other nutrients - not a
rate of photosynthesis
• Prevailing wisdom holds that P is limiting in lakes, while
N is usually limiting in the marine environment,
although there are exceptions.
• Plus, in complex ecosystems even if one nutrient is
depleted other organisms that need little to none of this
nutrient can be favored and still flourish.
Nutrient limitation
Nutrient overloading (especially P) by "industrial" human activities
can enhance photosynthesis greatly in an urbanized watershed.

12
GG325, L20, F2013
GG325, L20, F2013 http://www.umanitoba.ca/institutes/fisheries/eutro.html
View from above (left) of an
experimental lake in Canada with a
divider curtain separating it from
another lake. P was added to the
near side of the curtain. The bright
green color results from the ensuing
bloom of bluegreen algae
(Cyanobacteria).
P-limitation and Eutrophism
Aerial view (above) of another
experimental lake in which
algae were stimulated by P addition
for 26 consecutive years. The lake
in the background is unfertilized.
13
GG325, L20, F2013
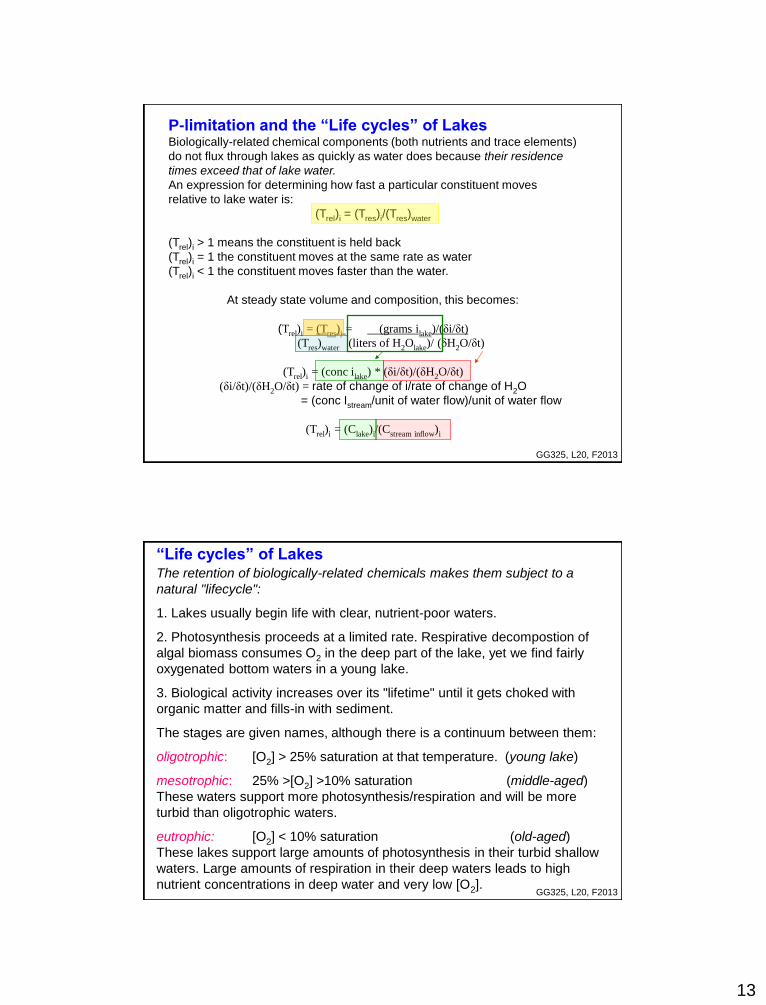
P-limitation and the “Life cycles” of Lakes Biologically-related chemical components (both nutrients and trace elements)
do not flux through lakes as quickly as water does because their residence
times exceed that of lake water.
An expression for determining how fast a particular constituent moves
relative to lake water is:
(Trel)i = (Tres)i/(Tres)water
(Trel)i > 1 means the constituent is held back
(Trel)i = 1 the constituent moves at the same rate as water
(Trel)i < 1 the constituent moves faster than the water.
At steady state volume and composition, this becomes:
(Trel)i = (Tres)i = (grams ilake)/(δi/δt)
(Tres)water (liters of H2Olake)/ (δH2O/δt)
(Trel)i = (conc ilake) * (δi/δt)/(δH2O/δt)
(δi/δt)/(δH2O/δt) = rate of change of i/rate of change of H2O
= (conc Istream/unit of water flow)/unit of water flow
(Trel)i = (Clake)i/(Cstream inflow)i
GG325, L20, F2013
“Life cycles” of Lakes The retention of biologically-related chemicals makes them subject to a
natural "lifecycle":
1. Lakes usually begin life with clear, nutrient-poor waters.
2. Photosynthesis proceeds at a limited rate. Respirative decompostion of
algal biomass consumes O2 in the deep part of the lake, yet we find fairly
oxygenated bottom waters in a young lake.
3. Biological activity increases over its "lifetime" until it gets choked with
organic matter and fills-in with sediment.
The stages are given names, although there is a continuum between them:
oligotrophic: [O2] > 25% saturation at that temperature. (young lake)
mesotrophic: 25% >[O2] >10% saturation (middle-aged)
These waters support more photosynthesis/respiration and will be more
turbid than oligotrophic waters.
eutrophic: [O2] < 10% saturation (old-aged)
These lakes support large amounts of photosynthesis in their turbid shallow
waters. Large amounts of respiration in their deep waters leads to high
nutrient concentrations in deep water and very low [O2].
14
GG325, L20, F2013
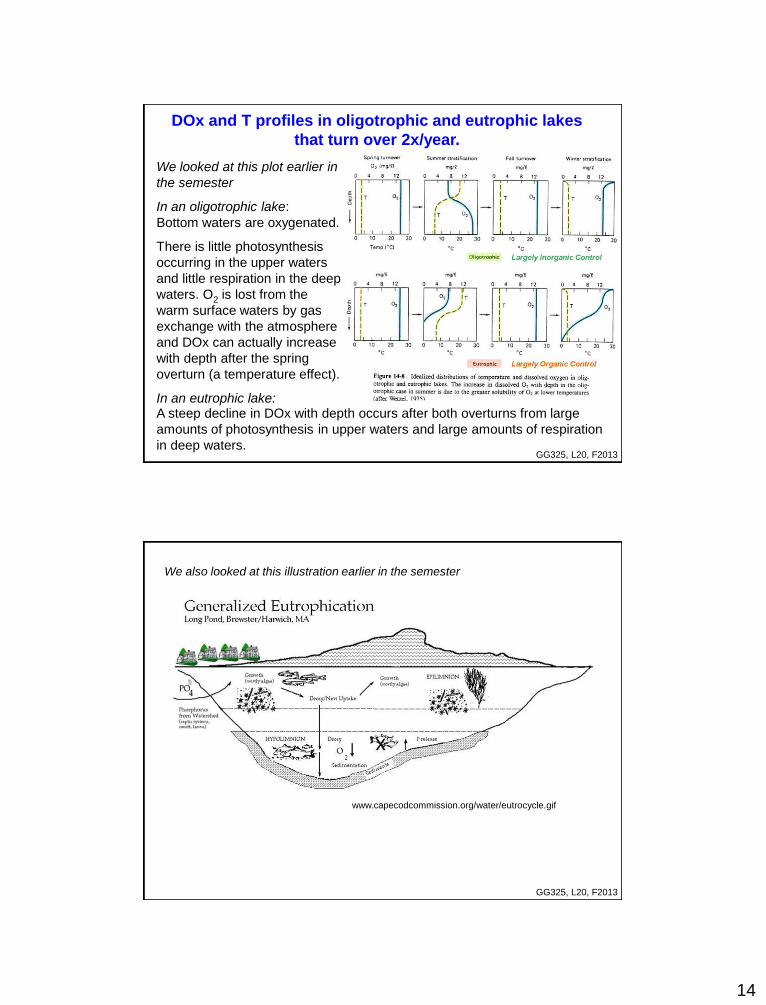
We looked at this plot earlier in
the semester
In an oligotrophic lake:
Bottom waters are oxygenated.
There is little photosynthesis
occurring in the upper waters
and little respiration in the deep
waters. O2 is lost from the
warm surface waters by gas
exchange with the atmosphere
and DOx can actually increase
with depth after the spring
overturn (a temperature effect).
In an eutrophic lake:
DOx and T profiles in oligotrophic and eutrophic lakes
that turn over 2x/year.
A steep decline in DOx with depth occurs after both overturns from large
amounts of photosynthesis in upper waters and large amounts of respiration
in deep waters.
GG325, L20, F2013
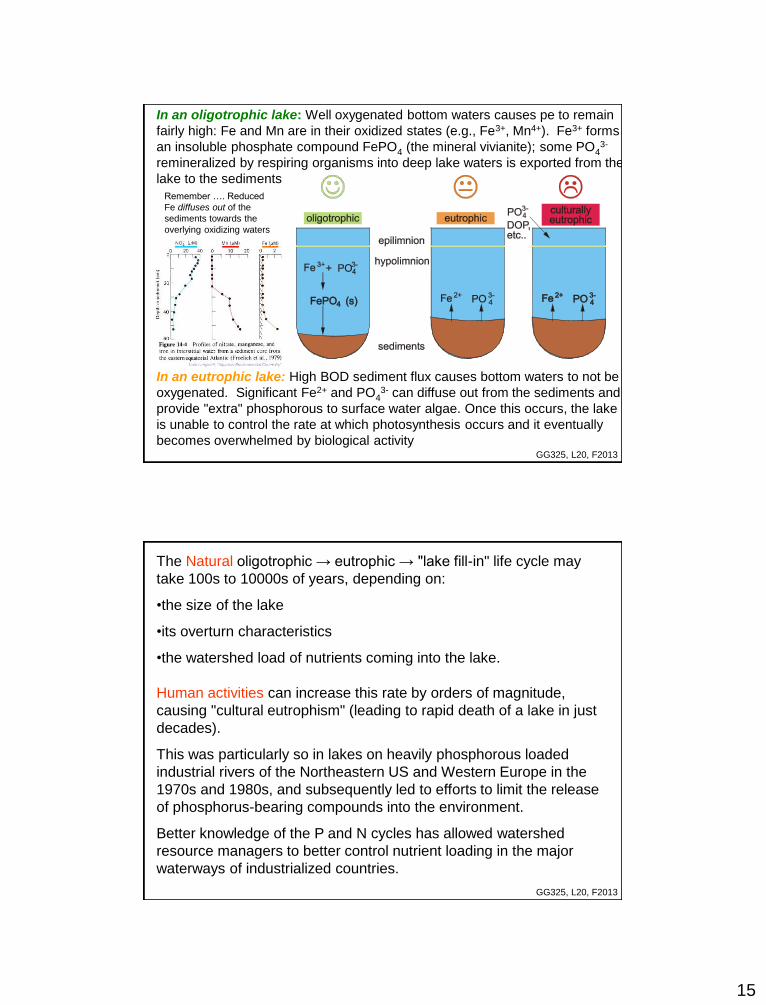
www.capecodcommission.org/water/eutrocycle.gif
We also looked at this illustration earlier in the semester
15
GG325, L20, F2013
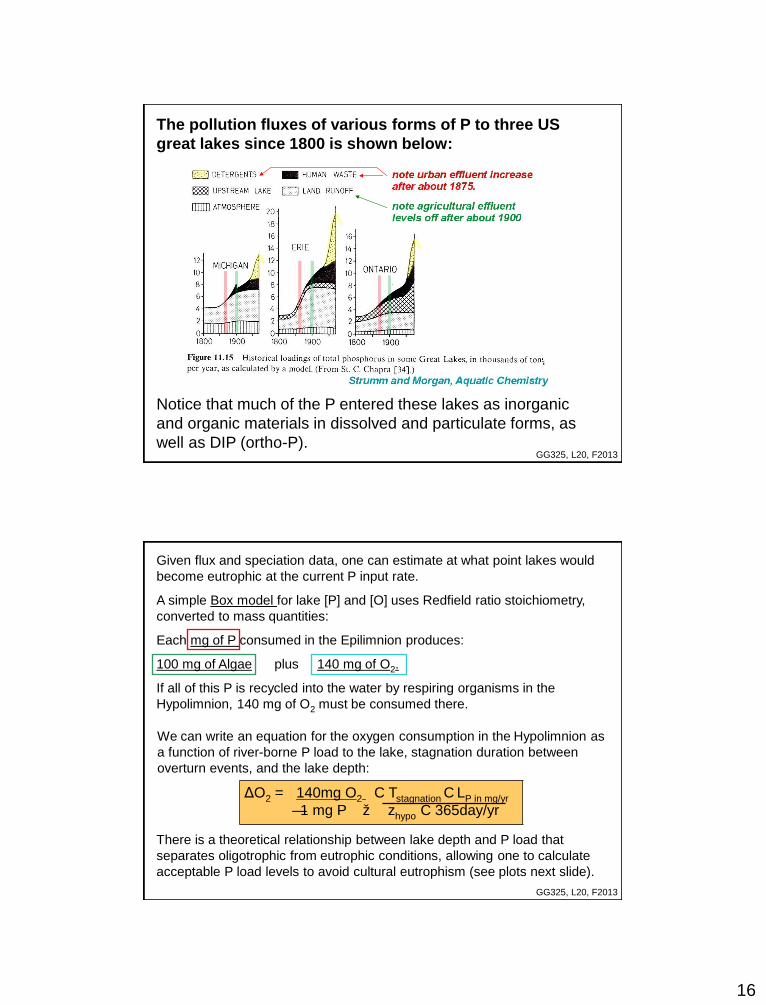
In an oligotrophic lake: Well oxygenated bottom waters causes pe to remain
fairly high: Fe and Mn are in their oxidized states (e.g., Fe3+, Mn4+). Fe3+ forms
an insoluble phosphate compound FePO4 (the mineral vivianite); some PO43-
remineralized by respiring organisms into deep lake waters is exported from the
lake to the sediments
In an eutrophic lake: High BOD sediment flux causes bottom waters to not be
oxygenated. Significant Fe2+ and PO43- can diffuse out from the sediments and
provide "extra" phosphorous to surface water algae. Once this occurs, the lake
is unable to control the rate at which photosynthesis occurs and it eventually
becomes overwhelmed by biological activity
Remember …. Reduced
Fe diffuses out of the
sediments towards the
overlying oxidizing waters
GG325, L20, F2013
The Natural oligotrophic → eutrophic → "lake fill-in" life cycle may
take 100s to 10000s of years, depending on:
•the size of the lake
•its overturn characteristics
•the watershed load of nutrients coming into the lake.
Human activities can increase this rate by orders of magnitude,
causing "cultural eutrophism" (leading to rapid death of a lake in just
decades).
This was particularly so in lakes on heavily phosphorous loaded
industrial rivers of the Northeastern US and Western Europe in the
1970s and 1980s, and subsequently led to efforts to limit the release
of phosphorus-bearing compounds into the environment.
Better knowledge of the P and N cycles has allowed watershed
resource managers to better control nutrient loading in the major
waterways of industrialized countries.
16
GG325, L20, F2013
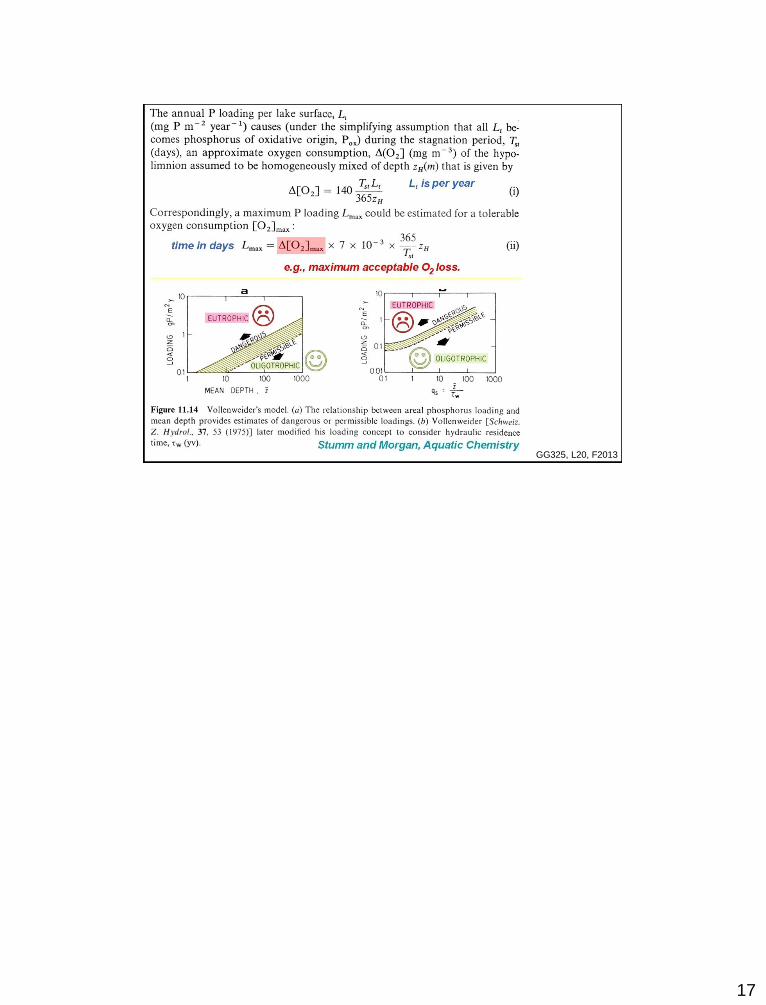
The pollution fluxes of various forms of P to three US
great lakes since 1800 is shown below:
Notice that much of the P entered these lakes as inorganic
and organic materials in dissolved and particulate forms, as
well as DIP (ortho-P).
GG325, L20, F2013
Given flux and speciation data, one can estimate at what point lakes would
become eutrophic at the current P input rate.
A simple Box model for lake [P] and [O] uses Redfield ratio stoichiometry,
converted to mass quantities:
Each mg of P consumed in the Epilimnion produces:
100 mg of Algae plus 140 mg of O2.
If all of this P is recycled into the water by respiring organisms in the
Hypolimnion, 140 mg of O2 must be consumed there.
We can write an equation for the oxygen consumption in the Hypolimnion as
a function of river-borne P load to the lake, stagnation duration between
overturn events, and the lake depth:
ΔO2 = 140mg O2 C Tstagnation C LP in mg/yr
— 1 mg P ž zhypo C 365day/yr
There is a theoretical relationship between lake depth and P load that
separates oligotrophic from eutrophic conditions, allowing one to calculate
acceptable P load levels to avoid cultural eutrophism (see plots next slide).
17
GG325, L20, F2013