Lecture 11: Market Power and Monopoly
94
Admin Market Power MR π Max. Market Changes Winners and Losers Gov’t Lecture 11: Market Power and Monopoly November 13, 2018
Transcript of Lecture 11: Market Power and Monopoly

Admin Market Power MR π Max. Market Changes Winners and Losers Gov’t
Lecture 11:Market Power and Monopoly
November 13, 2018

Admin Market Power MR π Max. Market Changes Winners and Losers Gov’t
Overview
Course Administration
Sources of Market Power
Market Power and Marginal Revenue
Profit Maximization and Market Power
How a Firm With Market Power Reacts to Market Changes
Winners and Losers From Market Power
Governments and Market Power: Regulation, Antitrust andInnovation

Admin Market Power MR π Max. Market Changes Winners and Losers Gov’t
Course Administration
1. Problem Set 8 answers posted
2. Problem Set 10 posted
3. Collect elasticity memos• memos should also be posted to google drive• will return comments by December 4
4. Last year’s final exam is posted on the handouts page
5. Exam review December 3 – time and location on handoutspage

Admin Market Power MR π Max. Market Changes Winners and Losers Gov’t
Ripped from the Headlines
Next Week
Afternoon
Finder Presenter
Jae Yu Lena NourDavid Neu Jae-Marie Ferdinand
Evening
Finder Presenter
Aditya Dilip Lindsay ThayerJason PriorNora Blalock

Admin Market Power MR π Max. Market Changes Winners and Losers Gov’t
Sources of
Market Power

Admin Market Power MR π Max. Market Changes Winners and Losers Gov’t
Why Study Market Power?
• Most markets are imperfect to some degree
• Economists believe there is a role for government in easingmarket imperfections
• Today• How does limited competition impact consumption and
production?• What is government’s role in improving competition?
Admin Market Power MR π Max. Market Changes Winners and Losers Gov’t
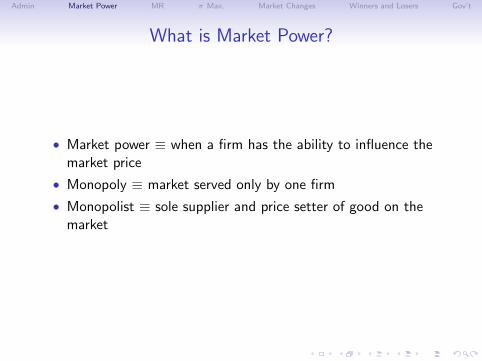
What is Market Power?
• Market power ≡ when a firm has the ability to influence themarket price
• Monopoly ≡ market served only by one firm
• Monopolist ≡ sole supplier and price setter of good on themarket
Admin Market Power MR π Max. Market Changes Winners and Losers Gov’t
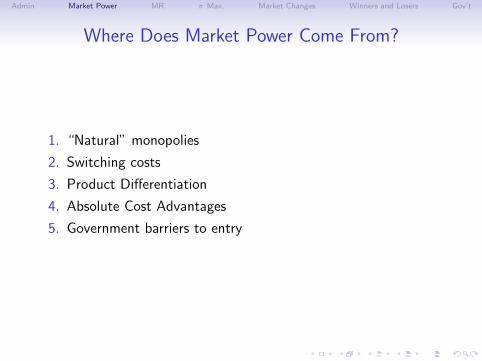
Where Does Market Power Come From?
1. “Natural” monopolies
2. Switching costs
3. Product Differentiation
4. Absolute Cost Advantages
5. Government barriers to entry
Admin Market Power MR π Max. Market Changes Winners and Losers Gov’t
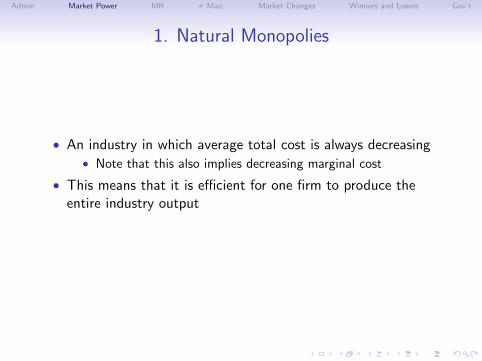
1. Natural Monopolies
• An industry in which average total cost is always decreasing• Note that this also implies decreasing marginal cost
• This means that it is efficient for one firm to produce theentire industry output
More on this at the end of class.
Admin Market Power MR π Max. Market Changes Winners and Losers Gov’t
2. Switching Costs and Market Power
• Switching costs ≡ cost to consumer in switching betweenproducts – examples?
• Network goods have particularly high switching costs
• Network good ≡ good for which value to consumer increaseswith number of other consumers of the product
Admin Market Power MR π Max. Market Changes Winners and Losers Gov’t
3. Product Differentiation and 4. Cost Advantage
Product differentiation
• Imperfect substitutability across varieties of a product
• Observable if you are willing to pay a little more for aparticular variant
Absolute Cost Advantage
• Firm owns something or has a technology that makes it havelower costs relative to competitors
• Examples?

Admin Market Power MR π Max. Market Changes Winners and Losers Gov’t
5. Government Regulation as a Barrier to Entry
• We’ve already given examples that limit entry – reprise?
• Remember, over the long run, high profits are a temptation toentry, perhaps in a slightly altered form
• Don’t conclude that barriers to entry are always bad. Theyhave a cost; does the cost justify the benefit?

Admin Market Power MR π Max. Market Changes Winners and Losers Gov’t
Market Power
and Marginal Revenue
Admin Market Power MR π Max. Market Changes Winners and Losers Gov’t
Neither Perfect Competition Nor a Monopoly
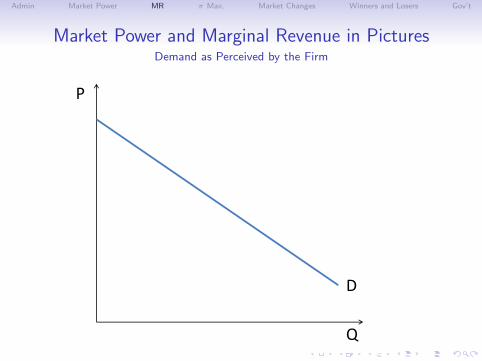
• We say a firm has market power if it faces a downward slopingdemand curve
• Recollect – what did a demand curve look like to a perfectlycompetitive firm?
• Firms in these types of markets face downward-slopingdemand curves
• Oligopoly ≡ an industry with few firms – examples?• Monopolistic competition ≡ many firms selling differentiated
products• Monopoly
Admin Market Power MR π Max. Market Changes Winners and Losers Gov’t
Neither Perfect Competition Nor a Monopoly
• We say a firm has market power if it faces a downward slopingdemand curve
• Recollect – what did a demand curve look like to a perfectlycompetitive firm?
• Firms in these types of markets face downward-slopingdemand curves
• Oligopoly ≡ an industry with few firms – examples?• Monopolistic competition ≡ many firms selling differentiated
products• Monopoly
Admin Market Power MR π Max. Market Changes Winners and Losers Gov’t
Marginal Revenue: Perfect Competition and Not
Perfect Competition
• What is marginal revenue?
• If the firm perceives the demand curve as constant, thenMR = P
Market Power
• We assume that the firm has to charge the same price for allunits of the good
• As before, marginal revenue is the additional revenue from anadditional unit of output sold
• However, selling an additional unit of output now requireslowering the price on all units of output
Admin Market Power MR π Max. Market Changes Winners and Losers Gov’t
Market Power and Marginal Revenue in PicturesDemand as Perceived by the Firm
P
D
Q
Admin Market Power MR π Max. Market Changes Winners and Losers Gov’t
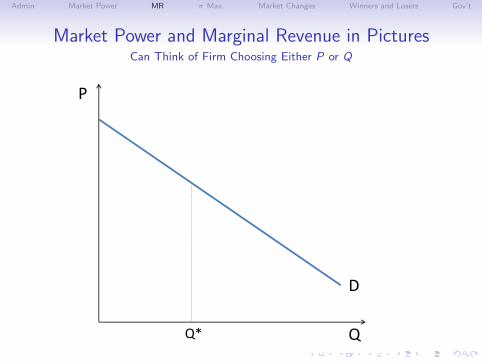
Market Power and Marginal Revenue in PicturesCan Think of Firm Choosing Either P or Q
P
D
Q* Q
Admin Market Power MR π Max. Market Changes Winners and Losers Gov’t
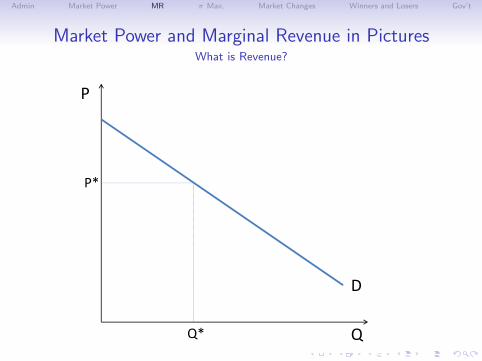
Market Power and Marginal Revenue in PicturesWhat is Revenue?
P
D
Q* Q
P*
Admin Market Power MR π Max. Market Changes Winners and Losers Gov’t
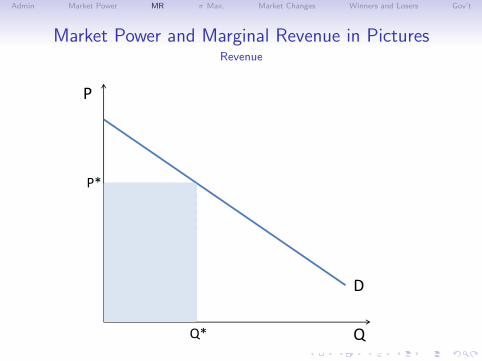
Market Power and Marginal Revenue in PicturesRevenue
P
D
Q* Q
P*
Admin Market Power MR π Max. Market Changes Winners and Losers Gov’t
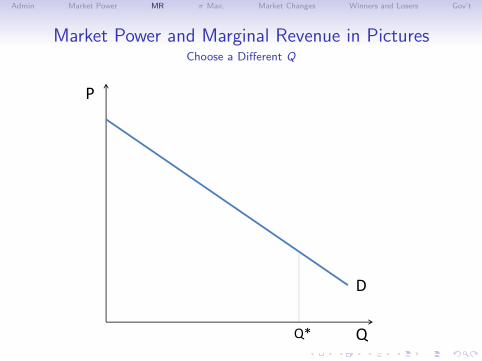
Market Power and Marginal Revenue in PicturesChoose a Different Q
P
D
Q* Q
Admin Market Power MR π Max. Market Changes Winners and Losers Gov’t
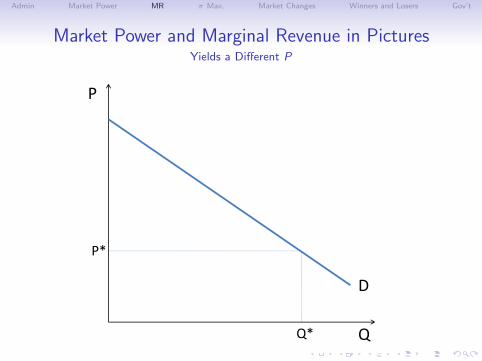
Market Power and Marginal Revenue in PicturesYields a Different P
P
D
Q* Q
P*
Admin Market Power MR π Max. Market Changes Winners and Losers Gov’t
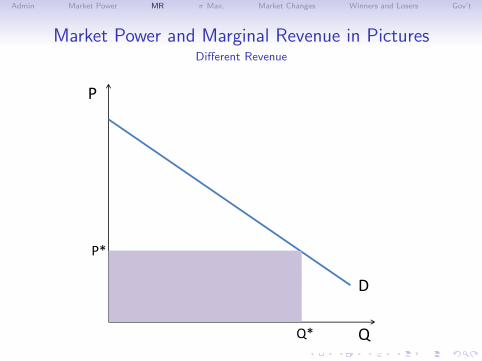
Market Power and Marginal Revenue in PicturesDifferent Revenue
P
D
Q* Q
P*
Admin Market Power MR π Max. Market Changes Winners and Losers Gov’t
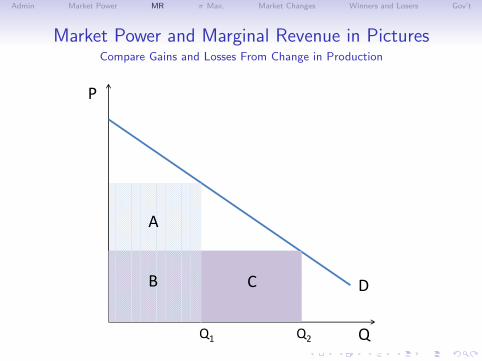
Market Power and Marginal Revenue in PicturesCompare Gains and Losses From Change in Production
P
D
Q2 Q
A
B C
Q1
Admin Market Power MR π Max. Market Changes Winners and Losers Gov’t
Market Power and Marginal Revenue in Algebra
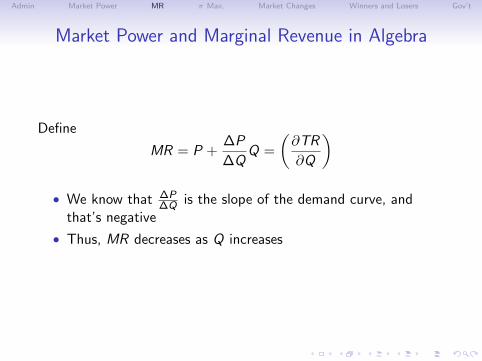
Define
MR = P +∆P
∆QQ =
(∂TR
∂Q
)
• We know that ∆P∆Q is the slope of the demand curve, and
that’s negative
• Thus, MR decreases as Q increases
Admin Market Power MR π Max. Market Changes Winners and Losers Gov’t
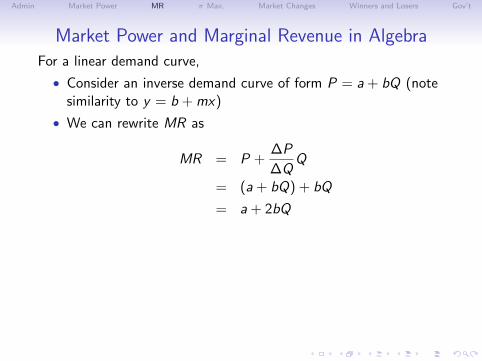
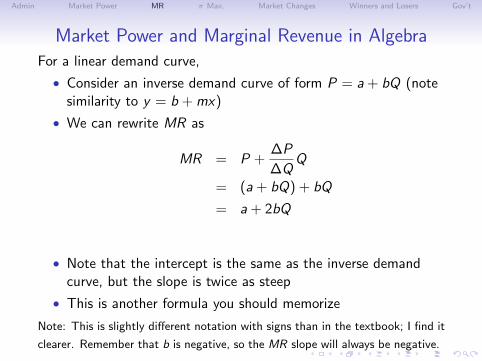
Market Power and Marginal Revenue in AlgebraFor a linear demand curve,
• Consider an inverse demand curve of form P = a + bQ (notesimilarity to y = b + mx)
• We can rewrite MR as
MR = P +∆P
= (a + bQ) + bQ
= a + 2bQ
• Note that the intercept is the same as the inverse demandcurve, but the slope is twice as steep
• This is another formula you should memorize
Note: This is slightly different notation with signs than in the textbook; I find it
clearer. Remember that b is negative, so the MR slope will always be negative.
Admin Market Power MR π Max. Market Changes Winners and Losers Gov’t
Profit Maximization
and Market Power
Admin Market Power MR π Max. Market Changes Winners and Losers Gov’t
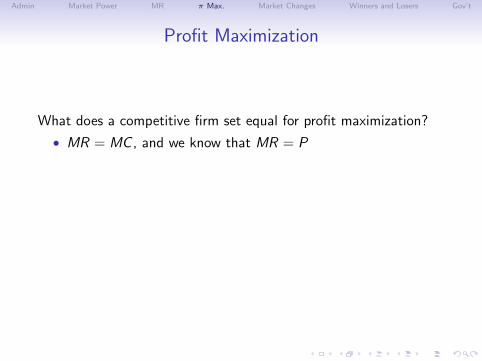
Profit Maximization
What does a competitive firm set equal for profit maximization?
• MR = MC , and we know that MR = P
What does a firm with market power set equal for profitmaximization?
• MR = MC
• But MR is more complicated
• And MR 6= P (in general)
Admin Market Power MR π Max. Market Changes Winners and Losers Gov’t
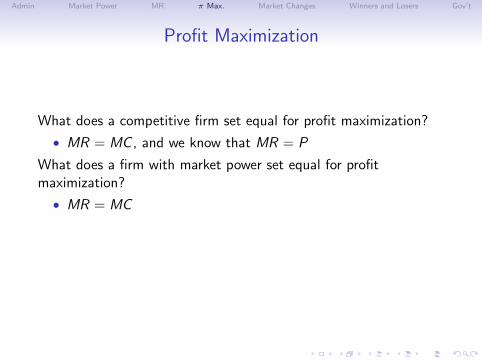
Profit Maximization
What does a competitive firm set equal for profit maximization?
• MR = MC , and we know that MR = P
What does a firm with market power set equal for profitmaximization?
• MR = MC
• But MR is more complicated
• And MR 6= P (in general)
Admin Market Power MR π Max. Market Changes Winners and Losers Gov’t
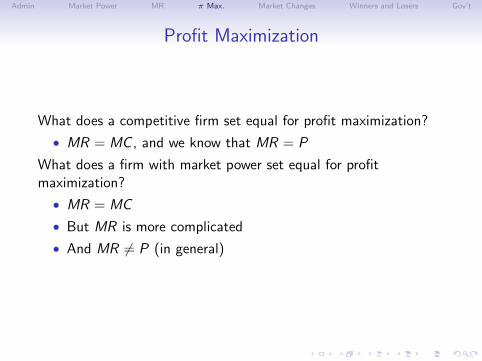
Profit Maximization
What does a competitive firm set equal for profit maximization?
• MR = MC , and we know that MR = P
What does a firm with market power set equal for profitmaximization?
• MR = MC
• But MR is more complicated
• And MR 6= P (in general)
Admin Market Power MR π Max. Market Changes Winners and Losers Gov’t
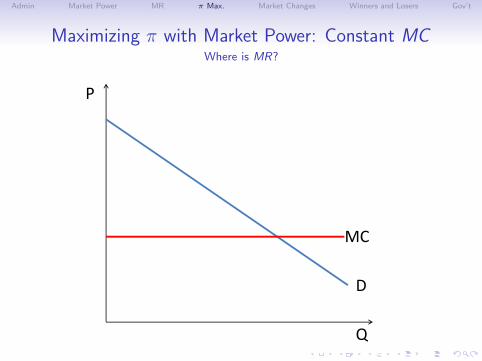
Maximizing π with Market Power: Constant MCWhere is MR?
P
D
Q
MC
Admin Market Power MR π Max. Market Changes Winners and Losers Gov’t
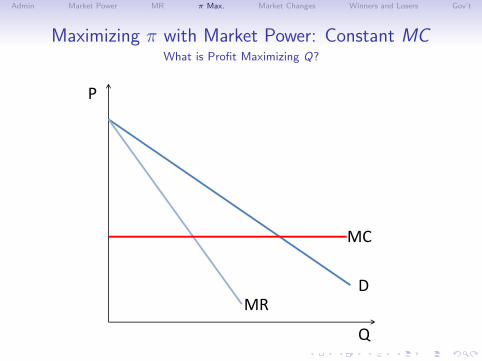
Maximizing π with Market Power: Constant MCWhat is Profit Maximizing Q?
P
D
Q
MR
MC
Admin Market Power MR π Max. Market Changes Winners and Losers Gov’t
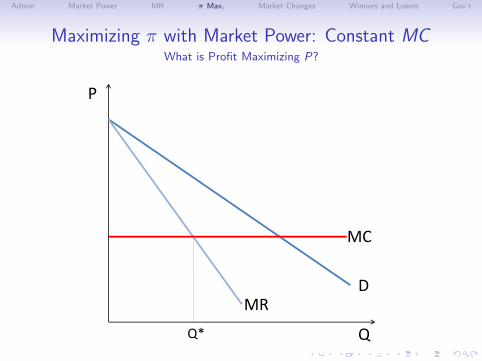
Maximizing π with Market Power: Constant MCWhat is Profit Maximizing P?
P
D
Q
MR
MC
Q*
Admin Market Power MR π Max. Market Changes Winners and Losers Gov’t
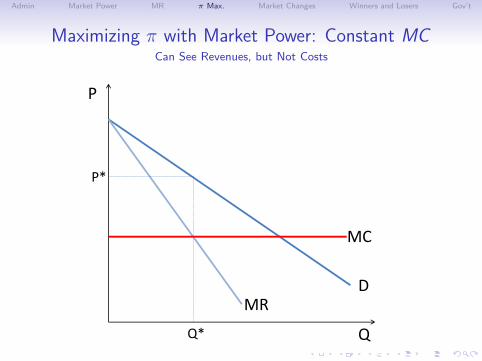
Maximizing π with Market Power: Constant MCCan See Revenues, but Not Costs
P
D
Q
MR
MC
Q*
P*
Admin Market Power MR π Max. Market Changes Winners and Losers Gov’t
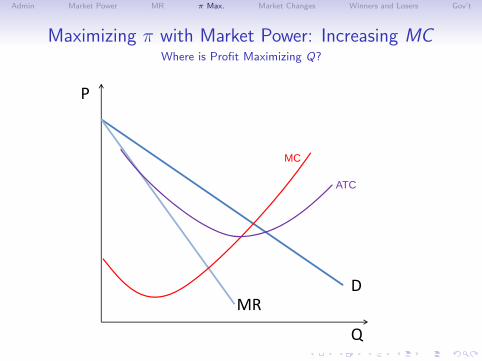
Maximizing π with Market Power: Increasing MCWhere is Profit Maximizing Q?
P
D
Q
MR
MC
ATC
Admin Market Power MR π Max. Market Changes Winners and Losers Gov’t
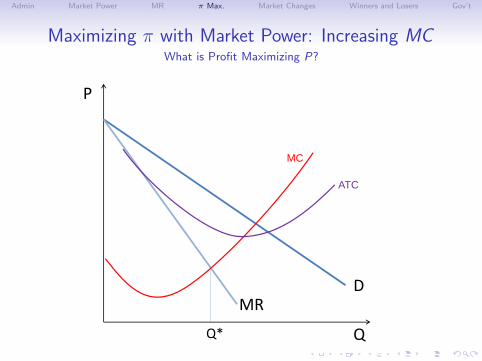
Maximizing π with Market Power: Increasing MCWhat is Profit Maximizing P?
P
D
Q
MR
Q*
MC
ATC
Admin Market Power MR π Max. Market Changes Winners and Losers Gov’t
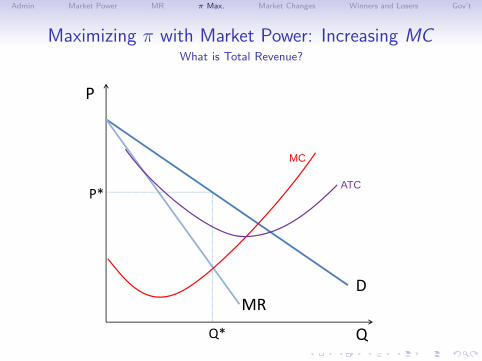
Maximizing π with Market Power: Increasing MCWhat is Total Revenue?
P
D
Q
MR
Q*
P*
MC
ATC
Admin Market Power MR π Max. Market Changes Winners and Losers Gov’t
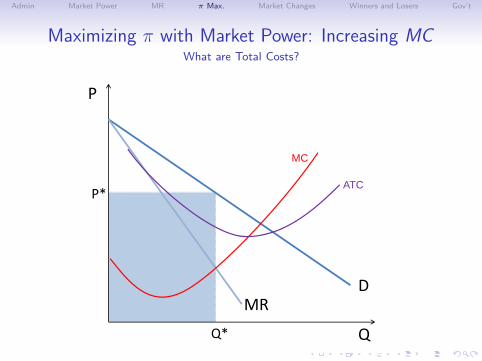
Maximizing π with Market Power: Increasing MCWhat are Total Costs?
P
D
Q
MR
Q*
P*
MC
ATC
Admin Market Power MR π Max. Market Changes Winners and Losers Gov’t
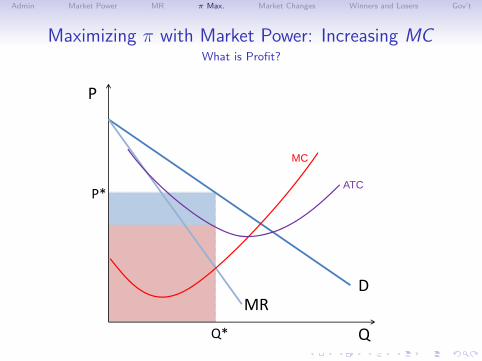
Maximizing π with Market Power: Increasing MCWhat is Profit?
P
D
Q
MR
Q*
P*
MC
ATC
Admin Market Power MR π Max. Market Changes Winners and Losers Gov’t
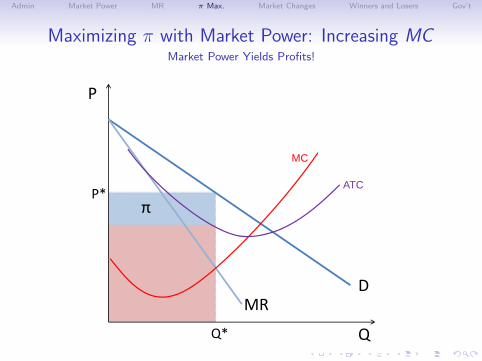
Maximizing π with Market Power: Increasing MCMarket Power Yields Profits!
P
D
Q
MR
Q*
P*
MC
ATC
π
Admin Market Power MR π Max. Market Changes Winners and Losers Gov’t
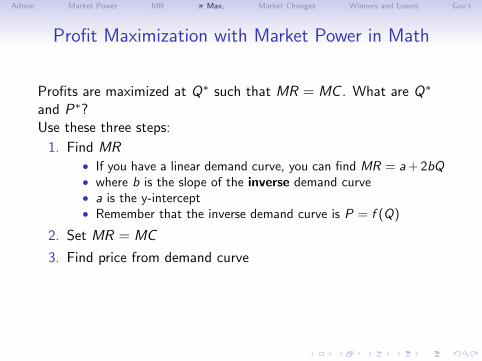
Profit Maximization with Market Power in Math
Profits are maximized at Q∗ such that MR = MC . What are Q∗
and P∗?Use these three steps:
1. Find MR• If you have a linear demand curve, you can find MR = a+ 2bQ• where b is the slope of the inverse demand curve• a is the y-intercept• Remember that the inverse demand curve is P = f (Q)
2. Set MR = MC
3. Find price from demand curve
Do not confuse MC curve with true supply curve, which isindependent of demand.
Admin Market Power MR π Max. Market Changes Winners and Losers Gov’t
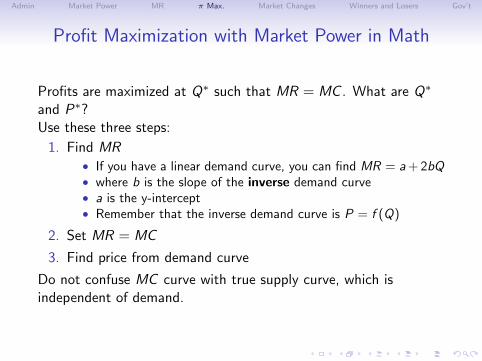
Profit Maximization with Market Power in Math
Profits are maximized at Q∗ such that MR = MC . What are Q∗
and P∗?Use these three steps:
1. Find MR• If you have a linear demand curve, you can find MR = a+ 2bQ• where b is the slope of the inverse demand curve• a is the y-intercept• Remember that the inverse demand curve is P = f (Q)
2. Set MR = MC
3. Find price from demand curve
Do not confuse MC curve with true supply curve, which isindependent of demand.

Admin Market Power MR π Max. Market Changes Winners and Losers Gov’t
How a Firm with Market Power
Reacts to Market Changes
Admin Market Power MR π Max. Market Changes Winners and Losers Gov’t
Three Changes
1. Change in marginal cost
2. Outward shift in demand
3. Rotation of demand curve
Admin Market Power MR π Max. Market Changes Winners and Losers Gov’t
Competitive Market and an Increase in MC
What happens to the equilibrium price and quantity?
• Supply curve shifts inward
• If supply is elastic, curve just shifts up
• Price increases
• Equilibrium Q declines
• In the long run, cost increases fully passed along to consumers
Admin Market Power MR π Max. Market Changes Winners and Losers Gov’t
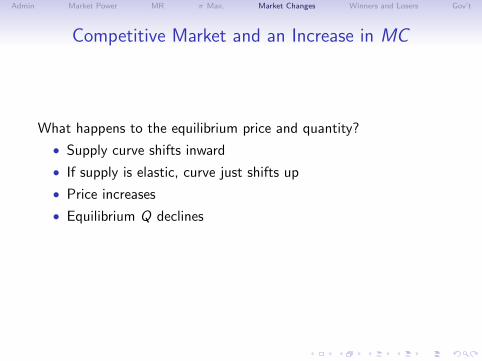
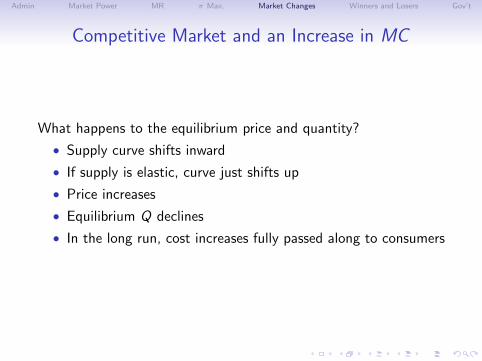
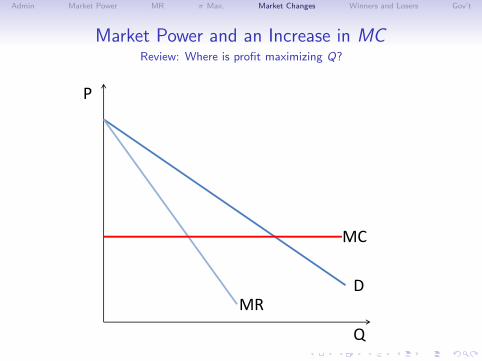
Market Power and an Increase in MCReview: Where is profit maximizing Q?
P
D
Q
MR
MC
Admin Market Power MR π Max. Market Changes Winners and Losers Gov’t
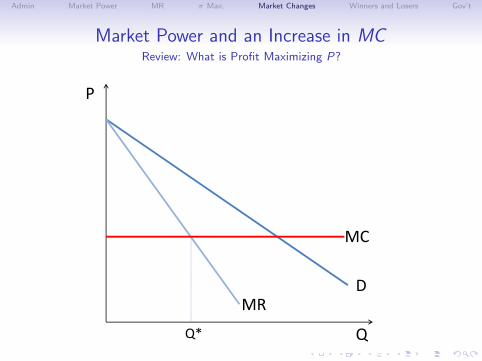
Market Power and an Increase in MCReview: What is Profit Maximizing P?
P
D
Q
MR
MC
Q*
Admin Market Power MR π Max. Market Changes Winners and Losers Gov’t
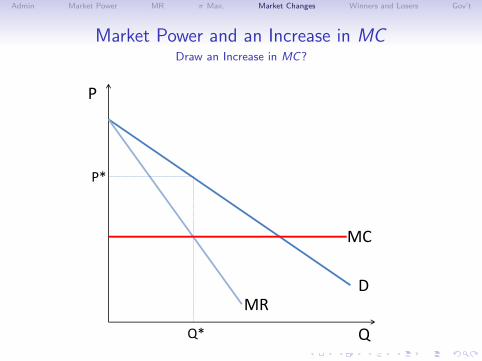
Market Power and an Increase in MCDraw an Increase in MC?
P
D
Q
MR
MC
Q*
P*
Admin Market Power MR π Max. Market Changes Winners and Losers Gov’t
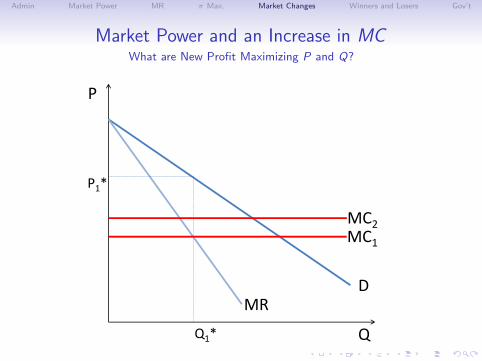
Market Power and an Increase in MCWhat are New Profit Maximizing P and Q?
P
D
Q
MR
MC1
Q1*
P1*
MC2
Admin Market Power MR π Max. Market Changes Winners and Losers Gov’t
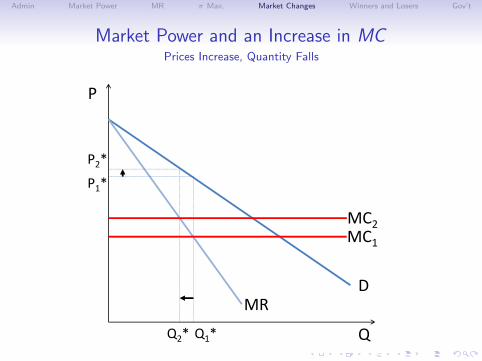
Market Power and an Increase in MCPrices Increase, Quantity Falls
P
D
Q
MR
MC1
Q1*
P1*
MC2
P2*
Q2*
Admin Market Power MR π Max. Market Changes Winners and Losers Gov’t
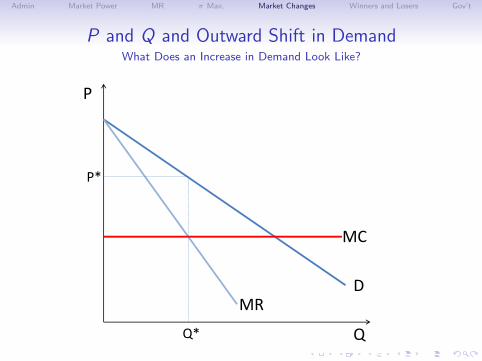
P and Q and Outward Shift in DemandWhat Does an Increase in Demand Look Like?
P
D
Q
MR
MC
Q*
P*
Admin Market Power MR π Max. Market Changes Winners and Losers Gov’t
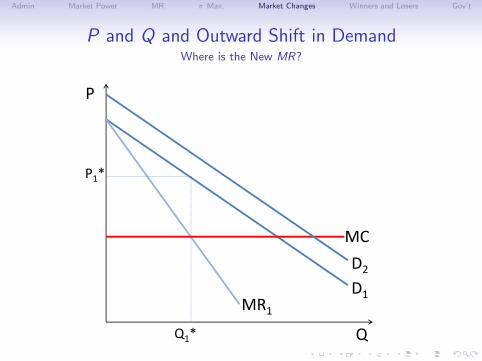
P and Q and Outward Shift in DemandWhere is the New MR?
P
D1
Q
MR1
MC
Q1*
P1*
D2
Admin Market Power MR π Max. Market Changes Winners and Losers Gov’t
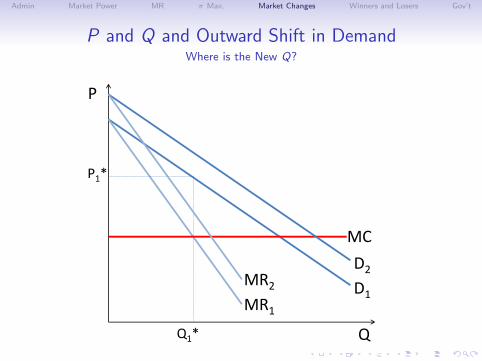
P and Q and Outward Shift in DemandWhere is the New Q?
P
D1
Q
MR1
MC
Q1*
P1*
D2MR2
Admin Market Power MR π Max. Market Changes Winners and Losers Gov’t
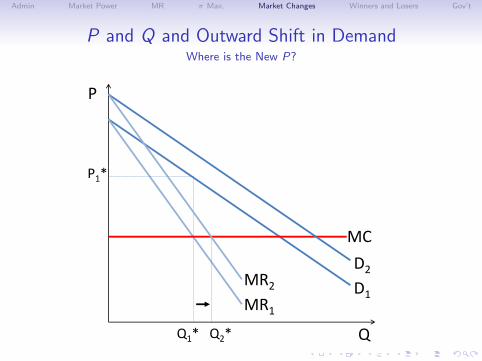
P and Q and Outward Shift in DemandWhere is the New P?
P
D1
Q
MR1
MC
Q1*
P1*
D2MR2
Q2*
Admin Market Power MR π Max. Market Changes Winners and Losers Gov’t
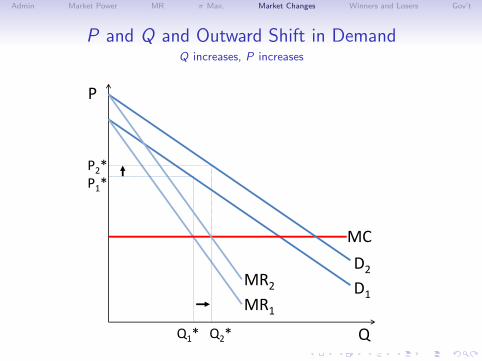
P and Q and Outward Shift in DemandQ increases, P increases
P
D1
Q
MR1
MC
Q1*
P1*
D2MR2
P2*
Q2*
Admin Market Power MR π Max. Market Changes Winners and Losers Gov’t
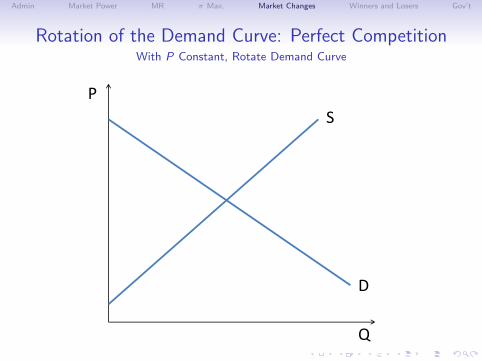
Rotation of the Demand Curve: Perfect CompetitionWith P Constant, Rotate Demand Curve
P
D
Q
S
Admin Market Power MR π Max. Market Changes Winners and Losers Gov’t
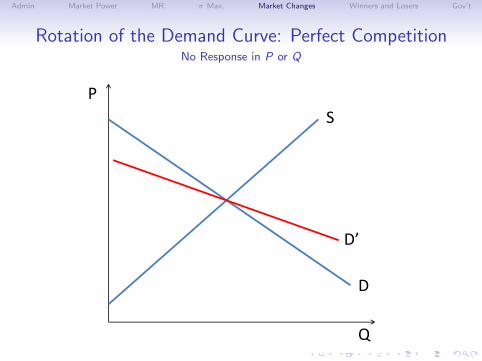
Rotation of the Demand Curve: Perfect CompetitionNo Response in P or Q
P
D
Q
S
D’
Admin Market Power MR π Max. Market Changes Winners and Losers Gov’t
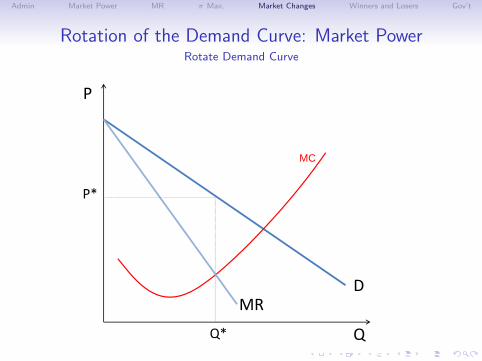
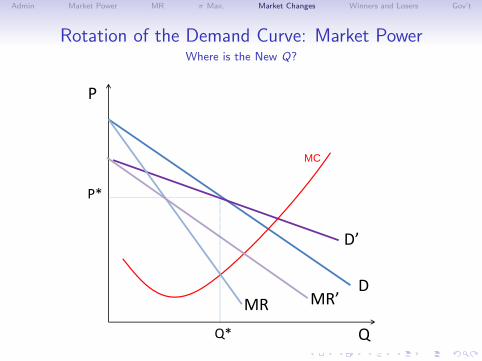
Rotation of the Demand Curve: Market PowerRotate Demand Curve
P
D
Q
MC
MR
Q*
P*

Admin Market Power MR π Max. Market Changes Winners and Losers Gov’t
Rotation of the Demand Curve: Market PowerWhere is New MR?
P
D
Q
D’
MC
MR
Q*
P*
Admin Market Power MR π Max. Market Changes Winners and Losers Gov’t
Rotation of the Demand Curve: Market PowerWhere is the New Q?
P
D
Q
D’
MC
MR MR’
Q*
P*
Admin Market Power MR π Max. Market Changes Winners and Losers Gov’t
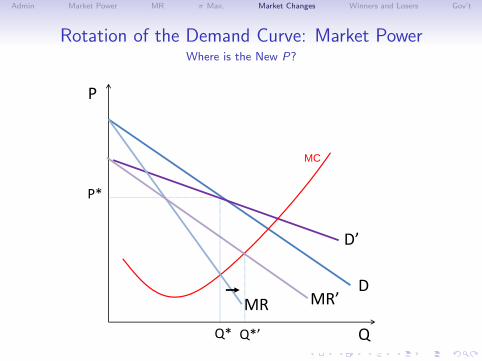
Rotation of the Demand Curve: Market PowerWhere is the New P?
P
D
Q
D’
MC
MR MR’
Q*
P*
Q*’
Admin Market Power MR π Max. Market Changes Winners and Losers Gov’t
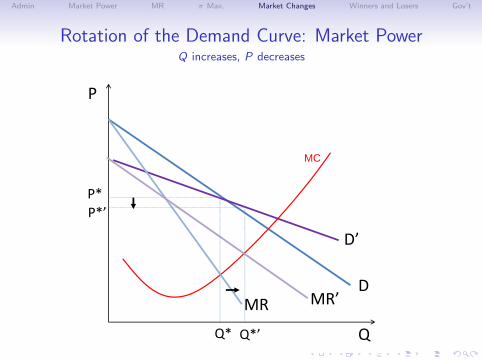
Rotation of the Demand Curve: Market PowerQ increases, P decreases
P
D
Q
D’
MC
MR MR’
Q*
P*
Q*’
P*’
Admin Market Power MR π Max. Market Changes Winners and Losers Gov’t
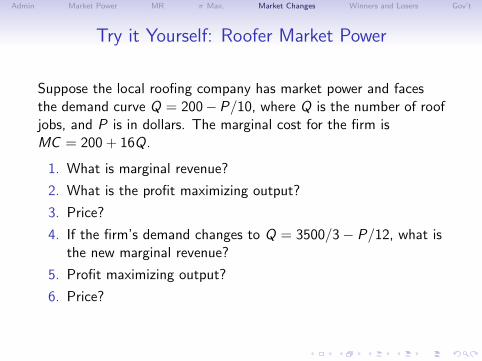
Try it Yourself: Roofer Market Power
Suppose the local roofing company has market power and facesthe demand curve Q = 200−P/10, where Q is the number of roofjobs, and P is in dollars. The marginal cost for the firm isMC = 200 + 16Q.
1. What is marginal revenue?
2. What is the profit maximizing output?
3. Price?
4. If the firm’s demand changes to Q = 3500/3− P/12, what isthe new marginal revenue?
5. Profit maximizing output?
6. Price?

Admin Market Power MR π Max. Market Changes Winners and Losers Gov’t
Winners and Losers
from Market Power
Admin Market Power MR π Max. Market Changes Winners and Losers Gov’t
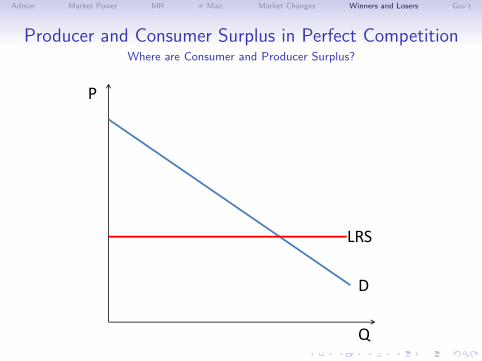
Producer and Consumer Surplus in Perfect CompetitionWhere are Consumer and Producer Surplus?
P
D
Q
LRS
Admin Market Power MR π Max. Market Changes Winners and Losers Gov’t
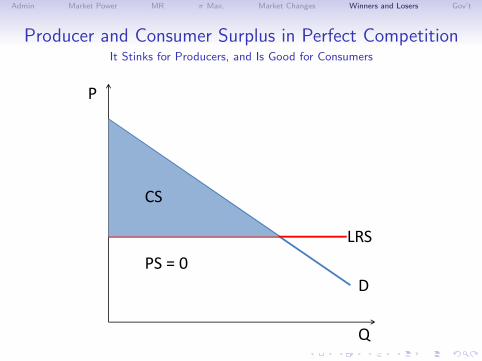
Producer and Consumer Surplus in Perfect CompetitionIt Stinks for Producers, and Is Good for Consumers
P
D
Q
LRS
CS
PS = 0
Admin Market Power MR π Max. Market Changes Winners and Losers Gov’t
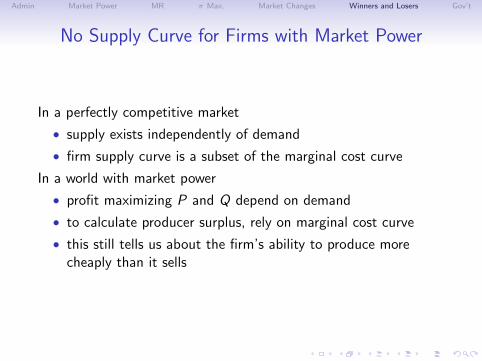
No Supply Curve for Firms with Market Power
In a perfectly competitive market
• supply exists independently of demand
• firm supply curve is a subset of the
marginal cost curve
In a world with market power
• profit maximizing P and Q depend on demand
• to calculate producer surplus, rely on marginal cost curve
• this still tells us about the firm’s ability to produce morecheaply than it sells
Admin Market Power MR π Max. Market Changes Winners and Losers Gov’t
No Supply Curve for Firms with Market Power
In a perfectly competitive market
• supply exists independently of demand
• firm supply curve is a subset of the marginal cost curve
In a world with market power
• profit maximizing P and Q depend on demand
• to calculate producer surplus, rely on marginal cost curve
• this still tells us about the firm’s ability to produce morecheaply than it sells
Admin Market Power MR π Max. Market Changes Winners and Losers Gov’t
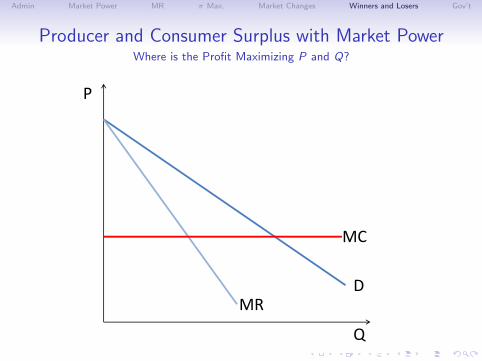
Producer and Consumer Surplus with Market PowerWhere is the Profit Maximizing P and Q?
P
D
Q
MR
MC
Admin Market Power MR π Max. Market Changes Winners and Losers Gov’t
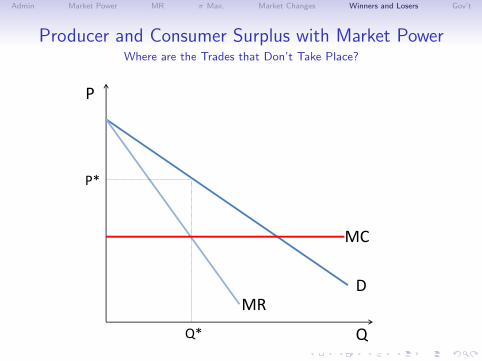
Producer and Consumer Surplus with Market PowerWhere are the Trades that Don’t Take Place?
P
D
Q
MR
MC
Q*
P*
Admin Market Power MR π Max. Market Changes Winners and Losers Gov’t
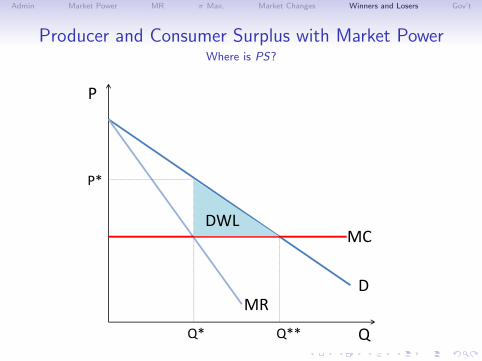
Producer and Consumer Surplus with Market PowerWhere is PS?
P
D
Q
MR
MC
Q*
P*
Q**
DWL
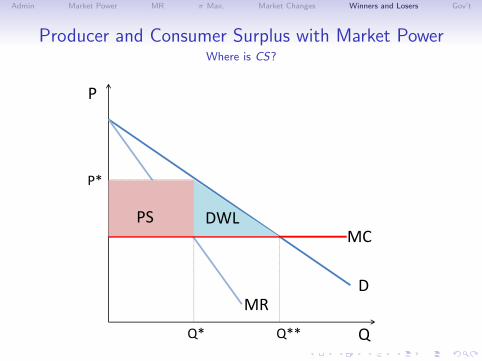
Admin Market Power MR π Max. Market Changes Winners and Losers Gov’t
Producer and Consumer Surplus with Market PowerWhere is CS?
P
D
Q
MR
MC
Q*
P*
Q**
DWLPS
Admin Market Power MR π Max. Market Changes Winners and Losers Gov’t
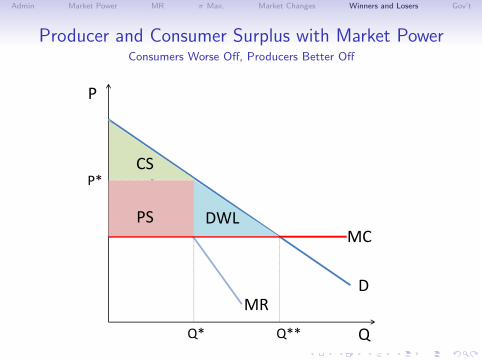
Producer and Consumer Surplus with Market PowerConsumers Worse Off, Producers Better Off
P
D
Q
MR
MC
Q*
P*
Q**
DWLPS
CS

Admin Market Power MR π Max. Market Changes Winners and Losers Gov’t
Government’s Role
In the Presence of Market Power

Admin Market Power MR π Max. Market Changes Winners and Losers Gov’t
A Role for Government
Economists believe that may be a role for government to improveefficiency if the market is not perfectly competitive.
• Direct price regulation
• Antitrust
• Granting monopolies: patents and copyright
Admin Market Power MR π Max. Market Changes Winners and Losers Gov’t
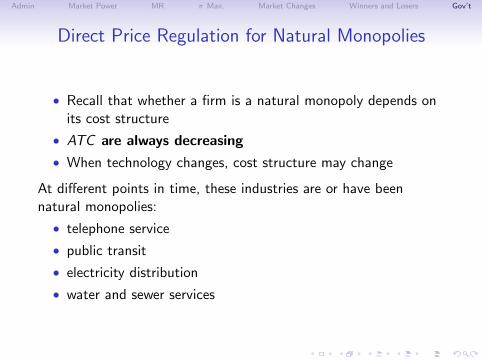
Direct Price Regulation for Natural Monopolies
• Recall that whether a firm is a natural monopoly depends onits cost structure
• ATC are always decreasing
• When technology changes, cost structure may change
At different points in time, these industries are or have beennatural monopolies:
• telephone service
• public transit
• electricity distribution
• water and sewer services
Admin Market Power MR π Max. Market Changes Winners and Losers Gov’t
How to Set the Regulated Price?
• With a true naturalmonopoly, it’s most efficientto have only one firm in themarket
• But might charge monopolyprice
• → government priceregulation
• Government cannot set aprice below ATC , even ifthis is the perfectlycompetitive price. Why?
• Because the firm would goout of business!
Admin Market Power MR π Max. Market Changes Winners and Losers Gov’t
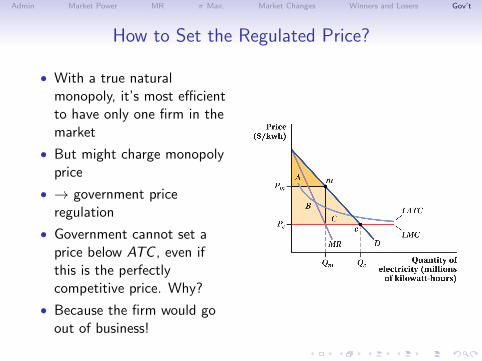
How to Set the Regulated Price?
• With a true naturalmonopoly, it’s most efficientto have only one firm in themarket
• But might charge monopolyprice
• → government priceregulation
• Government cannot set aprice below ATC , even ifthis is the perfectlycompetitive price. Why?
• Because the firm would goout of business!

Admin Market Power MR π Max. Market Changes Winners and Losers Gov’t
Recap of Today
• Market power
• Market power and marginal revenue
• Market power and profit maximization
• Reaction to market changes
• Welfare
• The role of government

Admin Market Power MR π Max. Market Changes Winners and Losers Gov’t
Next Class
• Turn in Problem Set 10
• Public Goods and externalities• GLS Chapter 16, pages 643-665 (sections 16.1 and 16.2)• Reading packet
• Gruber, Chapter 7, pages 184-189• Rosen and Gayer, Chapter 4, pages 54-70
• Two podcasts, linked on webpage