Kinetics of amyloid β-protein degradation determined by novelcontainer with a 35 kDa molecular...
33
Kinetics of amyloid β-protein degradation determined by novel fluorescence- and fluorescence polarization-based assays Malcolm A. Leissring, Alice Lu, Margaret M. Condron, David B. Teplow, Ross L. Stein*, Wesley Farris & Dennis J. Selkoe Center for Neurologic Diseases, Harvard Medical School and Brigham and Women’s Hospital Boston, MA 02115 and the *Laboratory for Drug Discovery in Neurodegeneration Harvard Center for Neurodegeneration and Repair 65 Lansdowne Street Cambridge, MA 02135 Correspondence to: Dennis J. Selkoe Harvard Institutes of Medicine 77 Avenue Louis Pasteur Boston, MA 02115 Ph 617 525-5200 Fx 617 525-5252 Email: [email protected] Copyright 2003 by The American Society for Biochemistry and Molecular Biology, Inc. JBC Papers in Press. Published on July 16, 2003 as Manuscript M305627200 by guest on June 14, 2020 http://www.jbc.org/ Downloaded from
Transcript of Kinetics of amyloid β-protein degradation determined by novelcontainer with a 35 kDa molecular...
Kinetics of amyloid ββββ-protein degradation determined by novel
fluorescence- and fluorescence polarization-based assays
Malcolm A. Leissring, Alice Lu, Margaret M. Condron, David B. Teplow,
Ross L. Stein*, Wesley Farris & Dennis J. Selkoe
Center for Neurologic Diseases, Harvard Medical School and
Brigham and Women’s Hospital Boston, MA 02115
and the
*Laboratory for Drug Discovery in Neurodegeneration
Harvard Center for Neurodegeneration and Repair 65 Lansdowne Street
Cambridge, MA 02135
Correspondence to: Dennis J. Selkoe Harvard Institutes of Medicine 77 Avenue Louis Pasteur Boston, MA 02115 Ph 617 525-5200 Fx 617 525-5252 Email: [email protected]
Copyright 2003 by The American Society for Biochemistry and Molecular Biology, Inc.
JBC Papers in Press. Published on July 16, 2003 as Manuscript M305627200 by guest on June 14, 2020
http://ww
w.jbc.org/
Dow
nloaded from
ABSTRACT
Proteases that degrade the amyloid β-protein (Aβ) are important regulators of
brain Aβ levels in health and in Alzheimer’s disease, yet few practical methods exist to
study their detailed kinetics. Here, we describe robust and quantitative Aβ degradation
assays based on the novel substrate, fluorescein-Aβ(1-40)-lys-biotin (FAβB). Liquid-
chromatography/mass spectrometric analysis shows that FAβB is hydrolyzed at closely
similar sites as wild-type Aβ by neprilysin and insulin-degrading enzyme, the two most
widely studied Aβ-degrading proteases. The derivatized peptide is an avid substrate and
is suitable for use with biological samples and in high-throughput compound screening.
The assays we have developed are easily implemented and are particularly useful for the
generation of quantitative kinetic data, as we demonstrate by determining the kinetic
parameters of FAβB degradation by several Aβ-degrading proteases, including plasmin,
which has not previously been characterized. The use of these assays should yield
additional new insights into the biology of Aβ-degrading proteases and facilitate the
identification of activators and inhibitors of such enzymes.
by guest on June 14, 2020http://w
ww
.jbc.org/D
ownloaded from

INTRODUCTION
Progressive accumulation of the amyloid-β protein (Aβ) in brain regions
important for memory and cognition is a defining pathogenic feature of Alzheimer’s
disease (AD). Nevertheless, the causes of elevated brain Aβ levels in the vast majority of
AD patients remain unknown. With the exception of rare familial forms of the disease,
there is little evidence that AD is attributable to the overproduction of Aβ. Instead, failed
clearance of the peptide—including defects in its proteolytic degradation—could underlie
its accumulation with age, a possibility that is gaining increasing experimental support
(1). Significant elevations in cerebral Aβ levels have now been observed in vivo in gene-
targeted mice lacking each of several Aβ-degrading proteases: neprilysin (NEP; Ref. 2),
endothelin-converting enzymes-1 and -2 (3), and insulin-degrading enzyme (IDE; Refs.
4,5). Moreover, several genetic studies have reported linkage and/or allelic association
between late-onset AD and polymorphisms near or within the IDE gene on chromosome
10q (Refs. 6-8).
Progress in elucidating the mechanisms underlying the production of Aβ from its
protein precursor, APP, by the β- and γ-secretases has depended critically on the
development of sensitive, reliable and accessible assays for quantifying Aβ levels in
biological samples. More recently, assays for directly measuring the activity of the
secretases have been described (9-11), enabling significant progress in the biochemical
characterization of these proteases and the identification and characterization of small-
molecule inhibitors. In contrast, relatively few techniques and assays for studying Aβ
degradation have been reported, and the most commonly used general methods (e.g.,
by guest on June 14, 2020http://w
ww
.jbc.org/D
ownloaded from
measurement of radiolabeled peptides by trichloroacetic acid (TCA) precipitation or
HPLC) are cumbersome and ill-suited for accurate quantification of kinetic constants or
for high-throughput assays. To overcome these difficulties, we have developed novel
degradation assays based on a derivatized Aβ peptide, fluorescein-Aβ(1-40)-lys-biotin
(FAβB). This substrate is efficiently degraded by several known Aβ-degrading proteases
and shows a similar inhibition profile as wild-type Aβ in biological samples. The assays
we describe are sensitive, quantitative and easily implemented, with one version
requiring no specialized equipment other than a fluorometer. In addition, we describe a
versatile fluorescence polarization (FP)-based assay that is both highly quantitative and
suitable for high-throughput compound screening. We use these assays to quantify the
kinetics of Aβ degradation by IDE, NEP and plasmin.
by guest on June 14, 2020http://w
ww
.jbc.org/D
ownloaded from
MATERIALS AND METHODS
Aβ peptides Fluorescein-Aβ1-40-lys-biotin and fluorescein-Aβ1-28-biotin were synthesized
by New England Peptide, Inc. (Fitchburg, MA). Biotin was attached to the carboxyl
terminal lysine side chain via an aminocaproic linker, and 5(6) carboxyfluorescein
(Sigma C7153) was attached to the amino terminus via a peptide bond. Non-derivatized
(wild-type) Aβ peptides were synthesized on an automated peptide synthesizer (Applied
Biosystems model 433A) by 9-fluorenylmethoxycarbonyl-based methods. In preparation
for quantitative kinetic determinations, aggregated species were removed by centrifuging
freshly-dissolved peptide (~20 to ~150 µM in 50 mM Tris-HCl, pH 7.4) at 100,000 g for
3 h and carefully removing the top 2/3 of the resulting supernate, which was immediately
aliquoted and stored at –80oC until further use. Peptide concentrations were determined
by amino acid analysis.
Amino acid analysis Samples in 50-mm glass tubes were dried in vacuo, then transferred
to a hydrolysis vessel (Millipore, Marloborough, MA, USA; part no. 007603).
Approximately 300 µl 6 N HCl was added to the vessel, which was then alternatively
purged with nitrogen and evacuated three times before being sealed under vacuum.
Vapor phase hydrolysis was performed by heating at 110oC for 22 hr. Separation and
quantitation of amino acids was carried out on a Beckman Model 6300 Amino Acid
Analyzer. Each sample was analyzed in triplicate. Absolute peptide concentrations
typically ranged from 1/3 to 1/2 of the concentration calculated from lyophilized peptide
weight.
by guest on June 14, 2020http://w
ww
.jbc.org/D
ownloaded from
Proteases The cDNA for human IDE beginning with the translation start site at Met42
was subcloned into the pFastBacHT vector (Invitrogen), which codes for an amino-
terminal tag containing a 6xHis affinity tag followed by a Tobacco Etch Virus (TEV)
protease cleavage site. Baculovirus production and protein expression in Sf9 moth cells
were performed at the Wistar Institute (Univ. Pennsylvania). Recombinant IDE protein
was then purified from snap-frozen Sf9 cell pellets by cobalt metal affinity
chromatography according to the manufacturer’s recommendations (Clontech), and the
affinity tag was removed by treatment with TEV protease (1000 U per mg recombinant
protein) for 2 hr at 22o C (Invitrogen). The 6xHis-containing tag and any residual tagged
protein were separated from the cleaved IDE by cobalt affinity chromatography, followed
by overnight dialysis against two changes of 20 mM KH2PO4, pH 7.3, using a dialysis
container with a 35 kDa molecular weight cut-off (MWCO; Millipore). Finally, to
separate full-length ~113-kDa recombinant IDE from a prominent ~70-kDa truncated
species, the sample was washed and concentrated using a 100 kDa MWCO centrifugal
filter column (Amicon). Recombinant IDE was stored in aliquots in 100 mM KH2PO4,
pH 7.3, plus 20% glycerol at –80o C until further use. Recombinant rabbit sNEP
produced in P. Pastoris (12) was a gift from Drs. Guy Boileau and Philippe Crine (Univ.
Montreal). Human plasmin was purchased from Calbiochem/Novabiochem. Prior to
initiation of quantitative studies, each protease was tested in various buffers (e.g.,
HEPES, Tris-HCl, Bis-Tris-Propane, KH2PO4) containing either no salt or 100 mM
NaCl. Negligible variation in proteolytic activity was observed across conditions, thus
we elected to utilize a buffer resembling physiologic conditions (Buffer A: 50 mM
HEPES, 100 mM NaCl, 0.05% BSA, pH 7.4) for all subsequent degradation assays.
by guest on June 14, 2020http://w
ww
.jbc.org/D
ownloaded from

Liquid chromatography / mass spectrometry (LC/MS)
Reverse-phase-high performance liquid chromatography was done on a Vydac diphenyl
column (5 µm; 1 mm X 150 mm; Hesperia, CA), using a linear gradient (20-80%) of
acetonitrile in 0.1% trifluoro acetic acid over 60 minutes. All components were
monitored by UV and visible light absorbance using a Surveyor PDA (3 channel outputs
at 214, 259 and 495 nm) with a scan rate of 1 Hz and scan step of 1 nm. A nanospray ion
source with 100 a µm ID-fused silica capillary was used to introduce the column effluent
into an LCQDeca Mass Spectrometer, analyzed in a positive ion mode with a scan range of
200-2500 amu, using the following source conditions: capillary temperature: 250oC;
spray voltage: 4.56 kV; capillary voltage: 46.11 V; sheath gas: 86.96 (arbitrary units);
auxiliary gas: 2.68 (arbitrary units).
FAβB degradation assay using avidin-agarose precipitation (AP) For progress curves
and dose-response experiments, each protease (1 – 400 nM final conc.) was dissolved in
0.5 mL Buffer A in 0.65-mL siliconized microcentrifuge tubes (Costar), and the reaction
was initiated by adding 100 uL of 6 µM FAβB. For kinetic determinations, different
concentrations of FAβB (0.25 – 150 µM final conc.) were dissolved in 0.5 mL Buffer A,
and the reaction was initiated by adding 100 µL diluted protease. At various time points
(0, 5, 10 min), 80 µL of the reaction mixture was removed and quenched in 0.72 mL
Buffer A supplemented with the appropriate protease inhibitor (2 mM 1,10-
phenanthroline for IDE and NEP, or 1 mM PMSF for plasmin). Uncleaved FAβB
substrate was precipitated from each quenched reaction by addition of suitable quantities
of NeutravidinTM–coated agarose beads (Pierce) followed by gentle rocking for 30 min
by guest on June 14, 2020http://w
ww
.jbc.org/D
ownloaded from

and centrifugation at 14,000 g for 10 min. The supernate (containing cleaved
fluorescein-Aβ fragments) was carefully transferred in three 200-µL aliquots to black 96-
well plates (Nunc), and fluorescence intensity (488 ex, 515 em) was measured using a
Victor2 multilabel plate reader (PerkinElmer). All AP assays were performed at 37 oC.
Activity was normalized to control reactions containing either no protease or excess
protease. Quantitative kinetic data were derived by hyperbolic regression analysis using
the computer program HYPER.EXE created by John S. Easterby (Univ. Liverpool, UK).
FAβB degradation assays using fluorescence polarization (FP) FP degradation assays
carried out at 37 oC were performed as above, except that 30 µL aliquots were quenched
in 170 µL Buffer A supplemented with 1 µM egg-white avidin (Molecular Probes) plus
appropriate protease inhibitor(s). After incubating at room temperature for 15 min,
quenched reactions were loaded in quadruplicate onto “non-binding surface” 384-well
plates (Corning), and fluorescence polarization (ex 488, em 515) was determined using a
Victor2 multilabel plate reader (PerkinElmer).
Robot-assisted, high-throughput FP FAβB degradation assays High-throughput
experiments were conducted on a customized apparatus (SAGIAN, Beckman) containing
a 3-meter rail ORCA robot that integrates a Biomek FX liquid handling station, a
SAGIAN Core System, and SAGIAN 6-plate shaker. Recombinant IDE (0.3-3 nM final
conc.) dissolved in Buffer A (20 µL/well) was loaded onto “non-binding surface” 384-
well plates (Corning). Following a 20-min incubation period at room temperature, FAβB
(1 µM) in Buffer A (20 µL/well) was added to initiate the reactions. Reactions were
by guest on June 14, 2020http://w
ww
.jbc.org/D
ownloaded from
terminated with 10 µL/well of Buffer A supplemented with 10 mM 1,10 phenanthroline
and 5 µM avidin. FP values were determined on a LJL Analyst HT (488 ex, 515 em).
Performance of the assay in the high throughput format was evaluated by
computing the Z-factor values (13) according to the following formula:
Z = 1 – (3 * (σHI + σLO)) ΧHI - ΧLO
where σHI and σLO designate the standard deviations, and ΧHI and ΧLO the means, of
data from internal controls representing 100% and 0% activity, respectively. Using this
formula, an ideal assay would have a Z-factor value approaching 1.0, and assays with
values below ~0.5 would generally be considered unreliable.
Inhibitor profiles determined in rat brain membrane fractions using FAβB FP
versus 125I-Aβ(1-40)-TCA-precipitation assays Fresh-frozen rat cerebral hemispheres were
homogenized in 8 volumes (w:v) of 0.25 M sucrose in 50 mM Tris HCl (pH 7.4) in a
Potter-Elvehjem homogenizer. After pelleting nuclei and unbroken cells, the supernate
was spun again at 100,000g for 1 h. This resulting supernate was saved as the soluble
fraction, and the membrane pellet was washed in 100 mM Na2CO3 (pH 11.3) to linearize
microsomes and strip adventitiously associated proteins (14). The membranes were
pelleted by another 1-hr spin at 100,000g, resuspended in 50 mM Tris HCl (pH 7.4), and
sonicated by a 10-s pulse with a Model 300 Sonic Dismembrator (Fisher) set at 60%
maximum power. Protein concentrations were determined using a bicinchoninic acid-
based protein assay (Pierce). For TCA precipitation-based Aβ degradation assays, 100
by guest on June 14, 2020http://w
ww
.jbc.org/D
ownloaded from
pM synthetic human 125I-Aß1-40 (Amersham) was incubated at 37°C with 100µg/mL
membrane fractions in 50 mM Tris HCl (pH 7.4) with or without various inhibitors. At
various time points (e.g., 3, 6 hr), an aliquot of the sample was added to an equal volume
of 15% TCA to precipitate uncleaved peptides. Following centrifugation, radioactivity in
the TCA-insoluble pellet (undegraded peptide) and TCA supernate (degraded peptide
fragments) were determined, and the percent of radiolabeled substrate degraded was
calculated. The FP assay was performed as described above using identical quantities of
the same brain membranes. Recombinant insulin, purified glucagon, thiorphan and 1,10
phenanthroline were from Sigma.
by guest on June 14, 2020http://w
ww
.jbc.org/D
ownloaded from
RESULTS
FAββββB and wild-type Aβ β β β are cleaved at similar sites by IDE and NEP To identify the
cleavage sites of wild-type and derivatized Aβ peptides, aliquots of each peptide (10-50
µM final conc.) were digested with IDE or NEP for various lengths of time at 37oC, and
the resulting peptide fragments were analyzed by liquid chromatography/mass
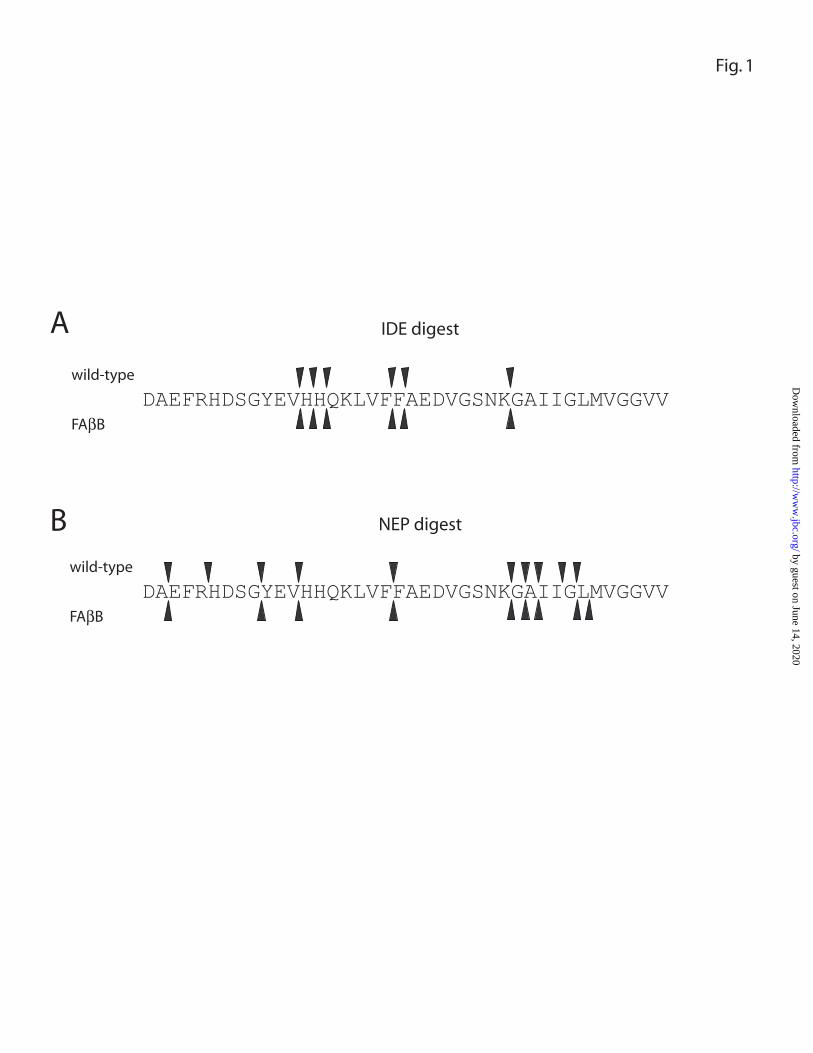
spectrometry. Consistent with previous reports (15-17), wild-type Aβ1-40 was hydrolyzed
by IDE primarily at the Val13-His14, His14-His15, His15-Gln16, Phe19-Phe20, Phe20-
Ala21 and Lys28-Gly29 peptide bonds, and FAβB was hydrolyzed at identical sites (Fig.
1A and Table 1). The major peptide fragments detected immediately following IDE
hydrolysis were, in order of abundance, Asp1-His14, Asp1-His13, Asp1-Lys28, Asp1-
Phe19 and Phe20-Val40. Upon incubation with NEP, both wild-type Aβ1-40 and FAβB
were cleaved predominantly at identical peptide bonds, including several detected
previously (Glu9-Tyr10, Phe19-Phe20, Ala30-Ile31 and Glu33-Leu34; Ref. 18) as well
as others not previously reported (e.g., Ala2-Glu3, His13-His14; Fig. 1B and Table 2).
The initial peptide fragments detected, in order of abundance, were Phe20-Ala30, Phe20-
Lys28, Phe20-Gly29 and His14-Gly25.
Measurement of FAββββB proteolysis by fluorescence polarization Fluorescence
polarization (FP) is a sensitive method for measuring the relative mass of fluorescent
molecules in solution (19). Stationary fluorescent molecules, when excited with plane-
polarized light, emit photons polarized in the same plane as (or at a fixed angle to) the
light used for excitation. Fluorescent molecules in solution, by contrast, rotate – or
by guest on June 14, 2020http://w
ww
.jbc.org/D
ownloaded from

tumble – at a rate that is inversely proportional to their mass. Because there is an
appreciable time delay between absorption and emission of photons by the fluorescent
molecule, tumbling causes emitted light to be depolarized relative to the plane-polarized
light used for excitation. The degree of depolarization (reflecting the average mass of all
fluoresceinated species) can be quantified accurately using appropriately equipped
fluorometers.
To effectively measure proteolysis using FP, there must be a substantial mass
difference between the intact, fluorescently tagged substrate and the cleaved,
fluorescently tagged proteolytic fragments. The addition of a biotin moiety at the
opposite end of the molecule to the fluorescent tag allows the molecular weight of the
intact substrate to be increased (to approximately 70 kD) by adding excess avidin at the
end of the reaction. The molecular weights of the cleaved, fluoresceinated N-terminal
fragments (< 4 kD), by contrast, remain unaffected by the presence of avidin and tumble
rapidly. The relative amounts of cleaved and uncleaved substrate can then be accurately
measured using FP. The robust and reproducible nature of our FP-based FAβB
degradation assay is illustrated in Fig. 2A, which shows progress curves with very small
standard deviations for the degradation of FAβB by IDE or by NEP.
Because of concern about the tendency of Aβ peptides to aggregate and/or adsorb
non-specifically to the surfaces of reaction vessels, we also tested a version of the
derivatized substrate lacking the hydrophobic carboxy-terminal 12 amino acids, i.e.,
fluorescein-Aβ(1-28)-biotin. However, this species proved to be a relatively poor substrate
for IDE and other Aβ-degrading proteases (data not shown) and was not pursued further.
We were able to overcome adsorption problems associated with full-length FAβB
by guest on June 14, 2020http://w
ww
.jbc.org/D
ownloaded from

substrate by adding 0.05% bovine serum albumin to the assay buffer and by keeping the
substrate concentration above 20 nM (see below).
Measurement of FAββββB proteolysis by avidin-agarose precipitation The FAβB
substrate can be incorporated into another fluorescence-based degradation assay we
developed that does not require the specialized equipment used to measure FP. In this
assay, avidin-conjugated agarose beads are used to centrifugally separate uncleaved
FAβB from the fluoresceinated (non-biotinylated) amino-terminal proteolytic fragments;
the amount of fluorescence remaining in the supernatant corresponds directly to the
amount of proteolysis. As shown in Fig. 2B, this “avidin-agarose precipitation” (AP)
method yielded virtually identical results to the FP-based method in parallel experiments
(cf. Fig. 2A, B; see also Figs. 3A, B). While the AP assay has the advantage of requiring
no specialized equipment, the requirement for a centrifugation step precludes its use in
high-throughput compound screening; consequently, our further work focused on the
validation and miniaturization of the FP assay.
Specificity of the FAββββB substrate in biological samples To test the FP FAβB
degradation assay with biological material, we determined the inhibition profile of FAβB
using bicarbonate-washed rat brain membrane fractions, which contain a wide array of
proteases, and compared the result to that determined using a standard 125I-Aβ1-40/TCA
precipitation assay (4,20). As we have recently reported elsewhere (4), the majority of
125I-Aβ1-40 degradation in membrane fractions is competitively inhibited by insulin or
glucagon, which are avid IDE substrates, whereas a smaller fraction is inhibited by
by guest on June 14, 2020http://w
ww
.jbc.org/D
ownloaded from
thiorphan, which is a potent inhibitor of NEP (Fig. 2C). 1,10 phenanthroline, a broad-
spectrum inhibitor of zinc-metalloproteases, also strongly inhibited 125I-Aβ1-40
degradation, as expected. Hydrolysis of FAβB, determined in the same biological
samples using the FP assay, exhibited a highly similar inhibition profile (Fig. 2D). Thus,
FAβB is an avid substrate for multiple known Aβ-degrading proteases and is suitable for
in vitro degradation assays on biological samples.
Validation of the FP assay To directly test the linearity of the FP assay, we determined
the polarization values produced by aliquots of FAβB (1 µM) containing predetermined
percentages of uncleaved substrate and substrate previously digested with IDE or NEP.
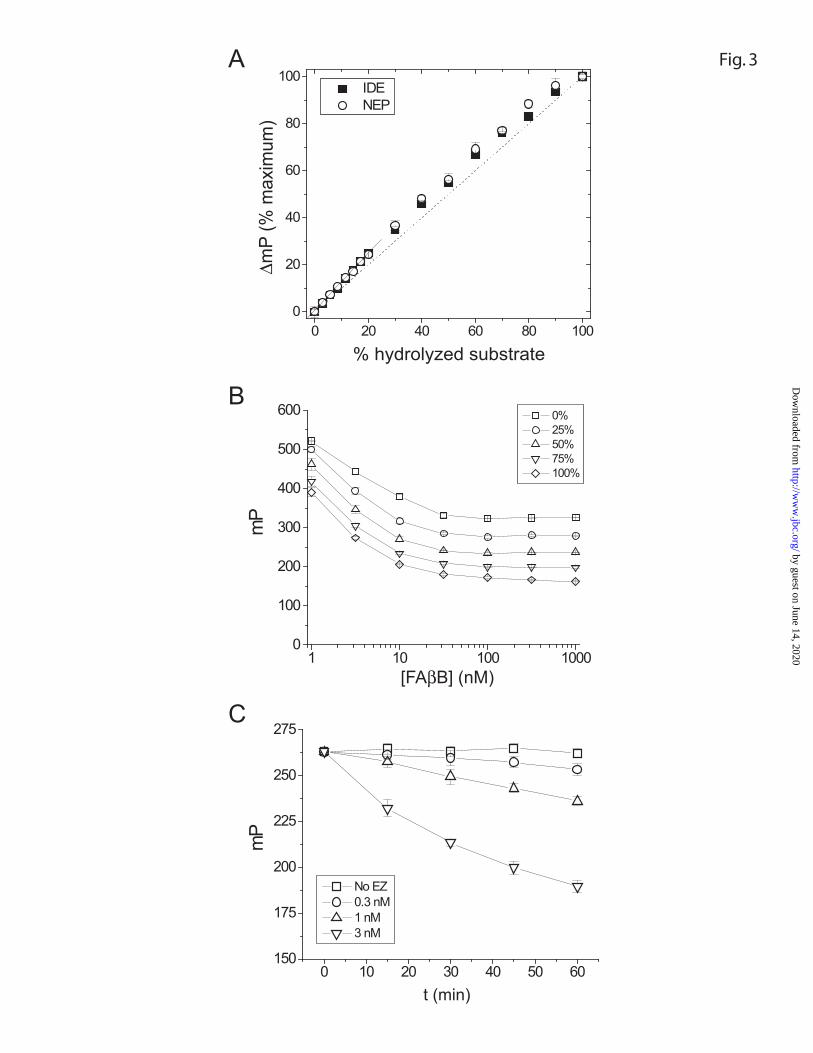
As shown in Figure 3A, the change in polarization values, normalized to the maximum
obtained with each protease, varied in a near-linear fashion with percentage hydrolyzed
substrate. Because quantitative assays depend on accurate determinations of the initial
velocities of substrate hydrolysis, which are typically determined from the first 10-20%
of a progress curve, we quantified the deviation from linearity observed in this range. The
FP assay was found to overestimate the initial velocity by approximately 10% for
hydrolysis by either protease (see Fig. 3A). Hence, this figure was used as a correction
factor in subsequent quantitative determinations (see Fig. 4A).
During the development of the FP assay, we initially sought to maintain a low
(nM) substrate concentration before reading the polarization values, as such levels are
typically used for FP applications. This constraint precluded attempts to miniaturize the
assay for high throughput screening, because proteolysis was inefficient and highly
variable at such low substrate concentrations, and because protocols involving further
by guest on June 14, 2020http://w
ww
.jbc.org/D
ownloaded from
dilution of the substrate were undesirable. However, additional testing revealed that the
FP assay was actually most linear, in terms of absolute polarization values, in the range
of substrate concentrations between 100 and 1000 nM (Fig. 3B). The working range
could be extended further provided the resultant data were normalized to empirically
determined maximal and minimal polarization values at each substrate concentration (see
below), and in practice, such normalization was routinely used. This range of suitable
substrate concentrations in the FP assay had several practical benefits, particularly for
kinetic analyses requiring variable concentrations of substrate.
High-throughput FP degradation assay To test the performance of the FP assay in a
high-throughput, robot-assisted format, various concentrations of recombinant IDE (0.3 –
3 nM final conc.) were transferred robotically to 384-well plates containing 0.2 µL
DMSO (0.5% final conc.). The reactions were initiated by adding FAβB (0.5 µM final
conc.) and terminated at various times by addition of assay buffer containing 1,10
phenanthroline and avidin. The assay performed superiorly in this format (Fig. 3C),
routinely yielding Z-factor values greater than 0.8 (see Materials and Methods).
Kinetic analysis of FAββββB degradation by IDE, NEP and plasmin The AP and FP
assays were used to obtain quantitative kinetic data for three different Aβ-degrading
proteases: IDE, NEP and plasmin. Data for endothelin-converting enzyme-1 and -2 were
not determined due to lack of availability of the purified enzyme. Because even freshly
dissolved Aβ peptides consist of unknown fractions of oligomerized species, we were
careful to first remove aggregated FAβB peptides by high-speed centrifugation and then
by guest on June 14, 2020http://w
ww
.jbc.org/D
ownloaded from
quantify the absolute concentration of peptide by amino acid analysis (see Materials and
Methods). Lineweaver-Burk plots of these kinetic determinations are illustrated in Figs.
4A-C, while quantitative data derived by hyperbolic regression analysis of the raw data
are provided in Table 3. For each protease, very similar quantitative kinetic data were
obtained with the AP and the FP assays, and the data were in even closer agreement after
correcting for the slight overestimation in initial velocity that occurs with the FP assay
(see above and Figs. 3A and 4A).
Applications of the FAββββB degradation assays To highlight the utility of the FP assay
in generating highly reliable quantitative data, we performed several demonstration
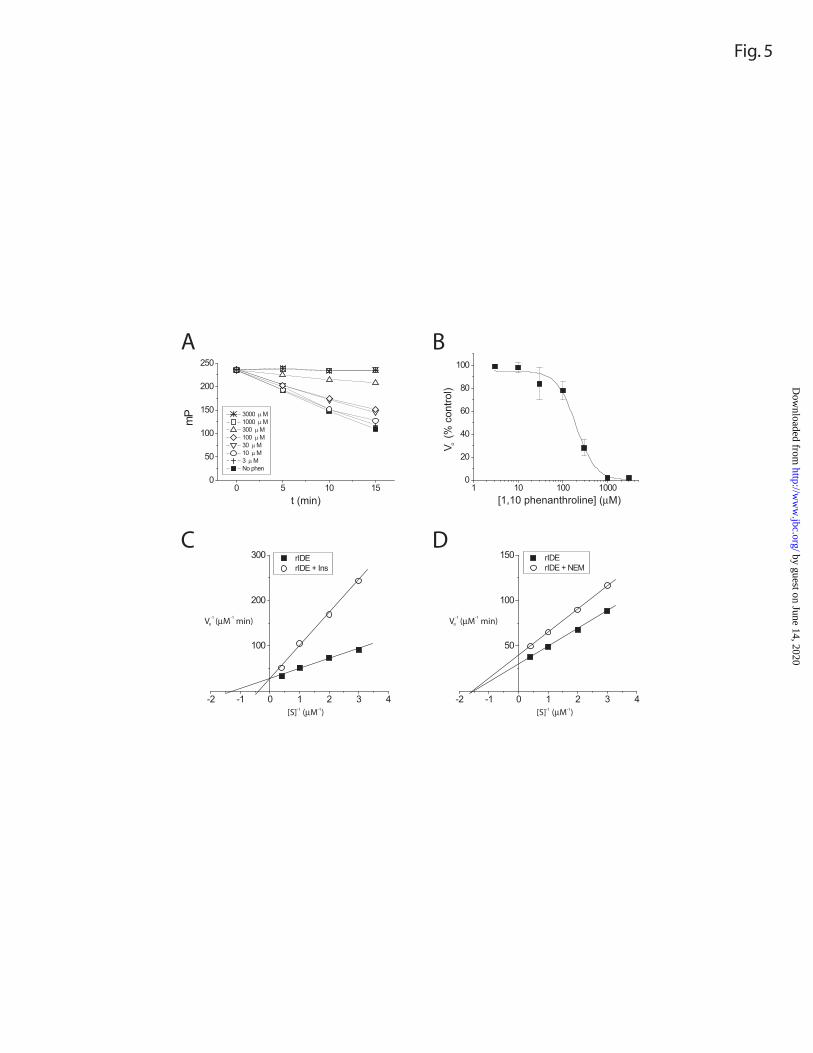
experiments using medium-throughput protocols optimized for 96-well plates. Fig. 5A
shows raw progress curves from a typical experiment that determined the IC50 for
inhibition of IDE-mediated FAβB degradation by 1,10 phenanthroline. The dose-
response relationship, determined from the average of 3 such experiments, is illustrated in
Fig. 5B. Fig. 5C shows Lineweaver-Burk plots for inhibition of FAβB degradation by
insulin, an avid substrate of IDE. Note that these results are characteristic of competitive
inhibition, as expected. For comparison, Fig. 5D shows comparable data for inhibition
by N-ethylmaleimide, an irreversible thiol-alkylating agent, and this experiment yielded
the expected profile for a non-competitive inhibitor. Collectively, these experiments
show that the FP FAβB degradation assay is highly quantitative, reproducible, and
capable of revealing insights into the detailed kinetics of Aβ-degrading proteases.
by guest on June 14, 2020http://w
ww
.jbc.org/D
ownloaded from
DISCUSSION
Evidence emerging from numerous laboratories has highlighted the importance
of Aβ-degrading proteases in regulating steady-state cerebral Aβ levels in vivo (2-5).
Inherited defects in one or more of these proteases could explain Aβ accumulation in
some cases of AD, but regardless of whether such genetic connections are found, these
enzymes provide potentially attractive drug targets for treating all cases of the disease.
However, traditional methods for studying Aβ degradation—e.g., TCA precipitation
assays with iodinated Aβ, HPLC analysis of synthetic radiolabeled or unlabeled Aβ, and
autoradiography of metabolically labeled Aβ—are ill-suited for high throughput
compound screening or routine quantitative assays. To meet this important need, we
have developed and characterized versatile and quantitative assays that utilize the
derivatized Aβ peptide, fluorescein-Aβ(1-40)-lys-biotin (FAβB).
Several lines of evidence indicate that degradation of FAβB is similar to that of
wild-type Aβ. First, the derivatized peptide is avidly degraded by several different
proteases that have been shown to degrade Aβ: IDE, NEP and plasmin. Second, liquid
chromatography/mass spectrometric analysis shows that wild-type and derivatized Aβ are
cleaved at nearly identical sites by IDE and NEP, the two most extensively characterized
Aβ-degrading proteases. Third, degradation of FAβB and 125I-Aβ1-40 show closely
similar inhibition profiles when incubated in biological samples containing an array of
competing proteases. These findings suggest that the fluorescein and lysine-biotin
moieties do not significantly alter the cleavage specificity of the substrates by the Aβ-
degrading proteases investigated here.
by guest on June 14, 2020http://w
ww
.jbc.org/D
ownloaded from
Additional support for the validity of our FAβB substrate comes from analysis of
quantitative data from kinetic determinations. Independent analyses using the FP- and
AP-based assays yielded quantitatively similar estimates of kinetic parameters for
hydrolysis, and this pertained for all three Aβ-degrading proteases. Moreover, kinetic
determinations using FAβB (Table 3) yielded absolute quantitative data that are in good
agreement with published values using wild-type synthetic Aβ. For instance, apparent km
values of approximately 2 µM have been reported for degradation of wild-type Aβ1-40 in
independent studies utilizing purified (21) or recombinant (22) human IDE. By
comparison, the apparent km values obtained using our FP and AP assays were 0.82 and
0.87 µM, respectively. While these values are lower than the published values, this
discrepancy disappears after it is noted that ~1/2 to 2/3 of the lyophilized peptide was
pelleted by high-speed centrifugation and thus in an aggregated state that is incapable of
degradation by IDE (see Ref. 23). Indeed, when freshly dissolved substrate was used, we
obtained kinetic parameters that closely matched the published values for IDE (km = 2.11
+ 0.20 µM). These results suggest that caution should be exercised in interpreting kinetic
data for Aβ degradation when the peptide’s aggregation state has not been characterized.
Our LC/MS analysis revealed that NEP-mediated hydrolysis of Aβ (both wild-
type and derivatized) occurred at substantially more sites than previously reported by
Howell and colleagues (18), with considerable heterogeneity observed at the carboxyl-
terminus of the peptide (Fig. 1B). This discrepancy may be explained by the fact that the
latter study focused only on the initial peptide fragments detectable upon hydrolysis with
NEP. However, it is also possible that our analysis was more sensitive, given the fact
that the LC and MS analyses were coupled within the same instrument. Relative to IDE,
by guest on June 14, 2020http://w
ww
.jbc.org/D
ownloaded from
it appears that NEP shows less cleavage specificity within Aβ. In addition, the km for
hydrolysis of FAβB by NEP (~14 µM) is more than 17 times larger than that for IDE
(~0.8 µM; see Table 1). We note that comparison to reported km values for Aβ
hydrolysis by NEP is complicated by the fact that we used a secreted form of rabbit NEP,
whereas published values for wild-type Aβ degradation were determined using
membrane-anchored NEP (24). However, the secreted NEP used in this study has been
directly compared to membrane-anchored NEP, and found to exhibit similar kinetics
parameters using the preferred substrate, {D-Ala2, D-Leu5}-enkephalin (12). To our
knowledge, the km value for Aβ degradation by plasmin has not been determined
previously.
In conclusion, we have developed sensitive and quantitative assays for the study
of the proteolytic degradation of Aβ. The assays are simple, highly reproducible,
inexpensive and suitable for high-throughput screening. Implementation of these assays
should yield novel insights into the detailed kinetics of various Aβ-degrading proteases
and facilitate the identification of novel small molecule pharmacophores.
by guest on June 14, 2020http://w
ww
.jbc.org/D
ownloaded from
REFERENCES
1. Selkoe, D. (2001) Neuron 32, 177-180 2. Iwata, N., Tsubuki, S., Takaki, Y., Shirotani, K., Lu, B., Gerard, N. P., Gerard, C.,
Hama, E., Lee, H. J., and Saido, T. C. (2001) Science 292, 1550-1552. 3. Eckman, E. A., Watson, M., Marlow, L., Sambamurti, K., and Eckman, C. B.
(2003) J Biol Chem 278, 2081-2084. 4. Farris, W., Mansourian, S., Chang, Y., Lindsley, L., Eckman, E. A., Frosch, M.
P., Eckman, C. B., Tanzi, R. E., Selkoe, D. J., and Guenette, S. (2003) Proc Natl Acad Sci U S A 100, 4162-4167.
5. Miller, B. C., Eckman, E. A., Sambamurti, K., Dobbs, N., Chow, K. M., Eckman, C. B., Hersh, L. B., and Thiele, D. L. (2003) Proc Natl Acad Sci U S A 100, 6221-6226.
6. Bertram, L., Blacker, D., Mullin, K., Keeney, D., Jones, J., Basu, S., Yhu, S., McInnis, M. G., Go, R. C., Vekrellis, K., Selkoe, D. J., Saunders, A. J., and Tanzi, R. E. (2000) Science 290, 2302-2303.
7. Li, Y. J., Scott, W. K., Hedges, D. J., Zhang, F., Gaskell, P. C., Nance, M. A., Watts, R. L., Hubble, J. P., Koller, W. C., Pahwa, R., Stern, M. B., Hiner, B. C., Jankovic, J., Allen, F. A., Jr., Goetz, C. G., Mastaglia, F., Stajich, J. M., Gibson, R. A., Middleton, L. T., Saunders, A. M., Scott, B. L., Small, G. W., Nicodemus, K. K., Reed, A. D., Schmechel, D. E., Welsh-Bohmer, K. A., Conneally, P. M., Roses, A. D., Gilbert, J. R., Vance, J. M., Haines, J. L., and Pericak-Vance, M. A. (2002) Am J Hum Genet 70, 985-993.
8. Ait-Ghezala, G., Abdullah, L., Crescentini, R., Crawford, F., Town, T., Singh, S., Richards, D., Duara, R., and Mullan, M. (2002) Neurosci Lett 325, 87-90.
9. Ermolieff, J., Loy, J. A., Koelsch, G., and Tang, J. (2000) Biochemistry 39, 16263.
10. Kimberly, W. T., Esler, W. P., Ye, W., Ostaszewski, B. L., Gao, J., Diehl, T., Selkoe, D. J., and Wolfe, M. S. (2003) Biochemistry 42, 137-144.
11. Karlstrom, H., Bergman, A., Lendahl, U., Naslund, J., and Lundkvist, J. (2002) J Biol Chem 277, 6763-6766.
12. Beaulieu, H., Elagoz, A., Crine, P., and Rokeach, L. A. (1999) Biochem J 340, 813-819.
13. Zhang, J. H., Chung, T. D., and Oldenburg, K. R. (1999) J Biomol Screen 4, 67-73.
14. Fujiki, Y., Hubbard, A. L., Fowler, S., and Lazarow, P. B. (1982) J. Cell Biol. 93, 97-102
15. Mukherjee, A., Song, E., Kihiko-Ehmann, M., Goodman, J. P., Jr., Pyrek, J. S., Estus, S., and Hersh, L. B. (2000) J Neurosci 20, 8745-8749.
16. Chesneau, V., Vekrellis, K., Rosner, M. R., and Selkoe, D. J. (2000) Biochem J 351 Pt 2, 509-516
17. Morelli, L., Llovera, R., Gonzalez, S. A., Affranchino, J. L., Prelli, F., Frangione, B., Ghiso, J., and Castano, E. M. (2003) J Biol Chem 14, 14
18. Howell, S., Nalbantoglu, J., and Crine, P. (1995) Peptides 16, 647-652 19. Jameson, D. M., and Sawyer, W. H. (1995) Methods Enzymol 246, 283-300. 20. Vekrellis, K., Ye, Z., Qiu, W. Q., Walsh, D., Hartley, D., Chesneau, V., Rosner,
M. R., and Selkoe, D. J. (2000) J Neurosci 20, 1657-1665
by guest on June 14, 2020http://w
ww
.jbc.org/D
ownloaded from
21. Perez, A., Morelli, L., Cresto, J. C., and Castano, E. M. (2000) Neurochem Res 25, 247-255
22. Chesneau, V., and Rosner, M. R. (2000) Protein Expr Purif 19, 91-98. 23. Walsh, D., Klyubin, I., Fadeeva, J., William K. Cullen, W., Anwyl, R., Wolfe, M.,
Rowan, M., and Selkoe, D. (2002) Nature 416, 535-539 24. Shirotani, K., Tsubuki, S., Iwata, N., Takaki, Y., Harigaya, W., Maruyama, K.,
Kiryu-Seo, S., Kiyama, H., Iwata, H., Tomita, T., Iwatsubo, T., and Saido, T. C. (2001) J Biol Chem 276, 21895-21901.
by guest on June 14, 2020http://w
ww
.jbc.org/D
ownloaded from
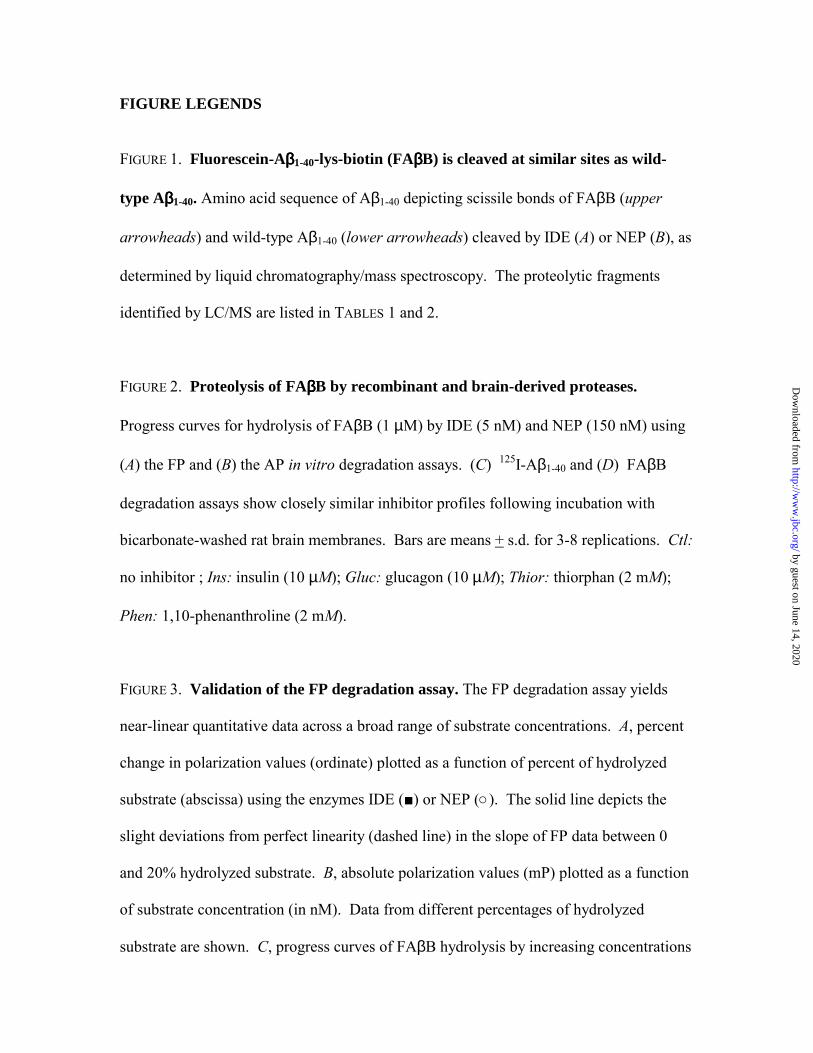
FIGURE LEGENDS
FIGURE 1. Fluorescein-Aββββ1-40-lys-biotin (FAββββB) is cleaved at similar sites as wild-
type Aββββ1-40. Amino acid sequence of Aβ1-40 depicting scissile bonds of FAβB (upper
arrowheads) and wild-type Aβ1-40 (lower arrowheads) cleaved by IDE (A) or NEP (B), as
determined by liquid chromatography/mass spectroscopy. The proteolytic fragments
identified by LC/MS are listed in TABLES 1 and 2.
FIGURE 2. Proteolysis of FAββββB by recombinant and brain-derived proteases.
Progress curves for hydrolysis of FAβB (1 µM) by IDE (5 nM) and NEP (150 nM) using
(A) the FP and (B) the AP in vitro degradation assays. (C) 125I-Aβ1-40 and (D) FAβB
degradation assays show closely similar inhibitor profiles following incubation with
bicarbonate-washed rat brain membranes. Bars are means + s.d. for 3-8 replications. Ctl:
no inhibitor ; Ins: insulin (10 µM); Gluc: glucagon (10 µM); Thior: thiorphan (2 mM);
Phen: 1,10-phenanthroline (2 mM).
FIGURE 3. Validation of the FP degradation assay. The FP degradation assay yields
near-linear quantitative data across a broad range of substrate concentrations. A, percent
change in polarization values (ordinate) plotted as a function of percent of hydrolyzed
substrate (abscissa) using the enzymes IDE (■) or NEP (○). The solid line depicts the
slight deviations from perfect linearity (dashed line) in the slope of FP data between 0
and 20% hydrolyzed substrate. B, absolute polarization values (mP) plotted as a function
of substrate concentration (in nM). Data from different percentages of hydrolyzed
substrate are shown. C, progress curves of FAβB hydrolysis by increasing concentrations
by guest on June 14, 2020http://w
ww
.jbc.org/D
ownloaded from
of recombinant IDE determined using the FP assay in a high-throughput (384 well)
robotic format.
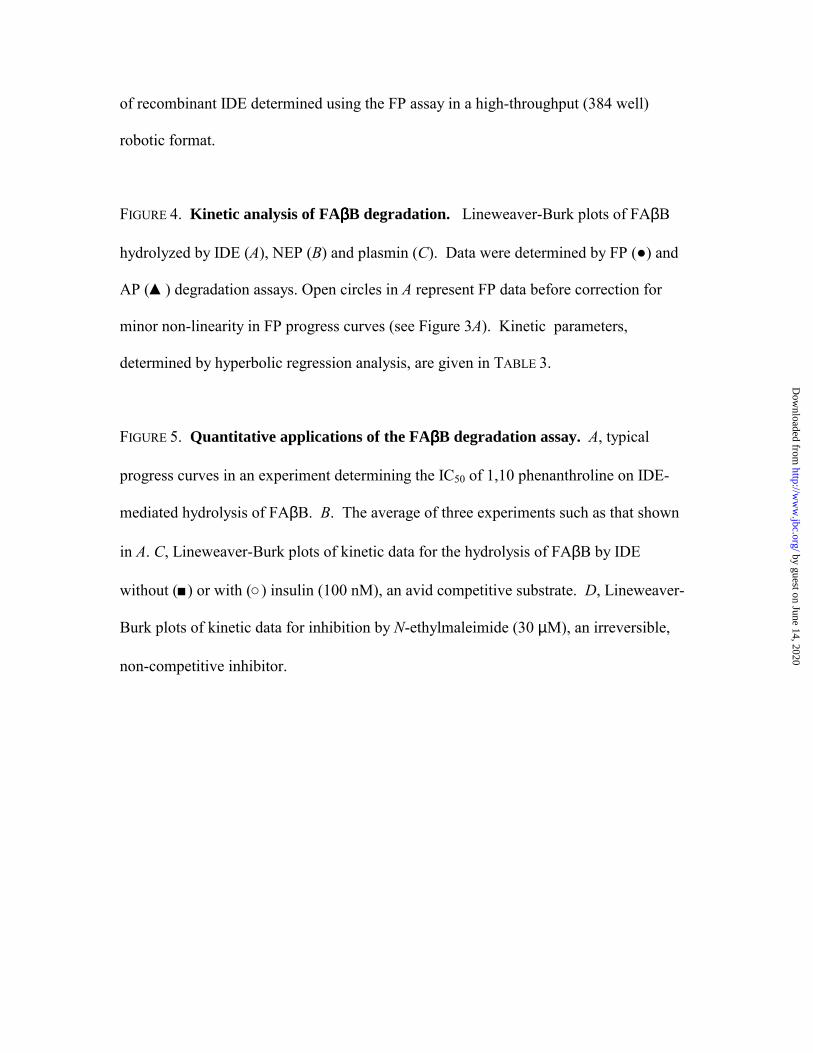
FIGURE 4. Kinetic analysis of FAββββB degradation. Lineweaver-Burk plots of FAβB
hydrolyzed by IDE (A), NEP (B) and plasmin (C). Data were determined by FP (●) and
AP (▲) degradation assays. Open circles in A represent FP data before correction for
minor non-linearity in FP progress curves (see Figure 3A). Kinetic parameters,
determined by hyperbolic regression analysis, are given in TABLE 3.
FIGURE 5. Quantitative applications of the FAββββB degradation assay. A, typical
progress curves in an experiment determining the IC50 of 1,10 phenanthroline on IDE-
mediated hydrolysis of FAβB. B. The average of three experiments such as that shown
in A. C, Lineweaver-Burk plots of kinetic data for the hydrolysis of FAβB by IDE
without (■) or with (○) insulin (100 nM), an avid competitive substrate. D, Lineweaver-
Burk plots of kinetic data for inhibition by N-ethylmaleimide (30 µM), an irreversible,
non-competitive inhibitor.
by guest on June 14, 2020http://w
ww
.jbc.org/D
ownloaded from

ACKNOWLEDGMENTS
The authors thank Drs. Guy Boileau and Philippe Crine for the soluble NEP, Alice Y.
Chang for assistance with purification of recombinant IDE, and Dr. Li-An Yeh and Jake
Ni for assistance with robotic screening.
by guest on June 14, 2020http://w
ww
.jbc.org/D
ownloaded from
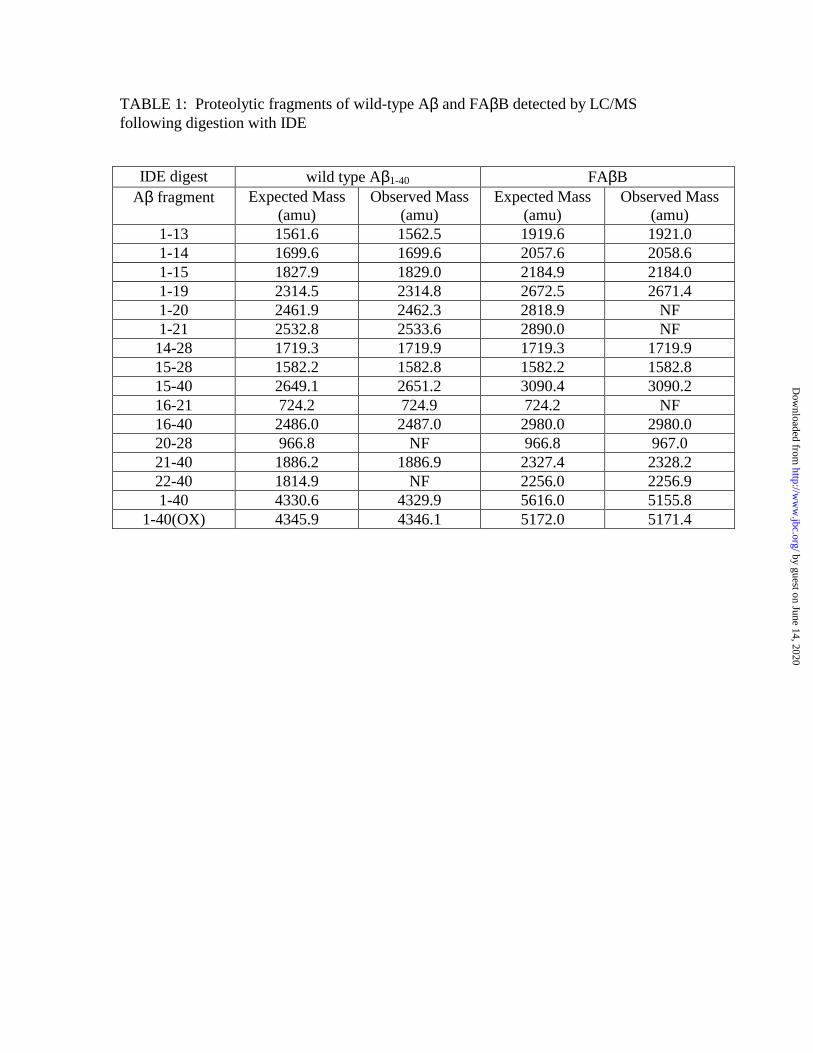
TABLE 1: Proteolytic fragments of wild-type Aβ and FAβB detected by LC/MS following digestion with IDE
IDE digest wild type Aβ1-40 FAβB Aβ fragment Expected Mass
(amu) Observed Mass
(amu) Expected Mass
(amu) Observed Mass
(amu) 1-13 1561.6 1562.5 1919.6 1921.0 1-14 1699.6 1699.6 2057.6 2058.6 1-15 1827.9 1829.0 2184.9 2184.0 1-19 2314.5 2314.8 2672.5 2671.4 1-20 2461.9 2462.3 2818.9 NF 1-21 2532.8 2533.6 2890.0 NF 14-28 1719.3 1719.9 1719.3 1719.9 15-28 1582.2 1582.8 1582.2 1582.8 15-40 2649.1 2651.2 3090.4 3090.2 16-21 724.2 724.9 724.2 NF 16-40 2486.0 2487.0 2980.0 2980.0 20-28 966.8 NF 966.8 967.0 21-40 1886.2 1886.9 2327.4 2328.2 22-40 1814.9 NF 2256.0 2256.9 1-40 4330.6 4329.9 5616.0 5155.8
1-40(OX) 4345.9 4346.1 5172.0 5171.4
by guest on June 14, 2020http://w
ww
.jbc.org/D
ownloaded from
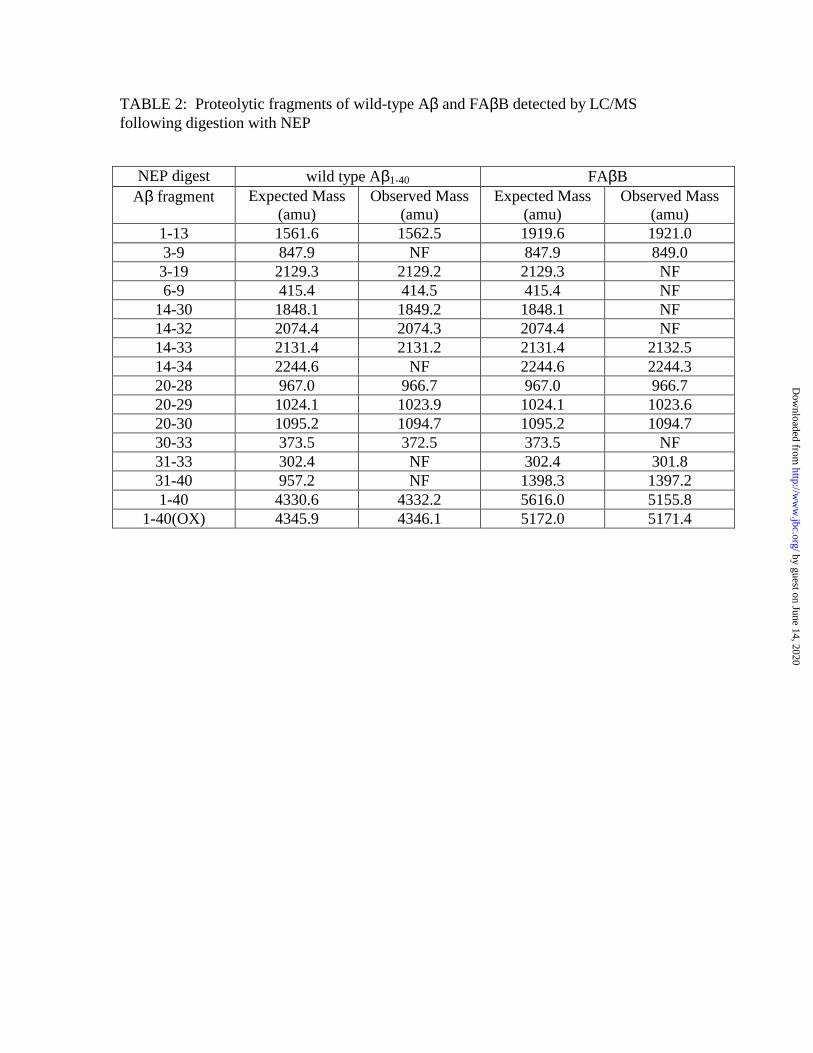
TABLE 2: Proteolytic fragments of wild-type Aβ and FAβB detected by LC/MS following digestion with NEP
NEP digest wild type Aβ1-40 FAβB Aβ fragment Expected Mass
(amu) Observed Mass
(amu) Expected Mass
(amu) Observed Mass
(amu) 1-13 1561.6 1562.5 1919.6 1921.0 3-9 847.9 NF 847.9 849.0 3-19 2129.3 2129.2 2129.3 NF 6-9 415.4 414.5 415.4 NF
14-30 1848.1 1849.2 1848.1 NF 14-32 2074.4 2074.3 2074.4 NF 14-33 2131.4 2131.2 2131.4 2132.5 14-34 2244.6 NF 2244.6 2244.3 20-28 967.0 966.7 967.0 966.7 20-29 1024.1 1023.9 1024.1 1023.6 20-30 1095.2 1094.7 1095.2 1094.7 30-33 373.5 372.5 373.5 NF 31-33 302.4 NF 302.4 301.8 31-40 957.2 NF 1398.3 1397.2 1-40 4330.6 4332.2 5616.0 5155.8
1-40(OX) 4345.9 4346.1 5172.0 5171.4
by guest on June 14, 2020http://w
ww
.jbc.org/D
ownloaded from
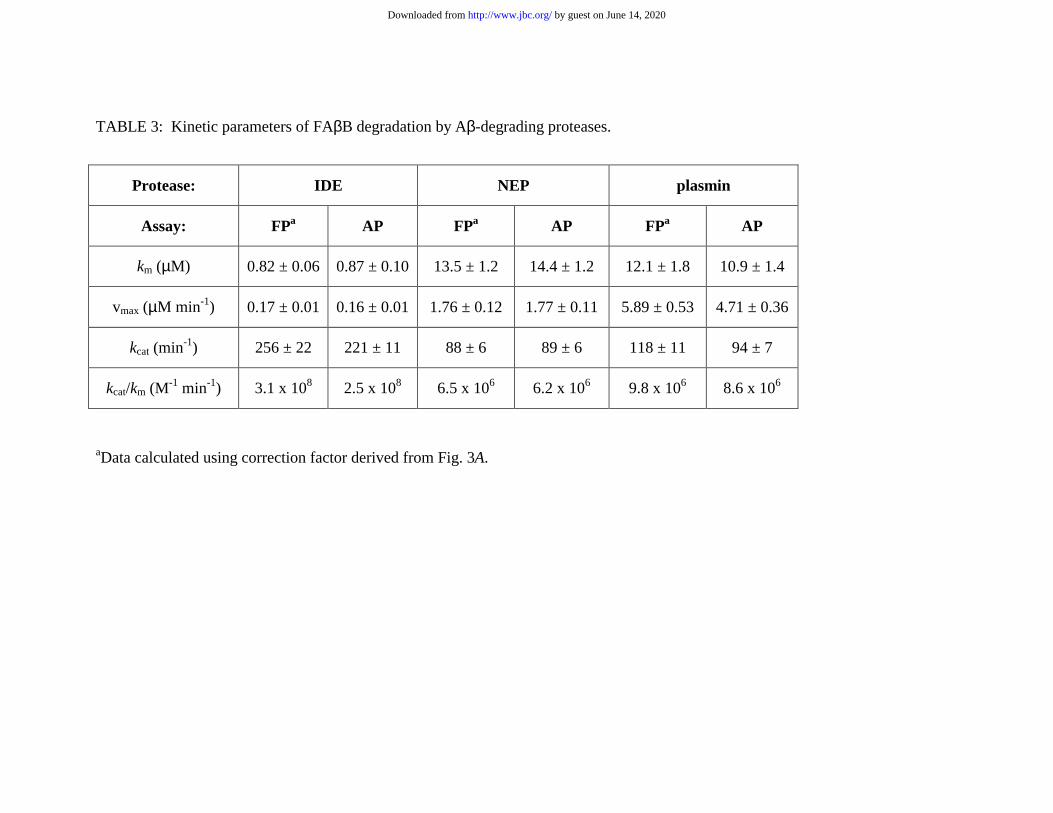
TABLE 3: Kinetic parameters of FAβB degradation by Aβ-degrading proteases.
aData calculated using correction factor derived from Fig. 3A.
Protease: IDE NEP plasmin
Assay: FPa AP FPa AP FPa AP
km (µM) 0.82 ± 0.06 0.87 ± 0.10 13.5 ± 1.2 14.4 ± 1.2 12.1 ± 1.8 10.9 ± 1.4
vmax (µM min-1) 0.17 ± 0.01 0.16 ± 0.01 1.76 ± 0.12 1.77 ± 0.11 5.89 ± 0.53 4.71 ± 0.36
kcat (min-1) 256 ± 22 221 ± 11 88 ± 6 89 ± 6 118 ± 11 94 ± 7
kcat/km (M-1 min-1) 3.1 x 10⁸ 2.5 x 10⁸ 6.5 x 10⁶ 6.2 x 10⁶ 9.8 x 10⁶ 8.6 x 10⁶
by guest on June 14, 2020http://www.jbc.org/Downloaded from
A
DAEFRHDSGYEVHHQKLVFFAEDVGSNKGAIIGLMVGGVVwild-type
FAβB
IDE digest
DAEFRHDSGYEVHHQKLVFFAEDVGSNKGAIIGLMVGGVV
Bwild-type
FAβB
NEP digest
Fig. 1
by guest on June 14, 2020http://w
ww
.jbc.org/D
ownloaded from

0
20
40
60
80
100
Ctl Ins Gluc Thior Phen
V (
% c
on
tro
l)
o
t (min)0 5 10 15 20 25
IDE NEP No EZ
8000
6000
4000
2000
0
RFU
0 5 10 15 20 25150
200
250
300
350
400
IDE NEP No EZ
t (min)
mP
A B
C D
0
20
40
60
80
100
V (
% c
on
tro
l)
o
Ctl Ins Gluc Thior Phen
FAβBI-Aβ125
FP AP
Fig. 2
by guest on June 14, 2020http://w
ww
.jbc.org/D
ownloaded from
0 20 40 60 80 1000
20
40
60
80
100 IDE NEP
1 10 100 10000
100
200
300
400
500
600 0% 25% 50% 75% 100%
mP
A
B
0 10 20 30 40 50 60150
175
200
225
250
275
No EZ 0.3 nM 1 nM 3 nM
mP
% hydrolyzed substrate
∆mP
(% m
axim
um)
[FAβB] (nM)
t (min)
C
Fig. 3
by guest on June 14, 2020http://w
ww
.jbc.org/D
ownloaded from

-2 -1 0 1 2 3 4
10
20
30
AP FP (adj) FP (raw)
A
B
C
-0.2 0.0 0.2 0.4 0.6
0.5
1.0
1.5
AP FP(adj)
-0.1 0.0 0.1 0.2
1
2
V
(µM
m
in)
-1-1
[S] (µM )-1 -1
V
(µM
m
in)
-1-1
V
(µM
m
in)
-1-1
[S] (µM )-1 -1
[S] (µM )-1 -1
AP FP(adj)
IDE
NEP
plasmin
Fig. 4
by guest on June 14, 2020http://w
ww
.jbc.org/D
ownloaded from
1 10 100 10000
20
40
60
80
100
V (%
con
trol)
o
[1,10 phenanthroline] (µM)0 5 10 15
0
50
100
150
200
250
3000 µ M 1000 µ M 300 µ M 100 µ M 30 µ M 10 µ M 3 µ M No phen
mP
t (min)
-2 -1 0 1 2 3 4
100
200
300 rIDE rIDE + Ins
A B
C D
V (µM min)-1
o
-1V (µM min)
-1
o
-1
[S] (µM )-1 -1 [S] (µM )-1 -1
-2 -1 0 1 2 3 4
50
100
150 rIDE rIDE + NEM
Fig. 5
by guest on June 14, 2020http://w
ww
.jbc.org/D
ownloaded from
Wesley Farris and Dennis J. SelkoeMalcolm A. Leissring, Alice Lu, Margaret M. Condron, David B. Teplow, Ross L. Stein,
fluorescence polarization-based assays-protein degradation determined by novel fluorescence- andβKinetics of amyloid
published online July 16, 2003J. Biol. Chem.
10.1074/jbc.M305627200Access the most updated version of this article at doi:
Alerts:
When a correction for this article is posted•
When this article is cited•
to choose from all of JBC's e-mail alertsClick here
by guest on June 14, 2020http://w
ww
.jbc.org/D
ownloaded from


![1,2 3 Vaclav Vetvicka 4,* and Vincent Ferrières 1,2, · frequency of side branches [17]. Removing those re sidues causes the polysaccharide to precipitate [18]. Finally, high molecular](https://static.fdocument.org/doc/165x107/5fc821e89fa30043ac1bf1de/12-3-vaclav-vetvicka-4-and-vincent-ferrires-12-frequency-of-side-branches.jpg)


![Volume of non-Riemannian Clifford–Klein forms. · 2020. 6. 3. · Finally, Alessandrini and Li recently found another proof of this theorem [1]. Their computation seems similar](https://static.fdocument.org/doc/165x107/60e753a06950ec50f9162784/volume-of-non-riemannian-cliiordaklein-forms-2020-6-3-finally-alessandrini.jpg)
![Introduction€¦ · similar construction in [18,19]. The algorithms we used are described in Section 6. Finally, in Section 7 we give the results of our computations. 1.3. Acknowledgments.](https://static.fdocument.org/doc/165x107/5ead515a568d9a70b571522a/introduction-similar-construction-in-1819-the-algorithms-we-used-are-described.jpg)