KIC10080943: a binary star with two Doradus/ Scuti · gahc ene et al. 2010; Uytterhoeven et al....
6
Mon. Not. R. Astron. Soc. 000, 1–6 (2015) Printed 12 June 2018 (MN L A T E X style file v2.2) KIC 10080943: a binary star with two γ Doradus/δ Scuti hybrid pulsators. Analysis of the g modes M. A. Keen 1,2? , T. R. Bedding 1,2 †, S. J. Murphy 1,2 ‡, V. S. Schmid 3 , C. Aerts 3,4 , A. Tkachenko 3 , R.-M. Ouazzani 2 and D.W. Kurtz 5 1 Sydney Institute for Astronomy, School of Physics, The University of Sydney, NSW 2006, Australia 2 Stellar Astrophysics Centre, Department of Physics and Astronomy, Aarhus University, Denmark 3 Institute of Astronomy, KU Leuven, Celestijnenlaan 200D, B - 3001 Leuven, Belgium 4 Department of Astrophysics, Radboud University Nijmegen, P.O. Box 9010, 6500 GL Nijmegen, The Netherlands 5 Jeremiah Horrocks Institute, University of Central Lancashire, Preston PR1 2HE, UK 12 June 2018 ABSTRACT We use four years of Kepler photometry to study the non-eclipsing spectroscopic bi- nary KIC 10080943. We find both components to be γ Doradus/δ Scuti hybrids, which pulsate in both p and g modes. We present an analysis of the g modes, which is com- plicated by the fact that the two sets of ‘ = 1 modes partially overlap in the frequency spectrum. Nevertheless, it is possible to disentangle them by identifying rotationally split doublets from one component and triplets from the other. The identification is helped by the presence of additive combination frequencies in the spectrum that involve the doublets but not the triplets. The rotational splittings of the multiplets imply core rotation periods of about 11 d and 7 d in the two stars. One of the stars also shows evidence of ‘ = 2 modes. Key words: asteroseismology – binaries: spectroscopic – stars: individual: KIC 10080943 – stars: oscillations – stars: variables: δ Scuti – stars: variables: gen- eral 1 INTRODUCTION Pulsating stars in binary systems have great potential to contribute to our understanding of stellar astrophysics. The orbit provides mass constraints for the two stars, while mod- elling of the pulsations (asteroseismology) yields information about their internal structure and rotation. When both stars are pulsating, such binary systems are particularly valuable. Stars can oscillate in both pressure modes (p modes), which are most sensitive to conditions in the outer layers of the star, and gravity modes (g modes), which are most sen- sitive to the interior (e.g., Aerts, Christensen-Dalsgaard & Kurtz 2010). Observations with the Kepler spacecraft have revealed that many main-sequence A and F stars show both δ Scuti (p-mode) and γ Doradus (g-mode) pulsations (Gri- gahc` ene et al. 2010; Uytterhoeven et al. 2011; Tkachenko et al. 2013; Balona 2014). Detailed studies of δ Sct/γ Dor hybrids have so far been carried out for two stars, namely KIC 11145123 (Kurtz et al. ? E-mail: [email protected] (MAK) † E-mail: [email protected] (TRB) ‡ E-mail: [email protected] (SJM) 2014) and KIC 9244992 (Saio et al. 2015). Both of those stars rotate slowly (periods of 100 d and 66 d, respectively), with the rotation of the core differing only slightly from the rotation at the surface. The results showed that a strong angular momentum transport mechanism must be at work in main-sequence, intermediate-mass stars. Here we discuss KIC 10080943, which is a non-eclipsing, double-lined spectroscopic binary (Tkachenko et al. 2013) in which we find both components to be γ Dor/δ Sct hy- brids with moderate rotation. Huber et al. (2014) listed the following properties for KIC 10080943: T eff = 7360 ± 260 K, log g =4.0 ± 0.4 and [Fe/H] = -0.2 ± 0.3, while the visual magnitude was measured by Tkachenko et al. (2013) to be V = 11.7. This paper presents our analysis of the g-mode spec- trum of KIC 10080943. A companion paper by Schmid et al. (2015) discusses the p modes and the binary properties, as well as addressing the individual stellar parameters of the constituent stars, as has been done for eclipsing binaries with intermediate-mass primaries (Hambleton et al. 2013; Debosscher et al. 2013; Maceroni et al. 2014). In partic- ular, we have measured phase modulations in this system (Murphy et al. 2014; Murphy & Shibahashi 2015), showing © 2015 RAS arXiv:1509.03317v1 [astro-ph.SR] 10 Sep 2015
Transcript of KIC10080943: a binary star with two Doradus/ Scuti · gahc ene et al. 2010; Uytterhoeven et al....

Mon. Not. R. Astron. Soc. 000, 1–6 (2015) Printed 12 June 2018 (MN LATEX style file v2.2)
KIC10080943: a binary star with two γDoradus/δ Scutihybrid pulsators. Analysis of the g modes
M. A. Keen1,2?, T. R. Bedding1,2†, S. J. Murphy1,2‡, V. S. Schmid3, C. Aerts3,4,
A. Tkachenko3, R.-M. Ouazzani2 and D.W. Kurtz51Sydney Institute for Astronomy, School of Physics, The University of Sydney, NSW 2006, Australia2Stellar Astrophysics Centre, Department of Physics and Astronomy, Aarhus University, Denmark3Institute of Astronomy, KU Leuven, Celestijnenlaan 200D, B - 3001 Leuven, Belgium4Department of Astrophysics, Radboud University Nijmegen, P.O. Box 9010, 6500 GL Nijmegen, The Netherlands5Jeremiah Horrocks Institute, University of Central Lancashire, Preston PR1 2HE, UK
12 June 2018
ABSTRACTWe use four years of Kepler photometry to study the non-eclipsing spectroscopic bi-nary KIC 10080943. We find both components to be γDoradus/δ Scuti hybrids, whichpulsate in both p and g modes. We present an analysis of the g modes, which is com-plicated by the fact that the two sets of ` = 1 modes partially overlap in the frequencyspectrum. Nevertheless, it is possible to disentangle them by identifying rotationallysplit doublets from one component and triplets from the other. The identificationis helped by the presence of additive combination frequencies in the spectrum thatinvolve the doublets but not the triplets. The rotational splittings of the multipletsimply core rotation periods of about 11 d and 7 d in the two stars. One of the starsalso shows evidence of ` = 2 modes.
Key words: asteroseismology – binaries: spectroscopic – stars: individual:KIC 10080943 – stars: oscillations – stars: variables: δ Scuti – stars: variables: gen-eral
1 INTRODUCTION
Pulsating stars in binary systems have great potential tocontribute to our understanding of stellar astrophysics. Theorbit provides mass constraints for the two stars, while mod-elling of the pulsations (asteroseismology) yields informationabout their internal structure and rotation. When both starsare pulsating, such binary systems are particularly valuable.
Stars can oscillate in both pressure modes (p modes),which are most sensitive to conditions in the outer layers ofthe star, and gravity modes (g modes), which are most sen-sitive to the interior (e.g., Aerts, Christensen-Dalsgaard &Kurtz 2010). Observations with the Kepler spacecraft haverevealed that many main-sequence A and F stars show bothδ Scuti (p-mode) and γDoradus (g-mode) pulsations (Gri-gahcene et al. 2010; Uytterhoeven et al. 2011; Tkachenkoet al. 2013; Balona 2014).
Detailed studies of δ Sct/γDor hybrids have so far beencarried out for two stars, namely KIC 11145123 (Kurtz et al.
? E-mail: [email protected] (MAK)† E-mail: [email protected] (TRB)‡ E-mail: [email protected] (SJM)
2014) and KIC 9244992 (Saio et al. 2015). Both of thosestars rotate slowly (periods of 100 d and 66 d, respectively),with the rotation of the core differing only slightly from therotation at the surface. The results showed that a strongangular momentum transport mechanism must be at workin main-sequence, intermediate-mass stars.
Here we discuss KIC 10080943, which is a non-eclipsing,double-lined spectroscopic binary (Tkachenko et al. 2013)in which we find both components to be γDor/δ Sct hy-brids with moderate rotation. Huber et al. (2014) listed thefollowing properties for KIC 10080943: Teff = 7360 ± 260 K,log g = 4.0 ± 0.4 and [Fe/H] = −0.2 ± 0.3, while the visualmagnitude was measured by Tkachenko et al. (2013) to beV = 11.7.
This paper presents our analysis of the g-mode spec-trum of KIC 10080943. A companion paper by Schmid et al.(2015) discusses the p modes and the binary properties, aswell as addressing the individual stellar parameters of theconstituent stars, as has been done for eclipsing binarieswith intermediate-mass primaries (Hambleton et al. 2013;Debosscher et al. 2013; Maceroni et al. 2014). In partic-ular, we have measured phase modulations in this system(Murphy et al. 2014; Murphy & Shibahashi 2015), showing
© 2015 RAS
arX
iv:1
509.
0331
7v1
[as
tro-
ph.S
R]
10
Sep
2015
2 M. A. Keen et. al.
that orbital variations in the light arrival times of some ofthe p-mode pulsations occur in anti-phase with others. Thisdemonstrates that both stars pulsate in p modes as discussedby Schmid et al. (2015). The same methodology cannot beapplied to the g modes because the higher frequency den-sity demands an unachievable frequency resolution, giventhe sampling required for the short orbit. Nonetheless, thefocus of this paper is to show that both components alsopulsate in g modes.
2 DATA ANALYSIS & RESULTS
When analysing high-order g modes, we are guided by theexpectation that they are equally spaced in period (Tassoul1980). However, the steep composition gradient (µ gradient)between the core and outer layers can cause deviations fromthis uniform period spacing (Miglio et al. 2008). Further-more, as shown by Bouabid et al. (2013), stellar rotationcauses the period spacing to vary with frequency. These ef-fects have been observed in Kepler data for a number ofγDor stars (Bedding et al. 2014; Van Reeth et al. 2015a,b).
For KIC 10080943, we used long-cadence data (29.4-minute sampling) from the full Kepler mission, spanning1470.5 d (4.0 y). The Fourier spectrum (Fig. 1) shows pul-sations in both the g-mode and p-mode frequency regions.These regions are clearly separated, with the g-mode regionbelow approximately 6 d−1 and the p-mode region above ap-proximately 8 d−1.
At low frequency there is a peak at 0.065209 d−1 with along series of harmonics. Such harmonic series are often seenin binary stars. The inverse of this frequency is 15.335 d,which we take as the binary orbital period. KIC 10080943was already established as a binary by Tkachenko et al.(2013), and was selected for spectroscopic observations todetermine the orbital parameters of the system. Those arepresented in Schmid et al. (2015).
To analyse the pulsation content, we sequentially ex-tracted the 250 strongest peaks in the frequency range fromzero to the Nyquist frequency (24.47 d−1) using PERIOD04
(Lenz & Breger 2004, 2005). Non-linear least-squares fittingwas implemented during extraction. Although we were in-terested in the g modes, the p modes were also extractedbecause the spectral windows of the p and g modes overlap.We also checked that the extracted peaks were not Nyquistaliases using the method outlined by Murphy, Shibahashi &Kurtz (2013).
In the range 0.6 to 1.7 d−1 we identified six series ofpulsation modes. Each is approximately equally spaced inperiod, consistent with a series of overtones with a common` and m value. Furthermore, some of the series are separatedfrom others by a fixed frequency, suggesting rotational split-ting. Given that KIC 10080943 is a binary system, we wereled to identify two sets of g modes with slightly different pe-riod spacings, one from each component of the binary. Thisis shown in Figs 2 and 3, where we have arbitrarily labelledthe components of the binary as Stars A and B. In Star Awe see rotationally split doublets, while Star B has tripletsin which the central component is weak. There is also a se-quence with slightly lower period spacing (asterisks) thatwe tentatively identify with ` = 2 modes. Note that Bed-
2 M. A. Keen et. al.
(KIC 11145123 and KIC 9244992 respectively). Both starsrotate slowly (100 d and 66 d periods respectively), with therotation of the core di↵ering only slightly from the rotationat the surface. These results show that a strong angularmomentum transport mechanism must be at work in main-sequence, intermediate-mass stars.
This is the first in a series of papers on KIC 10080943,which is a non-eclipsing, double-lined spectroscopic bi-nary (Tkachenko et al. 2013) in which we find both com-ponents to be � Dor/� Sct hybrids with moderate rota-tion. Huber et al. (2014) list the following propertiesfor KIC 10080943: Te↵ = 7360 ± 260 K, log g = 4.0 ± 0.4 and[Fe/H] = �0.2 ± 0.3, while the visual magnitude was mea-sured by Tkachenko et al. (2013): V = 11.7. Subsequent pa-pers will address the p modes and binary properties, as wellas addressing the individual stellar parameters of the con-stituent stars, as has been done for eclipsing binaries withintermediate-mass primaries (Hambleton et al. 2013; De-bosscher et al. 2013; Maceroni et al. 2014). The phase modu-lation method (Murphy et al. 2014) has been applied to thissystem, showing that there are two sets of p modes in an-tiphase, hence showing that both stars pulsate in p modes.This will be discussed further in a subsequent paper.
In this paper we present an analysis of the g-mode spec-trum for KIC 10080943. In the asymptotic regime, g modesare equally spaced in period (Tassoul 1980). The steep com-position gradient (µ gradient) between the core and outerlayers causes a periodic deviation from this uniform periodspacing (Miglio et al. 2008). Furthermore, Bouabid et al.(2013) showed that the period spacing depends on the Cori-olis force, as the rotation of the star shifts the g-mode fre-quencies to a higher value. These e↵ects have been observedin Kepler data for a number of � Dor stars (Bedding et al.2014; Van Reeth et al. 2015).
2 DATA ANALYSIS & RESULTS
For four years the Kepler mission continuously moni-tored over 150 000 stars searching for transiting exoplanets(Gilliland et al. 2010; Borucki et al. 2010). The light curvesof micromagnitude precision are also ideal for studying vari-able stars, and have ushered in a new age in asteroseismol-ogy.
We used long cadence (LC) data from the full Keplermission (Q0 – Q17) spanning 1470.5 d (4.0 y). The Fourierspectrum (??) shows pulsations in both the g-mode and p-mode frequency regions. These regions are clearly separated,with the g-mode region below approximately 6 d�1 and thep-mode region above approximately 8 d�1.
We sequentially extracted the 250 strongest peaks fromthe Fourier transform of the light curve in the frequencyrange of 0.05 d�1 to the Nyquist frequency of 24.47 d�1 usingPeriod04 (Lenz & Breger 2004, 2005). Although we wereinterested in the g modes, the p modes were also extracted astheir spectral window contaminates the low-frequency regionof the Fourier spectrum, e↵ectively increasing the noise level.We also checked that the extracted peaks were not Nyquistaliases using the method outlined by Murphy, Shibahashi &Kurtz (2013).
In the g-mode regime (0.6 d�1 to 1.7 d�1) we identifiedsix series of pulsation modes. Each series is approximately
�2,000 �1,000 0 1,000 2,000
0.7
0.8
0.9
1
1.1
1.2
1.3
Period modulo 2840 seconds
Fre
quen
cy(d
�1)
�2,000 �1,000 0 1,000 2,000
0.9
1
1.1
1.2
1.3
1.4
1.5
1.6
Period modulo 2840 seconds
Fre
quen
cy(d
�1)
Figure 1. Echelle diagram of the frequencies in the range
0.6to1.7 d�1. Each frequency has been plotted against the pe-riod modulo 2840 s. The data have been plotted twice for clarity.
This figure clearly shows the six g-mode series, shown as cyan
squares, red circles, green left-pointing arrows, blue triangles, ma-genta right-pointing arrows and black stars. The size of the points
is proportional to the logarithm of the amplitude of the corre-sponding peak in the Fourier spectrum. The orange crosses show
the peaks that do not belong to any series.
© 2015 RAS, MNRAS 000, 1–6
Figure 4. Period echelle diagrams of the g modes inKIC 10080943, for Star A (upper) and Star B (lower). The data
have been plotted twice for clarity. The symbol size is proportionalto the logarithm of the amplitude of the corresponding peak inthe Fourier spectrum.
© 2015 RAS, MNRAS 000, 1–6
Analysis of g modes in KIC 10080943 32 M. A. Keen et. al.
0.8 1 1.2 1.4 1.60
0.5
1
1.5
2
0 2 4 6 8 10 12 14 16 18 20 22 240
1
2
Frequency (d�1)
Am
plitu
de
(mm
ag)
Figure 1. The Fourier spectrum of KIC 10080943. Main plot: an amplitude spectrum of the Q0 to Q17 Kepler long cadence data up tothe Nyquist frequency, showing the clearly separated g-mode and p-mode frequency ranges. Inset: an amplitude spectrum of the g modes
for 0.6 to 1.7 d�1, which are the main focus of this paper. This region is shown in greater detail in Figs. 3 and 4
and p-mode regimes (Grigahcene et al. 2010; Uytterhoevenet al. 2011; Tkachenko et al. 2013; Balona 2014).
Kurtz et al. (2014) and Saio et al. (2015) were the first toconduct a detailed analysis of g and p modes in � Sct/� Dorhybrids (KIC 11145123 and KIC 9244992 respectively). Bothstars rotate slowly (100 d and 66 d periods respectively),with the rotation of the core di↵ering only slightly fromthe rotation at the surface. These results show that a strongangular momentum transport mechanism must be at workin main-sequence, intermediate-mass stars.
This is the first in a series of papers on KIC 10080943,which is a non-eclipsing, double-lined spectroscopic bi-nary (Tkachenko et al. 2013) in which we find both com-ponents to be � Dor/� Sct hybrids with moderate rota-tion. Huber et al. (2014) list the following propertiesfor KIC 10080943: Te↵ = 7360 ± 260 K, log g = 4.0 ± 0.4 and[Fe/H] = �0.2 ± 0.3, while the visual magnitude was mea-sured by Tkachenko et al. (2013): V = 11.7. Subsequent pa-pers will address the p modes and binary properties, as wellas addressing the individual stellar parameters of the con-stituent stars, as has been done for eclipsing binaries withintermediate-mass primaries (Hambleton et al. 2013; De-bosscher et al. 2013; Maceroni et al. 2014). The phase modu-lation method (Murphy et al. 2014) has been applied to thissystem, showing that there are two sets of p modes in an-tiphase, hence showing that both stars pulsate in p modes.This will be discussed further in a subsequent paper.
In this paper we present an analysis of the g-mode spec-trum for KIC 10080943. In the asymptotic regime, g modesare equally spaced in period (Tassoul 1980). The steep com-position gradient (µ gradient) between the core and outerlayers causes a periodic deviation from this uniform periodspacing (Miglio et al. 2008). Furthermore, Bouabid et al.(2013) showed that the period spacing depends on the Cori-olis force, as the rotation of the star shifts the g-mode fre-quencies to a higher value. These e↵ects have been observedin Kepler data for a number of � Dor stars (Bedding et al.2014; Van Reeth et al. 2015).
2 DATA ANALYSIS & RESULTS
For four years the Kepler mission continuously moni-tored over 150 000 stars searching for transiting exoplanets(Gilliland et al. 2010; Borucki et al. 2010). The light curvesof micromagnitude precision are also ideal for studying vari-able stars, and have ushered in a new age in asteroseismol-ogy.
We used long cadence (LC) data from the full Keplermission (Q0 – Q17) spanning 1470.5 d (4.0 y). The Fourierspectrum (Fig. 1) shows pulsations in both the g-mode andp-mode frequency regions. These regions are clearly sepa-rated, with the g-mode region below approximately 6 d�1
and the p-mode region above approximately 8 d�1.
We sequentially extracted the 250 strongest peaks fromthe Fourier transform of the light curve in the frequencyrange of 0.05 d�1 to the Nyquist frequency of 24.47 d�1 usingPERIOD04 (Lenz & Breger 2004, 2005). Although we wereinterested in the g modes, the p modes were also extracted astheir spectral window contaminates the low-frequency regionof the Fourier spectrum, e↵ectively increasing the noise level.We also checked that the extracted peaks were not Nyquistaliases using the method outlined by Murphy, Shibahashi &Kurtz (2013).
In the g-mode regime (0.6 to 1.7 d�1) we identifiedsix series of pulsation modes. Each series is approximatelyequally spaced in period, suggesting that the peaks in eachseries share a common ` and m value. Furthermore, some ofthe series are separated from others by a fixed frequency,suggesting rotational splitting. These six series are plot-ted with di↵erent symbols in the echelle diagram, shownin Fig. 2. The size of the points in this diagram are propor-tional to the logarithm of the amplitude of the peak, showingthat all significant modes have been identified. Given thatKIC 10080943 has been established as a binary (Tkachenkoet al. 2013), we were led to identify two sets of g modes withslightly di↵erent period spacings, one from each componentof the binary. This is shown in Fig. 3. The echelle diagramhas been plotted with a period spacing between the actualperiod spacing of the two stars, resulting in the six g-modeseries being askew, rather than vertically aligned. The listsof frequencies and amplitudes for the six g-mode series in thefrequency range 0.6 to 1.7 d�1 are given in Tables 1 to 3.
© 2015 RAS, MNRAS 000, 1–7
Figure 1. Fourier amplitude spectrum of KIC 10080943 from Kepler long cadence data, showing the clearly separated g-mode and
p-mode regions. Inset: close-up of the g modes.
Asteroseismic measurement of g modes in KIC 10080943 3
0.6 0.65 0.7 0.75 0.8 0.85 0.9 0.95 1 1.05 1.1 1.15 1.2 1.25 1.3 1.35 1.4 1.45 1.52,000
2,500
3,000
Period (d)
Per
iod
Spaci
ng
(s)
Star A ` = 1, m = �1
Star A ` = 1, m = 1
Star B ` = 1, m = �1
Star B ` = 1, m = 0
Star B ` = 1, m = 1
Star B? ` = 2?
0.6 0.65 0.7 0.75 0.8 0.85 0.9 0.95 1 1.05 1.1 1.15 1.2 1.25 1.3 1.35 1.4 1.45 1.50
1
2
Period (d)
Am
plitu
de
(mm
ag)
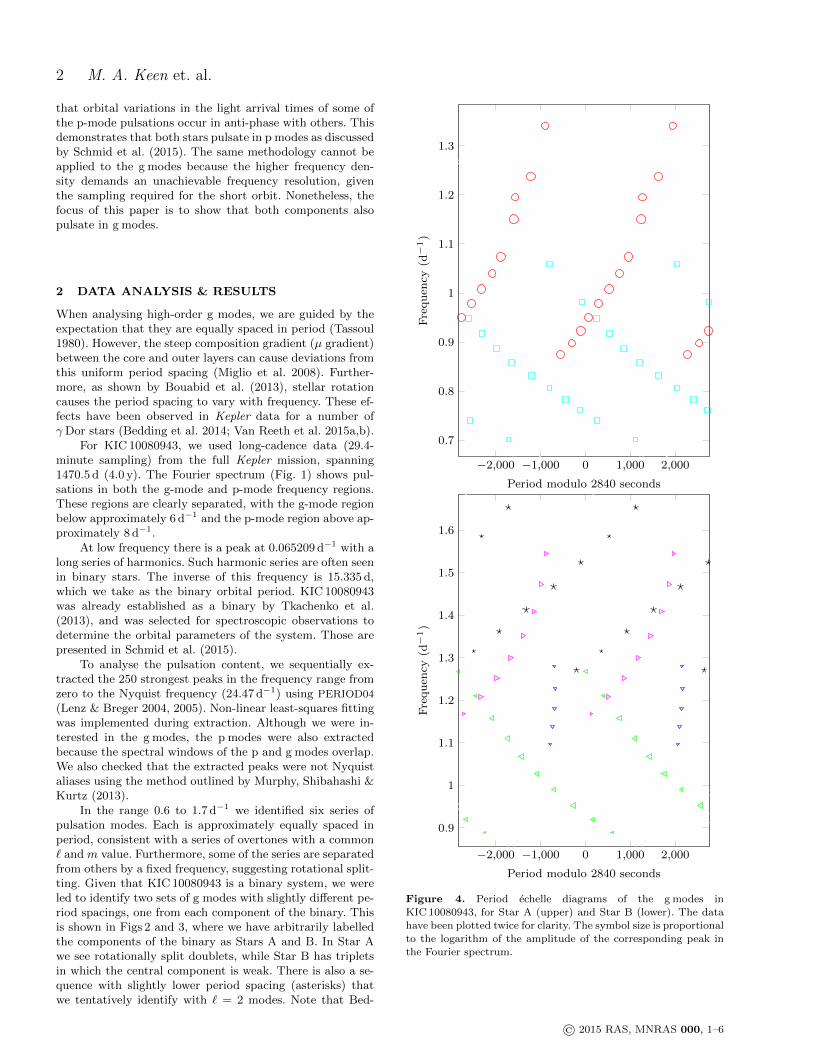
Figure 2. Top panel: Fourier spectrum of the g modes in the frequency range in the range 0.6 to 1.7 d�1 showing the identified peaks,marked in the same way as Fig. 1. Bottom panel: Period spacing of the g modes in KIC 10080943. The period spacing is given by
�Pn = Pn � Pn+1. The corresponding frequency for the x axis is the mean (1/2(fn + fn+1)) .
within 1/T = 6.8 ⇥ 10�4 d�1 of a calculated combinationfrequency.
2.1 Rotational Splitting
Of the six g-mode series, three were identified as forming aseries of triplets with the same spherical degree (` value).The three g-mode series have azimuthal orders (m values)of m = �1, m = 0 and m = 1. These triplets have a con-stant frequency splitting of 0.071 d�1, which we interpret asrotational splitting, as this splitting is many sigma di↵erentfrom the orbital frequency. Furthermore, we determined thattwo of the other series of g modes form a series of doubletswith the same spherical degree. The two g-mode series haveazimuthal orders of m = �1 and m = 1. The doublets havea constant frequency splitting of 0.091 d�1, which we alsointerpret as rotational splitting. These triplets and doubletsare shown in Fig. 4.
2.2 Combination Frequencies in One Star
In the frequency range 0.6 to 1.7 d�1 a number of the highamplitude g modes (fg) combined with the strong peakat f7 = 3.3334962 ± 0.0000017 d�1. These combination fre-quencies are of the form f7 + fg and f7 � fg, so occur in thefrequency ranges 4.0 to 4.8 d�1 and 2.2 to 2.7 d�1 respec-tively of the Fourier transform of the KIC 10080943 light
curve, as shown in Fig. 5. Series 1 and 2 (the doublets iden-tified in Figs. 1, 3 and 4) are the only modes to couple withf7, suggesting that both these series, and f7, originate inone star in the binary, while series 3–6 originate in the otherstar. This tells us that both stars are pulsating with gravitymodes.
3 DISCUSSION AND CONCLUSION
Binary systems containing pulsating components are partic-ularly interesting to asteroseismology, as the binary systemplaces bounds on the masses of the stars, while the oscilla-tions tell us about the star’s internal structure. These sys-tems, however, become much more complicated when bothstars are pulsating, as the pulsations of the two stars over-lap. It then becomes necessary to disentangle the pulsationsto establish which modes originate from which star.
KIC 10080943 exhibits a large hump of g modes near1 d�1, as well as a smaller hump near 4.3 d�1. From thisfirst hump, we have identified six distinct series of g modeswithin the binary. Two of these series coupled with a strongg-mode peak at f7 = 3.3334962 ± 0.0000017 d�1 to createthe humps of g modes near 4.3 d�1 and 2.4 d�1. This leadus to conclude that these two series of g modes (as well asf7) originate in one star, while the remaining four series orig-inate in the other star. This also provides further proof thatKIC 10080943 is a binary in which both stars are pulsating.We have included the peak at 1.110715 ± 0.000004 d�1 in a
© 2015 RAS, MNRAS 000, 1–6
Figure 2. Top: Amplitude spectrum of the g-mode region, plotted as a function of period, showing the identified peaks. Dashed lines
connect neighbouring peaks in the same g-mode series. Bottom: Period spacings between adjacent modes in each series.
ding et al. (2014) have identified clear evidence for ` = 2g modes in another γ Doradus star, KIC 3127996.
The peaks are plotted in echelle format in Fig. 4 for thetwo stars, with symbol size indicating amplitude. The fre-quencies and amplitudes for the six g-mode series are givenin Tables 1 to 3. Importantly, all significant peaks in thisfrequency range have been identified with modes. The num-ber of points in the echelle diagram (Fig. 4) is greater thanthe number in the period spacing diagram (Fig. 2), since thelatter require two neighbouring modes for each period spac-
ing, but some modes are missing. Values of m could still beassigned to modes in incomplete multiplets by tracing theirperiod spacings.
2.1 Combination Frequencies
Kurtz et al. (2015) showed recently that the Fourier spec-tra of some g-mode pulsators are dominated by combina-tion frequencies. We have checked whether any peaks in themain g-mode region of KIC 10080943 (0.6 to 1.7 d−1) are
© 2015 RAS, MNRAS 000, 1–6

4 M. A. Keen et. al.
4 M. A. Keen et. al.
0.6 0.7 0.8 0.9 1 1.1 1.2 1.3 1.4 1.5 1.6 1.72,000
2,500
3,000
Frequency (d�1)
Per
iod
Spaci
ng
(s)
Star A ` = 1, m = �1
Star A ` = 1, m = 1
Star B ` = 1, m = �1
Star B ` = 1, m = 0
Star B ` = 1, m = 1
Star B? ` = 2?
0.6 0.7 0.8 0.9 1 1.1 1.2 1.3 1.4 1.5 1.6 1.70
1
2
Frequency (d�1)
Am
plitu
de
(mm
ag)
Figure 3. Top panel: Fourier spectrum of the g modes in the frequency range in the range 0.6 to 1.7 d�1 showing the identified peaks,
marked in the same way as Fig. 1. Bottom panel: Period spacing of the g modes in KIC 10080943. The period spacing is given by�Pn = Pn � Pn+1. The corresponding frequency for the x axis is the mean (1/2(fn + fn+1)) .
0.6 0.7 0.8 0.9 1 1.1 1.2 1.3 1.4 1.5 1.6 1.70
0.5
1
1.5
2
2.5
Frequency (d�1)
Am
plitu
de
(mm
ag)
Figure 4. Fourier spectrum of the g modes in the frequency range in the range 0.6 to 1.7 d�1 showing the identified triplets and doublets.
The cyan squares and red circles are ` = 1 modes originating in star A with m = �1 and m = 1 respectively. The green, left-pointing
arrows, blue triangles and magenta right-pointing arrows are ` = 1 modes originating in star B with m = �1, m = 0 and m = 1respectively. The black asterisks are ` = 2 modes originating in star B. |n| increases with increasing frequency.
series in both stars, as this frequency is consistent with theperiod spacing in either star. This is a tentative assessment,as the peak does not form a combination in the humps near4.3 d�1 and 2.4 d�1, suggesting that it may not be presentin both stars. We were then able to assign quantum num-bers ` and m to these modes, as shown in Tables 1 to 3.This includes a possible ` = 2 series of modes, which are
typically very faint in � Dor stars, so are not often observed(Bedding et al. 2014). Finally, many of these modes wereidentified to share the same ` value and were hence spacedby a constant frequency splitting caused by the rotationof the star. As there were two distinct frequency spacingsin the g modes, this again confirms the binary nature ofKIC 10080943. Thus, in this paper, we have identified all
© 2015 RAS, MNRAS 000, 1–6
Figure 3. Identification of rotationally split g-mode multiplets in KIC 10080943. Dashed lines connect peaks in each multiplet. Colours
and symbols used match those of Fig. 2.
combinations of other peaks. This was done by creating lin-ear combinations (including harmonics) of the 15 strongestpeaks, using up to three of these peaks with integer coeffi-cients from −3 to 3. None of the observed frequencies werefound to be within 1/T = 6.8 × 10⁻⁴ d−1 of a calculatedcombination frequency. This is not surprising, given that allthese peaks have already been identified with one of the sixseries of overtones.
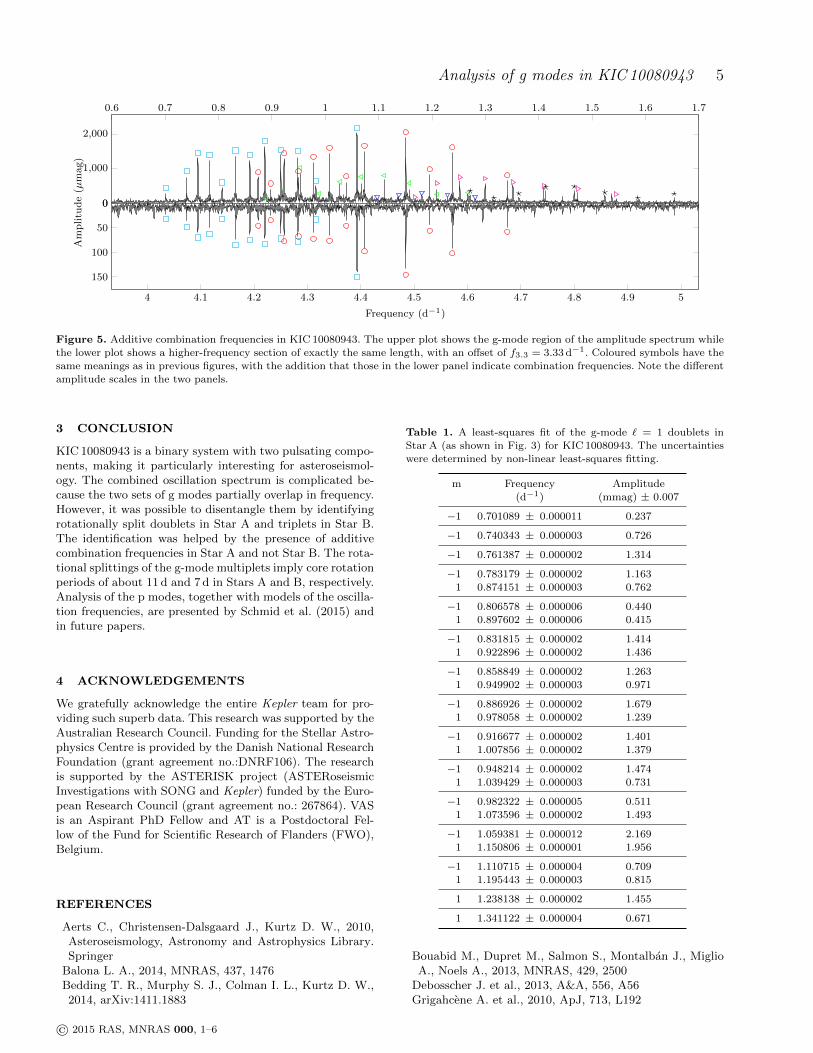
On the other hand, the small hump in the frequencyrange 4.0 to 4.8 d−1 is made up of combination peaks. Tobe specific, these peaks have frequencies f3.3 + fg, wheref3.3 = 3.3334962 ± 0.0000017 d−1 is one of the strongestpeaks in the amplitude spectrum. As can be seen in Fig. 5,the doublets we have assigned to Star A couple with f3.3 toproduce additive combination frequencies, but the tripletswe have assigned to Star B do not. This suggests that f3.3
originates in Star A and is further evidence that g-mode pul-sations occur in both components of the binary. Subtractive(f3.3 − fg) combinations are also present.
2.2 Rotational Splittings
As discussed above, we identified two series of rotationallysplit ` = 1 multiplets, one in each component of the binary –see Fig. 3. The triplets in Star B (m = 0,±1) have frequencysplittings of about 0.07 d−1 and are slightly asymmetric, asshown in the lower panel of Fig. 6. The asymmetry is small,at about 0.5 per cent, and is presumably caused by second-order effects (see Murphy 2014 for a discussion of non-equalrotational splittings in A stars in the Kepler era). The im-plied rotation period at the edge of the convective core isabout 7 d.
The doublets in Star A, which presumably correspondto azimuthal orders m = ±1, have a frequency splitting of0.091 d−1. This varies slightly with frequency, as shown inthe upper panel of Fig. 6. This variation cannot be explainedby radial differential rotation because the g-modes all probethe same region outside the core. Instead, it reflects the factthat the Ledoux constant Cn,l has a small dependence onradial order, n (Bedding et al., in prep.). Star A is a partic-
Asteroseismic measurement of g modes in KIC10080943 3
equally spaced in period, suggesting that the peaks in eachseries share a common ℓ and m value. Furthermore, some ofthe series are separated from others by a fixed frequency,suggesting rotational splitting. These six series are plot-ted with different symbols in the echelle diagram, shownin Fig. 1. The size of the points in this diagram are propor-tional to the logarithm of the amplitude of the peak, showingthat all significant modes have been identified. Given thatKIC10080943 has been established as a binary (Tkachenkoet al. 2013), we were led to identify two sets of g modes withslightly different period spacings, one from each componentof the binary. This is shown in Fig. 3. The echelle diagramhas been plotted with a period spacing between the actualperiod spacing of the two stars, resulting in the six g-modeseries being askew, rather than vertically aligned. The listsof frequencies and amplitudes for the six g-mode series in thefrequency range 0.6 to 1.7 d−1 are shown in Tables 1 to 3.
We checked whether any peaks belonging to the sixg-mode series could be combinations of stronger peaks.This was done by using the 15 strongest peaks and cre-ating linear combinations (including harmonics) of up tothree of these peaks with integer coefficients from −3to 3. None of the observed frequencies was found to bewithin 1/T = 6.8 × 10⁻⁴ d−1 of a calculated combinationfrequency.
2.1 Rotational Splitting
Of the six g-mode series, three were identified as forming aseries of triplets with the same spherical degree (ℓ value).The three g-mode series have azimuthal orders (m values)of m = −1, m = 0 and m = 1. These triplets have a con-stant frequency splitting of 0.071 d−1, which we interpret asrotational splitting, as this splitting is many sigma differentfrom the orbital frequency. Furthermore, we determined thattwo of the other series of g modes form a series of doubletswith the same spherical degree. The two g-mode series haveazimuthal orders of m = −1 and m = 1. The doublets havea constant frequency splitting of 0.091 d−1, which we alsointerpret as rotational splitting. These triplets and doubletsare shown in Fig. 4.
2.2 Combination Frequencies in One Star
In the frequency range 0.6 to 1.7 d−1 a number of the highamplitude g modes (fg) combined with the strong peakat f7 = 3.3334962 ± 0.0000017 d−1. These combination fre-quencies are of the form f7 + fg and f7 − fg, so occur in thefrequency ranges 4.0 to 4.8 d−1 and 2.2 to 2.7 d−1 respec-tively of the Fourier transform of the KIC10080943 lightcurve, as shown in Fig. 5. Series 1 and 2 (the doublets iden-tified in Figs. 1, 3 and 4) are the only modes to couple withf7, suggesting that both these series, and f7, originate inone star in the binary, while series 3–6 originate in the otherstar. This tells us that both stars are pulsating with gravitymodes.
3 DISCUSSION AND CONCLUSION
Binary systems containing pulsating components are partic-ularly interesting to asteroseismology, as the binary system
1.05 1.1 1.15 1.2 1.25 1.3 1.35 1.47.02
7.04
7.06
7.08
7.1·10−2
Frequency (d−1)
Fre
quen
cySplitt
ing
(10
−2
d−
1)
0.8 0.9 1 1.1 1.29.08
9.1
9.12
9.14
9.16·10−2
Frequency (d−1)
Fre
quen
cySplitt
ing
(10
−2
d−
1)
Figure 6. The upper panel shows the rotational splitting of thedoublets from star A. This splitting is measured from the m = −1ro m = 1 modes for each radial order. The lower panel shows therotational splitting of the triplets for star B. The magenta right-pointing arrows show the splitting measured between the m = 0and m = 1 modes, while the green left-pointing arrows show thesplitting measured between the m = −1 and m = 0 modes
places bounds on the masses of the stars, while the oscilla-tions tell us about the star’s internal structure. These sys-tems, however, become much more complicated when bothstars are pulsating, as the pulsations of the two stars over-lap. It then becomes necessary to disentangle the pulsationsto establish which modes originate from which star.
KIC10080943 exhibits a large hump of g modes near1 d−1, as well as a smaller hump near 4.3 d−1. From thisfirst hump, we have identified six distinct series of g modeswithin the binary. Two of these series coupled with a strongg-mode peak at f7 = 3.3334962 ± 0.0000017 d−1 to createthe humps of g modes near 4.3 d−1 and 2.4 d−1. This leadus to conclude that these two series of g modes (as well asf7) originate in one star, while the remaining four series orig-inate in the other star. This also provides further proof thatKIC10080943 is a binary in which both stars are pulsating.We have included the peak at 1.110715 ± 0.000004 d−1 in aseries in both stars, as this frequency is consistent with theperiod spacing in either star. This is a tentative assessment,as the peak does not form a combination in the humps near4.3 d−1 and 2.4 d−1, suggesting that it may not be presentin both stars. We were then able to assign quantum num-bers ℓ and m to these modes, as shown in Tables 1 to 3.This includes a possible ℓ = 2 series of modes, which aretypically very faint in γ Dor stars, so are not often observed(Bedding et al. 2014). Finally, many of these modes were
© 2015 RAS, MNRAS 000, 1–6
Figure 6. Upper panel: rotational splittings of the doublets in
Star A, measured between the m = −1 and m = 1 modes for eachradial order. Lower panel: rotational splittings of the triplets forStar B. The upper sequence (magenta symbols) show the split-
tings measured between m = 0 and m = 1, while the lower se-quence (green symbols) show the splittings between m = −1 and
m = 0.
ularly good example of this phenomenon. Its core rotationperiod is about 11 d.
© 2015 RAS, MNRAS 000, 1–6
Analysis of g modes in KIC 10080943 54 M. A. Keen et. al.
4 4.1 4.2 4.3 4.4 4.5 4.6 4.7 4.8 4.9 5
0
50
100
150
Frequency (d�1)
Am
plitu
de
(µm
ag)
0.6 0.7 0.8 0.9 1 1.1 1.2 1.3 1.4 1.5 1.6 1.7
0
1,000
2,000
Figure 5. The upper half of the plot shows the g-mode spectrum for frequencies 0.6 to 1.7 d�1, while the bottom half of the plot shows
the result of these g modes combining with f7 = 3.3334962 ± 0.0000017 d�1 in the form f7 + fg . The vertical lines through the plot
indicate which modes are combinations, where the colour corresponds to the g-mode series that the modes belong to. The colours areconsistent with Figs. 2 and 3. Ergo, the cyan lines and red lines are ` = 1 modes originating in star A with m = �1 and m = 1respectively. Note the di↵erent amplitude scale between the top and bottom panels.
�2,000 �1,000 0 1,000 2,000
0.7
0.8
0.9
1
1.1
1.2
1.3
1.4
1.5
1.6
Period modulo 2840 seconds
Fre
quen
cy(d
�1)
Figure 2. Echelle diagram of the frequencies in the range0.6to1.7 d�1. Each frequency has been plotted against the pe-
riod modulo 2840 s. The data have been plotted twice for clarity.This figure clearly shows the six g-mode series, shown as cyan
squares, red circles, green left-pointing arrows, blue triangles, ma-
genta right-pointing arrows and black stars. The size of the pointsis proportional to the logarithm of the amplitude of the corre-sponding peak in the Fourier spectrum. The orange crosses show
the peaks that do not belong to any series.
rotational splitting, as this splitting is many sigma di↵erentfrom the orbital frequency. Furthermore, we determined thattwo of the other series of g modes form a series of doubletswith the same spherical degree. The two g-mode series haveazimuthal orders of m = �1 and m = 1. The doublets havea constant frequency splitting of 0.091 d�1, which we alsointerpret as rotational splitting. These triplets and doubletsare shown in Fig. 4.
2.2 Combination Frequencies in One Star
In the frequency range 0.6 to 1.7 d�1 a number of the highamplitude g modes (fg) combined with the strong peakat f7 = 3.3334962 ± 0.0000017 d�1. These combination fre-quencies are of the form f7 + fg and f7 � fg, so occur in thefrequency ranges 4.0 to 4.8 d�1 and 2.2 to 2.7 d�1 respec-tively of the Fourier transform of the KIC 10080943 lightcurve, as shown in Fig. 5. Series 1 and 2 (the doublets iden-tified in Figs. 2 to 4) are the only modes to couple with f7,suggesting that both these series, and f7, originate in onestar in the binary, while series 3–6 originate in the otherstar. This tells us that both stars are pulsating with gravitymodes.
3 DISCUSSION AND CONCLUSION
Binary systems containing pulsating components are partic-ularly interesting to asteroseismology, as the binary systemplaces bounds on the masses of the stars, while the oscilla-tions tell us about the star’s internal structure. These sys-tems, however, become much more complicated when bothstars are pulsating, as the pulsations of the two stars over-lap. It then becomes necessary to disentangle the pulsationsto establish which modes originate from which star.
KIC 10080943 exhibits a large hump of g modes near1 d�1, as well as a smaller hump near 4.3 d�1. From thisfirst hump, we have identified six distinct series of g modes
© 2015 RAS, MNRAS 000, 1–6
Figure 5. Additive combination frequencies in KIC 10080943. The upper plot shows the g-mode region of the amplitude spectrum whilethe lower plot shows a higher-frequency section of exactly the same length, with an offset of f3.3 = 3.33 d−1. Coloured symbols have the
same meanings as in previous figures, with the addition that those in the lower panel indicate combination frequencies. Note the different
amplitude scales in the two panels.
3 CONCLUSION
KIC 10080943 is a binary system with two pulsating compo-nents, making it particularly interesting for asteroseismol-ogy. The combined oscillation spectrum is complicated be-cause the two sets of g modes partially overlap in frequency.However, it was possible to disentangle them by identifyingrotationally split doublets in Star A and triplets in Star B.The identification was helped by the presence of additivecombination frequencies in Star A and not Star B. The rota-tional splittings of the g-mode multiplets imply core rotationperiods of about 11 d and 7 d in Stars A and B, respectively.Analysis of the p modes, together with models of the oscilla-tion frequencies, are presented by Schmid et al. (2015) andin future papers.
4 ACKNOWLEDGEMENTS
We gratefully acknowledge the entire Kepler team for pro-viding such superb data. This research was supported by theAustralian Research Council. Funding for the Stellar Astro-physics Centre is provided by the Danish National ResearchFoundation (grant agreement no.:DNRF106). The researchis supported by the ASTERISK project (ASTERoseismicInvestigations with SONG and Kepler) funded by the Euro-pean Research Council (grant agreement no.: 267864). VASis an Aspirant PhD Fellow and AT is a Postdoctoral Fel-low of the Fund for Scientific Research of Flanders (FWO),Belgium.
REFERENCES
Aerts C., Christensen-Dalsgaard J., Kurtz D. W., 2010,Asteroseismology, Astronomy and Astrophysics Library.Springer
Balona L. A., 2014, MNRAS, 437, 1476Bedding T. R., Murphy S. J., Colman I. L., Kurtz D. W.,2014, arXiv:1411.1883
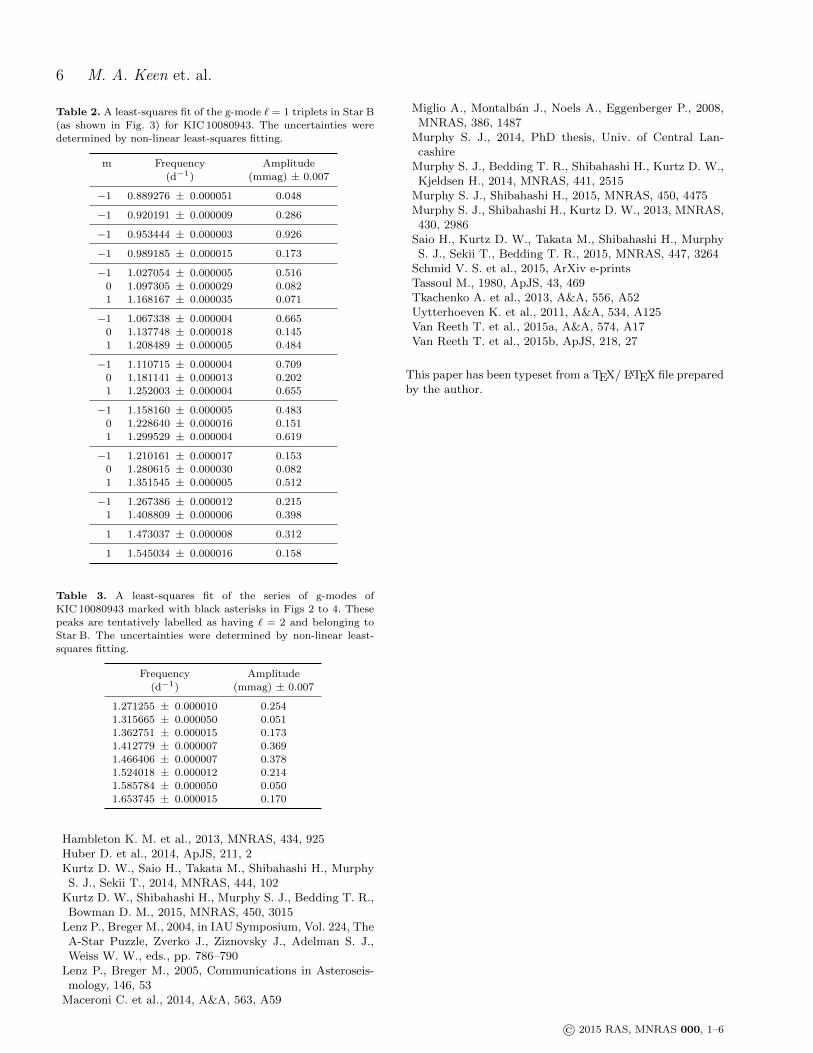
Table 1. A least-squares fit of the g-mode ` = 1 doublets in
Star A (as shown in Fig. 3) for KIC 10080943. The uncertaintieswere determined by non-linear least-squares fitting.
m Frequency Amplitude
(d−1) (mmag) ± 0.007
−1 0.701089 ± 0.000011 0.237
−1 0.740343 ± 0.000003 0.726
−1 0.761387 ± 0.000002 1.314
−1 0.783179 ± 0.000002 1.163
1 0.874151 ± 0.000003 0.762
−1 0.806578 ± 0.000006 0.440
1 0.897602 ± 0.000006 0.415
−1 0.831815 ± 0.000002 1.414
1 0.922896 ± 0.000002 1.436
−1 0.858849 ± 0.000002 1.263
1 0.949902 ± 0.000003 0.971
−1 0.886926 ± 0.000002 1.6791 0.978058 ± 0.000002 1.239
−1 0.916677 ± 0.000002 1.401
1 1.007856 ± 0.000002 1.379
−1 0.948214 ± 0.000002 1.4741 1.039429 ± 0.000003 0.731
−1 0.982322 ± 0.000005 0.511
1 1.073596 ± 0.000002 1.493
−1 1.059381 ± 0.000012 2.1691 1.150806 ± 0.000001 1.956
−1 1.110715 ± 0.000004 0.709
1 1.195443 ± 0.000003 0.815
1 1.238138 ± 0.000002 1.455
1 1.341122 ± 0.000004 0.671
Bouabid M., Dupret M., Salmon S., Montalban J., MiglioA., Noels A., 2013, MNRAS, 429, 2500
Debosscher J. et al., 2013, A&A, 556, A56Grigahcene A. et al., 2010, ApJ, 713, L192
© 2015 RAS, MNRAS 000, 1–6
6 M. A. Keen et. al.
Table 2. A least-squares fit of the g-mode ` = 1 triplets in Star B
(as shown in Fig. 3) for KIC 10080943. The uncertainties were
determined by non-linear least-squares fitting.
m Frequency Amplitude
(d−1) (mmag) ± 0.007
−1 0.889276 ± 0.000051 0.048
−1 0.920191 ± 0.000009 0.286
−1 0.953444 ± 0.000003 0.926
−1 0.989185 ± 0.000015 0.173
−1 1.027054 ± 0.000005 0.5160 1.097305 ± 0.000029 0.082
1 1.168167 ± 0.000035 0.071
−1 1.067338 ± 0.000004 0.6650 1.137748 ± 0.000018 0.145
1 1.208489 ± 0.000005 0.484
−1 1.110715 ± 0.000004 0.709
0 1.181141 ± 0.000013 0.2021 1.252003 ± 0.000004 0.655
−1 1.158160 ± 0.000005 0.483
0 1.228640 ± 0.000016 0.1511 1.299529 ± 0.000004 0.619
−1 1.210161 ± 0.000017 0.153
0 1.280615 ± 0.000030 0.082
1 1.351545 ± 0.000005 0.512
−1 1.267386 ± 0.000012 0.2151 1.408809 ± 0.000006 0.398
1 1.473037 ± 0.000008 0.312
1 1.545034 ± 0.000016 0.158
Table 3. A least-squares fit of the series of g-modes of
KIC 10080943 marked with black asterisks in Figs 2 to 4. These
peaks are tentatively labelled as having ` = 2 and belonging toStar B. The uncertainties were determined by non-linear least-
squares fitting.
Frequency Amplitude(d−1) (mmag) ± 0.007
1.271255 ± 0.000010 0.254
1.315665 ± 0.000050 0.051
1.362751 ± 0.000015 0.1731.412779 ± 0.000007 0.369
1.466406 ± 0.000007 0.3781.524018 ± 0.000012 0.2141.585784 ± 0.000050 0.050
1.653745 ± 0.000015 0.170
Hambleton K. M. et al., 2013, MNRAS, 434, 925Huber D. et al., 2014, ApJS, 211, 2Kurtz D. W., Saio H., Takata M., Shibahashi H., MurphyS. J., Sekii T., 2014, MNRAS, 444, 102
Kurtz D. W., Shibahashi H., Murphy S. J., Bedding T. R.,Bowman D. M., 2015, MNRAS, 450, 3015
Lenz P., Breger M., 2004, in IAU Symposium, Vol. 224, TheA-Star Puzzle, Zverko J., Ziznovsky J., Adelman S. J.,Weiss W. W., eds., pp. 786–790
Lenz P., Breger M., 2005, Communications in Asteroseis-mology, 146, 53
Maceroni C. et al., 2014, A&A, 563, A59
Miglio A., Montalban J., Noels A., Eggenberger P., 2008,MNRAS, 386, 1487
Murphy S. J., 2014, PhD thesis, Univ. of Central Lan-cashire
Murphy S. J., Bedding T. R., Shibahashi H., Kurtz D. W.,Kjeldsen H., 2014, MNRAS, 441, 2515
Murphy S. J., Shibahashi H., 2015, MNRAS, 450, 4475Murphy S. J., Shibahashi H., Kurtz D. W., 2013, MNRAS,430, 2986
Saio H., Kurtz D. W., Takata M., Shibahashi H., MurphyS. J., Sekii T., Bedding T. R., 2015, MNRAS, 447, 3264
Schmid V. S. et al., 2015, ArXiv e-printsTassoul M., 1980, ApJS, 43, 469Tkachenko A. et al., 2013, A&A, 556, A52Uytterhoeven K. et al., 2011, A&A, 534, A125Van Reeth T. et al., 2015a, A&A, 574, A17Van Reeth T. et al., 2015b, ApJS, 218, 27
This paper has been typeset from a TEX/ LATEX file preparedby the author.
© 2015 RAS, MNRAS 000, 1–6


![z arXiv:1602.01098v3 [astro-ph.GA] 21 Sep 2016 M · PDF file · 2016-09-22Izotov et al. 2012), and at z & 0.2 (Hoyos et al. 2005; Kakazu et al. 2007; Hu et al. 2009; Atek et al. 2011;](https://static.fdocument.org/doc/165x107/5ab0c58d7f8b9a6b468bae0c/z-arxiv160201098v3-astro-phga-21-sep-2016-m-et-al-2012-and-at-z-02-hoyos.jpg)