Jurg Diemand¨ , Michael Kuhlen , & Piero Madaudiemand/vl/publ/vlevol.pdf · PKDGRAV tree-code...
20
Preprint typeset using L A T E X style emulateapj v. 05/04/06 FORMATION AND EVOLUTION OF GALAXY DARK MATTER HALOS AND THEIR SUBSTRUCTURE J¨ urg Diemand 1,2 , Michael Kuhlen 3 , & Piero Madau 1,4 ABSTRACT We use the “Via Lactea” simulation to study the co-evolution of a Milky Way-size ΛCDM halo and its subhalo population. While most of the host halo mass is accreted over the first 6 Gyr in a series of major mergers, the physical mass distribution [not M vir (z )] remains practically constant since z = 1. The same is true in a large sample of ΛCDM galaxy halos. Subhalo mass loss peaks between the turnaround and virialization epochs of a given mass shell, and declines afterwards. 97% of the z = 1 subhalos have a surviving bound remnant at the present epoch. The retained mass fraction is larger for initially lighter subhalos: satellites with maximum circular velocities V max = 10 km/s at z = 1 have today about 40% of their mass back then. At the first pericenter passage a larger average mass fraction is lost than during each following orbit. Tides remove mass in substructure from the outside in, leading to higher concentrations compared to field halos of the same mass. This effect, combined with the earlier formation epoch of the inner satellites, results in strongly increasing subhalo concentrations towards the Galactic center. We present individual evolutionary tracks and present-day properties of the likely hosts of the dwarf satellites around the Milky Way. The formation histories of “field halos” that lie today beyond the Via Lactea host are found to strongly depend on the density of their environment. This is caused by tidal mass loss that affects many field halos on eccentric orbits. Subject headings: cosmology: theory – dark matter – galaxies: dwarfs – galaxies: formation – galaxies: halos – methods: numerical 1. INTRODUCTION Cosmological N-body simulations with large dynamic range (i.e. with large numbers of particles per virialized object and adequately high force and time resolution) make it possible to follow the highly non-linear forma- tion of cold dark matter (CDM) halos and their sub- structure in great detail (e.g. Ghigna et al. 1998, 2000; Klypin et al. 1999; Moore et al. 1999, 2001; Fukushige et al. 2004; Kravtsov et al. 2004; Diemand et al. 2004; Gao et al. 2004; Gill et al. 2005; Reed et al. 2005). We have recently completed “Via Lactea”, the highest reso- lution simulation to date of CDM substructure. The run was completed in 320,000 CPU hours on NASA’s Project Columbia supercomputer, and follows the formation of a Milky Way-size halo with 234 million particles, an or- der of magnitude more than achieved previously. The present-day properties of the galaxy host and its sub- structure were presented in Diemand, Kuhlen, & Madau (2007, hereafter Paper I). In this second paper we use data extracted from all 200 snapshots stored during the Via Lactea run to study the mass assembly history of the main halo and the subhalo population. Ghigna et al. (1998) and Bullock et al. (2001) have noted that subhalos are more concentrated than field ha- los. We now have the resolution and statistics to quantify this effect, and the large number of snapshots allows us to understand its origin. We can follow the evolution of massive subhalos at similar or higher resolution as in 1 Department of Astronomy & Astrophysics, University of Cali- fornia, Santa Cruz, CA 95064. 2 Hubble Fellow. 3 School of Natural Sciences, Institute for Advanced Study, Ein- stein Drive, Princeton, NJ 08540. 4 Max-Planck-Institut f¨ ur Astrophysik, Karl-Schwarzschild-Str. 1, 85740 Garching, Germany. email: [email protected], [email protected], [email protected]. idealized N-body experiments that evolve one satellite in an external potential (e.g. Hayashi et al. 2003; Dekel et al. 2003; Kazantzidis et al. 2004; Read et al. 2006), but within a “live” host halo forming and evolving within the cosmological context. The increased resolution allows more accurate estimates of the fraction of subhalos that survive, the mass they retain, the effect of tidal strip- ping on their internal structure. How subhalo density profile and concentrations evolve during tidal mass loss? Are subhalos really fully disrupted once the tidal radius at pericenter is smaller than their scale radius (Hayashi et al. 2003)? How strongly does the heating from tidal shocks reduce inner subhalo densities? Or do tides in the inner, shallow part of the host lead to subhalo compres- sion (Dekel et al. 2003)? One interesting result that becomes apparent in cosmo- logical simulations when tracking halos moving within a cluster potential is that many (sub)halos that were well within the cluster virial radius r vir at some earlier time can be found today beyond r vir (Balogh et al. 2000; Moore et al. 2004; Gill et al. 2005). This implies that the formation histories of “field” galaxy halos are affected by their environment, as many of the halos found in the out- skirts of larger systems today may have shed mass dur- ing an earlier pericenter passage because of tidal inter- actions. Significant correlations between the formation times of galaxy-size halos of a fixed mass, their cluster- ing strength (Sheth & Tormen 2004; Gao et al. 2005), and the density of their environment (Harker et al. 2006) have indeed been found. In this work, we show that these correlations are caused by tidal interactions of (sub)halos on extended radial orbits with a more massive neighbor. This paper is organized as follows. In § 2 we study the mass assembly of the Via Lactea host and its substruc- ture population, and introduce physical (non-comoving) general definitions of (sub)halo properties like size, mass,
Transcript of Jurg Diemand¨ , Michael Kuhlen , & Piero Madaudiemand/vl/publ/vlevol.pdf · PKDGRAV tree-code...
Preprint typeset using LATEX style emulateapj v. 05/04/06
FORMATION AND EVOLUTION OF GALAXY DARK MATTER HALOS AND THEIR SUBSTRUCTURE
Jurg Diemand1,2, Michael Kuhlen3, & Piero Madau1,4
ABSTRACT
We use the “Via Lactea” simulation to study the co-evolution of a Milky Way-size ΛCDM haloand its subhalo population. While most of the host halo mass is accreted over the first 6 Gyr in aseries of major mergers, the physical mass distribution [not Mvir(z)] remains practically constant sincez = 1. The same is true in a large sample of ΛCDM galaxy halos. Subhalo mass loss peaks betweenthe turnaround and virialization epochs of a given mass shell, and declines afterwards. 97% of thez = 1 subhalos have a surviving bound remnant at the present epoch. The retained mass fractionis larger for initially lighter subhalos: satellites with maximum circular velocities Vmax = 10 km/sat z = 1 have today about 40% of their mass back then. At the first pericenter passage a largeraverage mass fraction is lost than during each following orbit. Tides remove mass in substructurefrom the outside in, leading to higher concentrations compared to field halos of the same mass. Thiseffect, combined with the earlier formation epoch of the inner satellites, results in strongly increasingsubhalo concentrations towards the Galactic center. We present individual evolutionary tracks andpresent-day properties of the likely hosts of the dwarf satellites around the Milky Way. The formationhistories of “field halos” that lie today beyond the Via Lactea host are found to strongly depend onthe density of their environment. This is caused by tidal mass loss that affects many field halos oneccentric orbits.Subject headings: cosmology: theory – dark matter – galaxies: dwarfs – galaxies: formation – galaxies:
halos – methods: numerical
1. INTRODUCTION
Cosmological N-body simulations with large dynamicrange (i.e. with large numbers of particles per virializedobject and adequately high force and time resolution)make it possible to follow the highly non-linear forma-tion of cold dark matter (CDM) halos and their sub-structure in great detail (e.g. Ghigna et al. 1998, 2000;Klypin et al. 1999; Moore et al. 1999, 2001; Fukushigeet al. 2004; Kravtsov et al. 2004; Diemand et al. 2004;Gao et al. 2004; Gill et al. 2005; Reed et al. 2005). Wehave recently completed “Via Lactea”, the highest reso-lution simulation to date of CDM substructure. The runwas completed in 320,000 CPU hours on NASA’s ProjectColumbia supercomputer, and follows the formation of aMilky Way-size halo with 234 million particles, an or-der of magnitude more than achieved previously. Thepresent-day properties of the galaxy host and its sub-structure were presented in Diemand, Kuhlen, & Madau(2007, hereafter Paper I). In this second paper we usedata extracted from all 200 snapshots stored during theVia Lactea run to study the mass assembly history of themain halo and the subhalo population.
Ghigna et al. (1998) and Bullock et al. (2001) havenoted that subhalos are more concentrated than field ha-los. We now have the resolution and statistics to quantifythis effect, and the large number of snapshots allows usto understand its origin. We can follow the evolutionof massive subhalos at similar or higher resolution as in
1 Department of Astronomy & Astrophysics, University of Cali-fornia, Santa Cruz, CA 95064.
2 Hubble Fellow.3 School of Natural Sciences, Institute for Advanced Study, Ein-
stein Drive, Princeton, NJ 08540.4 Max-Planck-Institut fur Astrophysik, Karl-Schwarzschild-Str.
1, 85740 Garching, Germany.email: [email protected], [email protected], [email protected].
idealized N-body experiments that evolve one satellite inan external potential (e.g. Hayashi et al. 2003; Dekel etal. 2003; Kazantzidis et al. 2004; Read et al. 2006), butwithin a “live” host halo forming and evolving within thecosmological context. The increased resolution allowsmore accurate estimates of the fraction of subhalos thatsurvive, the mass they retain, the effect of tidal strip-ping on their internal structure. How subhalo densityprofile and concentrations evolve during tidal mass loss?Are subhalos really fully disrupted once the tidal radiusat pericenter is smaller than their scale radius (Hayashiet al. 2003)? How strongly does the heating from tidalshocks reduce inner subhalo densities? Or do tides in theinner, shallow part of the host lead to subhalo compres-sion (Dekel et al. 2003)?
One interesting result that becomes apparent in cosmo-logical simulations when tracking halos moving withina cluster potential is that many (sub)halos that werewell within the cluster virial radius rvir at some earliertime can be found today beyond rvir (Balogh et al. 2000;Moore et al. 2004; Gill et al. 2005). This implies that theformation histories of “field” galaxy halos are affected bytheir environment, as many of the halos found in the out-skirts of larger systems today may have shed mass dur-ing an earlier pericenter passage because of tidal inter-actions. Significant correlations between the formationtimes of galaxy-size halos of a fixed mass, their cluster-ing strength (Sheth & Tormen 2004; Gao et al. 2005),and the density of their environment (Harker et al. 2006)have indeed been found. In this work, we show that thesecorrelations are caused by tidal interactions of (sub)haloson extended radial orbits with a more massive neighbor.
This paper is organized as follows. In § 2 we study themass assembly of the Via Lactea host and its substruc-ture population, and introduce physical (non-comoving)general definitions of (sub)halo properties like size, mass,
2 Evolution of ΛCDM halos and their substructure
time [Gyr]0 2 4 6 8 10 12 14
[ M
pc
]Mr
0
0.2
0.4
0.6
0.8
1
1.2
1.4
time [Gyr]0 2 4 6 8 10 12 14
[ M
pc
]Mr
0
0.2
0.4
0.6
0.8
1
1.2
1.4
M12 10×0.3
M12 10×(a=1)=1.8 200M
M12 10×2.4
M12 10×2.7
M12 10×3.0
a = 1/(1+z)
0.1 0.2 0.3 0.4 0.5 0.6 0.7 0.8 0.9 1.0
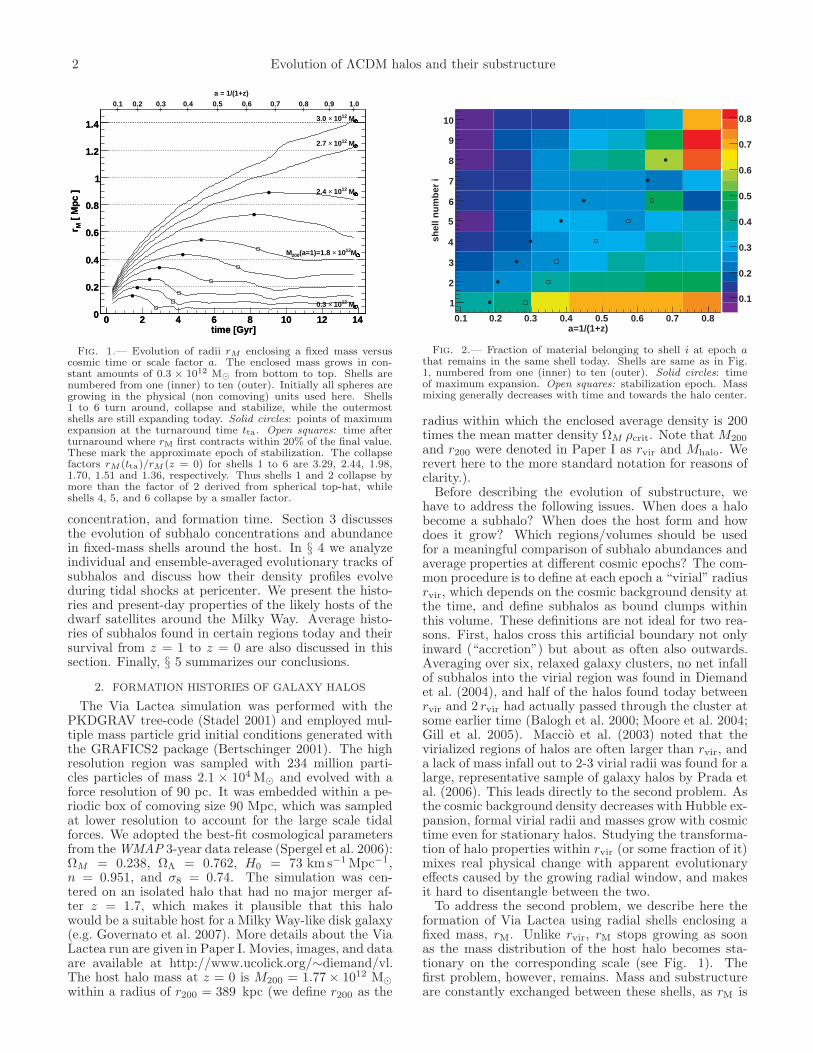
Fig. 1.— Evolution of radii rM enclosing a fixed mass versuscosmic time or scale factor a. The enclosed mass grows in con-stant amounts of 0.3 × 10¹² M⊙ from bottom to top. Shells arenumbered from one (inner) to ten (outer). Initially all spheres aregrowing in the physical (non comoving) units used here. Shells1 to 6 turn around, collapse and stabilize, while the outermostshells are still expanding today. Solid circles: points of maximumexpansion at the turnaround time tta. Open squares: time afterturnaround where rM first contracts within 20% of the final value.These mark the approximate epoch of stabilization. The collapsefactors rM (tta)/rM (z = 0) for shells 1 to 6 are 3.29, 2.44, 1.98,1.70, 1.51 and 1.36, respectively. Thus shells 1 and 2 collapse bymore than the factor of 2 derived from spherical top-hat, whileshells 4, 5, and 6 collapse by a smaller factor.
concentration, and formation time. Section 3 discussesthe evolution of subhalo concentrations and abundancein fixed-mass shells around the host. In § 4 we analyzeindividual and ensemble-averaged evolutionary tracks ofsubhalos and discuss how their density profiles evolveduring tidal shocks at pericenter. We present the histo-ries and present-day properties of the likely hosts of thedwarf satellites around the Milky Way. Average histo-ries of subhalos found in certain regions today and theirsurvival from z = 1 to z = 0 are also discussed in thissection. Finally, § 5 summarizes our conclusions.
2. FORMATION HISTORIES OF GALAXY HALOS
The Via Lactea simulation was performed with thePKDGRAV tree-code (Stadel 2001) and employed mul-tiple mass particle grid initial conditions generated withthe GRAFICS2 package (Bertschinger 2001). The highresolution region was sampled with 234 million parti-cles particles of mass 2.1 × 10⁴ M⊙ and evolved with aforce resolution of 90 pc. It was embedded within a pe-riodic box of comoving size 90 Mpc, which was sampledat lower resolution to account for the large scale tidalforces. We adopted the best-fit cosmological parametersfrom the WMAP 3-year data release (Spergel et al. 2006):ΩM = 0.238, ΩΛ = 0.762, H0 = 73 km s−1 Mpc−1,n = 0.951, and σ8 = 0.74. The simulation was cen-tered on an isolated halo that had no major merger af-ter z = 1.7, which makes it plausible that this halowould be a suitable host for a Milky Way-like disk galaxy(e.g. Governato et al. 2007). More details about the ViaLactea run are given in Paper I. Movies, images, and dataare available at http://www.ucolick.org/∼diemand/vl.The host halo mass at z = 0 is M200 = 1.77 × 10¹² M⊙
within a radius of r200 = 389 kpc (we define r200 as the
0.1
0.2
0.3
0.4
0.5
0.6
0.7
0.8
a=1/(1+z)0.1 0.2 0.3 0.4 0.5 0.6 0.7 0.8
shel
l nu
mb
er i
1
2
3
4
5
6
7
8
9
10
Fig. 2.— Fraction of material belonging to shell i at epoch athat remains in the same shell today. Shells are same as in Fig.1, numbered from one (inner) to ten (outer). Solid circles: timeof maximum expansion. Open squares: stabilization epoch. Massmixing generally decreases with time and towards the halo center.
radius within which the enclosed average density is 200times the mean matter density ΩM ρcrit. Note that M200
and r200 were denoted in Paper I as rvir and Mhalo. Werevert here to the more standard notation for reasons ofclarity.).
Before describing the evolution of substructure, wehave to address the following issues. When does a halobecome a subhalo? When does the host form and howdoes it grow? Which regions/volumes should be usedfor a meaningful comparison of subhalo abundances andaverage properties at different cosmic epochs? The com-mon procedure is to define at each epoch a “virial” radiusrvir, which depends on the cosmic background density atthe time, and define subhalos as bound clumps withinthis volume. These definitions are not ideal for two rea-sons. First, halos cross this artificial boundary not onlyinward (“accretion”) but about as often also outwards.Averaging over six, relaxed galaxy clusters, no net infallof subhalos into the virial region was found in Diemandet al. (2004), and half of the halos found today betweenrvir and 2 rvir had actually passed through the cluster atsome earlier time (Balogh et al. 2000; Moore et al. 2004;Gill et al. 2005). Maccio et al. (2003) noted that thevirialized regions of halos are often larger than rvir, anda lack of mass infall out to 2-3 virial radii was found for alarge, representative sample of galaxy halos by Prada etal. (2006). This leads directly to the second problem. Asthe cosmic background density decreases with Hubble ex-pansion, formal virial radii and masses grow with cosmictime even for stationary halos. Studying the transforma-tion of halo properties within rvir (or some fraction of it)mixes real physical change with apparent evolutionaryeffects caused by the growing radial window, and makesit hard to disentangle between the two.
To address the second problem, we describe here theformation of Via Lactea using radial shells enclosing afixed mass, rM. Unlike rvir, rM stops growing as soonas the mass distribution of the host halo becomes sta-tionary on the corresponding scale (see Fig. 1). Thefirst problem, however, remains. Mass and substructureare constantly exchanged between these shells, as rM is
Diemand, Kuhlen, & Madau 3
a = 1 / (1+z)0.2 0.4 0.6 0.8 1
]M
(<r)
[ M
610
710
810
910
1010
1110
1210
1310
1410
a = 1 / (1+z)0.2 0.4 0.6 0.8 1
]M
(<r)
[ M
610
710
810
910
1010
1110
1210
1310
1410
0.1 kpc
1 kpc
10 kpc
100 kpc
1 Mpc
10 Mpc
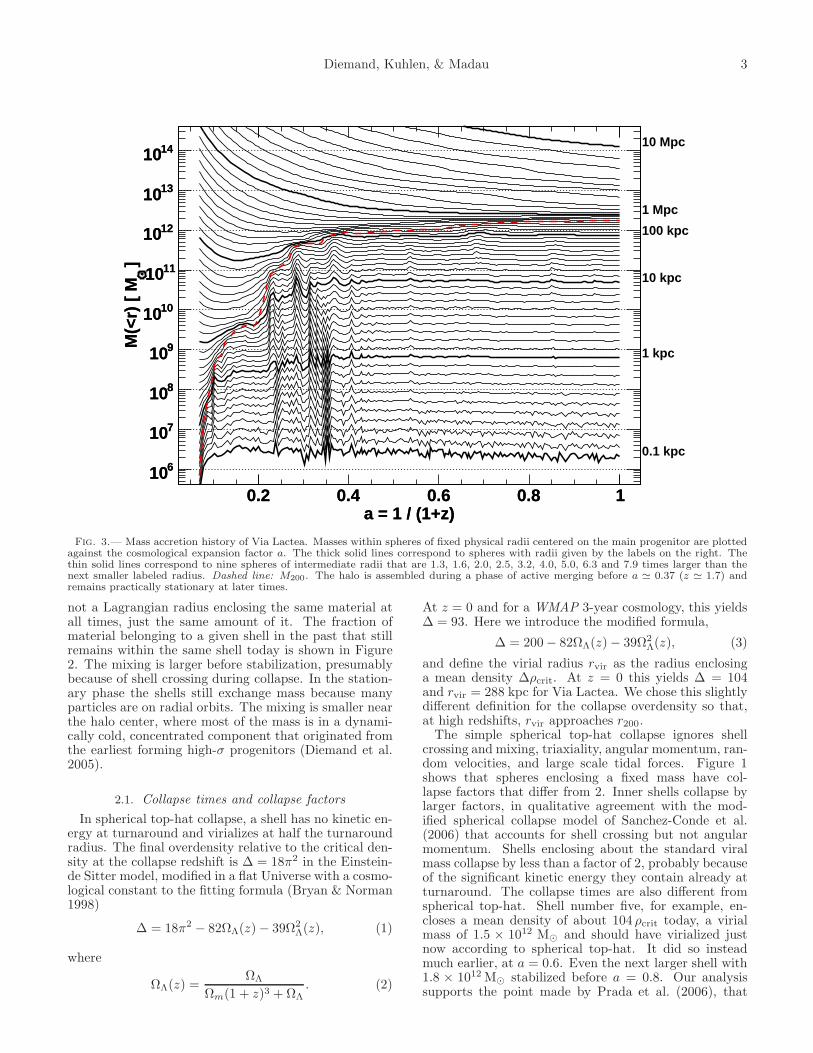
Fig. 3.— Mass accretion history of Via Lactea. Masses within spheres of fixed physical radii centered on the main progenitor are plottedagainst the cosmological expansion factor a. The thick solid lines correspond to spheres with radii given by the labels on the right. Thethin solid lines correspond to nine spheres of intermediate radii that are 1.3, 1.6, 2.0, 2.5, 3.2, 4.0, 5.0, 6.3 and 7.9 times larger than thenext smaller labeled radius. Dashed line: M200. The halo is assembled during a phase of active merging before a ≃ 0.37 (z ≃ 1.7) andremains practically stationary at later times.
not a Lagrangian radius enclosing the same material atall times, just the same amount of it. The fraction ofmaterial belonging to a given shell in the past that stillremains within the same shell today is shown in Figure2. The mixing is larger before stabilization, presumablybecause of shell crossing during collapse. In the station-ary phase the shells still exchange mass because manyparticles are on radial orbits. The mixing is smaller nearthe halo center, where most of the mass is in a dynami-cally cold, concentrated component that originated fromthe earliest forming high-σ progenitors (Diemand et al.2005).
2.1. Collapse times and collapse factors
In spherical top-hat collapse, a shell has no kinetic en-ergy at turnaround and virializes at half the turnaroundradius. The final overdensity relative to the critical den-sity at the collapse redshift is ∆ = 18π2 in the Einstein-de Sitter model, modified in a flat Universe with a cosmo-logical constant to the fitting formula (Bryan & Norman1998)
∆ = 18π2 − 82ΩΛ(z) − 39Ω2Λ(z), (1)
where
ΩΛ(z) =ΩΛ
Ωm(1 + z)3 + ΩΛ. (2)
At z = 0 and for a WMAP 3-year cosmology, this yields∆ = 93. Here we introduce the modified formula,
∆ = 200 − 82ΩΛ(z) − 39Ω2Λ(z), (3)
and define the virial radius rvir as the radius enclosinga mean density ∆ρcrit. At z = 0 this yields ∆ = 104and rvir = 288 kpc for Via Lactea. We chose this slightlydifferent definition for the collapse overdensity so that,at high redshifts, rvir approaches r200.
The simple spherical top-hat collapse ignores shellcrossing and mixing, triaxiality, angular momentum, ran-dom velocities, and large scale tidal forces. Figure 1shows that spheres enclosing a fixed mass have col-lapse factors that differ from 2. Inner shells collapse bylarger factors, in qualitative agreement with the mod-ified spherical collapse model of Sanchez-Conde et al.(2006) that accounts for shell crossing but not angularmomentum. Shells enclosing about the standard viralmass collapse by less than a factor of 2, probably becauseof the significant kinetic energy they contain already atturnaround. The collapse times are also different fromspherical top-hat. Shell number five, for example, en-closes a mean density of about 104 ρcrit today, a virialmass of 1.5 × 10¹² M⊙ and should have virialized justnow according to spherical top-hat. It did so insteadmuch earlier, at a = 0.6. Even the next larger shell with1.8 × 1012 M⊙ stabilized before a = 0.8. Our analysissupports the point made by Prada et al. (2006), that
4 Evolution of ΛCDM halos and their substructure
spherical top-hat provides only a crude approximationto the virialized regions of simulated galaxy halos.
2.2. Accretion histories
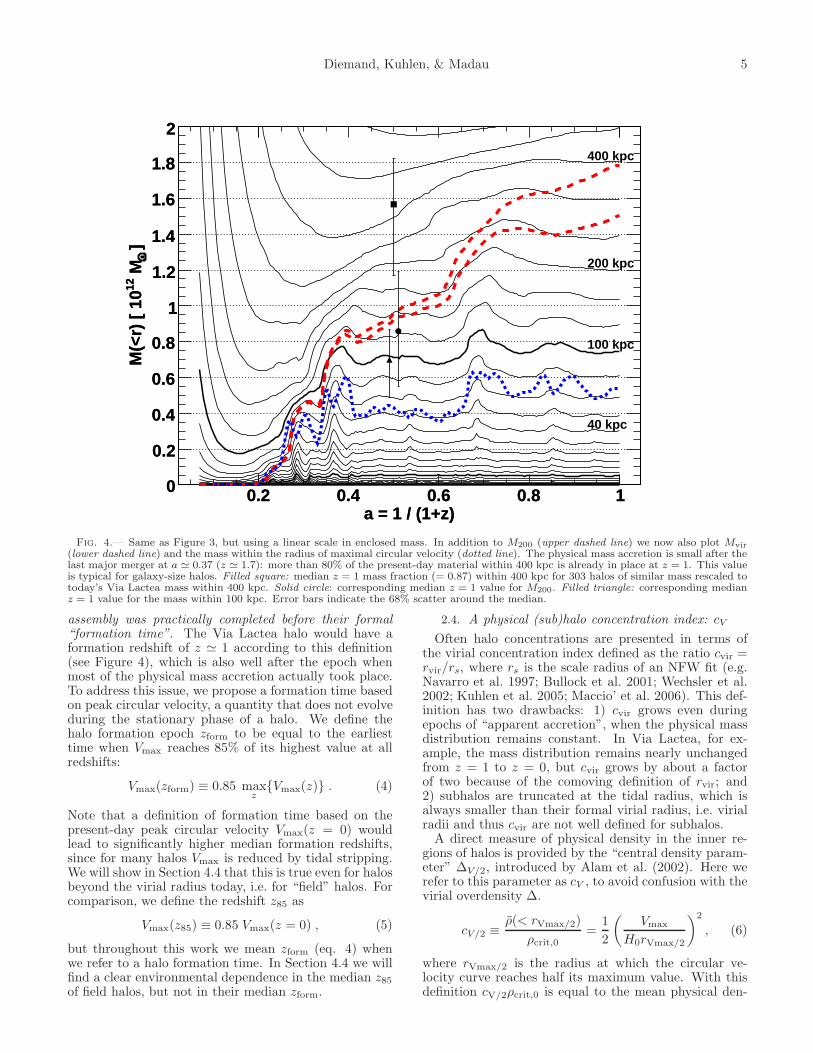
To understand the mass accretion history of the ViaLactea halo we now analyze the evolution of mass withinfixed physical radii. Figure 3 shows that the mass withinall radii from the resolution limit of ≃1 kpc up to 100 kpcgrows during a series of major mergers before a = 0.4.After this phase of active merging and mass accretion theentire system is almost perfectly stationary at all radii.The small decrease in density on scales below 1 kpc islikely an artifact of time-steps which are too large com-pared to the short dynamical time in these inner regions(Paper I). A similar decrease in density in the inner re-gions of halos was shown to be caused by too large timesteps in the convergence tests of Fukushige et al (2004;see their Figure 9). Only the outer regions (∼ 400 kpc)experience a small amount of mass accretion after thelast major merger, better visible in the linear mass scaleof Figure 4. The mass within 400 kpc increases onlymildly, by a factor of 1.2 from z = 1 to the present. Dur-ing the same time the mass within radii of 100 kpc andsmaller, the peak circular velocity, Vmax, and the radiuswhere it is reached, rVmax, all remain constant to within10%. The lack of evolution in the inner density profile,and therefore also in Vmax, rVmax and ρ(< rVmax), dur-ing this major merger-free phase agrees with the findingsof previous studies (e.g. Wechsler et al. 2002; Zhao et al.2003; Romano-Diaz et al. 2006).
The physical assembly of galaxy halos thus appears tooccur mainly during an active early phase of major merg-ers, in which the halo peak circular velocity (and the en-closed mass at all radii) grows to its maximum value.In contrast to previous work on this subject (Wechsleret al. 2002; Zhao et al. 2003), we do not find evidencefor much mass growth during the late “slow accretion”phase, when the definition of halo mass is based on phys-ical instead of comoving scales. Rather, the mass dis-tribution and peak circular velocity appear to remainconstant for the majority of the halo’s lifetime. The factthat mass definitions inspired by spherical top-hat fail toaccurately describe the real assembly of galaxy halos isclearly seen in Figure 4, where M200 and Mvir are shownto increase even when the halo physical mass remainsthe same. This is just an artificial effect caused by thegrowing radial windows rvir and r200 as the backgrounddensity decreases. For Via Lactea M200 increases by afactor of 1.8 from z = 1 to the present, while the realphysical mass within a 400 kpc sphere grows by only afactor of 1.2 during the same time interval, and by aneven smaller factor at smaller radii.
We find that the small physical accretion since z = 1seen in Via Lactea is indeed typical of galaxy halos. In a45 Mpc periodic box resolved with 3003 particles of mass1.2× 108 M⊙ (simulated in a 3-year WMAP cosmology),we have identified 303 galaxy halos at z = 0 with M200
ranging from 0.6 × 10¹² M⊙ to 5.4 × 10¹² M⊙. The masswithin a constant physical radius of 400 kpc grows bya factor of 1.15+0.39
−0.16 (the errors indicate the 68% rangearound the median) since z = 1 (“physical accretion”),whereas M200 grows by a factor of 2.10+1.17
−0.59 (“apparentaccretion”). For lower mass halos the physical accretion
is even smaller. In the same 45 Mpc box we find 714 haloswith M200 ranging from 1.5 × 10¹¹ M⊙ to 4.5 × 10¹¹ M⊙
today. From z = 1 to the present their mass within200 kpc (∼ r200 at z = 0) grows by a factor of only1.12+0.26
−0.17, whereas M200 increases by 1.85+0.96−0.40. Physical
and apparent accretion are correlated, but with a largescatter.
Within the inner 20 kpc, i.e. where the galaxy is ex-pected to lie, the gravitational potential remains con-stant during the late, quiescent phases of halo formation(Figure 3). Unless there is an evolving, dominant bary-onic mass contribution, the rotation rate of the galacticdisk should not evolve in time, with a peak circular ve-locity that may be proportional to the constant peak cir-cular velocity of its halo. Assumptions sometimes madein semi-analytic models about evolution of galaxy prop-erties with halo virial quantities (e.g. stellar mass withMvir) will produce inaccurate results, considering the dif-ferent length scales and the lack of physical accretionboth on small and large scales. Models based on quan-tities that do remain constant during stationary phases,like peak circular velocity and the corresponding radiusand enclosed mass, may be more physical. Observationsof representative samples of z = 1 galaxies, includingkinematics, are now becoming available (e.g. Weiner etal. 2006; Kassin et al. 2007) and it might be possible totest whether galaxy radii and masses grow like the halovirial scales (i.e. by about a factor of two) or if they re-main constant like the halo mass distribution on physicalscales.
2.3. Formation times
As discussed above, the common spherical top-hat in-spired halo mass definitions M200 and Mvir are not wellsuited to describe the growth of galaxy halos. Careshould also be used when the complex and extended pro-cess of halo formation is quantified with a single number,the so called “halo formation time”. Many of the ex-isting definitions are based on the evolution of M200 orMvir (e.g. Wechsler et al. 2002; Zhao et al. 2003; Gao etal. 2005). For galaxy halos such formation times dependalmost exclusively on the amount of apparent accretion5 , which dominates the evolution of M200 and Mvir formore than half of the age of the universe and, in manycases, contributes more than half of the total “accreted”mass. Since apparent accretion correlates only weaklywith physical halo growth, it is unclear how and if haloformation times calculated in this manner do relate tothe epoch when most of the physical halo assembly tookplace. Our analysis also casts doubt on whether such for-mation times are at all related to the relevant timescalesfor galaxy formation.
Consider, as an example, the widely used definitionof formation time as the time when M200 (or similarlythe FOF mass based on a comoving linking length of 0.2times the mean particle separations) reaches half of thepresent value. More than half of our large, low-resolutionsample of galaxy-size halos would form after z = 1 ac-cording to this definition, yet their physical mass accre-tion is less than 20% over this time span; their mass
5 The amount of apparent accretion depends on how much masslies in the outer halo, i.e. it is larger for halos with low concentra-tions.
Diemand, Kuhlen, & Madau 5
a = 1 / (1+z)0.2 0.4 0.6 0.8 1
] M
12M
(<r)
[ 1
0
0
0.2
0.4
0.6
0.8
1
1.2
1.4
1.6
1.8
2
a = 1 / (1+z)0.2 0.4 0.6 0.8 1
] M
12M
(<r)
[ 1
0
0
0.2
0.4
0.6
0.8
1
1.2
1.4
1.6
1.8
2
40 kpc
100 kpc
200 kpc
400 kpc
Fig. 4.— Same as Figure 3, but using a linear scale in enclosed mass. In addition to M200 (upper dashed line) we now also plot Mvir
(lower dashed line) and the mass within the radius of maximal circular velocity (dotted line). The physical mass accretion is small after thelast major merger at a ≃ 0.37 (z ≃ 1.7): more than 80% of the present-day material within 400 kpc is already in place at z = 1. This valueis typical for galaxy-size halos. Filled square: median z = 1 mass fraction (= 0.87) within 400 kpc for 303 halos of similar mass rescaled totoday’s Via Lactea mass within 400 kpc. Solid circle: corresponding median z = 1 value for M200. Filled triangle: corresponding medianz = 1 value for the mass within 100 kpc. Error bars indicate the 68% scatter around the median.
assembly was practically completed before their formal“formation time”. The Via Lactea halo would have aformation redshift of z ≃ 1 according to this definition(see Figure 4), which is also well after the epoch whenmost of the physical mass accretion actually took place.To address this issue, we propose a formation time basedon peak circular velocity, a quantity that does not evolveduring the stationary phase of a halo. We define thehalo formation epoch zform to be equal to the earliesttime when Vmax reaches 85% of its highest value at allredshifts:
Vmax(zform) ≡ 0.85 maxz
Vmax(z) . (4)
Note that a definition of formation time based on thepresent-day peak circular velocity Vmax(z = 0) wouldlead to significantly higher median formation redshifts,since for many halos Vmax is reduced by tidal stripping.We will show in Section 4.4 that this is true even for halosbeyond the virial radius today, i.e. for “field” halos. Forcomparison, we define the redshift z85 as
Vmax(z85) ≡ 0.85 Vmax(z = 0) , (5)
but throughout this work we mean zform (eq. 4) whenwe refer to a halo formation time. In Section 4.4 we willfind a clear environmental dependence in the median z85
of field halos, but not in their median zform.
2.4. A physical (sub)halo concentration index: cV
Often halo concentrations are presented in terms ofthe virial concentration index defined as the ratio cvir =rvir/rs, where rs is the scale radius of an NFW fit (e.g.Navarro et al. 1997; Bullock et al. 2001; Wechsler et al.2002; Kuhlen et al. 2005; Maccio’ et al. 2006). This def-inition has two drawbacks: 1) cvir grows even duringepochs of “apparent accretion”, when the physical massdistribution remains constant. In Via Lactea, for ex-ample, the mass distribution remains nearly unchangedfrom z = 1 to z = 0, but cvir grows by about a factorof two because of the comoving definition of rvir; and2) subhalos are truncated at the tidal radius, which isalways smaller than their formal virial radius, i.e. virialradii and thus cvir are not well defined for subhalos.
A direct measure of physical density in the inner re-gions of halos is provided by the “central density param-eter” ∆V/2, introduced by Alam et al. (2002). Here werefer to this parameter as cV , to avoid confusion with thevirial overdensity ∆.
cV/2 ≡ ρ(< rVmax/2)
ρcrit,0=
1
2
(
Vmax
H0rVmax/2
)2
, (6)
where rVmax/2 is the radius at which the circular ve-locity curve reaches half its maximum value. With thisdefinition cV/2ρcrit,0 is equal to the mean physical den-
6 Evolution of ΛCDM halos and their substructure
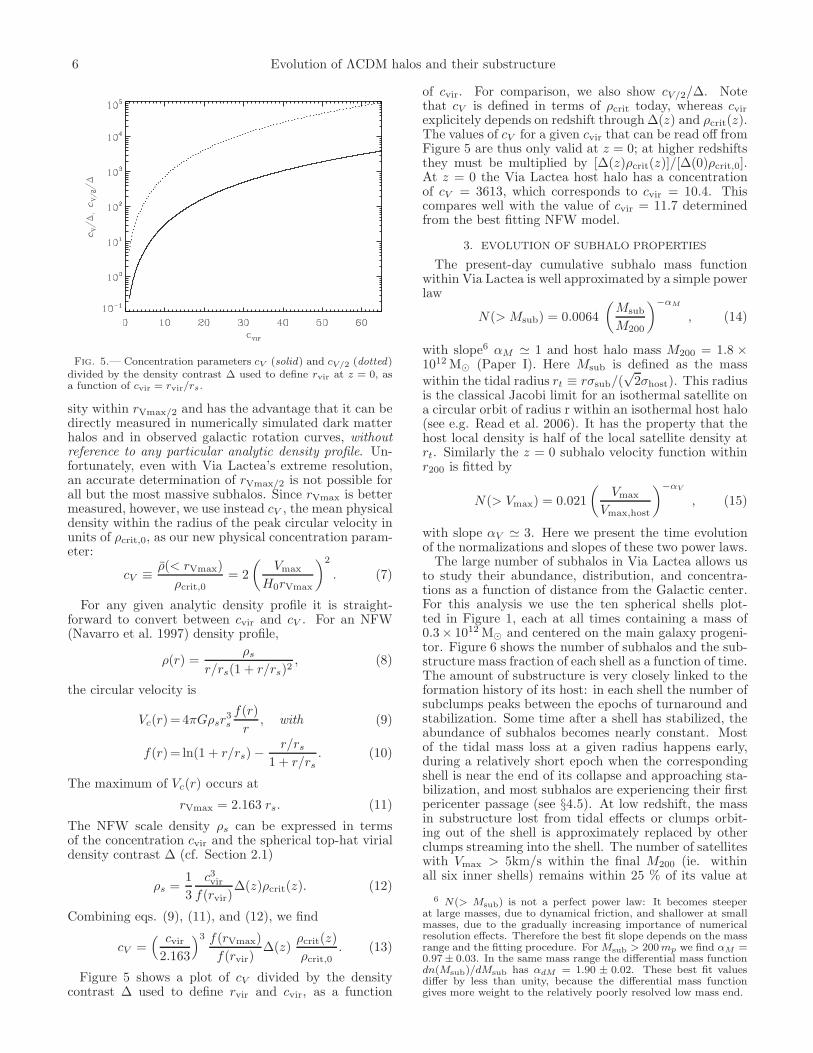
Fig. 5.— Concentration parameters cV (solid) and cV/2 (dotted)divided by the density contrast ∆ used to define rvir at z = 0, asa function of cvir = rvir/rs.
sity within rVmax/2 and has the advantage that it can bedirectly measured in numerically simulated dark matterhalos and in observed galactic rotation curves, withoutreference to any particular analytic density profile. Un-fortunately, even with Via Lactea’s extreme resolution,an accurate determination of rVmax/2 is not possible forall but the most massive subhalos. Since rVmax is bettermeasured, however, we use instead cV , the mean physicaldensity within the radius of the peak circular velocity inunits of ρcrit,0, as our new physical concentration param-eter:
cV ≡ ρ(< rVmax)
ρcrit,0= 2
(
Vmax
H0rVmax
)2
. (7)
For any given analytic density profile it is straight-forward to convert between cvir and cV . For an NFW(Navarro et al. 1997) density profile,
ρ(r) =ρs
r/rs(1 + r/rs)2, (8)
the circular velocity is
Vc(r) = 4πGρsr3s
f(r)
r, with (9)
f(r) = ln(1 + r/rs) − r/rs
1 + r/rs. (10)
The maximum of Vc(r) occurs at
rVmax = 2.163 rs. (11)
The NFW scale density ρs can be expressed in termsof the concentration cvir and the spherical top-hat virialdensity contrast ∆ (cf. Section 2.1)
ρs =1
3
c3vir
f(rvir)∆(z)ρcrit(z). (12)
Combining eqs. (9), (11), and (12), we find
cV =( cvir
2.163
)3 f(rVmax)
f(rvir)∆(z)
ρcrit(z)
ρcrit,0. (13)
Figure 5 shows a plot of cV divided by the densitycontrast ∆ used to define rvir and cvir, as a function
of cvir. For comparison, we also show cV/2/∆. Notethat cV is defined in terms of ρcrit today, whereas cvir
explicitely depends on redshift through ∆(z) and ρcrit(z).The values of cV for a given cvir that can be read off fromFigure 5 are thus only valid at z = 0; at higher redshiftsthey must be multiplied by [∆(z)ρcrit(z)]/[∆(0)ρcrit,0].At z = 0 the Via Lactea host halo has a concentrationof cV = 3613, which corresponds to cvir = 10.4. Thiscompares well with the value of cvir = 11.7 determinedfrom the best fitting NFW model.
3. EVOLUTION OF SUBHALO PROPERTIES
The present-day cumulative subhalo mass functionwithin Via Lactea is well approximated by a simple powerlaw
N(> Msub) = 0.0064
(
Msub
M200
)−αM
, (14)
with slope6 αM ≃ 1 and host halo mass M200 = 1.8 ×10¹² M⊙ (Paper I). Here Msub is defined as the mass
within the tidal radius rt ≡ rσsub/(√
2σhost). This radiusis the classical Jacobi limit for an isothermal satellite ona circular orbit of radius r within an isothermal host halo(see e.g. Read et al. 2006). It has the property that thehost local density is half of the local satellite density atrt. Similarly the z = 0 subhalo velocity function withinr200 is fitted by
N(> Vmax) = 0.021
(
Vmax
Vmax,host
)−αV
, (15)
with slope αV ≃ 3. Here we present the time evolutionof the normalizations and slopes of these two power laws.
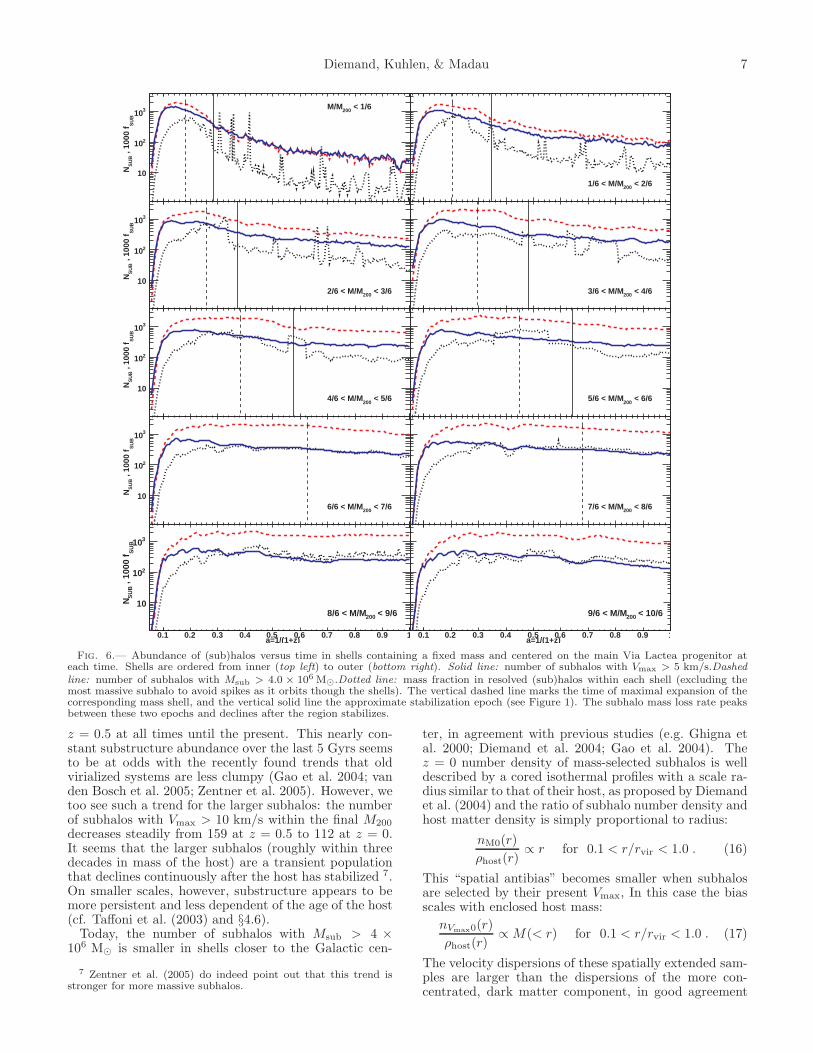
The large number of subhalos in Via Lactea allows usto study their abundance, distribution, and concentra-tions as a function of distance from the Galactic center.For this analysis we use the ten spherical shells plot-ted in Figure 1, each at all times containing a mass of0.3× 1012 M⊙ and centered on the main galaxy progeni-tor. Figure 6 shows the number of subhalos and the sub-structure mass fraction of each shell as a function of time.The amount of substructure is very closely linked to theformation history of its host: in each shell the number ofsubclumps peaks between the epochs of turnaround andstabilization. Some time after a shell has stabilized, theabundance of subhalos becomes nearly constant. Mostof the tidal mass loss at a given radius happens early,during a relatively short epoch when the correspondingshell is near the end of its collapse and approaching sta-bilization, and most subhalos are experiencing their firstpericenter passage (see §4.5). At low redshift, the massin substructure lost from tidal effects or clumps orbit-ing out of the shell is approximately replaced by otherclumps streaming into the shell. The number of satelliteswith Vmax > 5km/s within the final M200 (ie. withinall six inner shells) remains within 25 % of its value at
6 N(> Msub) is not a perfect power law: It becomes steeperat large masses, due to dynamical friction, and shallower at smallmasses, due to the gradually increasing importance of numericalresolution effects. Therefore the best fit slope depends on the massrange and the fitting procedure. For Msub > 200 mp we find αM =0.97 ± 0.03. In the same mass range the differential mass functiondn(Msub)/dMsub has αdM = 1.90 ± 0.02. These best fit valuesdiffer by less than unity, because the differential mass functiongives more weight to the relatively poorly resolved low mass end.
Diemand, Kuhlen, & Madau 7
0.1 0.2 0.3 0.4 0.5 0.6 0.7 0.8 0.9 1
SU
B ,
1000
fS
UB
N 10
210
310 < 1/6200M/M
0.1 0.2 0.3 0.4 0.5 0.6 0.7 0.8 0.9 1
SU
B ,
1000
fS
UB
N 10
210
310
< 3/62002/6 < M/M
0.1 0.2 0.3 0.4 0.5 0.6 0.7 0.8 0.9 1
SU
B ,
1000
fS
UB
N 10
210
310
< 5/6200
4/6 < M/M
0.1 0.2 0.3 0.4 0.5 0.6 0.7 0.8 0.9 1
SU
B ,
1000
fS
UB
N 10
210
310
< 7/62006/6 < M/M
a=1/(1+z)0.1 0.2 0.3 0.4 0.5 0.6 0.7 0.8 0.9 1
SU
B ,
1000
fS
UB
N 10
210
310
< 9/62008/6 < M/M
0.1 0.2 0.3 0.4 0.5 0.6 0.7 0.8 0.9 1
10 < 2/62001/6 < M/M
0.1 0.2 0.3 0.4 0.5 0.6 0.7 0.8 0.9 1
10 < 4/62003/6 < M/M
0.1 0.2 0.3 0.4 0.5 0.6 0.7 0.8 0.9 1
10 < 6/6
2005/6 < M/M
0.1 0.2 0.3 0.4 0.5 0.6 0.7 0.8 0.9 1
10 < 8/62007/6 < M/M
a=1/(1+z)0.1 0.2 0.3 0.4 0.5 0.6 0.7 0.8 0.9 1
10 < 10/62009/6 < M/M
Fig. 6.— Abundance of (sub)halos versus time in shells containing a fixed mass and centered on the main Via Lactea progenitor ateach time. Shells are ordered from inner (top left) to outer (bottom right). Solid line: number of subhalos with Vmax > 5 km/s.Dashed
line: number of subhalos with Msub > 4.0 × 10⁶ M⊙.Dotted line: mass fraction in resolved (sub)halos within each shell (excluding themost massive subhalo to avoid spikes as it orbits though the shells). The vertical dashed line marks the time of maximal expansion of thecorresponding mass shell, and the vertical solid line the approximate stabilization epoch (see Figure 1). The subhalo mass loss rate peaksbetween these two epochs and declines after the region stabilizes.
z = 0.5 at all times until the present. This nearly con-stant substructure abundance over the last 5 Gyrs seemsto be at odds with the recently found trends that oldvirialized systems are less clumpy (Gao et al. 2004; vanden Bosch et al. 2005; Zentner et al. 2005). However, wetoo see such a trend for the larger subhalos: the numberof subhalos with Vmax > 10 km/s within the final M200
decreases steadily from 159 at z = 0.5 to 112 at z = 0.It seems that the larger subhalos (roughly within threedecades in mass of the host) are a transient populationthat declines continuously after the host has stabilized 7.On smaller scales, however, substructure appears to bemore persistent and less dependent of the age of the host(cf. Taffoni et al. (2003) and §4.6).
Today, the number of subhalos with Msub > 4 ×10⁶ M⊙ is smaller in shells closer to the Galactic cen-
7 Zentner et al. (2005) do indeed point out that this trend isstronger for more massive subhalos.
ter, in agreement with previous studies (e.g. Ghigna etal. 2000; Diemand et al. 2004; Gao et al. 2004). Thez = 0 number density of mass-selected subhalos is welldescribed by a cored isothermal profiles with a scale ra-dius similar to that of their host, as proposed by Diemandet al. (2004) and the ratio of subhalo number density andhost matter density is simply proportional to radius:
nM0(r)
ρhost(r)∝ r for 0.1 < r/rvir < 1.0 . (16)
This “spatial antibias” becomes smaller when subhalosare selected by their present Vmax, In this case the biasscales with enclosed host mass:
nVmax0(r)
ρhost(r)∝ M(< r) for 0.1 < r/rvir < 1.0 . (17)
The velocity dispersions of these spatially extended sam-ples are larger than the dispersions of the more con-centrated, dark matter component, in good agreement
8 Evolution of ΛCDM halos and their substructure
0.1 0.2 0.3 0.4 0.5 0.6 0.7 0.8 0.9 1
Vα
Mα 1
< 1/6200M/M
.8
2
3
4
0.893 0.923
2.565 2.687
0.1 0.2 0.3 0.4 0.5 0.6 0.7 0.8 0.9 1
Vα
Mα 1
< 3/62002/6 < M/M
.8
2
3
4
0.938 0.971
2.645 2.943
0.1 0.2 0.3 0.4 0.5 0.6 0.7 0.8 0.9 1
Vα
Mα 1
< 5/6200
4/6 < M/M
.8
2
3
4
0.950 0.973
2.901 3.100
0.1 0.2 0.3 0.4 0.5 0.6 0.7 0.8 0.9 1
Vα
Mα 1
< 7/62006/6 < M/M
.8
2
3
4
0.950
2.912
a=1/(1+z)0.1 0.2 0.3 0.4 0.5 0.6 0.7 0.8 0.9 1
Vα
Mα 1
< 9/62008/6 < M/M
.8
2
3
4
0.1 0.2 0.3 0.4 0.5 0.6 0.7 0.8 0.9 1
1
< 2/62001/6 < M/M
0.919 0.951
2.674 2.858
0.1 0.2 0.3 0.4 0.5 0.6 0.7 0.8 0.9 1
1
< 4/62003/6 < M/M
0.955 0.957
2.767 2.911
0.1 0.2 0.3 0.4 0.5 0.6 0.7 0.8 0.9 1
1
< 6/6200
5/6 < M/M
0.932 0.968
2.895 3.092
0.1 0.2 0.3 0.4 0.5 0.6 0.7 0.8 0.9 1
1
< 8/62007/6 < M/M
0.872
2.688
a=1/(1+z)0.1 0.2 0.3 0.4 0.5 0.6 0.7 0.8 0.9 1
1
< 10/62009/6 < M/M
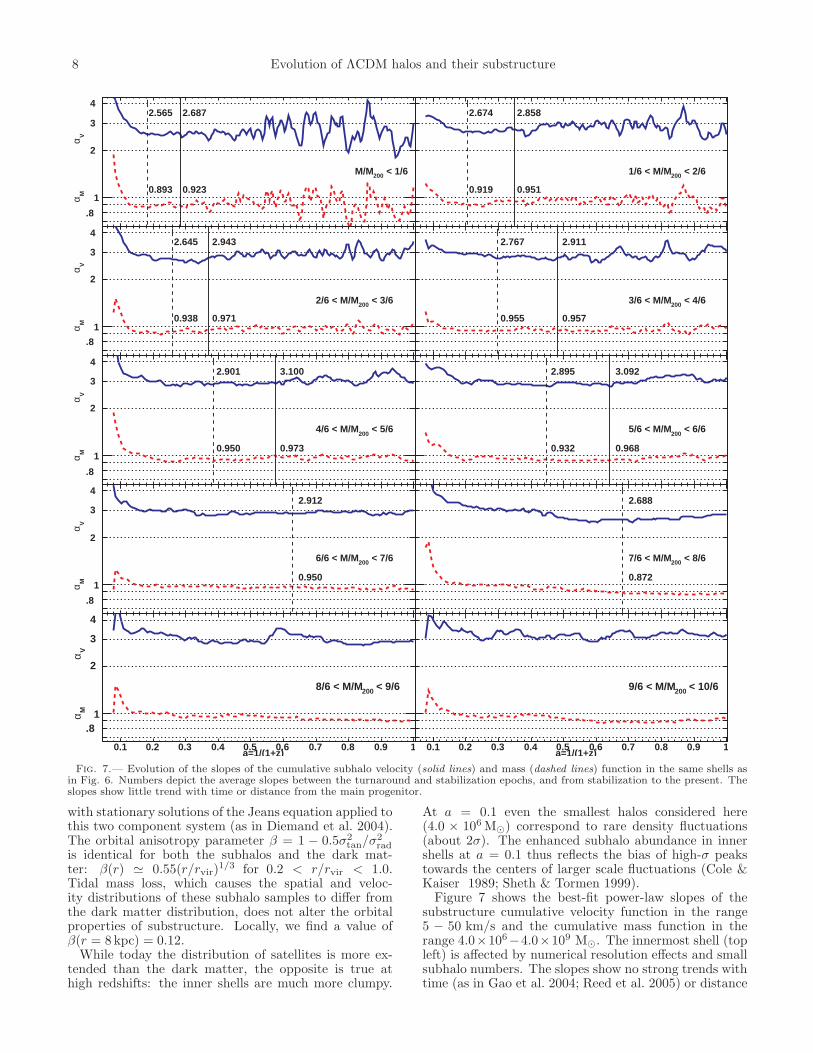
Fig. 7.— Evolution of the slopes of the cumulative subhalo velocity (solid lines) and mass (dashed lines) function in the same shells asin Fig. 6. Numbers depict the average slopes between the turnaround and stabilization epochs, and from stabilization to the present. Theslopes show little trend with time or distance from the main progenitor.
with stationary solutions of the Jeans equation applied tothis two component system (as in Diemand et al. 2004).The orbital anisotropy parameter β = 1 − 0.5σ2
tan/σ2rad
is identical for both the subhalos and the dark mat-ter: β(r) ≃ 0.55(r/rvir)
1/3 for 0.2 < r/rvir < 1.0.Tidal mass loss, which causes the spatial and veloc-ity distributions of these subhalo samples to differ fromthe dark matter distribution, does not alter the orbitalproperties of substructure. Locally, we find a value ofβ(r = 8 kpc) = 0.12.
While today the distribution of satellites is more ex-tended than the dark matter, the opposite is true athigh redshifts: the inner shells are much more clumpy.
At a = 0.1 even the smallest halos considered here(4.0 × 10⁶ M⊙) correspond to rare density fluctuations(about 2σ). The enhanced subhalo abundance in innershells at a = 0.1 thus reflects the bias of high-σ peakstowards the centers of larger scale fluctuations (Cole &Kaiser 1989; Sheth & Tormen 1999).
Figure 7 shows the best-fit power-law slopes of thesubstructure cumulative velocity function in the range5 − 50 km/s and the cumulative mass function in therange 4.0×10⁶−4.0×10⁹ M⊙. The innermost shell (topleft) is affected by numerical resolution effects and smallsubhalo numbers. The slopes show no strong trends withtime (as in Gao et al. 2004; Reed et al. 2005) or distance
Diemand, Kuhlen, & Madau 9
0.1 0.2 0.3 0.4 0.5 0.6 0.7 0.8 0.9 1
Vc
410
510
< 1/6200M/M
0.1 0.2 0.3 0.4 0.5 0.6 0.7 0.8 0.9 1
Vc
410
510
< 3/6200
2/6 < M/M
0.1 0.2 0.3 0.4 0.5 0.6 0.7 0.8 0.9 1
Vc
410
510 < 5/62004/6 < M/M
0.1 0.2 0.3 0.4 0.5 0.6 0.7 0.8 0.9 1
Vc
410
510 < 7/6200
6/6 < M/M
a=1/(1+z)0.1 0.2 0.3 0.4 0.5 0.6 0.7 0.8 0.9 1
Vc
410
510 < 9/62008/6 < M/M
0.1 0.2 0.3 0.4 0.5 0.6 0.7 0.8 0.9 1
< 2/62001/6 < M/M
0.1 0.2 0.3 0.4 0.5 0.6 0.7 0.8 0.9 1
< 4/6200
3/6 < M/M
0.1 0.2 0.3 0.4 0.5 0.6 0.7 0.8 0.9 1
< 6/62005/6 < M/M
0.1 0.2 0.3 0.4 0.5 0.6 0.7 0.8 0.9 1
< 8/6200
7/6 < M/M
a=1/(1+z)0.1 0.2 0.3 0.4 0.5 0.6 0.7 0.8 0.9 1
< 10/62009/6 < M/M
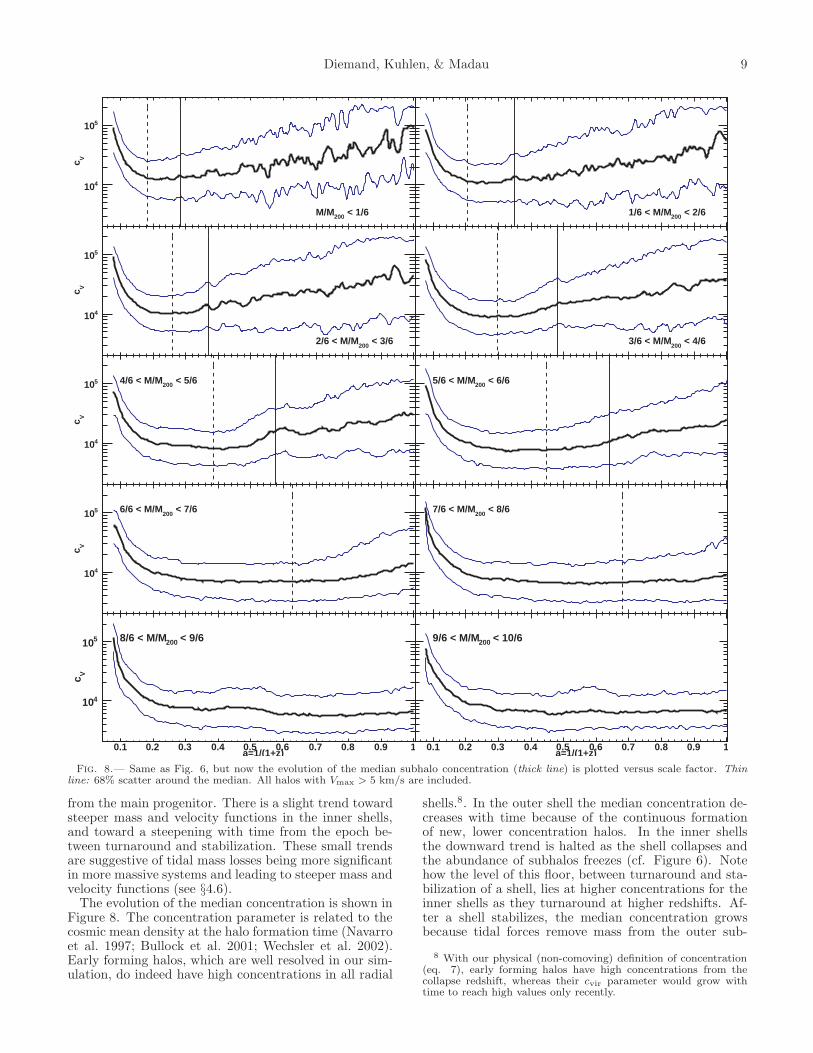
Fig. 8.— Same as Fig. 6, but now the evolution of the median subhalo concentration (thick line) is plotted versus scale factor. Thinline: 68% scatter around the median. All halos with Vmax > 5 km/s are included.
from the main progenitor. There is a slight trend towardsteeper mass and velocity functions in the inner shells,and toward a steepening with time from the epoch be-tween turnaround and stabilization. These small trendsare suggestive of tidal mass losses being more significantin more massive systems and leading to steeper mass andvelocity functions (see §4.6).
The evolution of the median concentration is shown inFigure 8. The concentration parameter is related to thecosmic mean density at the halo formation time (Navarroet al. 1997; Bullock et al. 2001; Wechsler et al. 2002).Early forming halos, which are well resolved in our sim-ulation, do indeed have high concentrations in all radial
shells.8. In the outer shell the median concentration de-creases with time because of the continuous formationof new, lower concentration halos. In the inner shellsthe downward trend is halted as the shell collapses andthe abundance of subhalos freezes (cf. Figure 6). Notehow the level of this floor, between turnaround and sta-bilization of a shell, lies at higher concentrations for theinner shells as they turnaround at higher redshifts. Af-ter a shell stabilizes, the median concentration growsbecause tidal forces remove mass from the outer sub-
8 With our physical (non-comoving) definition of concentration(eq. 7), early forming halos have high concentrations from thecollapse redshift, whereas their cvir parameter would grow withtime to reach high values only recently.
10 Evolution of ΛCDM halos and their substructure
r [kpc]10 210 310
Vc
410
510
610
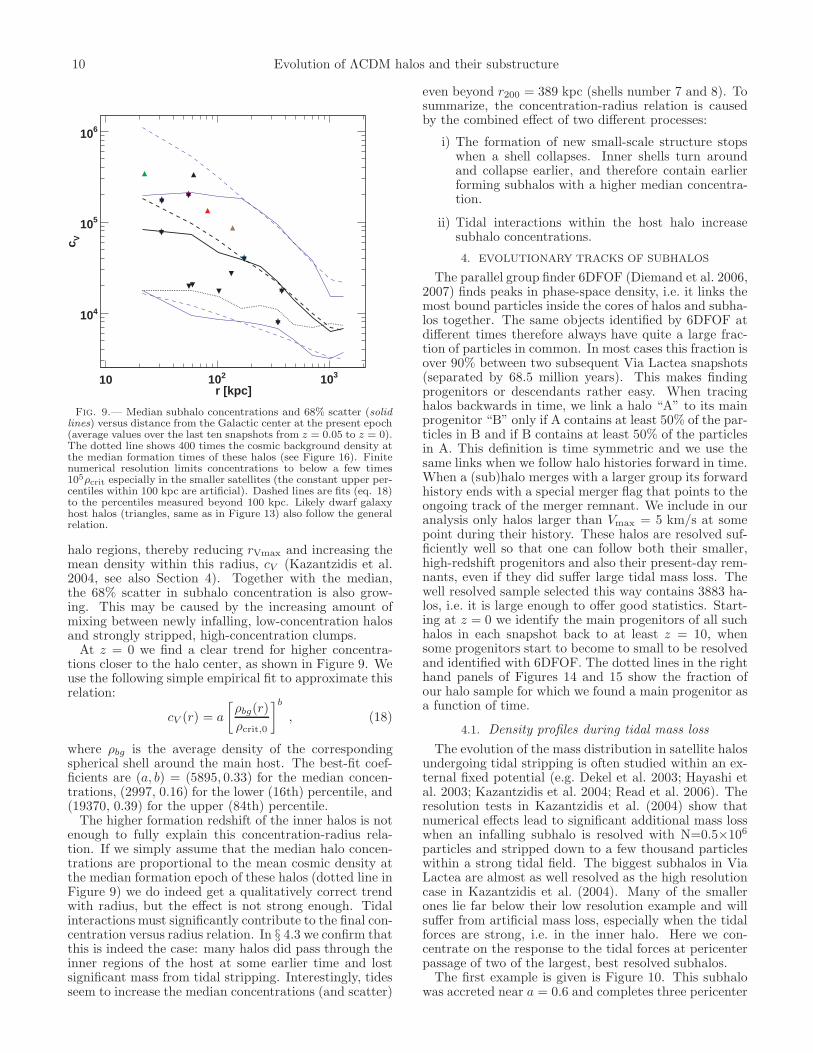
Fig. 9.— Median subhalo concentrations and 68% scatter (solidlines) versus distance from the Galactic center at the present epoch(average values over the last ten snapshots from z = 0.05 to z = 0).The dotted line shows 400 times the cosmic background density atthe median formation times of these halos (see Figure 16). Finitenumerical resolution limits concentrations to below a few times105ρcrit especially in the smaller satellites (the constant upper per-centiles within 100 kpc are artificial). Dashed lines are fits (eq. 18)to the percentiles measured beyond 100 kpc. Likely dwarf galaxyhost halos (triangles, same as in Figure 13) also follow the generalrelation.
halo regions, thereby reducing rVmax and increasing themean density within this radius, cV (Kazantzidis et al.2004, see also Section 4). Together with the median,the 68% scatter in subhalo concentration is also grow-ing. This may be caused by the increasing amount ofmixing between newly infalling, low-concentration halosand strongly stripped, high-concentration clumps.
At z = 0 we find a clear trend for higher concentra-tions closer to the halo center, as shown in Figure 9. Weuse the following simple empirical fit to approximate thisrelation:
cV (r) = a
[
ρbg(r)
ρcrit,0
]b
, (18)
where ρbg is the average density of the correspondingspherical shell around the main host. The best-fit coef-ficients are (a, b) = (5895, 0.33) for the median concen-trations, (2997, 0.16) for the lower (16th) percentile, and(19370, 0.39) for the upper (84th) percentile.
The higher formation redshift of the inner halos is notenough to fully explain this concentration-radius rela-tion. If we simply assume that the median halo concen-trations are proportional to the mean cosmic density atthe median formation epoch of these halos (dotted line inFigure 9) we do indeed get a qualitatively correct trendwith radius, but the effect is not strong enough. Tidalinteractions must significantly contribute to the final con-centration versus radius relation. In § 4.3 we confirm thatthis is indeed the case: many halos did pass through theinner regions of the host at some earlier time and lostsignificant mass from tidal stripping. Interestingly, tidesseem to increase the median concentrations (and scatter)
even beyond r200 = 389 kpc (shells number 7 and 8). Tosummarize, the concentration-radius relation is causedby the combined effect of two different processes:
i) The formation of new small-scale structure stopswhen a shell collapses. Inner shells turn aroundand collapse earlier, and therefore contain earlierforming subhalos with a higher median concentra-tion.
ii) Tidal interactions within the host halo increasesubhalo concentrations.
4. EVOLUTIONARY TRACKS OF SUBHALOS
The parallel group finder 6DFOF (Diemand et al. 2006,2007) finds peaks in phase-space density, i.e. it links themost bound particles inside the cores of halos and subha-los together. The same objects identified by 6DFOF atdifferent times therefore always have quite a large frac-tion of particles in common. In most cases this fraction isover 90% between two subsequent Via Lactea snapshots(separated by 68.5 million years). This makes findingprogenitors or descendants rather easy. When tracinghalos backwards in time, we link a halo “A” to its mainprogenitor “B” only if A contains at least 50% of the par-ticles in B and if B contains at least 50% of the particlesin A. This definition is time symmetric and we use thesame links when we follow halo histories forward in time.When a (sub)halo merges with a larger group its forwardhistory ends with a special merger flag that points to theongoing track of the merger remnant. We include in ouranalysis only halos larger than Vmax = 5 km/s at somepoint during their history. These halos are resolved suf-ficiently well so that one can follow both their smaller,high-redshift progenitors and also their present-day rem-nants, even if they did suffer large tidal mass loss. Thewell resolved sample selected this way contains 3883 ha-los, i.e. it is large enough to offer good statistics. Start-ing at z = 0 we identify the main progenitors of all suchhalos in each snapshot back to at least z = 10, whensome progenitors start to become to small to be resolvedand identified with 6DFOF. The dotted lines in the righthand panels of Figures 14 and 15 show the fraction ofour halo sample for which we found a main progenitor asa function of time.
4.1. Density profiles during tidal mass loss
The evolution of the mass distribution in satellite halosundergoing tidal stripping is often studied within an ex-ternal fixed potential (e.g. Dekel et al. 2003; Hayashi etal. 2003; Kazantzidis et al. 2004; Read et al. 2006). Theresolution tests in Kazantzidis et al. (2004) show thatnumerical effects lead to significant additional mass losswhen an infalling subhalo is resolved with N=0.5×10⁶
particles and stripped down to a few thousand particleswithin a strong tidal field. The biggest subhalos in ViaLactea are almost as well resolved as the high resolutioncase in Kazantzidis et al. (2004). Many of the smallerones lie far below their low resolution example and willsuffer from artificial mass loss, especially when the tidalforces are strong, i.e. in the inner halo. Here we con-centrate on the response to the tidal forces at pericenterpassage of two of the largest, best resolved subhalos.
The first example is given is Figure 10. This subhalowas accreted near a = 0.6 and completes three pericenter
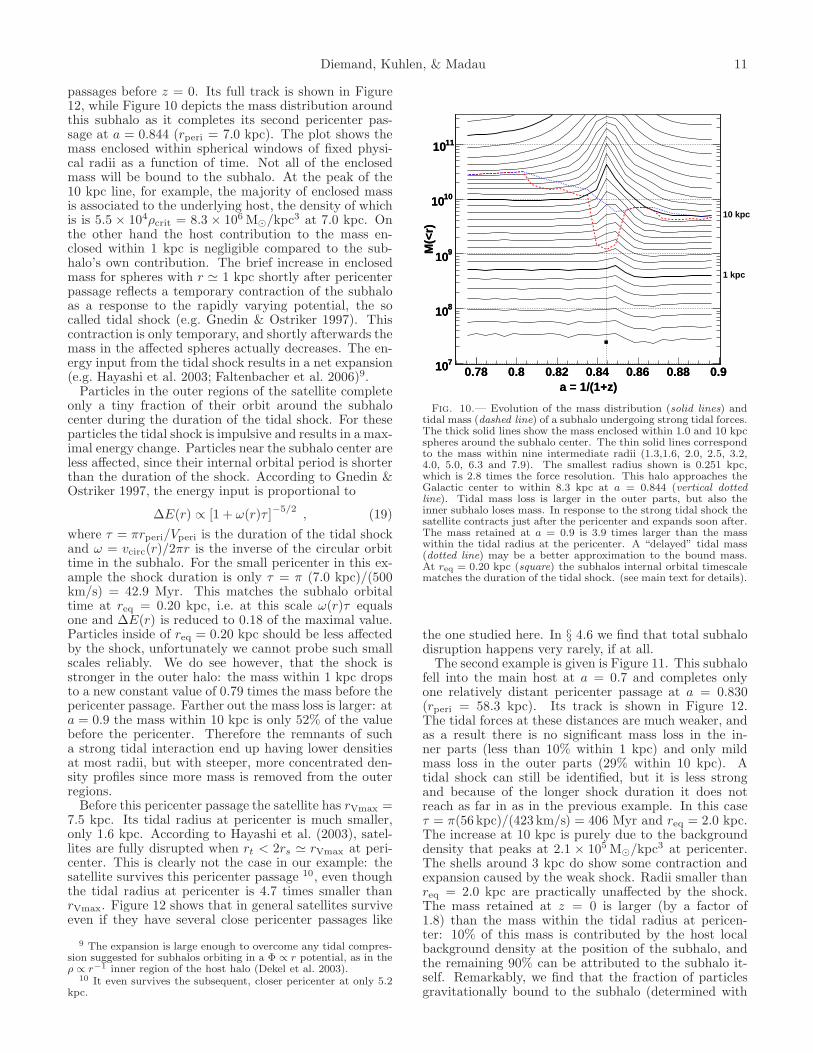
Diemand, Kuhlen, & Madau 11
passages before z = 0. Its full track is shown in Figure12, while Figure 10 depicts the mass distribution aroundthis subhalo as it completes its second pericenter pas-sage at a = 0.844 (rperi = 7.0 kpc). The plot shows themass enclosed within spherical windows of fixed physi-cal radii as a function of time. Not all of the enclosedmass will be bound to the subhalo. At the peak of the10 kpc line, for example, the majority of enclosed massis associated to the underlying host, the density of whichis is 5.5 × 10⁴ρcrit = 8.3 × 10⁶ M⊙/kpc3 at 7.0 kpc. Onthe other hand the host contribution to the mass en-closed within 1 kpc is negligible compared to the sub-halo’s own contribution. The brief increase in enclosedmass for spheres with r ≃ 1 kpc shortly after pericenterpassage reflects a temporary contraction of the subhaloas a response to the rapidly varying potential, the socalled tidal shock (e.g. Gnedin & Ostriker 1997). Thiscontraction is only temporary, and shortly afterwards themass in the affected spheres actually decreases. The en-ergy input from the tidal shock results in a net expansion(e.g. Hayashi et al. 2003; Faltenbacher et al. 2006)9.
Particles in the outer regions of the satellite completeonly a tiny fraction of their orbit around the subhalocenter during the duration of the tidal shock. For theseparticles the tidal shock is impulsive and results in a max-imal energy change. Particles near the subhalo center areless affected, since their internal orbital period is shorterthan the duration of the shock. According to Gnedin &Ostriker 1997, the energy input is proportional to
∆E(r) ∝ [1 + ω(r)τ ]−5/2
, (19)
where τ = πrperi/Vperi is the duration of the tidal shockand ω = vcirc(r)/2πr is the inverse of the circular orbittime in the subhalo. For the small pericenter in this ex-ample the shock duration is only τ = π (7.0 kpc)/(500km/s) = 42.9 Myr. This matches the subhalo orbitaltime at req = 0.20 kpc, i.e. at this scale ω(r)τ equalsone and ∆E(r) is reduced to 0.18 of the maximal value.Particles inside of req = 0.20 kpc should be less affectedby the shock, unfortunately we cannot probe such smallscales reliably. We do see however, that the shock isstronger in the outer halo: the mass within 1 kpc dropsto a new constant value of 0.79 times the mass before thepericenter passage. Farther out the mass loss is larger: ata = 0.9 the mass within 10 kpc is only 52% of the valuebefore the pericenter. Therefore the remnants of sucha strong tidal interaction end up having lower densitiesat most radii, but with steeper, more concentrated den-sity profiles since more mass is removed from the outerregions.
Before this pericenter passage the satellite has rVmax =7.5 kpc. Its tidal radius at pericenter is much smaller,only 1.6 kpc. According to Hayashi et al. (2003), satel-lites are fully disrupted when rt < 2rs ≃ rVmax at peri-center. This is clearly not the case in our example: thesatellite survives this pericenter passage 10, even thoughthe tidal radius at pericenter is 4.7 times smaller thanrVmax. Figure 12 shows that in general satellites surviveeven if they have several close pericenter passages like
9 The expansion is large enough to overcome any tidal compres-sion suggested for subhalos orbiting in a Φ ∝ r potential, as in theρ ∝ r−1 inner region of the host halo (Dekel et al. 2003).
10 It even survives the subsequent, closer pericenter at only 5.2kpc.
a = 1/(1+z)0.78 0.8 0.82 0.84 0.86 0.88 0.9
M(<
r)
710
810
910
1010
1110
a = 1/(1+z)0.78 0.8 0.82 0.84 0.86 0.88 0.9
M(<
r)
710
810
910
1010
1110
1 kpc
10 kpc
Fig. 10.— Evolution of the mass distribution (solid lines) andtidal mass (dashed line) of a subhalo undergoing strong tidal forces.The thick solid lines show the mass enclosed within 1.0 and 10 kpcspheres around the subhalo center. The thin solid lines correspondto the mass within nine intermediate radii (1.3,1.6, 2.0, 2.5, 3.2,4.0, 5.0, 6.3 and 7.9). The smallest radius shown is 0.251 kpc,which is 2.8 times the force resolution. This halo approaches theGalactic center to within 8.3 kpc at a = 0.844 (vertical dottedline). Tidal mass loss is larger in the outer parts, but also theinner subhalo loses mass. In response to the strong tidal shock thesatellite contracts just after the pericenter and expands soon after.The mass retained at a = 0.9 is 3.9 times larger than the masswithin the tidal radius at the pericenter. A “delayed” tidal mass(dotted line) may be a better approximation to the bound mass.At req = 0.20 kpc (square) the subhalos internal orbital timescalematches the duration of the tidal shock. (see main text for details).
the one studied here. In § 4.6 we find that total subhalodisruption happens very rarely, if at all.
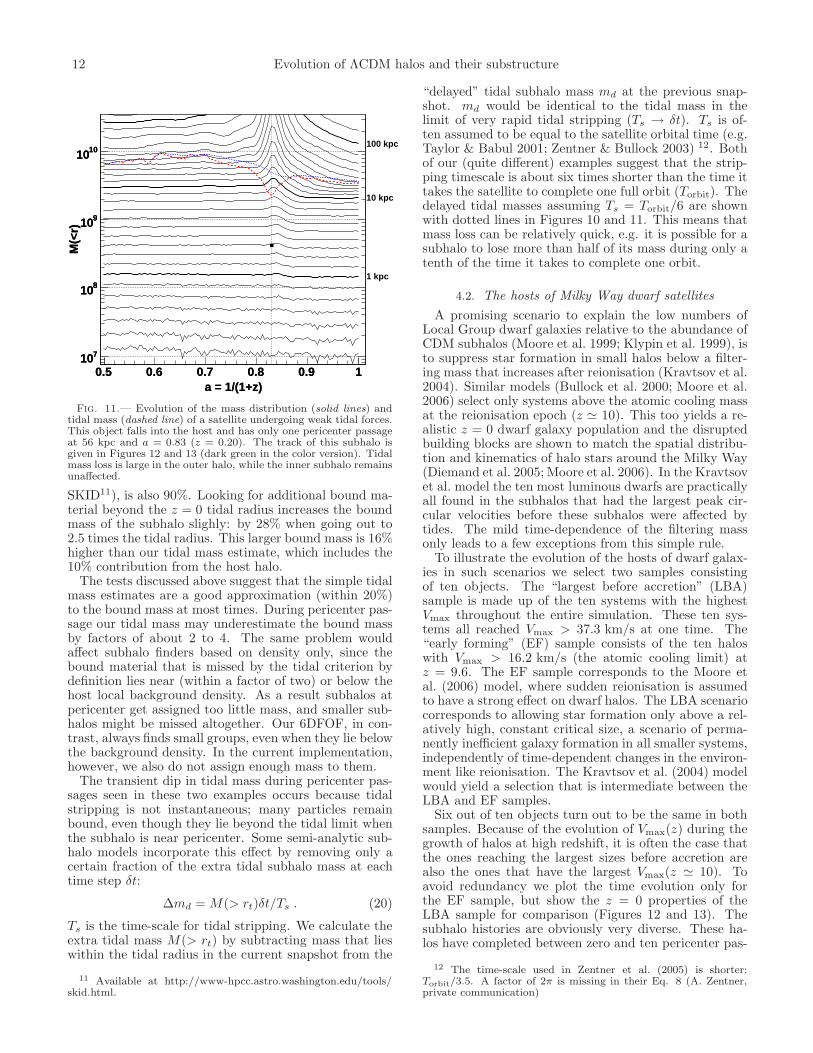
The second example is given is Figure 11. This subhalofell into the main host at a = 0.7 and completes onlyone relatively distant pericenter passage at a = 0.830(rperi = 58.3 kpc). Its track is shown in Figure 12.The tidal forces at these distances are much weaker, andas a result there is no significant mass loss in the in-ner parts (less than 10% within 1 kpc) and only mildmass loss in the outer parts (29% within 10 kpc). Atidal shock can still be identified, but it is less strongand because of the longer shock duration it does notreach as far in as in the previous example. In this caseτ = π(56 kpc)/(423 km/s) = 406 Myr and req = 2.0 kpc.The increase at 10 kpc is purely due to the backgrounddensity that peaks at 2.1 × 10⁵ M⊙/kpc3 at pericenter.The shells around 3 kpc do show some contraction andexpansion caused by the weak shock. Radii smaller thanreq = 2.0 kpc are practically unaffected by the shock.The mass retained at z = 0 is larger (by a factor of1.8) than the mass within the tidal radius at pericen-ter: 10% of this mass is contributed by the host localbackground density at the position of the subhalo, andthe remaining 90% can be attributed to the subhalo it-self. Remarkably, we find that the fraction of particlesgravitationally bound to the subhalo (determined with
12 Evolution of ΛCDM halos and their substructure
a = 1/(1+z)0.5 0.6 0.7 0.8 0.9 1
M(<
r)
710
810
910
1010
a = 1/(1+z)0.5 0.6 0.7 0.8 0.9 1
M(<
r)
710
810
910
1010
1 kpc
10 kpc
100 kpc
Fig. 11.— Evolution of the mass distribution (solid lines) andtidal mass (dashed line) of a satellite undergoing weak tidal forces.This object falls into the host and has only one pericenter passageat 56 kpc and a = 0.83 (z = 0.20). The track of this subhalo isgiven in Figures 12 and 13 (dark green in the color version). Tidalmass loss is large in the outer halo, while the inner subhalo remainsunaffected.
SKID11), is also 90%. Looking for additional bound ma-terial beyond the z = 0 tidal radius increases the boundmass of the subhalo slighly: by 28% when going out to2.5 times the tidal radius. This larger bound mass is 16%higher than our tidal mass estimate, which includes the10% contribution from the host halo.
The tests discussed above suggest that the simple tidalmass estimates are a good approximation (within 20%)to the bound mass at most times. During pericenter pas-sage our tidal mass may underestimate the bound massby factors of about 2 to 4. The same problem wouldaffect subhalo finders based on density only, since thebound material that is missed by the tidal criterion bydefinition lies near (within a factor of two) or below thehost local background density. As a result subhalos atpericenter get assigned too little mass, and smaller sub-halos might be missed altogether. Our 6DFOF, in con-trast, always finds small groups, even when they lie belowthe background density. In the current implementation,however, we also do not assign enough mass to them.
The transient dip in tidal mass during pericenter pas-sages seen in these two examples occurs because tidalstripping is not instantaneous; many particles remainbound, even though they lie beyond the tidal limit whenthe subhalo is near pericenter. Some semi-analytic sub-halo models incorporate this effect by removing only acertain fraction of the extra tidal subhalo mass at eachtime step δt:
∆md = M(> rt)δt/Ts . (20)
Ts is the time-scale for tidal stripping. We calculate theextra tidal mass M(> rt) by subtracting mass that lieswithin the tidal radius in the current snapshot from the
11 Available at http://www-hpcc.astro.washington.edu/tools/skid.html.
“delayed” tidal subhalo mass md at the previous snap-shot. md would be identical to the tidal mass in thelimit of very rapid tidal stripping (Ts → δt). Ts is of-ten assumed to be equal to the satellite orbital time (e.g.Taylor & Babul 2001; Zentner & Bullock 2003) 12. Bothof our (quite different) examples suggest that the strip-ping timescale is about six times shorter than the time ittakes the satellite to complete one full orbit (Torbit). Thedelayed tidal masses assuming Ts = Torbit/6 are shownwith dotted lines in Figures 10 and 11. This means thatmass loss can be relatively quick, e.g. it is possible for asubhalo to lose more than half of its mass during only atenth of the time it takes to complete one orbit.
4.2. The hosts of Milky Way dwarf satellites
A promising scenario to explain the low numbers ofLocal Group dwarf galaxies relative to the abundance ofCDM subhalos (Moore et al. 1999; Klypin et al. 1999), isto suppress star formation in small halos below a filter-ing mass that increases after reionisation (Kravtsov et al.2004). Similar models (Bullock et al. 2000; Moore et al.2006) select only systems above the atomic cooling massat the reionisation epoch (z ≃ 10). This too yields a re-alistic z = 0 dwarf galaxy population and the disruptedbuilding blocks are shown to match the spatial distribu-tion and kinematics of halo stars around the Milky Way(Diemand et al. 2005; Moore et al. 2006). In the Kravtsovet al. model the ten most luminous dwarfs are practicallyall found in the subhalos that had the largest peak cir-cular velocities before these subhalos were affected bytides. The mild time-dependence of the filtering massonly leads to a few exceptions from this simple rule.
To illustrate the evolution of the hosts of dwarf galax-ies in such scenarios we select two samples consistingof ten objects. The “largest before accretion” (LBA)sample is made up of the ten systems with the highestVmax throughout the entire simulation. These ten sys-tems all reached Vmax > 37.3 km/s at one time. The“early forming” (EF) sample consists of the ten haloswith Vmax > 16.2 km/s (the atomic cooling limit) atz = 9.6. The EF sample corresponds to the Moore etal. (2006) model, where sudden reionisation is assumedto have a strong effect on dwarf halos. The LBA scenariocorresponds to allowing star formation only above a rel-atively high, constant critical size, a scenario of perma-nently inefficient galaxy formation in all smaller systems,independently of time-dependent changes in the environ-ment like reionisation. The Kravtsov et al. (2004) modelwould yield a selection that is intermediate between theLBA and EF samples.
Six out of ten objects turn out to be the same in bothsamples. Because of the evolution of Vmax(z) during thegrowth of halos at high redshift, it is often the case thatthe ones reaching the largest sizes before accretion arealso the ones that have the largest Vmax(z ≃ 10). Toavoid redundancy we plot the time evolution only forthe EF sample, but show the z = 0 properties of theLBA sample for comparison (Figures 12 and 13). Thesubhalo histories are obviously very diverse. These ha-los have completed between zero and ten pericenter pas-
12 The time-scale used in Zentner et al. (2005) is shorter:Torbit/3.5. A factor of 2π is missing in their Eq. 8 (A. Zentner,private communication)
Diemand, Kuhlen, & Madau 13
a = 1/(z+1)0.1 0.2 0.3 0.4 0.5 0.6 0.7 0.8 0.9 1
r [k
pc]
10
210
a = 1/(z+1)0.1 0.2 0.3 0.4 0.5 0.6 0.7 0.8 0.9 1
]M
[M
610
710
810
910
1010
1110
a = 1/(z+1)0.1 0.2 0.3 0.4 0.5 0.6 0.7 0.8 0.9 1
[km
/s]
max
V
3
10
20
210
a = 1/(z+1)0.1 0.2 0.3 0.4 0.5 0.6 0.7 0.8 0.9 1
Vc
410
510
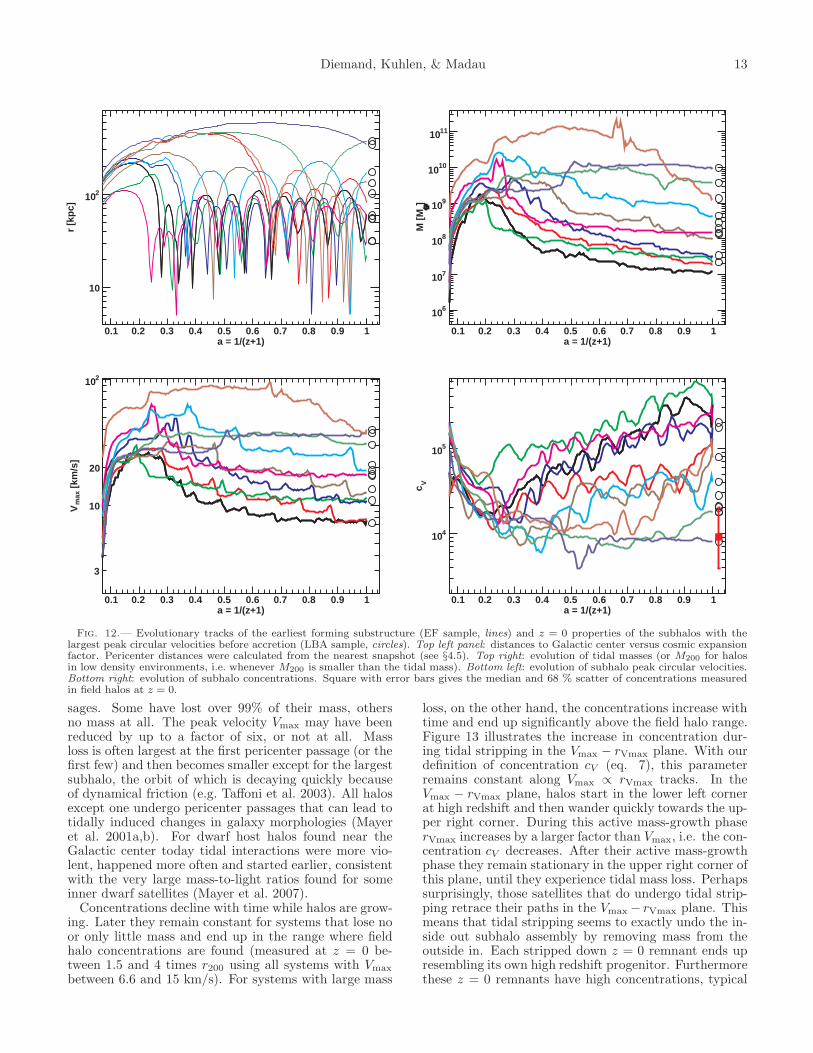
Fig. 12.— Evolutionary tracks of the earliest forming substructure (EF sample, lines) and z = 0 properties of the subhalos with thelargest peak circular velocities before accretion (LBA sample, circles). Top left panel: distances to Galactic center versus cosmic expansionfactor. Pericenter distances were calculated from the nearest snapshot (see §4.5). Top right: evolution of tidal masses (or M200 for halosin low density environments, i.e. whenever M200 is smaller than the tidal mass). Bottom left: evolution of subhalo peak circular velocities.Bottom right: evolution of subhalo concentrations. Square with error bars gives the median and 68 % scatter of concentrations measuredin field halos at z = 0.
sages. Some have lost over 99% of their mass, othersno mass at all. The peak velocity Vmax may have beenreduced by up to a factor of six, or not at all. Massloss is often largest at the first pericenter passage (or thefirst few) and then becomes smaller except for the largestsubhalo, the orbit of which is decaying quickly becauseof dynamical friction (e.g. Taffoni et al. 2003). All halosexcept one undergo pericenter passages that can lead totidally induced changes in galaxy morphologies (Mayeret al. 2001a,b). For dwarf host halos found near theGalactic center today tidal interactions were more vio-lent, happened more often and started earlier, consistentwith the very large mass-to-light ratios found for someinner dwarf satellites (Mayer et al. 2007).
Concentrations decline with time while halos are grow-ing. Later they remain constant for systems that lose noor only little mass and end up in the range where fieldhalo concentrations are found (measured at z = 0 be-tween 1.5 and 4 times r200 using all systems with Vmax
between 6.6 and 15 km/s). For systems with large mass
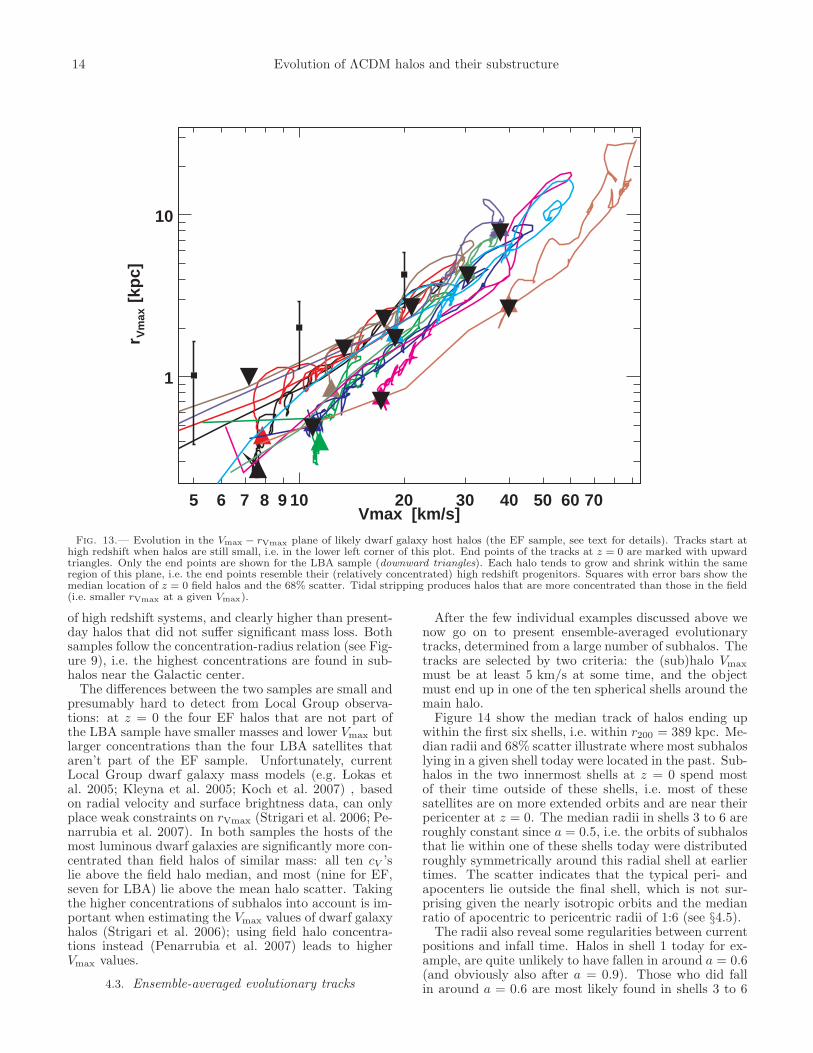
loss, on the other hand, the concentrations increase withtime and end up significantly above the field halo range.Figure 13 illustrates the increase in concentration dur-ing tidal stripping in the Vmax − rVmax plane. With ourdefinition of concentration cV (eq. 7), this parameterremains constant along Vmax ∝ rVmax tracks. In theVmax − rVmax plane, halos start in the lower left cornerat high redshift and then wander quickly towards the up-per right corner. During this active mass-growth phaserVmax increases by a larger factor than Vmax, i.e. the con-centration cV decreases. After their active mass-growthphase they remain stationary in the upper right corner ofthis plane, until they experience tidal mass loss. Perhapssurprisingly, those satellites that do undergo tidal strip-ping retrace their paths in the Vmax − rVmax plane. Thismeans that tidal stripping seems to exactly undo the in-side out subhalo assembly by removing mass from theoutside in. Each stripped down z = 0 remnant ends upresembling its own high redshift progenitor. Furthermorethese z = 0 remnants have high concentrations, typical
14 Evolution of ΛCDM halos and their substructure
Vmax [km/s]5 6 7 8 9 10 20 30 40 50 60 70
[kp
c]V
max
r
1
10
Fig. 13.— Evolution in the Vmax − rVmax plane of likely dwarf galaxy host halos (the EF sample, see text for details). Tracks start athigh redshift when halos are still small, i.e. in the lower left corner of this plot. End points of the tracks at z = 0 are marked with upwardtriangles. Only the end points are shown for the LBA sample (downward triangles). Each halo tends to grow and shrink within the sameregion of this plane, i.e. the end points resemble their (relatively concentrated) high redshift progenitors. Squares with error bars show themedian location of z = 0 field halos and the 68% scatter. Tidal stripping produces halos that are more concentrated than those in the field(i.e. smaller rVmax at a given Vmax).
of high redshift systems, and clearly higher than present-day halos that did not suffer significant mass loss. Bothsamples follow the concentration-radius relation (see Fig-ure 9), i.e. the highest concentrations are found in sub-halos near the Galactic center.
The differences between the two samples are small andpresumably hard to detect from Local Group observa-tions: at z = 0 the four EF halos that are not part ofthe LBA sample have smaller masses and lower Vmax butlarger concentrations than the four LBA satellites thataren’t part of the EF sample. Unfortunately, currentLocal Group dwarf galaxy mass models (e.g. Lokas etal. 2005; Kleyna et al. 2005; Koch et al. 2007) , basedon radial velocity and surface brightness data, can onlyplace weak constraints on rVmax (Strigari et al. 2006; Pe-narrubia et al. 2007). In both samples the hosts of themost luminous dwarf galaxies are significantly more con-centrated than field halos of similar mass: all ten cV ’slie above the field halo median, and most (nine for EF,seven for LBA) lie above the mean halo scatter. Takingthe higher concentrations of subhalos into account is im-portant when estimating the Vmax values of dwarf galaxyhalos (Strigari et al. 2006); using field halo concentra-tions instead (Penarrubia et al. 2007) leads to higherVmax values.
4.3. Ensemble-averaged evolutionary tracks
After the few individual examples discussed above wenow go on to present ensemble-averaged evolutionarytracks, determined from a large number of subhalos. Thetracks are selected by two criteria: the (sub)halo Vmax
must be at least 5 km/s at some time, and the objectmust end up in one of the ten spherical shells around themain halo.
Figure 14 show the median track of halos ending upwithin the first six shells, i.e. within r200 = 389 kpc. Me-dian radii and 68% scatter illustrate where most subhaloslying in a given shell today were located in the past. Sub-halos in the two innermost shells at z = 0 spend mostof their time outside of these shells, i.e. most of thesesatellites are on more extended orbits and are near theirpericenter at z = 0. The median radii in shells 3 to 6 areroughly constant since a = 0.5, i.e. the orbits of subhalosthat lie within one of these shells today were distributedroughly symmetrically around this radial shell at earliertimes. The scatter indicates that the typical peri- andapocenters lie outside the final shell, which is not sur-prising given the nearly isotropic orbits and the medianratio of apocentric to pericentric radii of 1:6 (see §4.5).
The radii also reveal some regularities between currentpositions and infall time. Halos in shell 1 today for ex-ample, are quite unlikely to have fallen in around a = 0.6(and obviously also after a = 0.9). Those who did fallin around a = 0.6 are most likely found in shells 3 to 6
Diemand, Kuhlen, & Madau 15
r [k
pc]
100
200
300
400
500
600
r [k
pc]
100
200
300
400
500
600
r [k
pc]
100
200
300
400
500
600
r [k
pc]
100
200
300
400
500
600
r [k
pc]
100
200
300
400
500
600
0.1 0.2 0.3 0.4 0.5 0.6 0.7 0.8 0.9 1
r [k
pc]
100200300400500600
a=1/(1+z)
10.0
0.1fM
M(a)
10.0
0.1fM
M(a)
10.0
0.1fM
M(a)
10.0
0.1fM
M(a)
10.0
0.1fM
M(a)
0.1 0.2 0.3 0.4 0.5 0.6 0.7 0.8 0.9 1
10.0
0.1a=1/(1+z)fM
M(a)
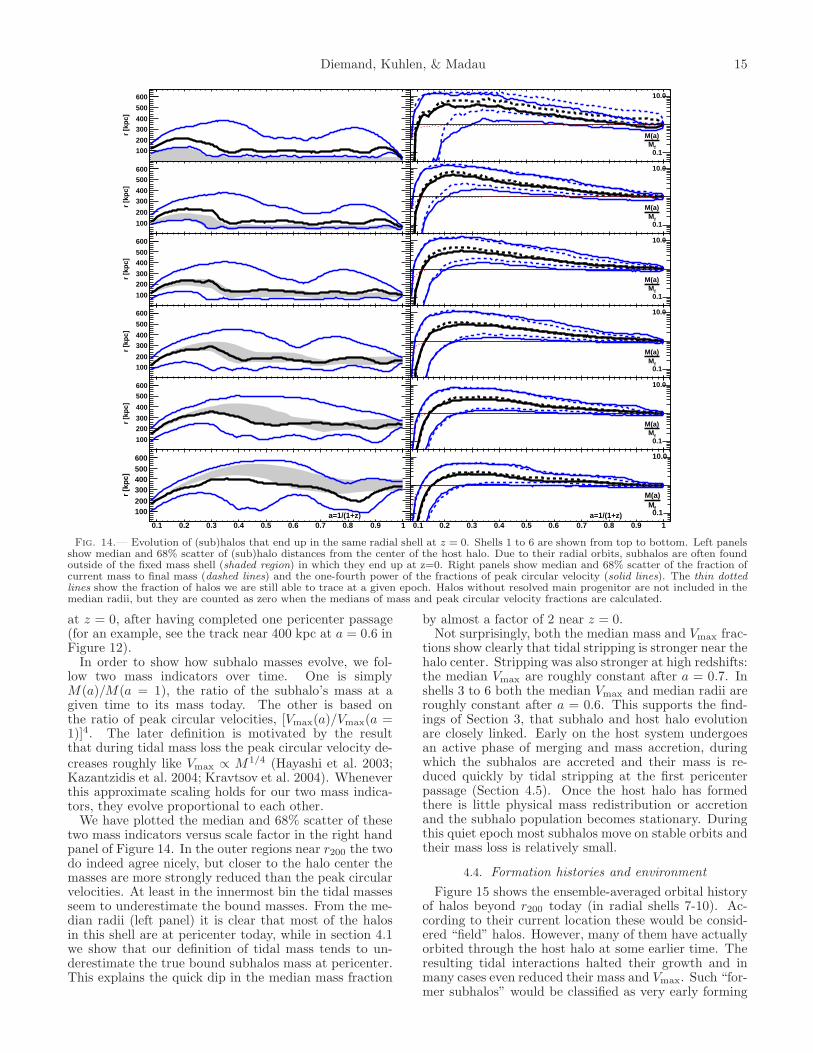
Fig. 14.— Evolution of (sub)halos that end up in the same radial shell at z = 0. Shells 1 to 6 are shown from top to bottom. Left panelsshow median and 68% scatter of (sub)halo distances from the center of the host halo. Due to their radial orbits, subhalos are often foundoutside of the fixed mass shell (shaded region) in which they end up at z=0. Right panels show median and 68% scatter of the fraction ofcurrent mass to final mass (dashed lines) and the one-fourth power of the fractions of peak circular velocity (solid lines). The thin dottedlines show the fraction of halos we are still able to trace at a given epoch. Halos without resolved main progenitor are not included in themedian radii, but they are counted as zero when the medians of mass and peak circular velocity fractions are calculated.
at z = 0, after having completed one pericenter passage(for an example, see the track near 400 kpc at a = 0.6 inFigure 12).
In order to show how subhalo masses evolve, we fol-low two mass indicators over time. One is simplyM(a)/M(a = 1), the ratio of the subhalo’s mass at agiven time to its mass today. The other is based onthe ratio of peak circular velocities, [Vmax(a)/Vmax(a =1)]4. The later definition is motivated by the resultthat during tidal mass loss the peak circular velocity de-creases roughly like Vmax ∝ M1/4 (Hayashi et al. 2003;Kazantzidis et al. 2004; Kravtsov et al. 2004). Wheneverthis approximate scaling holds for our two mass indica-tors, they evolve proportional to each other.
We have plotted the median and 68% scatter of thesetwo mass indicators versus scale factor in the right handpanel of Figure 14. In the outer regions near r200 the twodo indeed agree nicely, but closer to the halo center themasses are more strongly reduced than the peak circularvelocities. At least in the innermost bin the tidal massesseem to underestimate the bound masses. From the me-dian radii (left panel) it is clear that most of the halosin this shell are at pericenter today, while in section 4.1we show that our definition of tidal mass tends to un-derestimate the true bound subhalos mass at pericenter.This explains the quick dip in the median mass fraction
by almost a factor of 2 near z = 0.Not surprisingly, both the median mass and Vmax frac-
tions show clearly that tidal stripping is stronger near thehalo center. Stripping was also stronger at high redshifts:the median Vmax are roughly constant after a = 0.7. Inshells 3 to 6 both the median Vmax and median radii areroughly constant after a = 0.6. This supports the find-ings of Section 3, that subhalo and host halo evolutionare closely linked. Early on the host system undergoesan active phase of merging and mass accretion, duringwhich the subhalos are accreted and their mass is re-duced quickly by tidal stripping at the first pericenterpassage (Section 4.5). Once the host halo has formedthere is little physical mass redistribution or accretionand the subhalo population becomes stationary. Duringthis quiet epoch most subhalos move on stable orbits andtheir mass loss is relatively small.
4.4. Formation histories and environment
Figure 15 shows the ensemble-averaged orbital historyof halos beyond r200 today (in radial shells 7-10). Ac-cording to their current location these would be consid-ered “field” halos. However, many of them have actuallyorbited through the host halo at some earlier time. Theresulting tidal interactions halted their growth and inmany cases even reduced their mass and Vmax. Such “for-mer subhalos” would be classified as very early forming
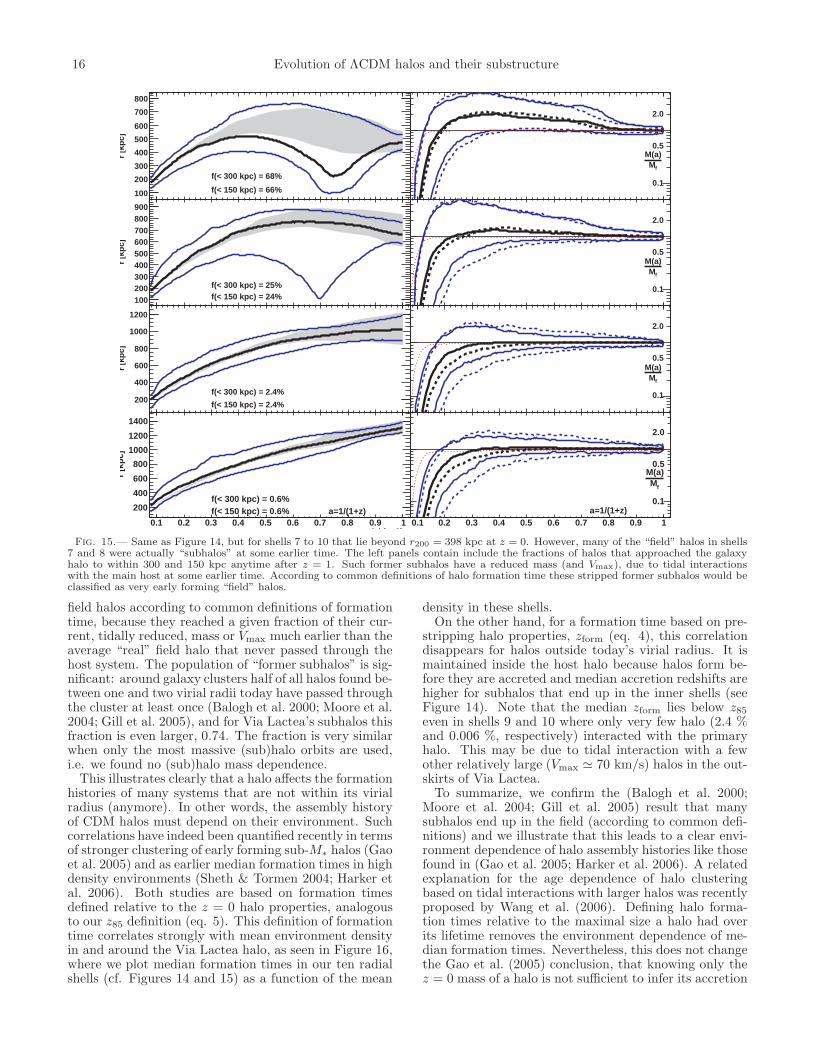
16 Evolution of ΛCDM halos and their substructure
0.1 0.2 0.3 0.4 0.5 0.6 0.7 0.8 0.9 1
r [k
pc]
100
200
300
400
500
600
700
800
f(< 300 kpc) = 68%
f(< 150 kpc) = 66%
0.1 0.2 0.3 0.4 0.5 0.6 0.7 0.8 0.9 1
r [k
pc]
100200300400500600700800900
f(< 300 kpc) = 25%f(< 150 kpc) = 24%
0.1 0.2 0.3 0.4 0.5 0.6 0.7 0.8 0.9 1
r [k
pc]
200
400
600
800
1000
1200
f(< 300 kpc) = 2.4%
f(< 150 kpc) = 2.4%
a = 1 / (z+1) 0.1 0.2 0.3 0.4 0.5 0.6 0.7 0.8 0.9 1
r [k
pc]
200
400
600
800
1000
1200
1400
f(< 300 kpc) = 0.6%f(< 150 kpc) = 0.6% a=1/(1+z)
0.1 0.2 0.3 0.4 0.5 0.6 0.7 0.8 0.9 1
-1
1
2.0
0.5
0.1
fMM(a)
0.1 0.2 0.3 0.4 0.5 0.6 0.7 0.8 0.9 1
-1
1
2.0
0.5
0.1
fMM(a)
0.1 0.2 0.3 0.4 0.5 0.6 0.7 0.8 0.9 1
-1
1
2.0
0.5
0.1
fMM(a)
0.1 0.2 0.3 0.4 0.5 0.6 0.7 0.8 0.9 1
-1
1
2.0
0.5
0.1a=1/(1+z)
fMM(a)
Fig. 15.— Same as Figure 14, but for shells 7 to 10 that lie beyond r200 = 398 kpc at z = 0. However, many of the “field” halos in shells7 and 8 were actually “subhalos” at some earlier time. The left panels contain include the fractions of halos that approached the galaxyhalo to within 300 and 150 kpc anytime after z = 1. Such former subhalos have a reduced mass (and Vmax), due to tidal interactionswith the main host at some earlier time. According to common definitions of halo formation time these stripped former subhalos would beclassified as very early forming “field” halos.
field halos according to common definitions of formationtime, because they reached a given fraction of their cur-rent, tidally reduced, mass or Vmax much earlier than theaverage “real” field halo that never passed through thehost system. The population of “former subhalos” is sig-nificant: around galaxy clusters half of all halos found be-tween one and two virial radii today have passed throughthe cluster at least once (Balogh et al. 2000; Moore et al.2004; Gill et al. 2005), and for Via Lactea’s subhalos thisfraction is even larger, 0.74. The fraction is very similarwhen only the most massive (sub)halo orbits are used,i.e. we found no (sub)halo mass dependence.
This illustrates clearly that a halo affects the formationhistories of many systems that are not within its virialradius (anymore). In other words, the assembly historyof CDM halos must depend on their environment. Suchcorrelations have indeed been quantified recently in termsof stronger clustering of early forming sub-M∗ halos (Gaoet al. 2005) and as earlier median formation times in highdensity environments (Sheth & Tormen 2004; Harker etal. 2006). Both studies are based on formation timesdefined relative to the z = 0 halo properties, analogousto our z85 definition (eq. 5). This definition of formationtime correlates strongly with mean environment densityin and around the Via Lactea halo, as seen in Figure 16,where we plot median formation times in our ten radialshells (cf. Figures 14 and 15) as a function of the mean
density in these shells.On the other hand, for a formation time based on pre-
stripping halo properties, zform (eq. 4), this correlationdisappears for halos outside today’s virial radius. It ismaintained inside the host halo because halos form be-fore they are accreted and median accretion redshifts arehigher for subhalos that end up in the inner shells (seeFigure 14). Note that the median zform lies below z85
even in shells 9 and 10 where only very few halo (2.4 %and 0.006 %, respectively) interacted with the primaryhalo. This may be due to tidal interaction with a fewother relatively large (Vmax ≃ 70 km/s) halos in the out-skirts of Via Lactea.
To summarize, we confirm the (Balogh et al. 2000;Moore et al. 2004; Gill et al. 2005) result that manysubhalos end up in the field (according to common defi-nitions) and we illustrate that this leads to a clear envi-ronment dependence of halo assembly histories like thosefound in (Gao et al. 2005; Harker et al. 2006). A relatedexplanation for the age dependence of halo clusteringbased on tidal interactions with larger halos was recentlyproposed by Wang et al. (2006). Defining halo forma-tion times relative to the maximal size a halo had overits lifetime removes the environment dependence of me-dian formation times. Nevertheless, this does not changethe Gao et al. (2005) conclusion, that knowing only thez = 0 mass of a halo is not sufficient to infer its accretion
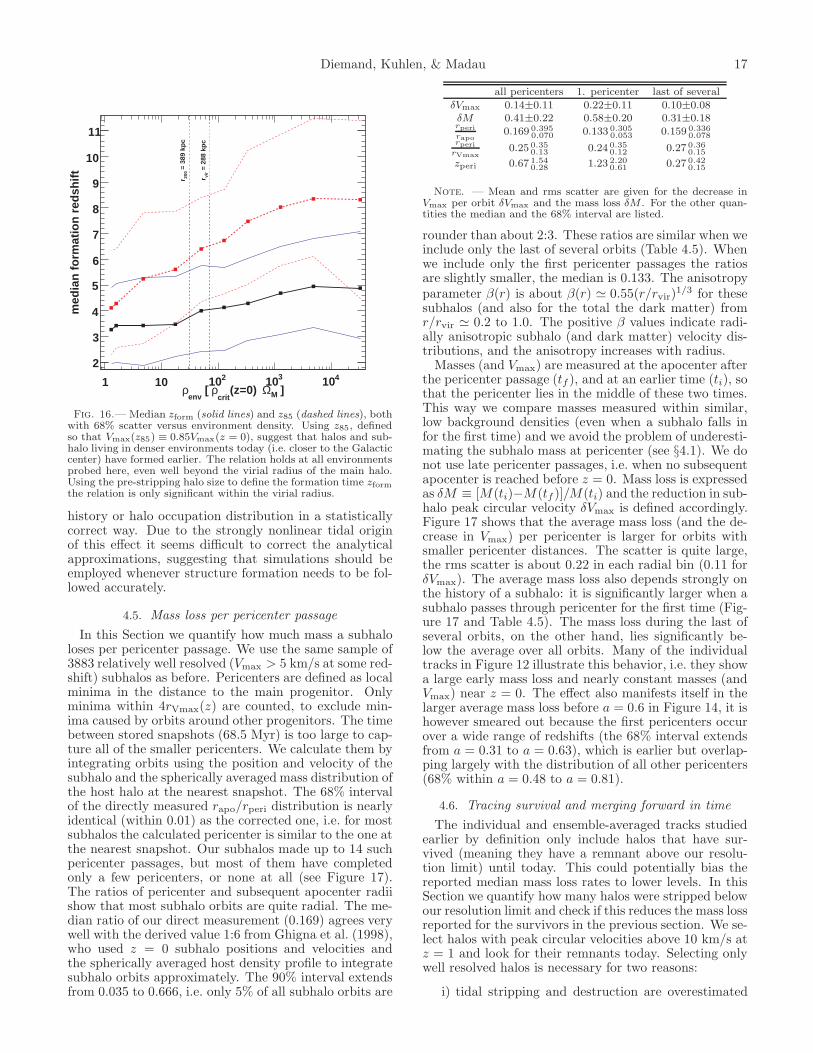
Diemand, Kuhlen, & Madau 17
]MΩ(z=0) crit
ρ [ env
ρ1 10 210 310 410
med
ian
fo
rmat
ion
red
shif
t
2
3
4
5
6
7
8
9
10
11
= 2
88 k
pc
vir
r
= 3
89 k
pc
200
r
Fig. 16.— Median zform (solid lines) and z85 (dashed lines), bothwith 68% scatter versus environment density. Using z85, definedso that Vmax(z85) ≡ 0.85Vmax(z = 0), suggest that halos and sub-halo living in denser environments today (i.e. closer to the Galacticcenter) have formed earlier. The relation holds at all environmentsprobed here, even well beyond the virial radius of the main halo.Using the pre-stripping halo size to define the formation time zform
the relation is only significant within the virial radius.
history or halo occupation distribution in a statisticallycorrect way. Due to the strongly nonlinear tidal originof this effect it seems difficult to correct the analyticalapproximations, suggesting that simulations should beemployed whenever structure formation needs to be fol-lowed accurately.
4.5. Mass loss per pericenter passage
In this Section we quantify how much mass a subhaloloses per pericenter passage. We use the same sample of3883 relatively well resolved (Vmax > 5 km/s at some red-shift) subhalos as before. Pericenters are defined as localminima in the distance to the main progenitor. Onlyminima within 4rVmax(z) are counted, to exclude min-ima caused by orbits around other progenitors. The timebetween stored snapshots (68.5 Myr) is too large to cap-ture all of the smaller pericenters. We calculate them byintegrating orbits using the position and velocity of thesubhalo and the spherically averaged mass distribution ofthe host halo at the nearest snapshot. The 68% intervalof the directly measured rapo/rperi distribution is nearlyidentical (within 0.01) as the corrected one, i.e. for mostsubhalos the calculated pericenter is similar to the one atthe nearest snapshot. Our subhalos made up to 14 suchpericenter passages, but most of them have completedonly a few pericenters, or none at all (see Figure 17).The ratios of pericenter and subsequent apocenter radiishow that most subhalo orbits are quite radial. The me-dian ratio of our direct measurement (0.169) agrees verywell with the derived value 1:6 from Ghigna et al. (1998),who used z = 0 subhalo positions and velocities andthe spherically averaged host density profile to integratesubhalo orbits approximately. The 90% interval extendsfrom 0.035 to 0.666, i.e. only 5% of all subhalo orbits are
all pericenters 1. pericenter last of several
δVmax 0.14±0.11 0.22±0.11 0.10±0.08δM 0.41±0.22 0.58±0.20 0.31±0.18rperi
rapo0.169 0.395
0.070 0.133 0.3050.053 0.159 0.336
0.078rperi
rVmax0.25 0.35
0.13 0.24 0.350.12 0.27 0.36
0.15
zperi 0.67 1.540.28 1.23 2.20
0.61 0.27 0.420.15
Note. — Mean and rms scatter are given for the decrease inVmax per orbit δVmax and the mass loss δM . For the other quan-tities the median and the 68% interval are listed.
rounder than about 2:3. These ratios are similar when weinclude only the last of several orbits (Table 4.5). Whenwe include only the first pericenter passages the ratiosare slightly smaller, the median is 0.133. The anisotropyparameter β(r) is about β(r) ≃ 0.55(r/rvir)
1/3 for thesesubhalos (and also for the total the dark matter) fromr/rvir ≃ 0.2 to 1.0. The positive β values indicate radi-ally anisotropic subhalo (and dark matter) velocity dis-tributions, and the anisotropy increases with radius.
Masses (and Vmax) are measured at the apocenter afterthe pericenter passage (tf ), and at an earlier time (ti), sothat the pericenter lies in the middle of these two times.This way we compare masses measured within similar,low background densities (even when a subhalo falls infor the first time) and we avoid the problem of underesti-mating the subhalo mass at pericenter (see §4.1). We donot use late pericenter passages, i.e. when no subsequentapocenter is reached before z = 0. Mass loss is expressedas δM ≡ [M(ti)−M(tf )]/M(ti) and the reduction in sub-halo peak circular velocity δVmax is defined accordingly.Figure 17 shows that the average mass loss (and the de-crease in Vmax) per pericenter is larger for orbits withsmaller pericenter distances. The scatter is quite large,the rms scatter is about 0.22 in each radial bin (0.11 forδVmax). The average mass loss also depends strongly onthe history of a subhalo: it is significantly larger when asubhalo passes through pericenter for the first time (Fig-ure 17 and Table 4.5). The mass loss during the last ofseveral orbits, on the other hand, lies significantly be-low the average over all orbits. Many of the individualtracks in Figure 12 illustrate this behavior, i.e. they showa large early mass loss and nearly constant masses (andVmax) near z = 0. The effect also manifests itself in thelarger average mass loss before a = 0.6 in Figure 14, it ishowever smeared out because the first pericenters occurover a wide range of redshifts (the 68% interval extendsfrom a = 0.31 to a = 0.63), which is earlier but overlap-ping largely with the distribution of all other pericenters(68% within a = 0.48 to a = 0.81).
4.6. Tracing survival and merging forward in time
The individual and ensemble-averaged tracks studiedearlier by definition only include halos that have sur-vived (meaning they have a remnant above our resolu-tion limit) until today. This could potentially bias thereported median mass loss rates to lower levels. In thisSection we quantify how many halos were stripped belowour resolution limit and check if this reduces the mass lossreported for the survivors in the previous section. We se-lect halos with peak circular velocities above 10 km/s atz = 1 and look for their remnants today. Selecting onlywell resolved halos is necessary for two reasons:
i) tidal stripping and destruction are overestimated
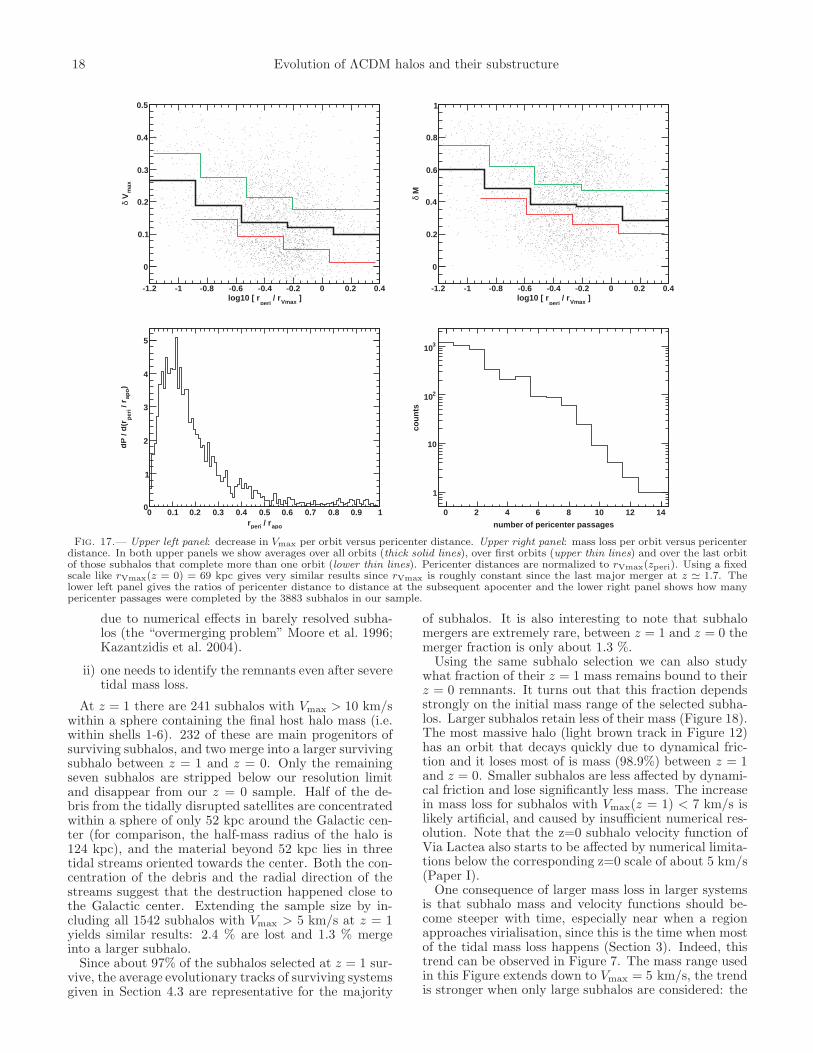
18 Evolution of ΛCDM halos and their substructure
]Vmax / rperi
log10 [ r-1.2 -1 -0.8 -0.6 -0.4 -0.2 0 0.2 0.4
max
Vδ
0
0.1
0.2
0.3
0.4
0.5
]Vmax / rperi
log10 [ r-1.2 -1 -0.8 -0.6 -0.4 -0.2 0 0.2 0.4
Mδ
0
0.2
0.4
0.6
0.8
1
apo / rperir0 0.1 0.2 0.3 0.4 0.5 0.6 0.7 0.8 0.9 1
)ap
o /
rp
eri
dP
/ d
(r
0
1
2
3
4
5
number of pericenter passages
0 2 4 6 8 10 12 14
cou
nts
1
10
210
310
Fig. 17.— Upper left panel: decrease in Vmax per orbit versus pericenter distance. Upper right panel: mass loss per orbit versus pericenterdistance. In both upper panels we show averages over all orbits (thick solid lines), over first orbits (upper thin lines) and over the last orbitof those subhalos that complete more than one orbit (lower thin lines). Pericenter distances are normalized to rVmax(zperi). Using a fixedscale like rVmax(z = 0) = 69 kpc gives very similar results since rVmax is roughly constant since the last major merger at z ≃ 1.7. Thelower left panel gives the ratios of pericenter distance to distance at the subsequent apocenter and the lower right panel shows how manypericenter passages were completed by the 3883 subhalos in our sample.
due to numerical effects in barely resolved subha-los (the “overmerging problem” Moore et al. 1996;Kazantzidis et al. 2004).
ii) one needs to identify the remnants even after severetidal mass loss.
At z = 1 there are 241 subhalos with Vmax > 10 km/swithin a sphere containing the final host halo mass (i.e.within shells 1-6). 232 of these are main progenitors ofsurviving subhalos, and two merge into a larger survivingsubhalo between z = 1 and z = 0. Only the remainingseven subhalos are stripped below our resolution limitand disappear from our z = 0 sample. Half of the de-bris from the tidally disrupted satellites are concentratedwithin a sphere of only 52 kpc around the Galactic cen-ter (for comparison, the half-mass radius of the halo is124 kpc), and the material beyond 52 kpc lies in threetidal streams oriented towards the center. Both the con-centration of the debris and the radial direction of thestreams suggest that the destruction happened close tothe Galactic center. Extending the sample size by in-cluding all 1542 subhalos with Vmax > 5 km/s at z = 1yields similar results: 2.4 % are lost and 1.3 % mergeinto a larger subhalo.
Since about 97% of the subhalos selected at z = 1 sur-vive, the average evolutionary tracks of surviving systemsgiven in Section 4.3 are representative for the majority
of subhalos. It is also interesting to note that subhalomergers are extremely rare, between z = 1 and z = 0 themerger fraction is only about 1.3 %.
Using the same subhalo selection we can also studywhat fraction of their z = 1 mass remains bound to theirz = 0 remnants. It turns out that this fraction dependsstrongly on the initial mass range of the selected subha-los. Larger subhalos retain less of their mass (Figure 18).The most massive halo (light brown track in Figure 12)has an orbit that decays quickly due to dynamical fric-tion and it loses most of is mass (98.9%) between z = 1and z = 0. Smaller subhalos are less affected by dynami-cal friction and lose significantly less mass. The increasein mass loss for subhalos with Vmax(z = 1) < 7 km/s islikely artificial, and caused by insufficient numerical res-olution. Note that the z=0 subhalo velocity function ofVia Lactea also starts to be affected by numerical limita-tions below the corresponding z=0 scale of about 5 km/s(Paper I).
One consequence of larger mass loss in larger systemsis that subhalo mass and velocity functions should be-come steeper with time, especially near when a regionapproaches virialisation, since this is the time when mostof the tidal mass loss happens (Section 3). Indeed, thistrend can be observed in Figure 7. The mass range usedin this Figure extends down to Vmax = 5 km/s, the trendis stronger when only large subhalos are considered: the
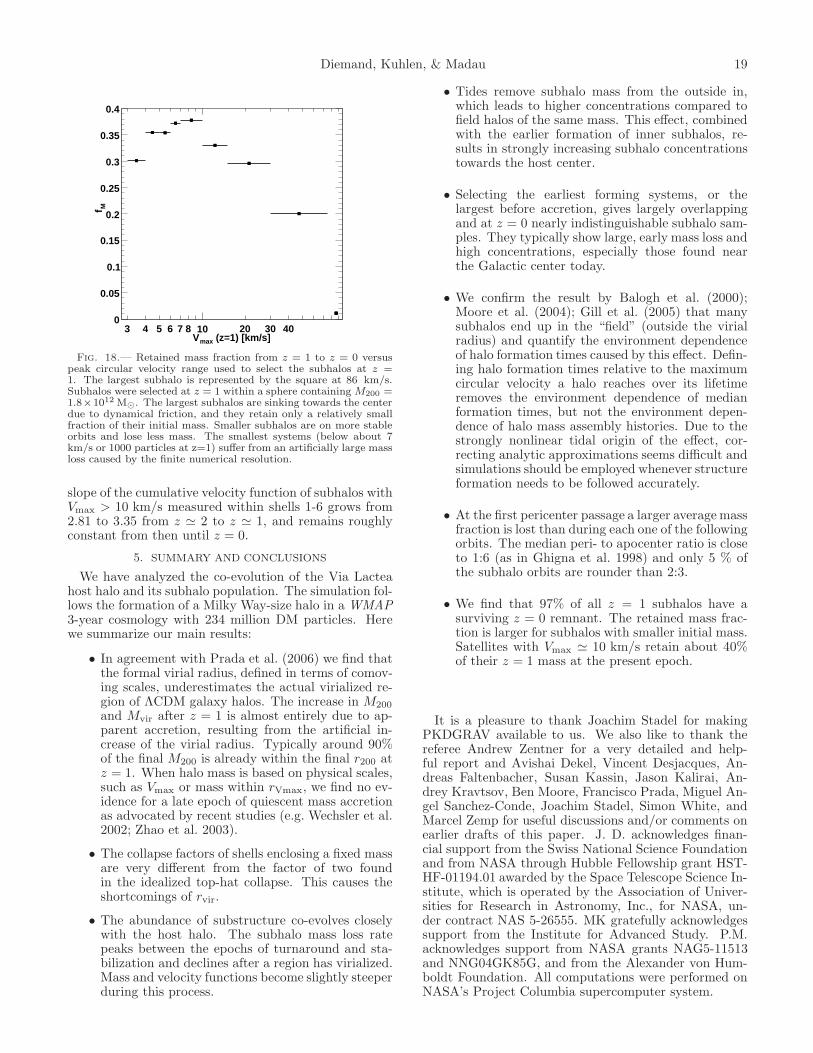
Diemand, Kuhlen, & Madau 19
(z=1) [km/s]maxV3 4 5 6 7 8 10 20 30 40
M
f
0
0.05
0.1
0.15
0.2
0.25
0.3
0.35
0.4
Fig. 18.— Retained mass fraction from z = 1 to z = 0 versuspeak circular velocity range used to select the subhalos at z =1. The largest subhalo is represented by the square at 86 km/s.Subhalos were selected at z = 1 within a sphere containing M200 =1.8×10¹² M⊙. The largest subhalos are sinking towards the centerdue to dynamical friction, and they retain only a relatively smallfraction of their initial mass. Smaller subhalos are on more stableorbits and lose less mass. The smallest systems (below about 7km/s or 1000 particles at z=1) suffer from an artificially large massloss caused by the finite numerical resolution.
slope of the cumulative velocity function of subhalos withVmax > 10 km/s measured within shells 1-6 grows from2.81 to 3.35 from z ≃ 2 to z ≃ 1, and remains roughlyconstant from then until z = 0.
5. SUMMARY AND CONCLUSIONS
We have analyzed the co-evolution of the Via Lacteahost halo and its subhalo population. The simulation fol-lows the formation of a Milky Way-size halo in a WMAP3-year cosmology with 234 million DM particles. Herewe summarize our main results:
• In agreement with Prada et al. (2006) we find thatthe formal virial radius, defined in terms of comov-ing scales, underestimates the actual virialized re-gion of ΛCDM galaxy halos. The increase in M200
and Mvir after z = 1 is almost entirely due to ap-parent accretion, resulting from the artificial in-crease of the virial radius. Typically around 90%of the final M200 is already within the final r200 atz = 1. When halo mass is based on physical scales,such as Vmax or mass within rVmax, we find no ev-idence for a late epoch of quiescent mass accretionas advocated by recent studies (e.g. Wechsler et al.2002; Zhao et al. 2003).
• The collapse factors of shells enclosing a fixed massare very different from the factor of two foundin the idealized top-hat collapse. This causes theshortcomings of rvir.
• The abundance of substructure co-evolves closelywith the host halo. The subhalo mass loss ratepeaks between the epochs of turnaround and sta-bilization and declines after a region has virialized.Mass and velocity functions become slightly steeperduring this process.
• Tides remove subhalo mass from the outside in,which leads to higher concentrations compared tofield halos of the same mass. This effect, combinedwith the earlier formation of inner subhalos, re-sults in strongly increasing subhalo concentrationstowards the host center.
• Selecting the earliest forming systems, or thelargest before accretion, gives largely overlappingand at z = 0 nearly indistinguishable subhalo sam-ples. They typically show large, early mass loss andhigh concentrations, especially those found nearthe Galactic center today.
• We confirm the result by Balogh et al. (2000);Moore et al. (2004); Gill et al. (2005) that manysubhalos end up in the “field” (outside the virialradius) and quantify the environment dependenceof halo formation times caused by this effect. Defin-ing halo formation times relative to the maximumcircular velocity a halo reaches over its lifetimeremoves the environment dependence of medianformation times, but not the environment depen-dence of halo mass assembly histories. Due to thestrongly nonlinear tidal origin of the effect, cor-recting analytic approximations seems difficult andsimulations should be employed whenever structureformation needs to be followed accurately.
• At the first pericenter passage a larger average massfraction is lost than during each one of the followingorbits. The median peri- to apocenter ratio is closeto 1:6 (as in Ghigna et al. 1998) and only 5 % ofthe subhalo orbits are rounder than 2:3.
• We find that 97% of all z = 1 subhalos have asurviving z = 0 remnant. The retained mass frac-tion is larger for subhalos with smaller initial mass.Satellites with Vmax ≃ 10 km/s retain about 40%of their z = 1 mass at the present epoch.
It is a pleasure to thank Joachim Stadel for makingPKDGRAV available to us. We also like to thank thereferee Andrew Zentner for a very detailed and help-ful report and Avishai Dekel, Vincent Desjacques, An-dreas Faltenbacher, Susan Kassin, Jason Kalirai, An-drey Kravtsov, Ben Moore, Francisco Prada, Miguel An-gel Sanchez-Conde, Joachim Stadel, Simon White, andMarcel Zemp for useful discussions and/or comments onearlier drafts of this paper. J. D. acknowledges finan-cial support from the Swiss National Science Foundationand from NASA through Hubble Fellowship grant HST-HF-01194.01 awarded by the Space Telescope Science In-stitute, which is operated by the Association of Univer-sities for Research in Astronomy, Inc., for NASA, un-der contract NAS 5-26555. MK gratefully acknowledgessupport from the Institute for Advanced Study. P.M.acknowledges support from NASA grants NAG5-11513and NNG04GK85G, and from the Alexander von Hum-boldt Foundation. All computations were performed onNASA’s Project Columbia supercomputer system.
20 Evolution of ΛCDM halos and their substructure
REFERENCES
Alam, S. M. K., Bullock, J. S., & Weinberg, D. H., 2002, ApJ, 572,34
Balogh, M. L., Navarro, J. F., & Morris, S. L. 2000, ApJ, 540, 113Bertschinger, E. 2001, ApJSS, 137, 1Bryan, G. L., & Norman, M. L. 1998, ApJ, 495, 80Bullock, J. S., et al. 2001, MNRAS, 321, 559Bullock, J. S., Kravtsov, A. V., & Weinberg, D. H. 2000, ApJ, 539,
517Cole S., Kaiser N., 1989, MNRAS, 237, 1127Harker, G., Cole, S., Helly, J., Frenk, C., & Jenkins, A. 2006,
MNRAS, 367, 1039Hayashi, E., Navarro, J. F., Taylor, J. E., Stadel, J., & Quinn, T.
2003, ApJ, 584, 541Dekel, A., Devor, J., & Hetzroni, G. 2003, MNRAS, 341, 326Diemand, J., Moore, B., & Stadel, J. 2004, MNRAS, 352, 535Diemand, J., Madau, P., & Moore, B. 2005, MNRAS, 364, 367Diemand, J., Kuhlen, M., & Madau, P. 2006, ApJ, 649, 1Diemand, J., Kuhlen, M., & Madau, P. 2007, ApJ, 657, 262 (Paper
I)Faltenbacher, A., Gottloeber, S., & Mathews, W. G. 2006, preprint
(astro-ph/0609615)Fukushige, T., Kawai, A., & Makino, J. 2004, ApJ, 606, 625Gao, L., Springel, V., & White, S. D. M. 2005, MNRAS, 363, L66Gao, L., White, S. D. M., Jenkins, A., Stoehr, F., & Springel, V.
2004, MNRAS, 355, 819Ghigna, S., Moore, B., Governato, F., Lake, G., Quinn, T., &
Stadel, J. 1998, MNRAS, 300, 146Ghigna, S., Moore, B., Governato, F., Lake, G., Quinn, T., &
Stadel, J. 2000, ApJ, 544, 616Gill, S. P. D., Knebe, A., & Gibson, B. K. 2005, MNRAS, 356,
1327Gnedin, O. Y., & Ostriker, J. P. 1997, ApJ, 474, 223Governato, F., Willman, B., Mayer, L., Brooks, A., Stinson, G.,
Valenzuela, O., Wadsley, J., & Quinn, T. 2007, MNRAS, 374,1479
Kassin, S., et al. 2007, ApJ, in press (astro-ph/0702643)Kazantzidis, S., Mayer, L., Mastropietro, C., Diemand, J., Stadel,
J.,& Moore B. 2004, ApJ, 608, 663Kleyna, J. T., Wilkinson, M. I., Evans, N. W., & Gilmore, G. 2005,
ApJ, 630, L141Klypin, A., Kravtsov, A. V., Valenzuela, O., & Prada, F. 1999,
ApJ, 522, 82Koch, A., Wilkinson, M. I., Kleyna, J. T., Gilmore, G. F., Grebel,
E. K., Mackey, A. D., Evans, N. W., & Wyse, R. F. G. 2007,ApJ, 657, 241
Kravtsov, A. V., Gnedin, O. Y., & Klypin, A. A. 2004, ApJ, 609,482
Kuhlen, M., Strigari, L. E., Zentner, A. R., Bullock, J. S., &Primack, J. R. 2005, MNRAS, 357, 387
Lokas, E. L., Mamon, G. A., & Prada, F. 2005, MNRAS, 363, 918Maccio, A. V., Murante, G., & Bonometto, S. P. 2003, ApJ, 588,
35Maccio’, A. V., Dutton, A. A., van den Bosch, F. C., Moore, B.,
Potter, D., & Stadel, J. 2006, preprint (astro-ph/0608157 )
Mayer, L., Governato, F., Colpi, M., Moore, B., Quinn, T.,Wadsley, J., Stadel, J., & Lake, G. 2001, ApJ, 547, L123
Mayer, L., Governato, F., Colpi, M., Moore, B., Quinn, T.,Wadsley, J., Stadel, J., & Lake, G. 2001, ApJ, 559, 754
Mayer, L., Kazantzidis, S., Mastropietro, C., & Wadsley, J. 2007,Nature, 445, 738-740
Moore, B., Diemand, J., Madau, P., Zemp, M., & Stadel, J. 2006,MNRAS, 368, 563
Moore, B., Diemand, J., & Stadel, J. 2004, IAU Colloq. 195:Outskirts of Galaxy Clusters: Intense Life in the Suburbs, 513
Moore, B., Calcaneo-Roldan, C., Stadel, J., Quinn, T., Lake, G.,Ghigna, S., & Governato, F. 2001, PRD, 64, 063508
Moore, B., Ghigna, S., Governato, F., Lake, G., Quinn, T., Stadel,J., & Tozzi, P. 1999, ApJ, 524, L19
Moore, B., Katz, N., & Lake, G. 1996, ApJ, 457, 455Navarro, J. F., Frenk, C. S., & White, S. D. M. 1997, ApJ, 490,
493Penarrubia, J., McConnachie, A., & Navarro, J. F. 2007, preprint
(astro-ph/0701780)
Prada, F., Klypin, A. A., Simonneau, E., Betancort-Rijo, J., Patiri,S., Gottlober, S., & Sanchez-Conde, M. A. 2006, ApJ, 645, 1001
Romano-Diaz, E., Faltenbacher, A., Jones, D., Heller, C., Hoffman,Y., & Shlosman, I. 2006, ApJ, 637, L93
Read, J. I., Wilkinson, M. I., Evans, N. W., Gilmore, G., & Kleyna,J. T. 2006, MNRAS, 366, 429
Reed, D., Governato, F., Quinn, T., Gardner, J., Stadel, J., & Lake,G. 2005, MNRAS, 359, 1537
Sanchez-Conde, M. A., Betancort-Rijo, J., & Prada, F. 2006,preprint (astro-ph/0609479)
Sheth, R. K., & Tormen, G. 1999, MNRAS, 308, 119Sheth, R. K., & Tormen, G. 2004, MNRAS, 350, 1385Spergel, D. N., et al. 2006, ApJ, submitted (astro-ph/0603449)Stadel, J. 2001, PhD thesis, U. WashingtonStrigari, L. E., Koushiappas, S. M., Bullock, J. S., & Kaplinghat,
M. 2006, preprint (astro-ph/0611925)Taffoni, G., Mayer, L., Colpi, M., & Governato, F. 2003, MNRAS,
341, 434Taylor, J. E., & Babul, A. 2001, ApJ, 559, 716van den Bosch, F. C., Tormen, G., & Giocoli, C. 2005, MNRAS,
359, 1029Wang, H. Y., Mo, H. J., & Jing, Y. P. 2006, preprint (astro-
ph/0608690)Wechsler, R. H., Bullock, J. S., Primack, J. R., Kravtsov, A. V., &
Dekel, A. 2002, ApJ, 568, 52Weiner, B. J., et al. 2006, ApJ, 653, 1027Zhao, D. H., Mo, H. J., Jing, Y. P., Borner, G. 2003, MNRAS, 339,
12Zentner, A. R., & Bullock, J. S. 2003, ApJ, 598, 49Zentner, A. R., Berlind, A. A., Bullock, J. S., Kravtsov, A. V., &
Wechsler, R. H. 2005, ApJ, 624, 505


![Τα Θεμελιώδη Θεωρήματα του Piero Sraffa και η ......And new philosophy calls all in doubt, […] ’Tis all in pieces, all coherence gone, All just supply,](https://static.fdocument.org/doc/165x107/5fd4dd5d839bba543d442528/-piero-sraffa-.jpg)